Hallmarks of Retroelement Expression in T-Cells Treated With HDAC Inhibitors
 Gislaine Curty
 Luis P. Iñiguez
 Douglas F. Nixon
 Marcelo A. Soares
 Miguel de Mulder Rougvie
- 1Oncovirology Program, Instituto Nacional de Cancer, Rio de Janeiro, Brazil
- 2Division of Infectious Diseases, Department of Medicine, Weill Cornell Medicine, New York, NY, United States
- 3Department of Genetic Medicine, Weill Cornell Medicine, New York, NY, United States
A wide spectrum of drugs have been assessed as latency reversal agents (LRA) to reactivate HIV-1 from cellular reservoirs and aid in viral eradication strategies. Histone deacetylase inhibitors (HDACi) have been studied in vitro and in vivo as potential candidates for HIV-1 latency reversion. Suberoylanilide hydroxamic acid (SAHA) and romidepsin (RMD) are two HDACi able to reverse HIV latency, however studies of potential off-target effects on retroelement expression have been limited. Retroelements constitute a large portion of the human genome, and some are considered “fossil viruses” as they constitute remnants of ancient exogenous retroviruses infections. Retroelements are reactivated during certain disease conditions like cancer or during HIV-1 infection. In this study, we analyzed differential expression of retroelements using publicly available RNA-seq datasets (GSE102187 and GSE114883) obtained from uninfected CD4+, and HIV-1 latently infected CD4+ T-cells treated with HDACi (SAHA and RMD). We found a total of 712 and 1,380 differentially expressed retroelements in HIV-1 latently infected cells following a 24-h SAHA and RMD treatment, respectively. Furthermore, we found that 531 retroelement sequences (HERVs and L1) were differentially expressed under both HDACi treatments, while 1,030 HERV/L1 were exclusively regulated by each drug. Despite differences in specific HERV loci expression, the overall pattern at the HERV family level was similar for both treatments. We detected differential expression of full-length HERV families including HERV-K, HERV-W and HERV-H. Furthermore, we analyzed the link between differentially expressed retroelements and nearby immune genes. TRAF2 (TNF receptor) and GBP5 (inflammasome activator) were upregulated in HDACi treated samples and their expression was correlated with nearby HERV (MERV101_9q34.3) and L1 (L1FLnI_1p22.2k, L1FLnI_1p22.2j, L1FLnI_1p22.2i). Our findings suggest that HDACi have an off-target effect on the expression of retroelements and on the expression of immune associated genes in treated CD4+ T-cells. Furthermore, our data highlights the importance of exploring the interaction between HIV-1 and retroelement expression in LRA treated samples to understand their role and impact on “shock and kill” strategies and their potential use as reservoir biomarkers.
Introduction
Approximately half of the human genome is composed of ancient transposable elements (TE), initially termed “selfish DNA parasites” or “junk DNA.” TEs are divided in two general groups, DNA transposons and retroelements, and have shown a role in disease development and viral infection (1–3). Retroelements are endogenous sequences of eukaryotic genomes able to replicate through an RNA intermediate (2). Over 40% of the human genome is composed by retroelement sequences (2–4). They are divided into long terminal repeat (LTR) and non-LTR retrotransposons. LTR retrotransposons are a class of “fossil viruses” originated through exogenous retrovirus infection of germline million years ago, currently known as human endogenous retroviruses (HERV) (3, 5). While HERVs compose about 8% of the human genome, non-LTR retrotransposons correspond to about 33% of the genome and are divided into short interspersed nuclear elements (SINE) and long counterparts (LINE or L1) (2, 3, 6). In contrast to SINE, L1 are autonomous elements able to replicate and insert into the human genome (7–9). Both HERV and L1 expression are associated with human diseases and with viral infections, such as HIV-1 (10–13). Both HERV and HIV-1 belong to the Retroviridae family of RNA viruses that replicate through a DNA intermediate. Their complete genome is composed by gag, pol and env genes flanked by two LTR regions. In contrast to HERV, HIV-1 is an exogenous retrovirus, with a similar genetic structure but capable of infecting human CD4+ T-cells which can lead to the development of AIDS in absence of antiretroviral treatment (ART).
Over 37 million people are currently living with HIV-1 and about 27.5 million are on treatment worldwide (14). Since HIV-1 was discovered as the causative agent of AIDS, ART has been implemented to control the infection in people living with HIV (15). ART controls the viral load and suppresses HIV-1 to undetectable levels in blood (16). However, the main challenge for an HIV-1 cure is based on the ability of the virus to establish latency in T-cells that can last for decades (17, 18). The persistence of the viral cellular reservoir is ensured through clonal expansion of infected cells and the HIV-1 genome persists within the body even after prolonged periods of undetectable viral load (18). ART cessation leads to viraemia rebound and a lifelong treatment to keep the virus under control is required. The greatest barrier for HIV-1 eradication and cure consists in identifying and eliminating those persistently infected CD4 T-cells (19).
Several studies have proposed strategies to cure HIV-1 by eliminating HIV-1 reservoirs, such as the “shock and kill” strategy using latency reversal agents (LRA) (20–25). These drugs induce an HIV-1 reactivation from the persistently infected cell reservoirs (shock) followed by an intensified ART treatment (kill). LRAs induce production of viral RNA and proteins in latently infected cells, allowing the immune system to recognize them. Suberoylanilide hydroxamic acid (SAHA, also known as vorinostat) and romidepsin (RMD, also known as FK228) are histone deacetylase inhibitors (HDACi), a class of LRA. They increase the levels of histone acetylation (26–29). Addition of acetyl groups in histones causes chromatin relaxation, which makes promoter regions accessible to the transcription machinery and transcription factors, inducing gene expression (29–31). Both agents have been approved by the United States Food and Drug Administration (FDA) for cutaneous T-cell lymphoma treatment (32, 33). They have also been assessed in vitro and in clinical trials to eliminate HIV-1 through latency reversion and viral reactivation (24, 34–36). SAHA and RMD are able to inhibit histone deacetylase (HDAC) enzymes, binding covalently at its active site or chelating Zn2+ ions. HDAC are classified into four classes (classes I to IV), but only classes I, II and IV are Zn2+-dependent enzymes and are inhibited by SAHA and RMD (26, 37). In contrast to SAHA, RMD is a potent inhibitor to class I HDACs, which has been reported as responsible in part for maintaining HIV in latency. This makes RMD an attractive option for HIV-1 “shock and kill” treatment (38–41).
An important off-target effect of the shock and kill strategy is to induce expression of endogenous genes, including HERVs (42, 43). Uninfected primary CD4+ T-cells treated with SAHA show upregulation of HERV-9 and LTR12 as well as downregulation of ERVL (43). In addition, HERV expression also can be stimulated by HIV-1 infection in CD4+ T-cells, which is able to induce specific immune responses (12). Therefore, in this study, we characterized the differential expression of HERV and L1 elements in RNA-seq datasets from primary CD4+ T-cells (HIV-negative and HIV-1-latently infected) treated either with SAHA or RMD. We used Telescope, a bioinformatic pipeline with the ability to assign transcripts to specific genomic locations and quantify the expression of transposable elements (44). Our findings show that HDACi modulate retroelement and immune gene expression, suggesting that “shock and kill” strategy mediated by SAHA and RMD treatment induces genes expression, which could be used as biomarkers during LRA treatment.
Methods
RNA-Seq Datasets
Herein, we analyzed RNA-seq datasets from the White et al. and the Beliakova-Bethell et al. (43, 45) studies, available in the Gene Expression Omnibus (GEO) databases under the accession numbers GSE102187 (available at: https://www.ncbi.nlm.nih.gov/geo/query/acc.cgi?acc=GSE102187) and GSE114883 (available at: https://www.ncbi.nlm.nih.gov/geo/query/acc.cgi?acc=GSE114883), respectively.
In the White et al. (43) study, peripheral blood mononuclear cells (PBMCs) were collected from 4 healthy donors. Naive CD4+ T-cells were isolated and exposed to SAHA (10 μM) dissolved in dimethyl sulfoxide (DMSO) or untreated (DMSO solvent only) over a 24-h period. After this, RNA was extracted from cells and their untreated paired counterparts for deep sequencing. In the Beliakova-Bethell et al. study, PBMCs were obtained from four HIV-seronegative donors. Primary CD4+ T-cells were isolated and used to generate an in vitro model of latent HIV-1 infection (45). Briefly, while a portion of the CD4+ T cells (“bystander”) are cultivated without stimulation or infection for 5 days, another portion of cells are stained with the viable dye e-Fluor 670, infected with full-length HIVNL4−3 (4–6 h) and stimulated on αCD3+ αCD28−coated plates. For establishment of latent infection in the bystander cells, after 4 days of culture, infected cells are mixed in with bystander cells and stimulated with IL-2 and IL-15. At day 7 of culture the e-Fluor negative bystander cells are recovered by cell sorting. Then, on day 10, the in vitro HIV-1 latency model is treated with SAHA (1μM), RMD (15nM), or their solvent (DMSO) for 24 h. In parallel, mock-infected cells were also cultured and treated. RNA was isolated from cells and following ribosomal RNA depletion was used to generate RNA libraries and sequenced using an Illumina HiSeq platform.
Bioinformatic Analyses
Sequence Read Archive (SRA) files from GEO were downloaded and converted into FASTQ with parallel-fastq-dump (https://github.com/rvalieris/parallel-fastq-dump). Host gene quantification was performed using Salmon v1.3.0 against transcript sequences from gencode v.33 plus the HIV-1 genome (K03455) as Ref. (46). Results were then merged using the tximport package in R. Additionally, reads were mapped with Bowtie2 to the human genome (hg38) with parameters—very-sensitive-local-k 100—score-min L, 0, 1.6 for multi-mappings and the resulted mappings were used as input for Telescope to accurately quantify retroelements with a single locus resolution annotation (retro.hg38.v1, available on https://github.com/mlbendall/telescope_annotation_db/tree/master/builds) (44, 47). Both Telescope and Salmon outputs were used to estimate retrotransposons differentially expressed in HDACi treated vs. untreated CD4+ T-cells using DESeq2 using the Wald test (48). The results were visualized by Principal Component Analysis (PCA) to check for differences between samples and group of samples using DESeq2 package (Supplementary Figure 1). Retrotransposons with adjusted p < 0.05 and absolute (log2FoldChange) > 1.5 were considered differentially expressed and visualized in Volcano plots with the Bioconductor Enhanced Volcano (https://github.com/kevinblighe/EnhancedVolcano) and by the ggplot2 R package. In addition, Venn plots were constructed using the Venn diagram R package to show all relationships between sets of data from differentially expressed retroelements.
The five most upregulated and downregulated HERVs and L1 for each analysis were defined and shown in horizontal bar plots. The most expressed retroelements were also localized in chromosome loci and their genetic distance as well as their DNA strand orientation (sense and anti-sense) were defined using integrative genomics viewer (IGV) software and retroelement annotations (retro.hg38.v1) (49). Nearby most differentially expressed retroelement was shown in bar plot and a representative genome map was constructed using Inkscape software. Furthermore, HERV families were defined according to the retro.hg38.v1 annotation, the number of HERV loci of same family were computed and HERV family percentage was calculated and shown in pie charts.
Neighboring host genes from retroelements were defined using Telescope meta annotations (https://raw.githubusercontent.com/LIniguez/Telescope_MetaAnnotations/main/TE_annotation.v2.0.tsv) and filtered using the list of differentially expressed retroelements in R. Over-representation analysis (ORA) was then performed with WebGestal (available at http://webgestalt.org/) using gene ontology biological processes as a functional database. Genes related to immune responses were then selected and their expression was analyzed to nearby retroelement expression by fitting linear model in R.
Results
Retroelement Expression in Primary CD4+ T-Cells From Healthy Donors Treated With SAHA
To determine if LRA treatment can modulate retrotransposons expression in non-HIV-1 infected T CD4+ cells, we used Telescope to investigate the transcriptional modulation of retroelements in naïve CD4+ T-cells from four healthy HIV-1-negative donors treated with SAHA over a 24-h period (White et al. dataset). We found a total of 1,547 differentially expressed retroelements between untreated and treated samples at the 24-h time period, of which 722 corresponded to HERV sequences (303 upregulated and 419 downregulated) and 825 to L1 (285 upregulated and 540 downregulated) (Figure 1A). Next, we also checked if HERV expression at the family level could be affected by LRA treatment. Then, we categorized all differentially expressed HERVs according to their annotation. We found 17 different HERV families regulated by SAHA treatment (Figure 1B). The five most upregulated HERV loci were ERV3 (ERV316A3, 6p25.2c and 14q24.2b loci), HERVW (HERV9, 3p24.3 locus), MER4 (MER4, 14q24.2b locus) and ERVL (ERVLE, 17q24.2b locus) families (Figure 1C). The top downregulated HERV loci corresponded to the HERVH (HERVH, 6q23.2c locus) and HERVF (HERVFH21, Xq11.2a and Xq11.2b loci) families (Figure 1C). All the HERV sequences described above harbor open reading frames (ORF), allowing for potential protein coding. Proteins over 50 amino acids in length are listed for each HERV loci (Supplementary Table 1). Additionally, the most up- and downregulated L1 sequences were localized in chromosomes 1, 2, 3, 9, 12, 13 and 15 (Figure 1D).
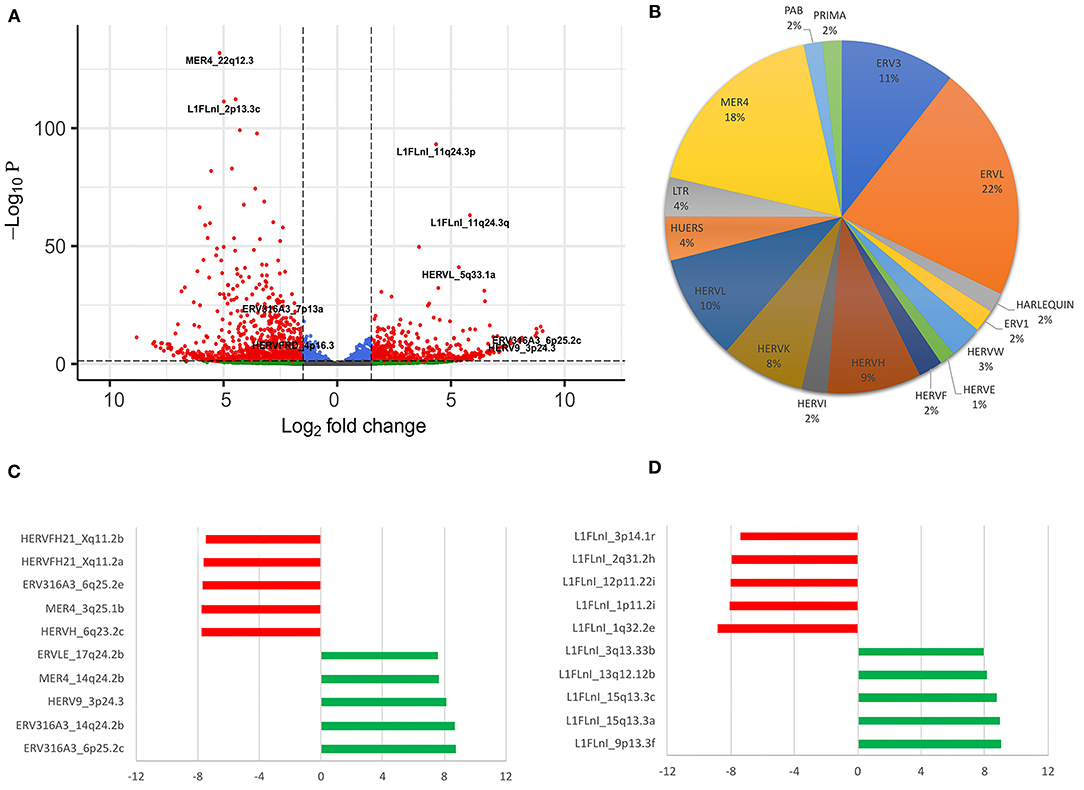
Figure 1. Differentially expressed retroelements in naïve CD4+ T-cells treated with SAHA. (A) Volcano plot shows a total of 1,547 differentially expressed retroelements. (B) The percentage of HERV families found on samples are shown. (C,D) The most upregulated and downregulated retroelements expressed are shown, respectively. In the x-axis the log2fold change values are plotted. The red and green colors highlight the HERV and L1 downregulated and upregulated loci, respectively (C,D).
We validated those differently expressed HERV loci in healthy cells treated with SAHA using the datasets from mock-infected CD4+ T-cell datasets also treated with SAHA and published by Beliakova-Bethell et al. (45). We found 172 upregulated and 235 downregulated retroelements expressed in both datasets (Supplementary Figure 2A). In this dataset, we found that HERVF (HERVFH21, Xq11.2a and Xq11.2b loci), HERVH (HERVH, 6q23.2c locus), ERV3 (ERV316A3, 14q24.2b locus), HERVW (HERV9, 3p24.3 locus) and MER4 (MER4, 14q24.2b locus) were also differently expressed in mock-infected cells, overlapping with the White et al. dataset (Supplementary Figure 2B).
Next, we analyzed nearby retroelement expression and their DNA strand orientation from most up- and downregulated HERV and L1 loci (Figure 1C), assessing whether genetic distance and DNA strand orientation between retroelements were able to influence their expression in the samples (Figure 2). ERV316A3_6p25.2c (anti-sense) and ERV316A3_6q25.2e (anti-sense), ERV316A3_14q24.2b (anti-sense) and MER4_14q24.2b (sense), as well as LINE-1 loci L1FLnI_15q13.3a (sense) and L1FLnI_15q13.3c (anti-sense) are localized at 544, 27 and 22 kb apart, respectively. We did not find a relation in expression between these retroelement pairs when considering DNA strand orientation or genetic distance (Figure 2). Thus, their expression may occur independently from neighboring retroelements. In contrast, HERVFH21_Xq11.2a (sense) and HERVFH21_Xq11.2b (sense), both downregulated HERVs in SAHA-treated samples, showed a short genetic distance (~260 bp) and the same DNA strand orientation. This suggests that chromatin structure can modulate equally nearby retroelements located at a short genetic distance.
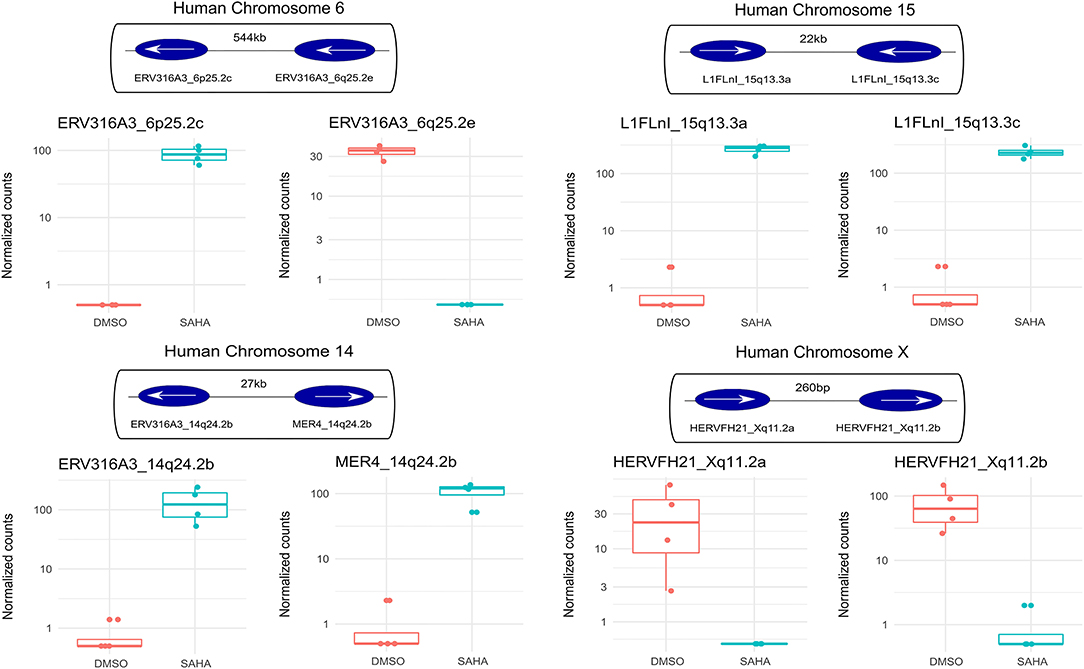
Figure 2. Retroelement expression and their DNA strand orientation. Normalized expression for top up- and down-regulated retroelements are shown in bar plots according to treatment (DMSO, light red; SAHA, light blue). The localization on the human chromosome, DNA strand orientation (sense, right arrow; antisense, left arrow) and the genetic distances are shown for each retroelement.
Retroelement Expression in HIV Latent CD4+ T-Cells Treated With SAHA and RMD
Since HDACi have been used as latency reversal agents in HIV-1 cure strategies, we assessed the impact of SAHA and RMD on retroelement expression in CD4+ T cells from an HIV-1 latency model. In this model, central memory CD4+ T-cells latently infected with HIV-1 were treated with SAHA (1 μM) or RMD (15nM) for 24 h. Both HDAC inhibitors have been evaluated in clinical trials as latency reversal agents used in “shock and kill” strategies to eliminate HIV-1 reservoirs.
We found 712 (265 upregulated and 447 downregulated) and 1,380 (679 upregulated and 701 downregulated) differentially expressed retroelements in response to SAHA and RMD treatment, respectively (Figures 3A–C). The effect of SAHA and RMD on the profile of retroelement expression was different even though both drugs belong to the HDACi family (Figures 3C–E). While 531 HERV and L1 sequences were found differentially expressed in both treatments, a total of 1,030 HERV and L1 were specifically regulated by each drug (Figure 3C). We found that the level of HIV expression induced by both HDACi was limited and non-significant compared to DMSO alone (Supplementary Figure 4). We also aimed to analyze the impact of HIV-1 infection in these samples, comparing differently expressed retroelements in mock-infected CD4+ T-cells and HIV latent cells treated with SAHA and RMD. However, we did not find any differently expressed retroelements, suggesting that HIV-1 infection alone is not able to contribute to differential retroelement expression in cells treated with HDACi (Supplementary Figure 3).
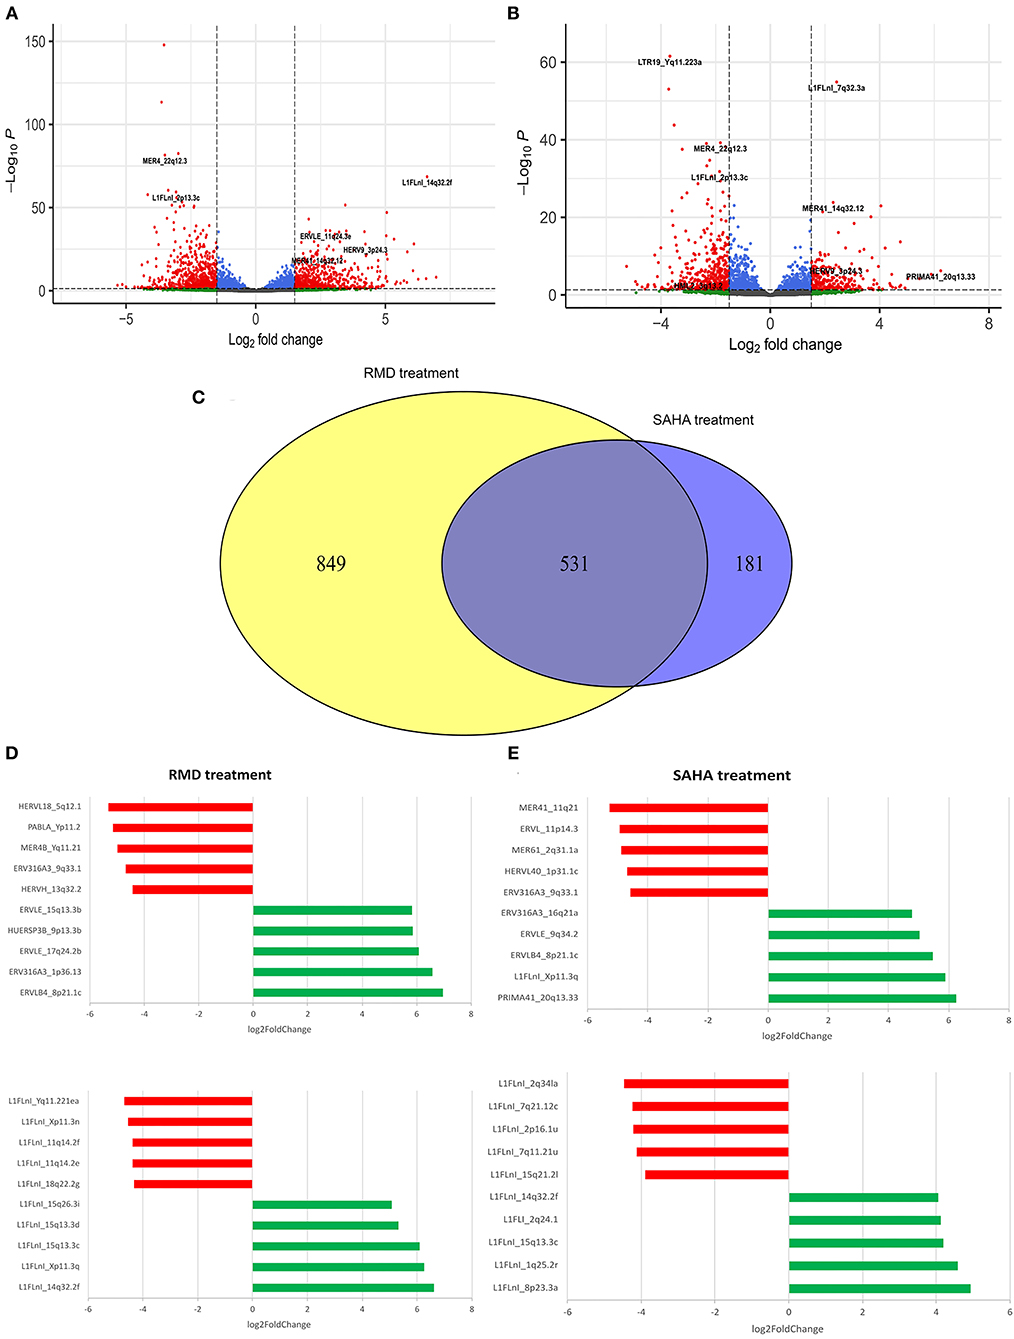
Figure 3. Differentially expressed retroelements in the HIV latency model reactivated with HDACi. Volcano plot displays differentially expressed retroelements following RMD (A) or SAHA (B) treatment. The Venn plot shows the overlapping and unique retroelements loci regulated by each HDACi. (C) Horizonal bar plot shows most differentially expressed HERV and L1 loci following RMD (D) or SAHA (E) treatment. Log2fold change values are plotted in the x-axis. Red and green colors highlight down- and up-regulated HERV and L1 elements, respectively.
Overall, at the family level, the HERV expression profile in HIV-1 latent cells treated with SAHA or RMD is similar (Figures 4A,B). This shows that both HDACi can regulate the expression of the same HERV families, such as full-length HERV genome families (HERV-K, HERV-W and HERV-H). In contrast, the most differentially expressed HERV elements in the SAHA treatment belong to PRIMA (PRIMA41, 20q13.33), ERV3 (ERV316A3, 16q21a and 9q33.1 loci), ERVL (ERVLB4, 8p21.1c and ERVLE 9q34.2), HERVL (HERVL40, 1p31.1c and ERVL, 11p14.3), HUERS (HUERSP3B, 9p13.3b) and MER4 (MER61, 2q31.1a and MER41_11q21) families (Figures 3D, 4C). With respect to RMD treatment, the most differentially expressed HERV elements belong to ERV3 (ERV316A3, 1p36.13 and ERV316A3, 9q33.1), ERVL (ERVLB4, 8p21.1c and ERVLE, 15q13.3b and 17q24.2b loci), HERVH (HERVH, 13q32.2), HERVL (HERVL18, 5q12.1), HUERS (HUERSP3B, 9p13.3b), MER4 (MER4B, Yq11.21) and PAB (PABLA, Yp11.2) families (Figures 3E, 4D). Additionally, these top differentially expressed HERV loci also show ORFs, with potential protein coding capacity (Supplementary Table 2). These findings show that, although there are not notably differences in the general HERV family expression profile between SAHA and RMD treatment, we found that the PRIMA family in the SAHA treatment and the HERVH and PAB families in the RMD treatment are specifically most regulated by each of these HIV-1 latency reversal agents (Figures 3, 4). This shows that some specific phenotypes may arise from the distinct treatments and highlights the importance of analyzing retroelement differential expression at the locus-specific resolution level.
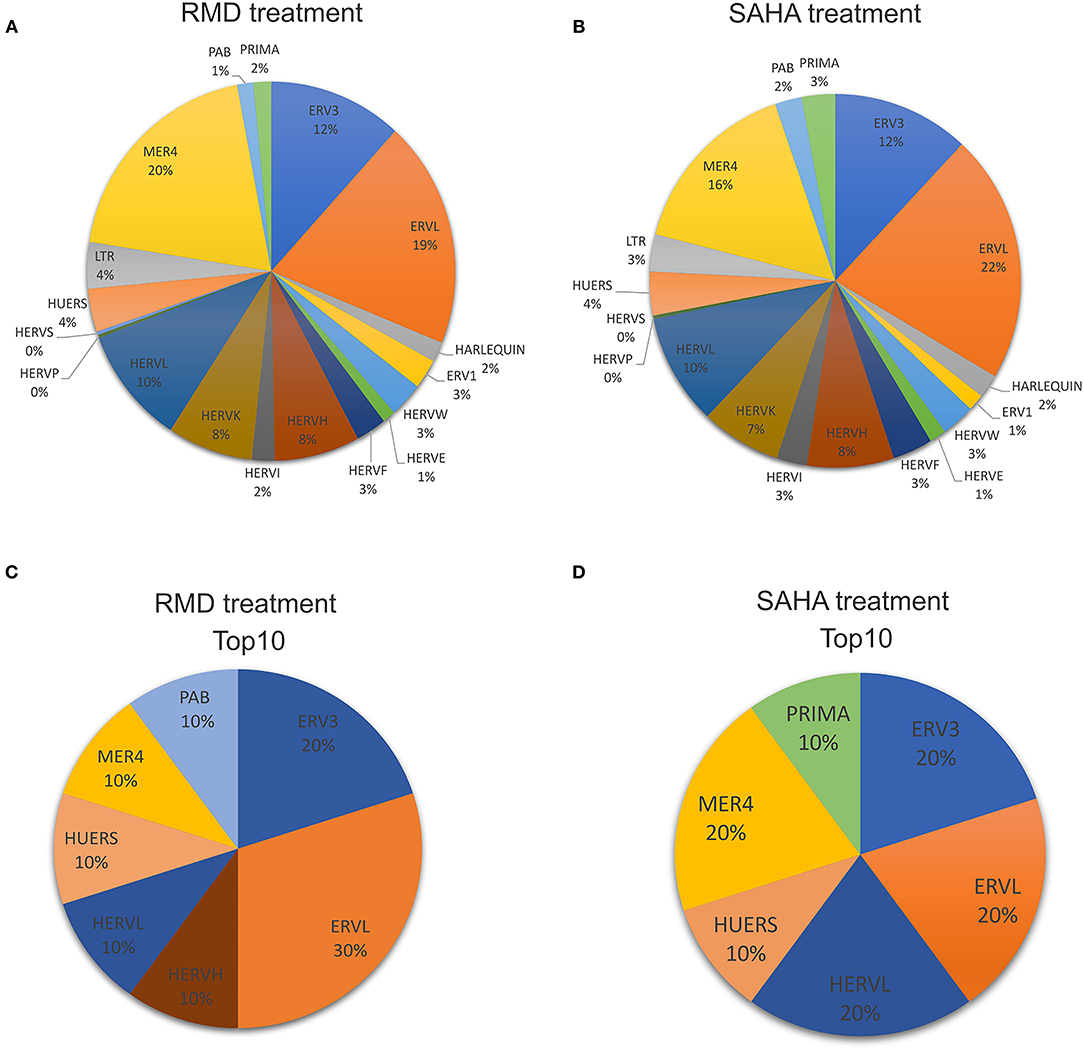
Figure 4. Profile of HERV families expressed in the HIV latency model reactivated with HDACi. The pie chart shows detected HERV loci percentages for each HERV family after RMD (A) or SAHA (B) treatment. The most differentially expressed HERV loci (top10) in RMD (C) and SAHA (D) treatments were categorized into their respective HERV families.
Retroelements and Immune Gene Expression in HIV Latent CD4+ T-cells
As retroelements are potentially able to control the expression of host nearby genes (or genes impacting HERVs) and also induce immune responses, we performed an exploratory analysis to find differentially expressed retroelements close to immune response-related genes. We found 64 immune genes by the vicinity of differentially expressed retroelements (Supplementary Table 3). We then analyzed the relationship between retroelement and nearby immune gene expression upon HDACi treatment. We selected eight immune genes that present a key role on an HIV infection context (ESR1, GBP5, IFI16, TRAF2, TRIM5, RUNX1, THEMIS and TNFAIP3). TRAF2 and GBP5 were upregulated in the samples treated with HDACi (Supplementary Figures 5, 6) and correlated with HERV (MERV101_9q34.3) and L1 (L1FLnI_1p22.2k, L1FLnI_1p22.2j, L1FLnI_1p22.2i) expression (Figure 5). This suggests that HDACi may modulate immune gene and retroelement expression as well as affect immune responses in HIV latent CD4+ T-cells treated with SAHA or RMD.
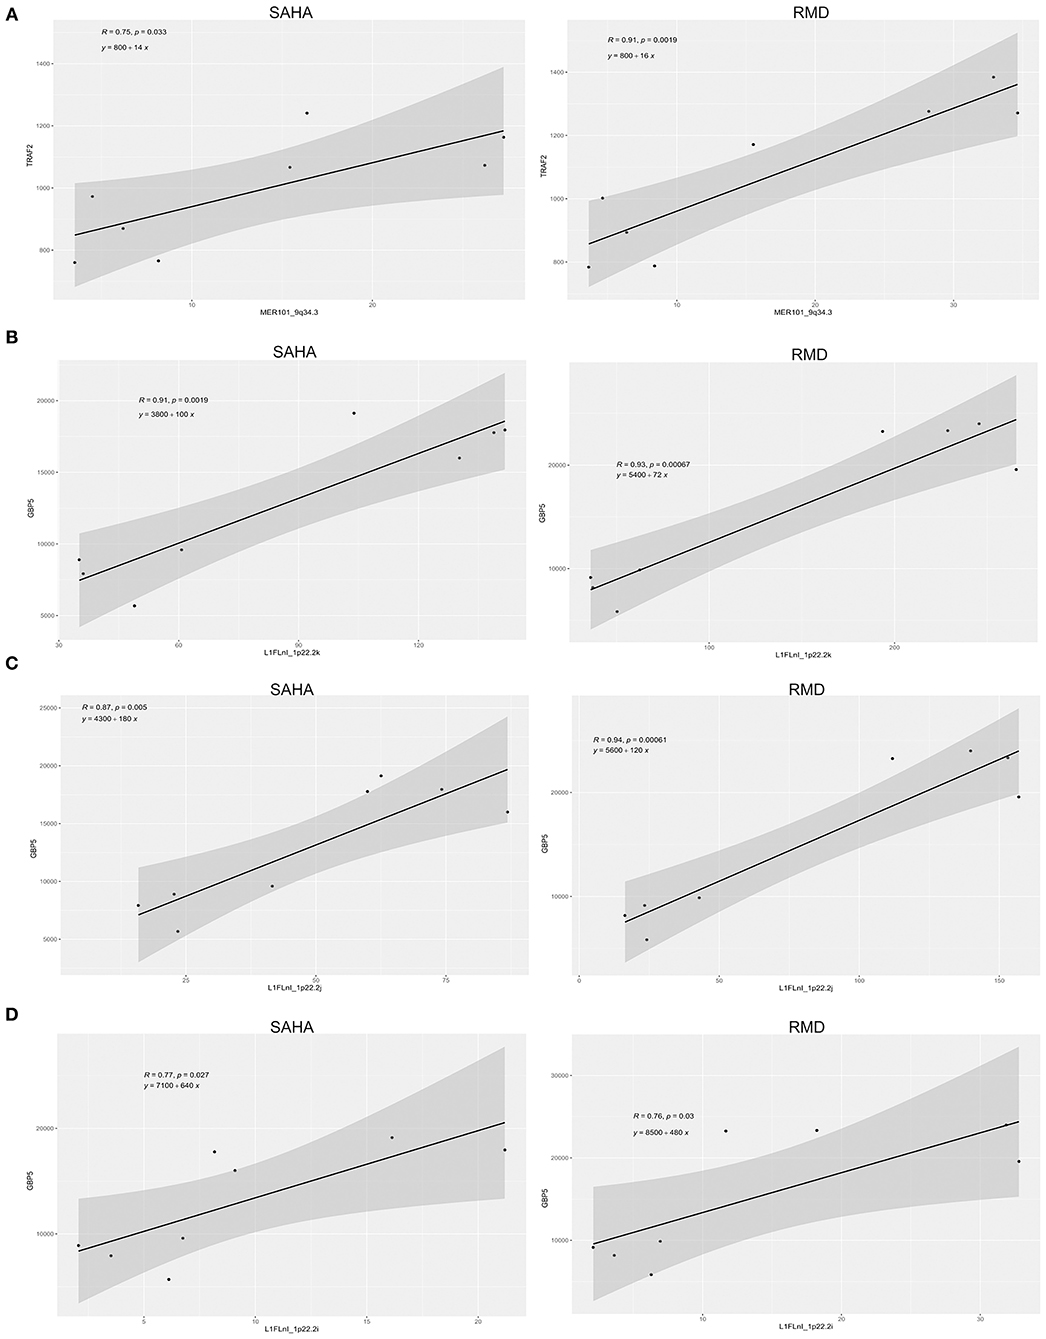
Figure 5. Relationship between retroelement and nearby immune gene expression. The association between TRAF2 (A) and GBP5 (B–D) expression with their respective nearby retroelement expression is shown. Pearson's correlation coefficients and their associated p-values are displayed as well as linear equation in each plot.
Discussion
Different drugs have been reported to reverse HIV-1 latency such as HDACi, but they may also have off-target effects (43, 45, 50, 51), including effects on retroelement expression (42, 43), which can potentially lead to cellular dysfunction (5, 10, 52, 53). Therefore, in this study we analyzed HERV and L1 differential expression at the single locus resolution level using Telescope bioinformatic pipeline in RNA-seq datasets from uninfected and HIV-1 latently infected CD4+ T-cells, treated with SAHA and RMD, two widely used HDACi. We performed PCA to check for transcriptional differences between individual samples and group of samples. The results showed a variation of about 12% between donors and of around 85% between groups (DMSO, SAHA and RMD) (Supplementary Figure 1). Thus, despite inherent genetic differences between donors, data from each donor in each group are homogeneous, showing similar differential gene expression.
Our findings from uninfected CD4+ T-cells treated with SAHA showed a total of 722 HERV and 825 L1 loci differentially expressed, categorized in 17 HERV families, such as the ERV3, HERVW, MER4, ERVL, HERVH and HERVF families. These data are in agreement with a previously published study, which showed that HERVW (HERV-9 or LTR12) and ERVL families were differentially expressed (43). We also validated the differentially expressed HERV loci using a dataset of uninfected CD4+ T-cell treated with SAHA (45). We found a 56% congruence between datasets, which represents 407 differential HERV expressed in both datasets, such as HERVF, HERVH, ERV3, HERVW and MER4 families. The contrast between datasets may be explained by a difference in the concentration of SAHA used between studies (10 μM in the White et al. study vs. 1 μM in the Beliakova-Bethell et al. study), as well as differences between the CD4+ T-cell subset analyzed and the culture protocol (43, 45). While the Beliakova-Bethell et al. study analyzed a central memory CD4+ T-cell model of HIV latency, using uninfected CD4+ T-cells (mock-infected) and in vitro HIV-infected (latent HIV cell), the White et al. study used naive CD4+ T-cells (uninfected) treated with SAHA or DMSO. In addition, mock-infected cells from the Beliakova-Bethell et al. study were cultured and stimulated with anti-CD3/CD28 antibodies and also incubated with IL-2 and IL-15 before SAHA and DMSO treatment, which is likely to explain the difference in retroelements expression between these two datasets and emphasizes the importance of culture conditions in differential TE expression analyses.
SAHA regulates gene expression by HDAC inhibition (54, 55). HDACs are involved in epigenetic regulation, removing the acetyl groups from histones. Their inhibition become chromatin more relaxed, permitting transcriptional activation (56, 57). In humans, there are 18 HDAC enzymes divided in four classes (I – IV) (58). Classes I, II and IV HDACs are zinc-binding enzymes and inhibited by SAHA, inducing gene transcription. In addition, retroelement promoters and their DNA orientation may also regulate nearby gene expression, such as neighbor HERVs and L1 (3, 59, 60). We found two neighboring HERVs downregulated in the same DNA strand orientation [HERVFH21_Xq11.2a (sense) and HERVFH21_Xq11.2b (sense)], localized in ~260 bp of genetic distance in an intergenic region. This piece of data suggests that chromatin structure can modulate equally nearby retroelements located at a short genetic distance and highlights the importance of chromatin structure and genome accessibility on HERV promoters and regulation of nearby gene expression.
SAHA and RMD are both approved by the FDA for cutaneous T-cell lymphoma treatment and have been assessed in clinical trials to reverse HIV latency (34–36, 61–63). Viral latency is the main challenge for an HIV-1 cure. HIV-1 latently infected cells can evade the immune response, establishing viral cellular reservoir that last for years (64–67). ART cessation leads to viraemia rebounds even after prolonged period of viral undetectable levels (18). Several studies have proposed strategies for HIV-1 cure by eliminating HIV-1 reservoirs, such as the “shock and kill” strategy, using LRA (20–25). Therefore, for assessing latency reversal in context of HIV-1 infection, we also analyzed the expression of retroelements (HERV and L1) in HIV-1 latent CD4+ T-cells treated with HDACi. We found 712 and 1,380 differentially expressed retroelements in response to SAHA and RMD treatment, respectively. Five hundred and thirty-one of retroelements were found differentially expressed in both treatments, while 1,030 were differently regulated according to type of treatment. In addition, it is known that HIV-1 infection is able to induce HERV expression by its viral proteins, such as Tat protein (68). Therefore, we also compared differentially expressed retroelements between HIV-1 latent CD4+ T-cells and mock-infected CD4+ T-cells treated with SAHA and RMD. However, we did not find any differently expressed HERV or L1 under this comparison. These data agree with Beliakova-Bethell et al. study, which found only six and eleven host genes differently expressed between mock-infected and HIV-1 latency cells treated with SAHA and RMD, respectively (45). It also is important to highlight that the frequency of latently infected cells in the in vitro model was low (8–20%), thus any difference in their response to HDACi between a mock-infected cell and a HIV latently infected cell would unlikely be detectable, unless it was very robust. This agrees with the idea that the effect of HIV reactivation at altering gene expression pathways induced by HDACi is minimal and that gene modulations were similar in mock-infected cells and the model of HIV latency (uninfected vs. infected). These data further shows that HIV-1 reactivation in the latent cell model was unable of independently regulate the expression of retroelements in CD4+ T-cells treated with SAHA or RMD, suggesting that retroelement expression is mostly regulated by HDACi.
The comparison between SAHA and RMD treatment in HIV-1 latently infected CD4+ T-cells shows no different expression profiles of general HERV families. Both drugs were able to regulate full-length HERV genomes, such as those of the HERV-K, HERV-W and HERV-H families, as well as partial HERV genomes which are able to encode viral proteins, such as those of the PRIMA4, HERVF, ERV3 and MER4 families. The full-length HERV element is about 9.5 kb in length, showing two long terminal repeats (LTRs) and three essential viral genes (gag, pol, and env) which encode four viral proteins (Env, PR, RT and Gag). Both partial and full-length HERV genomes are able to modulate cellular pathways and stimulate immune responses (5, 10, 69). On the other hand, comparison of the top ten most differentially expressed HERVs by SAHA and RMD showed that the PRIMA family was mostly regulated by SAHA treatment and the HERVH and PAB families were mostly regulated by RMD treatment. This suggests that each HIV shock-and-kill strategy regulates exclusive components that may provide specific biological phenotypes in each treated cell.
Retroelements are also able to control the expression of nearby host genes and also induce immune responses (3, 5, 10, 59, 60, 69). Herein, we found 64 immune genes nearby differentially expressed retroelements, including eight immune genes with known key roles on HIV-1 infection (ESR1, GBP5, IFI16, TRAF2, TRIM5, RUNX1, THEMIS and TNFAIP3). TNF receptor associated factor 2 (TRAF2) and guanylate binding protein 5 (GBP5) proteins were upregulated in the samples treated with HDACi and correlated with HERV (MERV101_9q34.3) and L1 (L1FLnI_1p22.2k, L1FLnI_1p22.2j, L1FLnI_1p22.2i) expression localized in intergenic region. TRAF2 is a member of the TNF receptor associated factor (TRAF) protein family and mediate the signal transduction from members of the TNF receptor superfamily (70). TRAF2 is required for TNF-alpha-mediated activation of NF-κB and MAPK8/JNK (71, 72). Also, HIV-1 Nef is able to activate TRAF2, thus mediating activation of NF-κB and increasing HIV-1 replication in macrophages (73). GBP5 belongs to the guanylate binding protein family, which is an interferon-inducible subfamily of guanosine triphosphatases. It is able to enhance endogenous IFN expression by interacting with the NF-κB complex, stimulating its signaling and inducing antiviral responses (74, 75). Several studies have associated HERV expression with NF-κB activation (68, 76–78). In addition, HIV-1 Tat protein can induce HERV expression through regulating the NF-AT and NF-κB pathways (79), suggesting an interplay between HIV-1 and HERV expression through cellular pathways.
In summary, our findings show that off-target effects of HDAC inhibitors, such as SAHA and RMD, may induce retroelement gene expression and also modulate host genes in treated CD4+ T-cells. In addition, several studies have shown that HERV expression is able to induce antibodies and cytotoxic immune responses, leading to cellular death (10, 80–82). Its potential roles as immunotherapeutic and as a biomarker have been discussed for different type of diseases, including HIV-1 infection (10, 12, 80, 82). Thus, our findings suggest that retroelements expression might constitute a biomarker for “shock-and-kill” clinical trials using HDAC inhibitors. In addition, the data presented here highlight the importance of exploring the interaction of HIV-1 and HERV interaction from trial subjects for understanding its impact on “shock and kill” treatments.
Data Availability Statement
Publicly available datasets were analyzed in this study. This data can be found here: https://www.ncbi.nlm.nih.gov/geo/query/acc.cgi?acc=GSE102187 and https://www.ncbi.nlm.nih.gov/geo/query/acc.cgi?acc=GSE114883.
Author Contributions
GC and MM designed the study and wrote the manuscript. GC and LI performed the data analysis. MS and DN helped with study design and wrote the manuscript. All authors revised the final draft and approved the manuscript.
Funding
The work was supported in part by US National Institutes of Health (NIH) grant AI152929 (MM), CA260691 (DN), CA206488 (DN), and UM1AI164559 (DN). MM is supported in part by the Department of Medicine, Fund for the Future program at Weill Cornell Medicine sponsored by the Kellen Foundation. GC is recipient of a Ph.D. fellowship by intramural grants of the Brazilian National Cancer Institute (INCA), Brazil.
Author Disclaimer
This work was solely the responsibility of the authors and do not necessarily represent the official views of the NIH.
Conflict of Interest
The authors declare that the research was conducted in the absence of any commercial or financial relationships that could be construed as a potential conflict of interest.
Publisher's Note
All claims expressed in this article are solely those of the authors and do not necessarily represent those of their affiliated organizations, or those of the publisher, the editors and the reviewers. Any product that may be evaluated in this article, or claim that may be made by its manufacturer, is not guaranteed or endorsed by the publisher.
Supplementary Material
The Supplementary Material for this article can be found online at: https://www.frontiersin.org/articles/10.3389/fviro.2021.756635/full#supplementary-material
References
1. van de Lagemaat LN, Landry J-R, Mager DL, Medstrand P. Transposable elements in mammals promote regulatory variation and diversification of genes with specialized functions. Trends Genet. (2003) 19:530–6. doi: 10.1016/j.tig.2003.08.004
3. Bannert N, Kurth R. Retroelements and the human genome: New perspectives on an old relation. Proc Natl Acad Sci USA. (2004) 101:14572–9. doi: 10.1073/pnas.0404838101
4. Cordaux R, Batzer MA. The impact of retrotransposons on human genome evolution. Nat Rev Genet. (2009) 10:691–703. doi: 10.1038/nrg2640
5. Grandi N, Tramontano E. HERV envelope proteins: physiological role and pathogenic potential in cancer and autoimmunity. Front Microbiol. (2018) 9:462. doi: 10.3389/FMICB.2018.00462
6. Koito A, Ikeda T. Intrinsic immunity against retrotransposons by APOBEC cytidine deaminases. Front Microbiol. (2013) 4:28. doi: 10.3389/fmicb.2013.00028
7. Dombroski B, Mathias S, Nanthakumar E, Scott A, Kazazian H. Isolation of an active human transposable element. Science. (1991) 254:1805–8. doi: 10.1126/science.1662412
8. Richardson SR, Doucet AJ, Kopera HC, Moldovan JB, Garcia-Perez JL, Moran JV. The influence of LINE-1 and SINE retrotransposons on mammalian genomes. Microbiol Spectr. (2015) 3:1–63. doi: 10.1128/microbiolspec.MDNA3-0061-2014
9. Konkel MK, Walker JA, Batzer MA. LINEs and SINEs of primate evolution. Evol Anthropol Issue News Rev. (2010) 19:236–49. doi: 10.1002/evan.20283
10. Curty G, Marston JL, de Mulder Rougvie M, Leal FE, Nixon DF, Soares MA. Human endogenous retrovirus k in cancer: a potential biomarker and immunotherapeutic target. Viruses. (2020) 12:726. doi: 10.3390/v12070726
11. van der Kuyl AC. HIV infection and HERV expression: a review. Retrovirology. (2012) 9:6. doi: 10.1186/1742-4690-9-6
12. Jones RB, Garrison KE, Mujib S, Mihajlovic V, Aidarus N, Hunter DV, et al. HERV-K-specific T cells eliminate diverse HIV-1/2 and SIV primary isolates. J Clin Invest. (2012) 122:4473–89. doi: 10.1172/JCI64560
13. Misiak B, Ricceri L, Sasiadek MM. Transposable elements and their epigenetic regulation in mental disorders: current evidence in the field. Front Genet. (2019) 10:580. doi: 10.3389/fgene.2019.00580
14. UNAIDS. UNAIDS DATA. (2020). Available online at: https://www.unaids.org/en/resources/fact-sheet (accessed July 27, 2021)
15. Saag MS, Gandhi RT, Hoy JF, Landovitz RJ, Thompson MA, Sax PE, et al. Antiretroviral drugs for treatment and prevention of HIV infection in adults. JAMA. (2020) 324:1651. doi: 10.1001/jama.2020.17025
16. Eggleton JS, Nagalli S. Highly Active Antiretroviral Therapy (HAART). StatPearls. (2021). Available online at: www.ncbi.nlm.nih.gov/books/NBK554533/ (accessed October 7, 2021).
17. Vanhamel J, Bruggemans A, Debyser Z. Establishment of latent HIV-1 reservoirs: what do we really know? J Virus Erad. (2019) 5:3–9. doi: 10.1016/S2055-6640(20)30275-2
18. Cohn LB, Chomont N, Deeks SG. The biology of the HIV-1 latent reservoir and implications for cure strategies. Cell Host Microbe. (2020) 27:519–30. doi: 10.1016/j.chom.2020.03.014
19. Henrich TJ, Hatano H, Bacon O, Hogan LE, Rutishauser R, Hill A, et al. HIV-1 persistence following extremely early initiation of antiretroviral therapy (ART) during acute HIV-1 infection: an observational study. PLoS Med. (2017) 14:e1002417. doi: 10.1371/journal.pmed.1002417
20. Kim Y, Anderson JL, Lewin SR. Getting the “Kill” into “Shock and Kill”: strategies to eliminate latent HIV. Cell Host Microbe. (2018) 23:14–26. doi: 10.1016/j.chom.2017.12.004
21. Sadowski I, Hashemi FB. Strategies to eradicate HIV from infected patients: elimination of latent provirus reservoirs. Cell Mol Life Sci. (2019) 76:3583–600. doi: 10.1007/s00018-019-03156-8
22. Macedo AB, Novis CL, De Assis CM, Sorensen ES, Moszczynski P, Huang S, et al. Dual TLR2 and TLR7 agonists as HIV latency-reversing agents. JCI Insight. (2018) 3:122673. doi: 10.1172/jci.insight.122673
23. Tsai A, Irrinki A, Kaur J, Cihlar T, Kukolj G, Sloan DD, Murry JP. Toll-like receptor 7 agonist GS-9620 induces HIV expression and HIV-specific immunity in cells from HIV-infected individuals on suppressive antiretroviral therapy. J Virol. (2017) 91:e02166–16. doi: 10.1128/JVI.02166-16
24. Archin NM, Kirchherr JL, Sung JAM, Clutton G, Sholtis K, Xu Y, et al. Interval dosing with the HDAC inhibitor vorinostat effectively reverses HIV latency. J Clin Invest. (2017) 127:3126–35. doi: 10.1172/JCI92684
25. Wang P, Lu P, Qu X, Shen Y, Zeng H, Zhu X, et al. Reactivation of HIV-1 from latency by an ingenol derivative from euphorbia kansui. Sci Rep. (2017) 7:9451. doi: 10.1038/s41598-017-07157-0
26. Li W, Sun Z. Mechanism of action for HDAC inhibitors—insights from omics approaches. Int J Mol Sci. (2019) 20:1616. doi: 10.3390/ijms20071616
27. Richon VM. Cancer biology: mechanism of antitumour action of vorinostat (suberoylanilide hydroxamic acid), a novel histone deacetylase inhibitor. Br J Cancer. (2006) 95:S2–6. doi: 10.1038/sj.bjc.6603463
28. Bertino EM, Otterson GA. Romidepsin: a novel histone deacetylase inhibitor for cancer. Expert Opin Investig Drugs. (2011) 20:1151–8. doi: 10.1517/13543784.2011.594437
29. Park S-Y, Kim J-SA. short guide to histone deacetylases including recent progress on class II enzymes. Exp Mol Med. (2020) 52:204–12. doi: 10.1038/s12276-020-0382-4
30. Kouzarides T. Chromatin modifications and their function. Cell. (2007) 128:693–705. doi: 10.1016/j.cell.2007.02.005
31. Bannister AJ, Kouzarides T. Regulation of chromatin by histone modifications. Cell Res. (2011) 21:381–95. doi: 10.1038/cr.2011.22
32. Mishra A, La Perle K, Kwiatkowski S, Sullivan LA, Sams GH, Johns J, et al. Mechanism, consequences, and therapeutic targeting of abnormal IL15 signaling in cutaneous T-cell lymphoma. Cancer Discov. (2016) 6:986–1005. doi: 10.1158/2159-8290.CD-15-1297
33. Bolden JE, Peart MJ, Johnstone RW. Anticancer activities of histone deacetylase inhibitors. Nat Rev Drug Discov. (2006) 5:769–84. doi: 10.1038/nrd2133
34. Søgaard OS, Graversen ME, Leth S, Olesen R, Brinkmann CR, Nissen SK, et al. The depsipeptide romidepsin reverses HIV-1 latency in vivo. PLoS Pathog. (2015) 11:e1005142. doi: 10.1371/journal.ppat.1005142
35. Elliott JH, Wightman F, Solomon A, Ghneim K, Ahlers J, Cameron MJ, et al. Activation of HIV transcription with short-course vorinostat in HIV-infected patients on suppressive antiretroviral therapy. PLoS Pathog. (2014) 10:e1004473. doi: 10.1371/journal.ppat.1004473
36. Archin NM, Liberty AL, Kashuba AD, Choudhary SK, Kuruc JD, Crooks AM, et al. Administration of vorinostat disrupts HIV-1 latency in patients on antiretroviral therapy. Nature. (2012) 487:482–5. doi: 10.1038/nature11286
37. Shirakawa K, Chavez L, Hakre S, Calvanese V, Verdin E. Reactivation of latent HIV by histone deacetylase inhibitors. Trends Microbiol. (2013) 21:277–85. doi: 10.1016/j.tim.2013.02.005
38. Petrich A, Nabhan C. Use of class I histone deacetylase inhibitor romidepsin in combination regimens. Leuk Lymphoma. (2016) 57:1755–65. doi: 10.3109/10428194.2016.1160082
39. Furumai R, Matsuyama A, Kobashi N, Lee K-H, Nishiyama M, Nakajima H, et al. FK228 (depsipeptide) as a natural prodrug that inhibits class I histone deacetylases. Cancer Res. (2002) 62:4916–21. Available online at: http://www.ncbi.nlm.nih.gov/pubmed/12208741 (accessed October 7, 2021).
40. Huber K, Doyon G, Plaks J, Fyne E, Mellors JW, Sluis-Cremer N. Inhibitors of histone deacetylases. J Biol Chem. (2011) 286:22211–8. doi: 10.1074/jbc.M110.180224
41. Keedy KS, Archin NM, Gates AT, Espeseth A, Hazuda DJ, Margolis DM, et al. Limited group of class i histone deacetylases acts to repress human immunodeficiency virus type 1 expression. J Virol. (2009) 83:4749–56. doi: 10.1128/JVI.02585-08
42. Díaz-Carballo D, Saka S, Acikelli AH, Homp E, Erwes J, Demmig R, et al. Enhanced antitumoral activity of TLR7 agonists via activation of human endogenous retroviruses by HDAC inhibitors. Commun Biol. (2021) 4:276. doi: 10.1038/s42003-021-01800-3
43. White CH, Beliakova-Bethell N, Lada SM, Breen MS, Hurst TP, Spina CA, et al. Transcriptional modulation of human endogenous retroviruses in primary CD4+ T cells following vorinostat treatment. Front Immunol. (2018) 9:603. doi: 10.3389/fimmu.2018.00603
44. Bendall ML, de Mulder M, Iñiguez LP, Lecanda-Sánchez A, Pérez-Losada M, Ostrowski MA, et al. Telescope: characterization of the retrotranscriptome by accurate estimation of transposable element expression. PLoS Comput Biol. (2019) 15:e1006453. doi: 10.1371/journal.pcbi.1006453
45. Beliakova-Bethell N, Mukim A, White CH, Deshmukh S, Abewe H, Richman DD, et al. Histone deacetylase inhibitors induce complex host responses that contribute to differential potencies of these compounds in HIV reactivation. J Biol Chem. (2019) 294:5576–89. doi: 10.1074/jbc.RA118.005185
46. Patro R, Duggal G, Love MI, Irizarry RA, Kingsford C. Salmon provides fast and bias-aware quantification of transcript expression. Nat Methods. (2017) 14:417–9. doi: 10.1038/nmeth.4197
47. Langmead B, Salzberg SL. Fast gapped-read alignment with Bowtie 2. Nat Methods. (2012) 9:357–9. doi: 10.1038/nmeth.1923
48. Love MI, Huber W, Anders S. Moderated estimation of fold change and dispersion for RNA-seq data with DESeq2. Genome Biol. (2014) 15:1–21. doi: 10.1186/s13059-014-0550-8
49. Robinson JT, Thorvaldsdóttir H, Winckler W, Guttman M, Lander ES, Getz G, et al. Integrative genomics viewer. Nat Biotechnol. (2011) 29:24–6. doi: 10.1038/nbt.1754
50. Mohammadi P, di Iulio J, Muñoz M, Martinez R, Bartha I, Cavassini M, et al. Dynamics of HIV latency and reactivation in a primary CD4+ T cell model. PLoS Pathog. (2014) 10:e1004156. doi: 10.1371/journal.ppat.1004156
51. Maxwell JW, Falcinelli SD, Nefedov A, Dorfmeier C, Wu G, Dewey M, Webber AL, et al. Cellular gene modulation of hiv-infected CD4 T cells in response to serial treatment with the histone deacetylase inhibitor vorinostat. J Virol. (2020) 94:e00351–20. doi: 10.1128/JVI.00351-20
52. Dolei A, Ibba G, Piu C, Serra C. Expression of HERV genes as possible biomarker and target in neurodegenerative diseases. Int J Mol Sci. (2019) 20:3706. doi: 10.3390/ijms20153706
53. Gao Y, Yu X-F, Chen T. Human endogenous retroviruses in cancer: expression, regulation and function (Review). Oncol Lett. (2020) 21:121. doi: 10.3892/ol.2020.12382
54. Mitsiades CS, Mitsiades NS, McMullan CJ, Poulaki V, Shringarpure R, Hideshima T, et al. Transcriptional signature of histone deacetylase inhibition in multiple myeloma: biological and clinical implications. Proc Natl Acad Sci USA. (2004) 101:540–5. doi: 10.1073/pnas.2536759100
55. Claerhout S, Lim JY, Choi W, Park Y-Y, Kim K, Kim S-B, et al. Gene expression signature analysis identifies vorinostat as a candidate therapy for gastric cancer. PLoS One. (2011) 6:e24662. doi: 10.1371/journal.pone.0024662
56. Xu WS, Parmigiani RB, Marks PA. Histone deacetylase inhibitors: molecular mechanisms of action. Oncogene. (2007) 26:5541–52. doi: 10.1038/sj.onc.1210620
57. Almassalha LM, Tiwari A, Ruhoff PT, Stypula-Cyrus Y, Cherkezyan L, Matsuda H, et al. The global relationship between chromatin physical topology, fractal structure, and gene expression. Sci Rep. (2017) 7:41061. doi: 10.1038/srep41061
58. Marks PA. Discovery and development of SAHA as an anticancer agent. Oncogene. (2007) 26:1351–6. doi: 10.1038/sj.onc.1210204
59. Medstrand P. Retroelement distributions in the human genome: variations associated with age and proximity to genes. Genome Res. (2002) 12:1483–95. doi: 10.1101/gr.388902
60. Smit AF. Interspersed repeats and other mementos of transposable elements in mammalian genomes. Curr Opin Genet Dev. (1999) 9:657–63. doi: 10.1016/S0959-437X(99)00031-3
61. Mann BS, Johnson JR, Cohen MH, Justice R, Pazdur RFDA. Approval summary: vorinostat for treatment of advanced primary cutaneous T-cell lymphoma. Oncologist. (2007) 12:1247–52. doi: 10.1634/theoncologist.12-10-1247
62. Barbarotta L, Hurley K. Romidepsin for the treatment of peripheral T-cell lymphoma. J Adv Pract Oncol. 6:22–36. Available online at: http://www.ncbi.nlm.nih.gov/pubmed/26413372 (accessed October 7, 2021).
63. Archin NM, Bateson R, Tripathy MK, Crooks AM, Yang K-H, Dahl NP, et al. HIV-1 expression within resting CD4+ T cells after multiple doses of vorinostat. J Infect Dis. (2014) 210:728–35. doi: 10.1093/infdis/jiu155
64. Crooks AM, Bateson R, Cope AB, Dahl NP, Griggs MK, Kuruc JD, et al. Precise quantitation of the latent HIV-1 reservoir: implications for eradication strategies. J Infect Dis. (2015) 212:1361–5. doi: 10.1093/infdis/jiv218
65. Siliciano JD, Kajdas J, Finzi D, Quinn TC, Chadwick K, Margolick JB, et al. Long-term follow-up studies confirm the stability of the latent reservoir for HIV-1 in resting CD4+ T cells. Nat Med. (2003) 9:727–8. doi: 10.1038/nm880
66. Elsheikh MM, Tang Y, Li D, Jiang G. Deep latency: A new insight into a functional HIV cure. EBioMedicine. (2019) 45:624–9. doi: 10.1016/j.ebiom.2019.06.020
67. Delannoy A, Poirier M, Bell B. Cat and mouse: HIV transcription in latency, immune evasion and cure/remission strategies. Viruses. (2019) 11:269. doi: 10.3390/v11030269
68. Gonzalez-Hernandez MJ, Swanson MD, Contreras-Galindo R, Cookinham S, King SR, Noel RJ, et al. Expression of human endogenous retrovirus type K (HML-2) is activated by the tat protein of HIV-1. J Virol. (2012) 86:7790–805. doi: 10.1128/jvi.07215-11
69. Shin W, Lee J, Son S-Y, Ahn K, Kim H-S, Han K. Human-specific HERV-K insertion causes genomic variations in the human genome. PLoS ONE. (2013) 8:e60605. doi: 10.1371/journal.pone.0060605
70. Bradley JR, Pober JS. Tumor necrosis factor receptor-associated factors (TRAFs). Oncogene. (2001) 20:6482–91. doi: 10.1038/sj.onc.1204788
71. Borghi A, Verstrepen L, Beyaert R. TRAF2 multitasking in TNF receptor-induced signaling to NF-κB, MAP kinases and cell death. Biochem Pharmacol. (2016) 116:1–10. doi: 10.1016/j.bcp.2016.03.009
72. Wajant H, Henkler F, Scheurich P. The TNF-receptor-associated factor family. Cell Signal. (2001) 13:389–400. doi: 10.1016/S0898-6568(01)00160-7
73. Khan KA, Abbas W, Varin A, Kumar A, Di Martino V, Dichamp I, et al. HIV-1 Nef interacts with HCV core, recruits TRAF2, TRAF5 and TRAF6, and stimulates HIV-1 replication in macrophages. J Innate Immun. (2013) 5:639–56. doi: 10.1159/000350517
74. Krapp C, Hotter D, Gawanbacht A, McLaren PJ, Kluge SF, Stürzel CM, et al. Guanylate Binding Protein (GBP) 5 is an interferon-inducible inhibitor of HIV-1 infectivity. Cell Host Microbe. (2016) 19:504–14. doi: 10.1016/j.chom.2016.02.019
75. Feng J, Cao Z, Wang L, Wan Y, Peng N, Wang Q, et al. Inducible GBP5 mediates the antiviral response via interferon-related pathways during influenza A virus infection. J Innate Immun. (2017) 9:419–35. doi: 10.1159/000460294
76. Manghera M, Ferguson-Parry J, Lin R, Douville RN. NF-κB and IRF1 induce endogenous retrovirus k expression via interferon-stimulated response elements in its 5′ long terminal repeat. J Virol. (2016) 90:9338–49. doi: 10.1128/JVI.01503-16
77. Mameli G, Poddighe L, Mei A, Uleri E, Sotgiu S, Serra C, et al. expression and activation by epstein barr virus of human endogenous retroviruses inference for multiple-W in blood cells and astrocytes: sclerosis. PLoS ONE. (2012) 7:e44991. doi: 10.1371/journal.pone.0044991
78. Liu C, Liu L, Wang X, Liu Y, Wang M, Zhu F, et al. Protein induces overexpression of HERV-W env through NF-κB in HepG2 cells. Virus Genes. (2017) 53:797–806. doi: 10.1007/s11262-017-1479-2
79. Gonzalez-Hernandez MJ, Swanson MD, Contreras-Galindo R, Cookinham S, King SR, Noel RJ, et al. Expression of human endogenous retrovirus type K (HML-2) is activated by the tat protein of HIV-1. J Virol. (2012) 86:7790–805. doi: 10.1128/JVI.07215-11
80. Garrison KE, Jones RB, Meiklejohn DA, Anwar N, Ndhlovu LC, Chapman JM, et al. T cell responses to human endogenous retroviruses in HIV-1 infection. PLoS Pathog. (2007) 3:e165. doi: 10.1371/journal.ppat.0030165
81. Ormsby CE, SenGupta D, Tandon R, Deeks SG, Martin JN, Jones RB, et al. Human endogenous retrovirus expression is inversely associated with chronic immune activation in HIV-1 infection. PLoS ONE. (2012) 7:e41021. doi: 10.1371/journal.pone.0041021
Keywords: retroelement, HDAC inhibitor, HIV, shock and kill, CD4 T-cell
Citation: Curty G, Iñiguez LP, Nixon DF, Soares MA and de Mulder Rougvie M (2021) Hallmarks of Retroelement Expression in T-Cells Treated With HDAC Inhibitors. Front. Virol. 1:756635. doi: 10.3389/fviro.2021.756635
Received: 10 August 2021; Accepted: 30 September 2021;
Published: 25 October 2021.
Edited by:
Masaaki Miyazawa, Kindai University, JapanReviewed by:
William P. Lynch, Northeast Ohio Medical University, United StatesCamilla Tincati, University of Milan, Italy
Copyright © 2021 Curty, Iñiguez, Nixon, Soares and de Mulder Rougvie. This is an open-access article distributed under the terms of the Creative Commons Attribution License (CC BY). The use, distribution or reproduction in other forums is permitted, provided the original author(s) and the copyright owner(s) are credited and that the original publication in this journal is cited, in accordance with accepted academic practice. No use, distribution or reproduction is permitted which does not comply with these terms.
*Correspondence: Miguel de Mulder Rougvie, mid2034@med.cornell.edu