Deconstructing Diets: The Role of Wealth, Farming System, and Landscape Context in Shaping Rural Diets in Ethiopia
 Laura Vang Rasmussen
 Sylvia L. R. Wood
 Jeanine M. Rhemtulla
- 1Department of Forest and Conservation Sciences, Faculty of Forestry, University of British Columbia, Vancouver, BC, Canada
- 2Department of Geosciences and Natural Resource Management, The University of Copenhagen, Copenhagen, Denmark
- 3Institut de la Science des Forêts Tempéree, University de Québec en Outaouais, Ripon, QC, Canada
Dietary diversification is central to improving dietary quality and nutrition for food security. Several factors have been linked to higher diversity diets, including household wealth, market access, on-farm crop diversity, and regional forest cover. How these factors combine in landscapes to shape diets, however, is not well-understood. We take the Ethiopian context as a case study of how wealth, farming system type, and landscape context interact to explain household dietary profiles. Using cluster analysis on nationally representative data on household food consumption, we identify three distinct dietary profiles across rural Ethiopia: (1) A low diversity diet, (2) A diverse diet particularly rich in fruit and vegetables, and (3) A diverse diet also rich in oils, fats, and sugars. We find that the low diversity diet was strongly associated with households in the bottom and middle wealth classes that were mostly involved in cereal-based farming, although not exclusively. In contrast, the diverse diet high in fruit and vegetables was primarily composed of households with coffee-agroforestry farming systems, and did not appear to be limited to any particular wealth class, although it was positively associated with forest cover. Households with a diverse diet profile also rich in oils, fats and sugars were stratified across multiple different farming types, situated closer to roads, and primarily came from the middle and top wealth classes. Finally, while forest cover was strongly associated with a dietary profile rich in fruits and vegetable and the pursuit of coffee-agroforestry farming, the forest cover in cereal-based systems was still significantly positively associated with the consumption of dark green leafy vegetables and fruits. This suggests that even small amounts of forest cover can contribute to healthy diets. These results, which illuminate how wealth, farming system type, and landscape context shape dietary profiles, have important implications for the design of effective food security policies in Ethiopia.
Introduction
Globally, more than two billion people suffer from micronutrient deficiencies caused by poor diets (Haddad et al., 2015), which can impair childhood development and adult productivity (Lim et al., 2012; Black et al., 2013). The challenge is particularly severe in Africa where poor investments in agriculture have led to large yield gaps (Tittonell and Giller, 2013), limited processing and storage facilities, low income levels, and inadequate consumer understanding of micronutrient deficiencies (Barrett and Bevis, 2015). To date, most large-scale food security policies and funding efforts have placed heavy emphasis on meeting basic dietary energy intake by increasing the production and availability of staple crops (World Health Organization, 2005; Forouzanfar et al., 2016), with less attention to the nutritional constituents of diets (Ickowitz et al., 2019). While such efforts have reduced the proportion of hungry people globally (FAO, 2018), the current global agricultural system does not provide the foods necessary for nutritionally adequate diets (Ickowitz et al., 2019; Willett et al., 2019). Reasons include policy interventions that trigger a shift away from diversified agricultural production and consumption to cash crop monocultures, which can negatively impact the nutritional quality of diets (Siegel et al., 2014; Powell et al., 2015; Qaim et al., 2016; Qaim and Sibhatu, 2018). Moreover, agricultural expansion and conventional intensification are often associated with deforestation (Angelsen and Kaimowitz, 2001; Ordway et al., 2017; Curtis et al., 2018), which can reduce dietary diversity by decreasing the availability of wild foods (Rowland et al., 2016; Galway et al., 2018) and other forest products that can be sold to enable the purchase of diverse foods (Hickey et al., 2016).
Nutritionally, “better” diets include the consumption of multiple different types of foods, as they are more likely to meet human macro- and micro-nutrient requirements (Hall et al., 2009; Lachat et al., 2018). In response, food security programs are now placing focus on dietary diversification as a key strategy to improve dietary quality and nutrition (e.g., Dube et al., 2018; Ochieng et al., 2018; Schreinemachers et al., 2018). However, the factors that lead households to consume a diverse diet are not well-understood, even though such understanding is critical for designing effective food security and nutrition policies. Higher diversity diets have been linked to a number of household characteristics including the level of education, age and gender of the head of the household, as well as household size and household wealth (Cockx et al., 2018). Dietary diversity has also been associated with market access (Sibhatu et al., 2015; Qaim et al., 2016), on-farm production—whereby farm diversification is assumed to lead to the consumption of more diverse diets (Jones et al., 2014; Sibhatu and Qaim, 2018)—as well as regional forest cover (Ickowitz et al., 2014). Recent studies have demonstrated that tree cover in landscapes positively correlates with dietary diversity as well as the consumption of nutritionally important food groups in African countries (Ickowitz et al., 2014; Rasmussen et al., 2019). However, how these factors (household characteristics, market access, on farm production, and landscape context) combine to shape diets is not well-understood, especially the mechanisms whereby forests support more diverse diets.
Previous studies assessing how diets are influenced by farm production diversification have mostly relied on simple measures of crop diversity, such as counts of the total number of crop and livestock species on a farm (Sibhatu et al., 2015). Yet, the identity and relative proportion of each species may also be critically important to understanding their relation to diets. Smallholders' diets benefit differently from on-farm production of food crops (which can be directly eaten) vs. both food and non-food cash crops (which generate income that can be used to purchase food) (Jones, 2016). Crops also vary in their nutritional characteristics; for example, dark green leafy vegetables are an important source of iron, calcium and fiber, while red peppers, carrots, and pumpkins are critical for vitamin A. Similarly, cows, sheep, and goats provide dairy, whereas chickens, ducks, and other fowl provide eggs in addition to meat protein. Thus, farming systems that grow a diversity of similar crops (e.g., wheat, teff, maize, sorghum) will contribute less to dietary quality than farming systems with a diverse array of different fruits, vegetables, grains, etc. Assessing the linkages between on-farm production and households' dietary diversity thus requires a more nuanced characterization of on-farm crop and livestock diversity.
Many low- and middle-income countries are currently in the midst of a nutrition transition where traditional diverse diets (rich in e.g., vegetables and fruits) are being replaced with poorer quality diets excessive in fats and oils, and sugar (Abrahams et al., 2011; Steyn and Mchiza, 2014; Cockx et al., 2018). Improving our understanding of the factors associated with different dietary profiles will enable the design of efficient multi-pronged strategies that aim to achieve food security and nutrition goals. Moreover, a better understanding of how forests impact diets can shape agricultural policies that are better integrated with forest conservation and restoration targets (Sunderland et al., 2019).
The objectives of this study are to examine how wealth, farming system type, and landscape context interact and influence the diets of rural households across Ethiopia. Specifically we aim to: (i) identify the predominant dietary profiles of households across rural Ethiopia; (ii) develop farm typologies based on household agricultural production data to move beyond simple species counts; (iii) compare how households' wealth status and farming system type relate to their dietary profile; and (iv) identify whether the landscape context (forest cover and market access) is associated with the consumption of different food groups and food items.
Methods
Constructing Dietary Profiles and Measuring Dietary Quality
We used publically available data from the World Bank's Living Standard Measurement Survey (LSMS) (http://microdata.worldbank.org/index.php/catalog/lsms) conducted in Ethiopia in 2015–2016 to build dietary profiles. The LSMS is a nationally representative household survey that collects a wide array of livelihood data, including details on farm-level crop production and livestock holdings, asset ownership and food consumption records. We focused our analysis on the diets of rural households and extracted data for the 2633 households surveyed in rural areas. Our final sample (n = 2367 rural households) excluded households for which farm production, food consumption, geo-location data, or asset data were missing, as complete information on each household was required in our analysis.
We used reported household food consumption (binary variable of consumption/no consumption over the past 7 days of 69 different food items (see Figure 1) from the LSMS to construct dietary profiles across rural households in Ethiopia. The LSMS dataset offers advantages over other similar sources of data (e.g., DHS, see Ickowitz et al., 2014), including: large sample sizes, extensive data on a diverse set of non-diet variables, and a disaggregated record of many individual foods, which permits the calculation of different dietary diversity scores (FAO and FHI 360, 2016). It also permits the construction of dietary profiles based on food items rather than aggregated food groups, allowing for an enhanced understanding of which food items contribute frequently to each food group in diets.
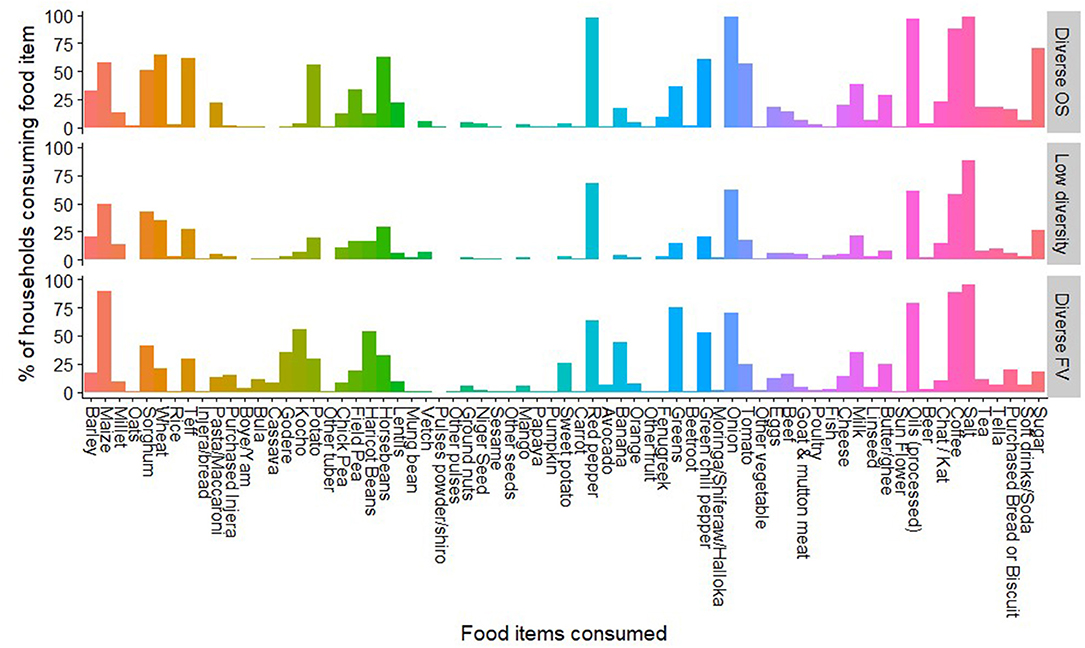
Figure 1. Percentage of households reporting the consumption of various food items within the past 7 days for each of the three identified Dietary Profiles. N = 2367 rural households. OS, Oils and Sugars; FV, Fruits and Vegetables.
Following Alvarez et al. (2018), we used a principal component analysis (PCA) and hierarchical clustering analysis (HCA) on the list of consumed food items (presence/absence) reported in the 7-day recall by each household to construct a typology of dietary profiles (sensu Hu, 2002). We used a PCA to reduce the full list of reported food items (n = 69, see Figure 1) consumed by each household into a smaller number (n = 5) of synthetic but orthogonal variables, i.e., principal components (PC). In our analysis the first PC explained 50% of the total variance and the second an additional 5% (for a factor map of food items contributing most to the first two PC see Figure S1). We then applied Agglomerative Hierarchical Clustering to the household's PC scores using Ward's minimum-variance method to identify diet clusters, which we hereafter refer to as “dietary profiles.” Ward's method was chosen as it builds clusters by minimizing within-cluster variation through iterative comparison amongst clusters using the calculated sum of squares between the two clusters, summed over all variables (Hair et al., 2010). The appropriate number of clusters (i.e., dietary profiles) was defined using the dendrogram shape. All statistical analyses were executed in R (version 3.1.0, ade4 package, Dray and Dufour, 2007).
We then characterized each of the identified dietary profiles in terms of the percentage of households with that dietary profile consuming specific food items and/or food groups. We calculated a mean dietary diversity score for households within each dietary profile. Dietary diversity is defined as the number of food groups consumed over a fixed period (generally ranging from 24 h to 7 days). At individual level, dietary diversity is a proxy for micronutrient adequacy of the diet (Arimond et al., 2010) which is one aspect of diet quality. Household diets are highly correlated with individual diets, yet household-level diet diversity does not account for intra-household distribution and can not be used for statements concerning particular population groups, such as women (Verger et al., 2019). As the LSMS records food consumption at the household level rather than the individual level, we constructed a modified household dietary diversity score (MHHDS) using the ten food groups recommended to construct MDD-W (Minimum Diet Diversity of Women) (FAO and FHI 360, 2016) but based on a recall of the past 7 days. The MHHDDS includes the following food groups: (1) starchy staple foods (cereals, white roots, tubers, plantains), (2) vitamin A-rich vegetables and fruits, (3) dark green leafy vegetables, (4) pulses (beans and peas), (5) nuts and seeds, (6) flesh foods (meat, poultry and fish), (7) dairy, (8) eggs, (9) other vegetables, and (10) other fruits (FAO and FHI 360, 2016). In addition to the food groups included in the MHHDDS, we also compared the consumption of sweets, oils and fats, but these food groups were not included in the calculation of the MHHDDS.
Developing Farming Systems Typologies
What households produce is known to influence their diets (Jones et al., 2014; Jones, 2015, 2016, 2017). To move beyond the influence of crop counts on diets, we used the LSMS data on household farm crop production and livestock holdings to develop farm typologies across Ethiopia using cluster analysis. We based the analysis on relative production of each crop and livestock species (calculated separately). From the surveyed households in the LSMS data we identified 187 unique crop and 10 livestock species. We converted reported crop production into common units of mass (kg), and livestock into Tropical Livestock Units (TLU) based on conversions developed by Gryseels (1988) for the Ethiopian context. We extracted data on elevation [from the MODIS digital elevation model (250 m resolution)] and annual mean precipitation [from Worldclim.org (Fick and Hijmans, 2017)] using geo-location data from the LSMS and included these with agricultural production data in the cluster analysis. We used a Hierarchical Cluster Analysis based on euclidean distances to group farms based on these characteristics and assessed the appropriate number of clusters based on the dendrogram and in discussion with experts familiar with farming systems in Ethiopia (F. Baudron, B. Powell).
Co-Variates Expected to Influence Dietary Profiles
Wealth Groups
While wealthier households may be better able to purchase costly nutrient-rich foods, which can improve diets and lead to higher dietary diversity (Sibhatu et al., 2015), scholars have also argued that nutritional outcomes do not necessarily improve with higher incomes (Herforth and Ahmed, 2015). To evaluate the association between wealth and diets, we constructed an asset-based wealth score as a proxy for households' long-term economic status. Following the approach of Filmer and Pritchett (2001), we dichotomized all household assets to indicate whether or not each household owned each of the assets listed (see Table S1 for list of assets included in the analysis). In addition, the type of roofing material and toilet facilities were likewise dichotomized [1=Modern, 0=Non-modern (no toilet or shared facilities)]. We then applied a PCA to the dichotomized data (ownership/no ownership) with the first PC used to compute wealth quintiles (the higher the value, the wealthier the household is), which were then re-coded into three wealth groups: bottom (1st and 2nd quintile), middle (3 and 4th quintile), and top wealth class (5th quintile). We used this grouping over the use of equally sized terciles to better distinguish the more wealthy households from the generally low asset levels that characterizes much of the population in Ethiopia. We chose an asset-based score rather than an income based metric as the former has been shown to be a good proxy for the wealth of a household over time and is less susceptible to measurement error (Hjelm et al., 2016). Moreover, metrics such as proportion of income spent on food might be problematic as households tend to spend proportionally less on food as their disposable income increases (Smith et al., 2014).
Landscape Variables (Forest Cover and Market Access)
Landscape elements surrounding a household can influence both their dietary opportunities (Ickowitz et al., 2014; Galway et al., 2018; Rasolofoson et al., 2018) and their farming system (Baudron et al., 2017). To characterize local landscapes, we obtained data on forest cover in 2016 (the year of the LSMS) from a publicly available 30 m resolution annual global tree cover dataset from 2000 to 2016 (Hansen et al., 2013). We downloaded tiles covering the spatial extent of Ethiopia and derived tree cover by masking water, adding forest cover gain and subtracting forest cover loss from the base year 2000. The data show the percentage tree cover in each pixel with trees defined as vegetation taller than 5 m. To create a forest cover map, we classified each pixel to a binary forest/no forest classification, using a “forest” threshold definition of 30%. We tried other threshold definitions [10 and 60%, based on common thresholds used by the United Nations Food and Agricultural Organization and United Nations Framework Convention on Climate Change (FAO, 2000, 2005)] and chose 30% as it resulted in forest cover maps that best matched national land cover maps.
To ensure confidentiality, the LSMS does not provide geo-locations for individual households, but rather for their corresponding “enumerator area” (in most cases corresponding to a village). Ninety-nine percent of the geo-referenced points for enumerator area locations are randomly displaced by 0–5 km. The remaining 1% of enumerator areas are displaced up to a maximum of 10 km. We constructed a 10 km radius circle surrounding each enumerator area to account for this random spatial displacement as well as to capture a reasonable distance that people are likely to travel for hunting and collecting wild foods (Layton et al., 1991). We used Fragstats 4.2 (McGarigal et al., 2002) to extract percentage forest within each 10 km radius circle around villages. Finally, we also extracted data from the LSMS on the distance to nearest major road and major population centers (>20,000 inhabitants), which act as proxies for market access, for each enumerator area.
Analyses
Based on a comparison of the proportion of households consuming each food item, we used one-way ANOVAs to identify key foods within food groups that were responsible for driving differences in intake patterns between the dietary profiles. We also used separate one-way ANOVAs to compare the (a) MHHDDS and (b) proportion of households consuming each food group over the past 7 days between the three identified dietary profiles. We used Chi-square analysis to test whether the dietary profiles were related to asset-based wealth classes or farming systems.
We also tested the associations between household's dietary profile and (a) the percentage of forest in the surrounding landscape and (b) their farming system through separate one-way ANOVAs. We further tested for a relationship between the percentage of forest and (c) MHHDDS and (d) their consumption (0 or 1) of each food group over the prior 7 days. For (c) and (d), we used generalized linear mixed models (GLMMs) from the “nlme” package (for binomial data) in R (Pinheiro et al., 2018) with the enumerator area as our random effect. We included explanatory covariates previously identified by Rasmussen et al. (2019) as important predictors of diet outcomes in Ethiopia, namely the age, gender, and highest education level of the head of the household, household wealth class, the distance to nearest major road as well as annual mean temperature and rainfall. We used both a pairwise correlation matrix as well as the Variance Inflation Factor (VIF) to assess potential collinearity among the independent variables included in our models after fitting regressions. Variables were removed if the correlation coefficient was >0.5 and/or if VIF exceeded a value of 10. A full model including all covariates was run, and results from these models are reported in Table S3 (MHHDDS as outcome variable), S4a-f (Consumption of various food groups as outcome variables), and S6a-b (consumption of oils and fats, and sweets as outcome variables). All analyses were carried out in the software R 3.4.2 (R Core Team, 2017).
Results
Identification of Dietary Profiles
Using cluster analysis on food consumption data we identified three distinct dietary profiles across Ethiopia. We characterized dietary profiles based on the food items composing each of these diets (Figure 1) and statistical differences amongst the dietary profiles (Tables 1, 2). The three identified profiles were:
1. “Diverse Diet High in Oils and Sugars” (hereafter referred to as “Diverse OS”) was the smallest cluster and included 720 households (30%). It was composed of households who—in an Ethiopian context—had a relatively high average MHHDDS of 5.4. This diet had particularly high consumption of pulses, vitamin A-rich fruits and vegetables and other vegetables (e.g., onion), as well as more widespread consumption of eggs than the other dietary profiles. Beyond the consumption of the 10 food groups included in the calculation of the MHHDDS, this dietary profile had a significantly higher rate of households consuming oils and fats (97%) and sugars (71%) (Table 2). Also, there was a higher rate of households consuming processed foods such as pasta/macaroni (22%) as compared to the two other dietary profiles. The main staple food consumed in this diet was wheat (65% of households). Unlike the two other dietary profiles, almost all households with this profile consumed at least one food item classified as a vitamin A-rich vegetable or fruit, with the most commonly consumed item being red peppers (97%).
2. “Low Diversity Diet” was the most widespread dietary profile with 1052 households (44%). The distinguishing feature of this profile was the low mean MHHDDS of 3.8, which was significantly lower than the other two dietary profiles (p < 0.001). This diet was characterized by a reliance on maize as the staple crop (49% of households in this profile) and a generally lower proportion of households consuming most food groups than the other two dietary profiles. A lower consumption rate across all food groups—except one—suggests that it may also be a lower intake diet. The one exception was that a higher proportion of households consumed sugary food items than in the Diverse FV diet (described below).
3. “Diverse Diets High in Fruits and Vegetables” (hereafter ‘Diverse FV’) included 861 households (36%). This dietary profile had the highest mean MHHDDS of 5.5 and maize was the most commonly consumed staple crop (90% of households), although sorghum, wheat and teff were also consumed by some households. Of the 10 food groups included in the MHHDDS, this diet had a high proportion of households consuming dark green leafy vegetables, vitamin A-rich foods, as well as “other fruits” and “other vegetables”. In particular, this diet was characterized by a greater proportion of households consuming greens (75%), haricot beans (54%), vitamin A-rich sweet potato (26%), and banana (44%) compared to the other dietary profiles. In contrast to the Diverse OS diet, which also exhibited a high MHHDDS, fewer households following a Diverse FV diet consumed processed foods such as sugar (18%) and pasta/macaroni (13%).
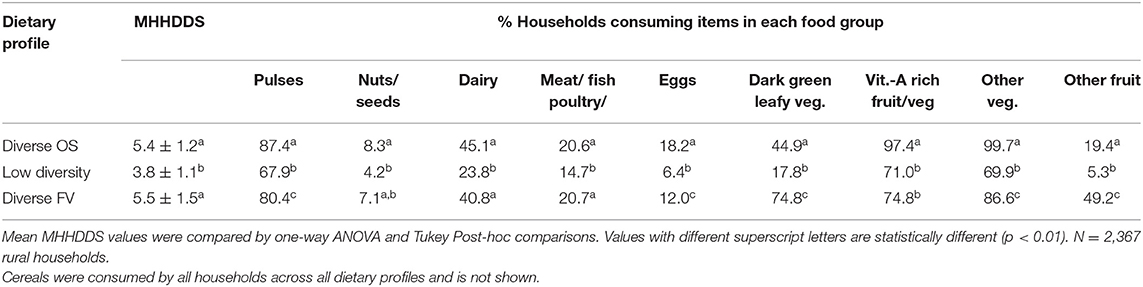
Table 1. The mean Modified Household Dietary Diversity Score (MHHDDS±SE) and the percentage of households that consumed each food group of the households following each dietary profile.
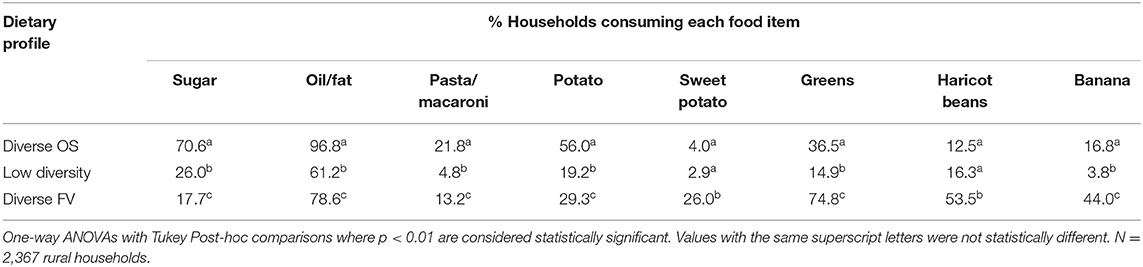
Table 2. Percentage of households consuming various food items within the past 7 days by dietary profile.
Spatial Co-Occurrence of Dietary Profiles
The three dietary profiles were not evenly distributed spatially across Ethiopia (Figure 2). Households following the Diverse FV dietary profile were mainly located in the southwest of the country, while households following the Diverse OS or Low Diversity dietary profile were spread across the north and east of the country, with a few located along the borders with Sudan to the west and Kenya to the south.
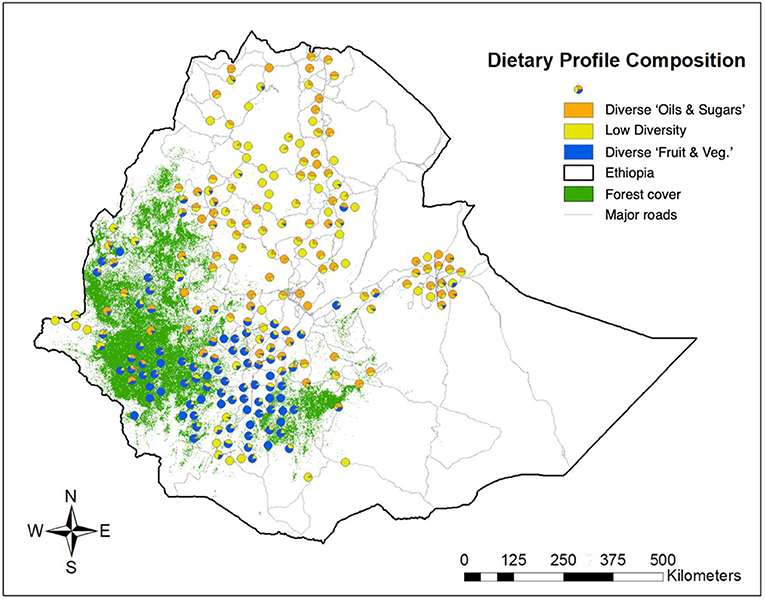
Figure 2. The geographic distribution of the three household dietary profiles across Ethiopia. The World Bank's LSMS used an enumerator area (mostly corresponding to a village) as the geographical sampling unit. The pie-chart represents the percentage of households following each dietary profile within each enumerator area.
We also assessed the co-occurrence of dietary profiles within villages to determine if particular pairs of profiles more commonly co-occur. In 23% of villages (n = 53), all surveyed households followed a single common dietary profile; the most frequent being the Low Diversity diet (n = 30). In 58% of villages (n = 134), we found two co-occurring dietary profiles, with the most frequent combination being the Diverse OS—Low Diversity in 67 villages, followed by Low Diversity—Diverse FV in 51 villages. In only 16 villages did Diverse OS-Diverse FV co-occur. The three dietary profiles co-occurred in 19% of the villages examined (n = 45).
Mean values and one-way ANOVA: Tukey Post-hoc comparisons with p < 0.01 considered statistically significant. Mean values with the same superscript letters were not statistically different.
Identification of Farm System Types
Ethiopia is characterized by large gradients in elevation and precipitation, which have, in part, contributed to the rise of many different farming systems (Amede et al., 2017). Using a clustering approach we identified 7 farming system types based on the relative production of crops grown and livestock species owned as well as annual mean precipitation and elevation (Figure 3, Table 3, as well as Figure S2 and Table S2). These corresponded well with, though were coarser than, the 16 farming systems identified in Ethiopia by Amede et al. (2017). Two of these farming system types were focused on low to mid-elevation sorghum production with an average crop diversity of 4.41 and 4.26 per farm; two were based on low to mid-elevation coffee agroforestry and had the highest crop diversity with 7.10 and 6.88 crops per farm; two were characterized by high elevation mixed cereal production with an average of 4.43 and 6.0 crops per farm; and one was based on lowland maize with an average of 2.35 crops per farm. All farming system types had on average between 2.2 and 3.6 different types of livestock on farm with the Lowland maize type having the fewest and highland cereal producers having the most.
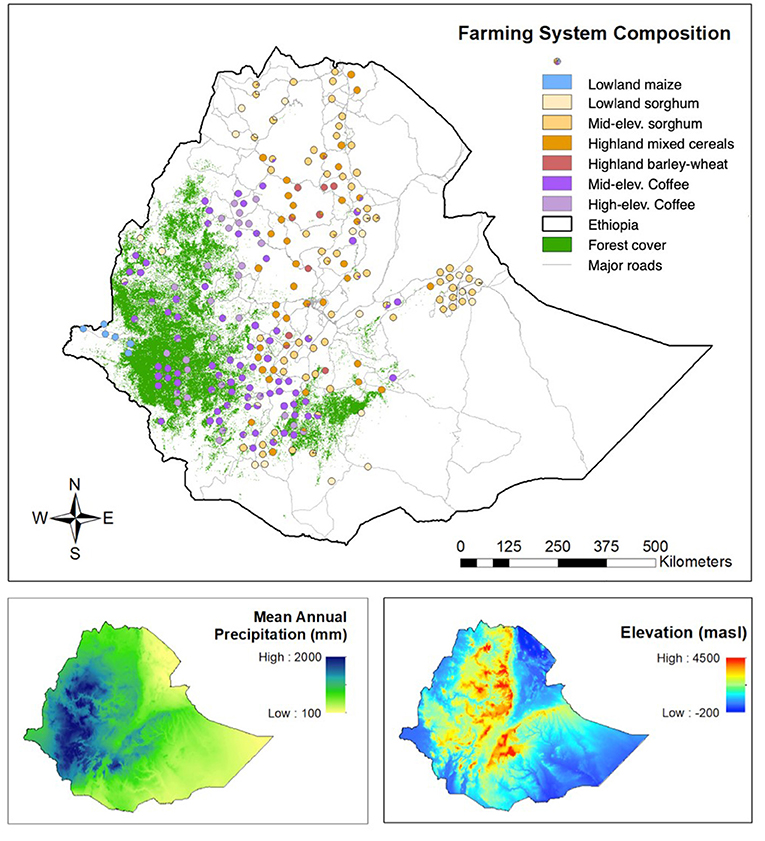
Figure 3. Geographic distribution of the seven farming system types across Ethiopia. The World Bank's LSMS used an enumerator area (mostly corresponding to a village) as the geographical sampling unit. The pie-chart represents the percentage of households engaged in each farming system type within each enumerator area. The bottom left panel shows the mean annual precipitation (mm) across the country, while the bottom right panel shows the elevation (masl).
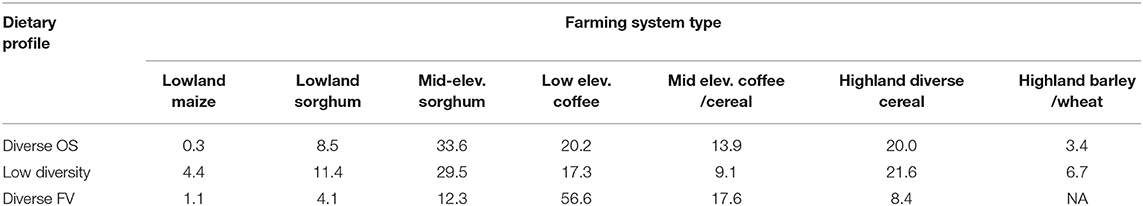
Table 3. Distribution (%) of household dietary profiles across 7 different farming system types.
Factors Associated With Dietary Profiles
Farm System Type
There is a significant association between households' dietary profiles and the types of farming they pursue (X2 = 523.43, df = 12, p < 0.001). Households with the Diverse FV dietary profile are predominantly coffee-agroforestry farmers (74%), with a small percentage pursuing mid-elevation sorghum production (12%) (Table 3). The Low Diversity diet households also pursue coffee agroforestry (26%), albeit to a much lesser extent. Rather, they are more engaged in low and mid-elevation sorghum production (41%) and high-elevation diverse cereal production (22%). The lowland maize as well as highland barley-wheat system types are almost primarily represented by households with the Low Diversity dietary profile. Finally, households with the Diverse OS dietary profile are stratified across sorghum, coffee and diverse cereal production systems.
Wealth
We found a significant relationship between households' dietary profile and their asset-based wealth class (X2= 204.78, df = 4, p < 0.001). Given that we had uneven numbers of households per wealth class due to our chosen classification of wealth, we looked at the relative percentage of households per wealth class following a particular dietary profile (Table 4). We found that while 49% of the households in the bottom wealth class followed the Low Diversity diet, only 14% followed a Diverse OS diet. In contrast, of the households in the top wealth class, 45% followed a Diverse OS diet and 35% a Diverse FV diet, with only 20% consuming a Low Diversity diet. Households in the middle wealth class were equally likely to follow any of the three dietary profiles. Together these results suggest that high-income households are more likely to consume higher diversity diets, while lower diversity diets are more often consumed by households in the bottom wealth group. An important caveat is that, 37% of households in the bottom wealth class followed a Diverse FV diet, suggesting that this dietary profile was not exclusive to wealthier households.
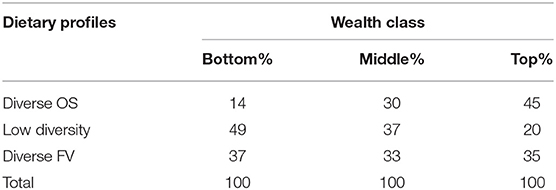
Table 4. Percentage of households across wealth classes following each identified dietary profile.
Landscape Context
Finally, we explored how the landscape elements surrounding a household were associated with their dietary profile using one-way ANOVAs (Table 5). We found that households with a Diverse FV dietary profile had a significantly higher proportion of forest (35%) in a 10 km radius circle surrounding their villages than households with the Diverse OS or Low Diversity dietary profile, which both had <10% forest cover. Also, the Diverse FV dietary profile was generally found in areas of higher mean annual precipitation and lower elevation as compared to the other two dietary profiles. These trends are consistent with the finding that many households with this dietary profile were involved in coffee-agroforestry farming systems, where coffee was grown in tropical moist mountain forests (1,000–2,000 masl). Interestingly, we also found that households following a Diverse OS diet tended to have (a) significantly shorter distances to major roads than the other households, and b) the average shortest distance to major population centers (i.e., markets). These observations suggest that the availability of processed foods might be higher for these households. Moreover, households following a Low Diversity diet were found furthest from roads and major population centers (i.e., they were likely more disconnected from markets), which might also partly explain the lower wealth associated with this group.
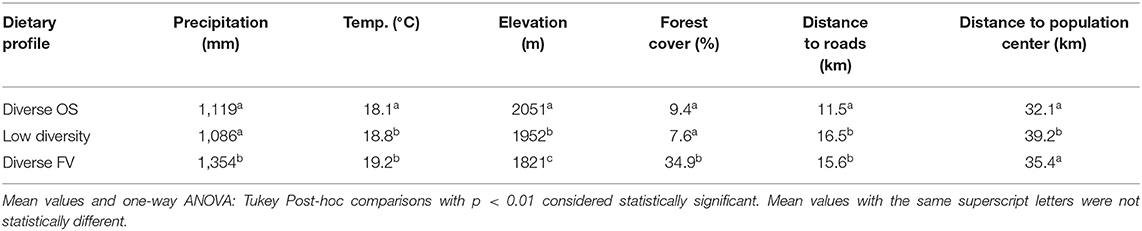
Table 5. Landscape variables expected to influence dietary profiles.
In order to tease apart whether forest cover has an impact on diet, independent of forest-based farming systems, we looked at those households in cereal-based farming systems only—i.e., we excluded households engaged in agro-forestry farming systems where the cultivated trees on farm might be counted as forest. Using a linear mixed model, with the enumerator areas as our random effect, we found no significant association between forest cover and MHHDDS (p = 0.86), controlling for significant covariates (household size, age and gender of the household head, and wealth class, all p < 0.05, Table S3). When we used households' consumption of individual food groups as our binary response variable, we found a positive relationship between the proportion of forest in the landscape and a household's consumption of dark green leafy vegetables (p < 0.005), and “other fruits” (p < 0.05), controlling for the covariates shown to influence dietary patterns (see Tables S4A–F for model results). The estimate sizes from these models suggest that for each additional percentage of forest in the 10 km radius circle surrounding a household, the odds of consuming dark green leafy vegetables increases by 3.8%, while the increase was 2.2% for other fruits. We also found a negative relationship between forest cover and the consumption of vitamin A-rich vegetables and fruits (p < 0.1) which would result in a 2.2% decrease in the odds of consuming this food group with one additional percentage forest cover. Testing the influence of distance to nearest major road with the full dataset of households, distance was not a significant predictor of the MHHDDS (Table S5), nor was it related to the probability of consuming “oils and fats” or sweets (Table S6). Consumption of these foods were only significantly predicted by household wealth (p < 0.001, Tables S6A,B) and age in the case of sweets (p < 0.05, Table S6B).
How Farming System Type, Wealth, and Landscape Context Shape Diets
To visualize these identified relations we plotted an alluvial flow diagram (Figure 4) tracing the number of households from the three wealth classes (bottom, middle, and top wealth) that followed each of the three identified dietary profiles. The figure also traces the breakdown of dietary profiles across the seven farming system types.
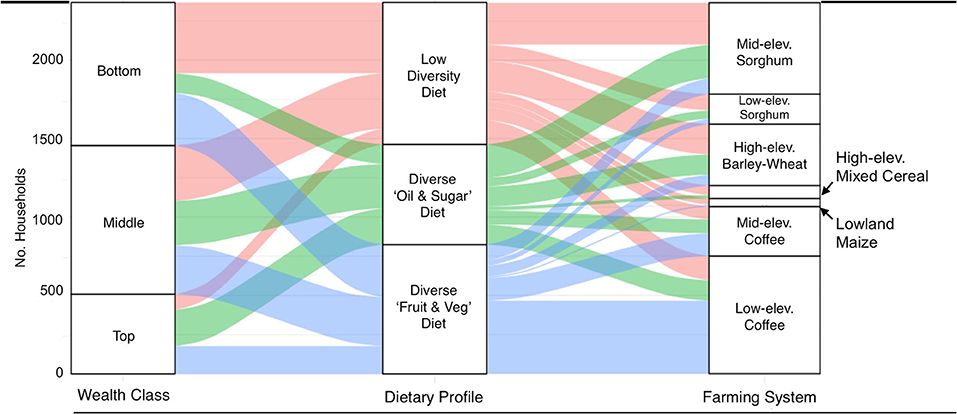
Figure 4. Alluvial flow diagram showing the (left-hand side) breakdown in the numbers of households from the bottom, middle, and top wealth classes with a Low Diversity (pink), Diverse OS (green) and Diverse FV (blue) diet profile, and (right-hand side) the breakdown in the number of households from different farming systems in each diet profile.
Looking across the wealth class and farming systems, we see that although the Low Diversity dietary profile was made up of streamlines emanating mostly from the bottom and middle wealth classes (left-hand side of figure), it was not restricted to a particular farming system type (right hand side of figure). In other words, the Low Diversity profile seems to reflect the impact of poverty on diet rather than the farming system in place. In contrast, looking at the Diverse FV dietary profile, we see on the left-hand side that the streamlines are proportional (~30% of households) across the three wealth classes, while on the right-hand side of the panel, the streamlines from this diet flow primarily to low- and mid-elevation coffee systems. This might suggest that this dietary profile, high in fruits and vegetables is reflective more of the farming system type than the wealth of households. Finally, when looking at the Diverse OS diet profile the streamline coming from the top wealth class was relatively large as compared to the two other dietary profiles, and the streamlines to farming systems were more equally sized. This suggests that households pursuing this dietary profile were engaged in most types of farming systems, indicating that the diet was driven by wealth.
Discussion
To our knowledge, no previous studies have combined comprehensive assessments of dietary profiles and farming system types to identify how household characteristics, market access, on- farm production, and the landscape context combine to shape diets. We found that both household wealth and farming system type were associated with rural households' dietary patterns. Specifically, a low diversity diet was strongly associated with households in the bottom and middle wealth classes, while households with a diverse diet profile also rich in oils, fats and sugars primarily came from the middle and top wealth classes. By contrast, the pursuit of a diverse diet high in fruit and vegetables did not appear to be limited to any particular wealth class, and was primarily embraced by households with coffee-agroforestry farming systems.
Disentangling Wealth, Farm Systems, and Forest Cover
Our finding that approximately half of the households in the top wealth group consume a diverse diet also rich in fats, sugars and processed foods, is potentially suggestive of households in a “nutritional transition.” A nutritional transition is a phenomenon where increased economic development leads to the gradual replacement of traditional diets high in fiber and local crops by foods more reflective of a Western diet, such as processed foods high in oil and refined sugars (Popkin, 1993; Cockx et al., 2018). This transition can lead to overweight and obesity, with significant implications for health and the rates of non-communicable disease such as diabetes and hypertension (Popkin, 2001). Previous studies from Ethiopia have indicated a nutritional transition by showing (a) that poor diets and increasing rates of obesity are common in urban households (Amare et al., 2012; Tebekaw et al., 2014), and (b) a rise in the amount of sugar and foods cooked in oil over the past decade, though also an increase in the consumption of fruits and vegetables (Aurino et al., 2017).
In our study, although households with a Diverse OS diet live on average closer to roads (and by extension markets), we found that household wealth level, rather than distance predicted consumption of oil and sugar. When we look at the spatial distribution of households consuming the Diverse OS diet, we find that this consumption pattern often occurs alongside households engaged in the same farming systems, but who follow the Low Diversity diet indicating that wealth may be the key determining factor of diet in these landscapes. However, isolating the role of wealth from market access with these types of datasets is tricky. Many of the assets used to create the wealth classes depend on having access to products and materials from the market. Interestingly, in a small subset of villages we see that the Diverse OS and the Diverse FV dietary profiles co-exist within villages and farming systems, which are not linked to wealth. Thus, additional factors need to be considered in order to explain the drivers of dietary patterns in these situations. It is possible that social factors such as cultural or ethnic group (Labadarios et al., 2011), may help to explain why certain of the households adopt the Diverse OS diet, while others do not although they live and farm in the same settings. In summary, these findings advance the argument that nutritional outcomes do not necessarily improve with higher wealth, although greater income is clearly beneficial for households (Herforth and Ahmed, 2015).
We also find that the farming system type is strongly associated with diets. This is not surprising given that on average over the year, 58% of the calories consumed in farming households in Ethiopia come from on-farm production (Sibhatu and Qaim, 2018). To date, most studies examining the relationship between farming practices and diet have focused on simple measures of on-farm diversity, such as counts of crop and livestock species to explain diet composition. Such studies have found that increasing household production diversity on Ethiopian farms improves children's dietary diversity (Hirvonen and Hoddinott, 2017). Interestingly little attention has been placed on how the farming system type can influence and help to explain rural diets. Farming systems categorization typically describes farms according to the resource base, land management, and off-farm strategies (Tittonell et al., 2010), and may lend insight into the orientation of the farm (commercial vs. subsistence) and household dependence on certain crops. We find that the diverse dietary profile high in fruit and vegetables, Diverse FV, is primarily composed of households with coffee-agroforestry farming systems. Coffee-agroforestry is both the most crop diverse of the farming systems identified, and likely the most strongly market-oriented due to the focus around a cash-crop thereby providing cash income to farmers to purchase market foods. Thus, these farmers may benefit from a confluence of factors encouraging a diversified diet. Emerging research evidence from Ethiopia also suggests that households located closer to markets enjoy better diets (Stifel and Minten, 2017), and their food consumption is less dependent on their own agricultural production (Hoddinott et al., 2015; Hirvonen and Hoddinott, 2017).
Other studies examining the potential factors that might influence diet diversity have also found a positive relationship between dietary diversity and forest cover across Africa (Johnson et al., 2013; Ickowitz et al., 2014; Galway et al., 2018; Rasmussen et al., 2019), however the mechanisms underlying this relationship remain poorly resolved. Here we lend insight into this relationship by showing that diverse diets high in fruits and vegetables in Ethiopia are strongly associated with coffee-agroforestry farming, a system with high tree cover. In the other cereal-based farming systems, forest cover is also positively associated with the consumption of dark green leafy vegetables and fruits, suggesting that trees outside of farming systems still positively contribute to diets. Yet, understanding why diets are more diverse in these systems, whether through the direct consumption of forest foods, the sale of forest products, or higher on-farm crop diversity requires deeper analysis into whether the food found on household plates are sourced from the forest. Unfortunately, such an analysis is not feasible with the LSMS data.
Benefits of Assessing Diets at the Food Item Level
One of the most striking results from our study is that those households who consume a diversified diet, as per the methods used to calculate MHHDDS, do so in two very different ways. In the case of the Diverse FV profile, more households consume dark green leafy vegetables and “other fruit”; meanwhile households with a Diverse OS diet include pulses, eggs, vitamin A-rich foods and other vegetables in their diets, as well as oils, fats, and sugars which are not included in the calculation of the MHHDDS. This is only apparent when we look at the food items composing diets, as both diets result in a score of ~5.5, which we classify as “diverse” [although this value is low when compared to recent research from Malawi (Jones, 2016)]. These diets may have different nutrition and/or health related outcomes, however we were not able to test for this given data limitations. Although not considered in this study, looking at the number of food items within a food group that a household consumes may also provide insight into how robust or resilient the diet is to external stressors such as market or crop vagaries.
Knowledge gaps related to the factors explaining different dietary outcomes, not only arise from the sheer challenge of disentangling the influence of wealth, farming system type, and landscape context, but also from the relatively simplistic metrics used to assess dietary quality. While scholars have called for indicators of dietary quality that consider multiple dimensions to provide comprehensive assessments (Jones, 2017), the MHHDDS—which is widely applied to consumption surveys—is considered a common and useful measure to assess dietary diversity. Our joint use of MHHDDS and dietary profiles reveals, however, that eating a relatively diverse diet (high levels of MHHDDS) might also be associated with eating a greater variety of unhealthy food items. One reason for why scholars have focused relatively little on the composition of food items that people consume lies simply in the extensive nature of collecting food consumption data at the food item rather than the food group level. Yet, our results point to the need for a two-pronged approach—for example combining dietary diversity scores with additional information on household consumption of foods indicative of a nutrition transition (e.g., increased oils, sugars, processed foods)—to ensure that complementary dimensions of diet quality and diversity are included in dietary assessments. This seems advisable because dietary recommendations based solely on “eating a variety of foods” might fail to attend to whether people simultaneously consume both healthy food groups and less healthy food items.
While other work has found that dietary diversity can vary strongly with season in Ethiopia (Hoddinott et al., 2015; Abay and Hirvonen, 2017; Sibhatu and Qaim, 2018), our dietary profiles do not capture this variation. Almost all of the LSMS in Ethiopia were collected between December 2015 and February 2016, which coincides with the post-harvest season (Central Statistical Agency of Ethiopia, 2016). It is thus possible that our dietary profiles do not reflect consumption patterns common in other seasons, particularly the lean season in which wild foods may become more important (Cruz-Garcia and Price, 2014). In summary, future work in this field would benefit from stratified data collection efforts that (a) are carried out across seasons and (b) record the food provenance.
Conclusions
If we are to encourage policies to improve dietary quality, we also need a more sophisticated understanding of the factors that enable healthy diverse diets as compared to the factors that lead to either consumption of less healthy foods or low dietary diversity. This study shows, by drawing on a number of different datasets, how wealth, farming system type, and landscape context interact and influence the diets of rural households in Ethiopia. In particular, we found that a low diversity diet was strongly associated with households in the bottom and middle wealth classes that were primarily involved in cereal-based farming, although not exclusively. By contrast, our work shows that access to forests and coffee-agroforestry cultivation systems in Ethiopia are associated with diverse diets based on healthy food items, particularly vegetables and fruits. Given that the EAT-Lancet commission recently stated that the global consumption of fruits and vegetables (and nuts and legumes) will have to double to achieve health and environmental benefits (Willett et al., 2019), it is worrying that no attention is given to the role of forests in securing sufficient supply of these food groups. In terms of policy recommendations it is, however, neither feasible nor desirable for many cereal farmers to shift to coffee-agroforestry simply to achieve a higher quality diet. But our findings suggest that even small amounts of forest cover can contribute to diverse diets. Under the Bonn Challenge, Ethiopia has committed to forest landscape restoration across 15 million hectares of land [http://www.bonnchallenge.org/content/Ethiopia]; well-planned and implemented, such forest restoration can contribute to increasing food security in addition to other goals. Moreover, our findings show that households with a diverse diet profile also rich in oils, fats, and sugars primarily come from the middle and top wealth classes, which suggests that we should be cautious about the expectation that improved wealth leads to better nutritional outcomes. In summary, our work suggests that encouraging forest protection and restoration can help to reconcile goals of environmental protection and food security in tropical countries facing these combined pressures.
Data Availability Statement
Publicly available datasets were analyzed in this study. This data can be found here: https://microdata.worldbank.org/index.php/catalog.
Author Contributions
LR and SW led the design of the study and the analysis of the data. All authors contributed to data interpretation and writing of the manuscript.
Conflict of Interest
The authors declare that the research was conducted in the absence of any commercial or financial relationships that could be construed as a potential conflict of interest.
Acknowledgments
This paper was developed as part of the project Food & Landscape Diversity led by S. Gergel and T. Sunderland, funded with support from the National Socio-Environmental Synthesis Center (SESYNC). LR was supported by a Banting Fellowship from the Social Sciences and Humanities Research Council of Canada (SSHRC). The authors would like to thank the three reviewers for their helpful comments and suggestions.
Supplementary Material
The Supplementary Material for this article can be found online at: https://www.frontiersin.org/articles/10.3389/fsufs.2020.00045/full#supplementary-material
References
Abay, K., and Hirvonen, K. (2017). Does market access mitigate the impact of seasonality on child growth? Panel data evidence from northern Ethiopia. J. Dev. Stud. 53, 1414–1429. doi: 10.1080/00220388.2016.1251586
Abrahams, Z., Mchiza, Z., and Steyn, N. P. (2011). Diet and mortality rates in Sub-Saharan Africa: stages in the nutrition transition. BMC Public Health. 11:801. doi: 10.1186/1471-2458-11-801
Alvarez, S., Timler, C. J., Michalscheck, M., Paas, W., Descheemaeker, K., Tittonell, P., et al. (2018). Capturing farm diversity with hypothesis-based typologies: an innovative methodological framework for farming system typology development. PLoS ONE 13:e0194757. doi: 10.1371/journal.pone.0194757
Amare, B., Moges, B., Moges, F., Fantahun, B., Admassu, M., Mulu, A., et al. (2012). Nutritional status and dietary intake of urban residents in Gondar, Northwest Ethiopia. BMC Public Health. 12:752. doi: 10.1186/1471-2458-12-752
Amede, T., Auricht, C., Boffa, J.-M., Dixon, J., Mallawaarachchi, T., Rukuni, M., et al. (2017). A Farming System Framework For Investment Planning and Priority Setting in Ethiopia. ACIAR Technical Reports Series No. 90. Australian Centre for International Agricultural Research: Canberra. 52.
Angelsen, A., and Kaimowitz, D. (2001). Agricultural Technologies and Tropical Deforestation. New York, NY: CABI Publishing.
Arimond, M., Wiesmann, D., Becquey, E., Carriquiry, A., Daniels, M. C., Deitchler, M., et al. (2010). Simple food group diversity indicators predict micronutrient adequacy of women's diets in 5 diverse, resource-poor settings. J. Nutr. 140, 2059S−2069S. doi: 10.3945/jn.110.123414
Aurino, E., Fernandes, M., and Penny, M. E. (2017). The nutrition transition and adolescents' diets in low-and middle-income countries: a cross-cohort comparison. Public Health Nutr. 20, 72–81. doi: 10.1017/S1368980016001865
Barrett, C. B., and Bevis, L. E. (2015). “The micronutrient deficiencies challenge in African food systems,” in The Fight Against Hunger and Malnutrition: The Role of Food, Agriculture, and Targeted Policies, ed D. E. Sahn Oxford: Oxford University Press), 61–88.
Baudron, F., Duriaux Chavarría, J. Y., Remans, R., Yang, K., and Sunderland, T. (2017). Indirect contributions of forests to dietary diversity in Southern Ethiopia. Ecol. Soc. 22:28. doi: 10.5751/ES-09267-220228
Black, R. E., Victora, C. G., Walker, S. P., Bhutta, Z. A., Christian, P., De Onis, M., et al. (2013). Maternal and child undernutrition and overweight in low-income and middle-income countries. Lancet 382, 427–451. doi: 10.1016/S0140-6736(13)60937-X
Central Statistical Agency of Ethiopia, Ethiopian Development Research Institute and International Food Policy Research Institute. (2016). Atlas of the Ethiopian Rural Economy. Addis Ababa: Central Statistical Agency of Ethiopia.
Cockx, L., Colen, L., and De Weerdt, J. (2018). From corn to popcorn? Urbanization and dietary change: evidence from rural-urban migrants in Tanzania. World Dev. 10, 140–159. doi: 10.1016/j.worlddev.2018.04.018
Cruz-Garcia, G. S., and Price, L. L. (2014). Gathering of wild food plants in anthropogenic environments across the seasons: implications for poor and vulnerable farm households. Ecol. Food Nutr. 53, 363–389. doi: 10.1080/03670244.2013.808631
Curtis, P. G., Slay, C. M., Harris, N. L., Tyukavina, A., and Hansen, M. C. (2018). Classifying drivers of global forest loss. Science 361, 1108–1111. doi: 10.1126/science.aau3445
Dray, S., and Dufour, A. B. (2007). The ade4 package: implementing the duality diagram for ecologists. J. Stat. Softw. 22, 1–20. doi: 10.18637/jss.v022.i04
Dube, P., Heijman, W. J., Ihle, R., and Ochieng, J. (2018). “The potential of traditional leafy vegetables for improving food security in Africa,” in Establishing Food Security and Alternatives to International Trade in Emerging Economies, ed E. Vasily (Hershey, PA: IGI Global), 220–243. doi: 10.4018/978-1-5225-2733-6.ch011
FAO (2005). Global Forest Resources Assessment 2005, Main Report. Progress towards sustainable forest management FAO Forestry paper 147, FAO: Rome.
FAO, IFAD, UNICEF WFP and WHO. (2018). The State of Food Security and Nutrition in the World 2018. Building climate resilience for food security and nutrition. FAO: Rome.
Fick, S. E., and Hijmans, R. J. (2017). Worldclim 2: new 1-km spatial resolution climate surfaces for global land areas. Int. J. Climatol. 37, 4302–4315. doi: 10.1002/joc.5086
Filmer, D., and Pritchett, L. H. (2001). Estimating wealth effects without expenditure data-or tears: an application to educational enrollments in states of India. Demography 38, 115–132. doi: 10.1353/dem.2001.0003
Forouzanfar, M. H., Afshin, A., Alexander, L. T., Anderson, H. R., Bhutta, Z. A., Biryukov, S., et al. (2016). Global, regional, and national comparative risk assessment of 79 behavioural, environmental and occupational, and metabolic risks or clusters of risks, 1990–2015: a systematic analysis for the global burden of disease study 2015. Lancet 388, 1659–1724. doi: 10.1016/S0140-6736(16)31679-8
Galway, L. P., Acharya, Y., and Jones, A. D. (2018). Deforestation and child diet diversity: a geospatial analysis of 15 Sub-Saharan African countries. Health Place 51, 78–88. doi: 10.1016/j.healthplace.2018.03.002
Gryseels, G. (1988). “The role of livestock in the generation of smallholder farm income in two Vertisol areas of the central Ethiopian highlands. In management of vertisols in sub Saharan Africa,” in Proceedings of a Conference Held at the International Livestock Centre for Africa (ILCA), eds S. C. Jutzi, I. Haque, J. McIntire, and J. E. S. Stares (Addis Ababa: Ethiopia), 345–358.
Haddad, L. J., Hawkes, C., Achadi, E., Ahuja, A., Ag Bendech, M., Bhatia, K., et al. (2015). Global Nutrition Report 2015: Actions and Accountability to Advance Nutrition and Sustainable Development. International Food Policy Research Institute.
Hair, J. F., Black, W. C., Babin, B. J., and Anderson, R. E. (2010). Multivariate Data Analysis: A Global Perspective. New Jersey, NJ: Pearson Prentice Hall.
Hall, J. N., Moore, S., Harper, S. B., and Lynch, J. W. (2009). Global variability in fruit and vegetable consumption. Am. J. Prevent. Med. 36, 402–409. doi: 10.1016/j.amepre.2009.01.029
Hansen, M. C., Potapov, P. V., Moore, R., Hancher, M., Turubanova, S. A., Tyukavina, A., et al. (2013). High-resolution global maps of 21st-century forest cover change. Science 342, 850–853. doi: 10.1126/science.1244693
Herforth, A., and Ahmed, S. (2015). The food environment, its effects on dietary consumption, and potential for measurement within agriculture-nutrition interventions. Food Secur. 7, 505–520. doi: 10.1007/s12571-015-0455-8
Hickey, G. M., Pouliot, M., Smith-Hall, C., Wunder, S., and Nielsen, M. R. (2016). Quantifying the economic contribution of wild food harvests to rural livelihoods: a global-comparative analysis. Food Policy 62, 122–132. doi: 10.1016/j.foodpol.2016.06.001
Hirvonen, K., and Hoddinott, J. (2017). Agricultural production and children's diets: evidence from rural Ethiopia. Agric. Econ. 48, 469–80. doi: 10.1111/agec.12348
Hjelm, L., Mathiassen, A., and Wadhwa, A. (2016). Measuring poverty for food security analysis: consumption-versus asset-based approaches. Food Nutr. Bull. 37, 275–289. doi: 10.1177/0379572116653509
Hoddinott, J., Headey, D., and Dereje, M. (2015). Cows, missing milk markets, and nutrition in rural Ethiopia. J. Dev. Stud. 51, 958–75. doi: 10.1080/00220388.2015.1018903
Hu, F. B. (2002). Dietary pattern analysis: a new direction in nutritional epidemiology. Curr. Opin. Lipidol. 13, 3–9. doi: 10.1097/00041433-200202000-00002
Ickowitz, A., Powell, B., Rowland, D., Jones, A., and Sunderland, T. C. H. (2019). Agricultural intensification, dietary diversity, and markets in the global food security narrative. Global Food Secur. 20, 9–16. doi: 10.1016/j.gfs.2018.11.002
Ickowitz, A., Powell, B., Salim, M. A., and Sunderland, T. C. H. (2014). Dietary quality and tree cover in Africa. Global Environ. Chang. 24, 287–294. doi: 10.1016/j.gloenvcha.2013.12.001
Johnson, K. B., Jacob, A., and Brown, M. E. (2013). Forest cover associated with improved child health and nutrition: evidence from the Malawi Demographic and Health Survey and satellite data. Global Health Sci. Pract. 1, 237–248. doi: 10.9745/GHSP-D-13-00055
Jones, A. D. (2015). The production diversity of subsistence farms in the Bolivian Andes is associated with the quality of child feeding practices as measured by a validated summary feeding index. Public Health Nutr. 18, 329–42. doi: 10.1017/S1368980014000123
Jones, A. D. (2016). On-farm crop species richness is associated with household diet diversity and quality in subsistence-and market-oriented farming households in Malawi−3. J. Nutr. 147, 86–96. doi: 10.3945/jn.116.235879
Jones, A. D. (2017). Critical review of the emerging research evidence on agricultural biodiversity, diet diversity, and nutritional status in low- and middle-income countries. Nutr. Rev. 75, 769–782. doi: 10.1093/nutrit/nux040
Jones, A. D., Shrinivas, A., and Bezner-Kerr, R. (2014). Farm production diversity is associated with greater household dietary diversity in Malawi: findings from nationally representative data. Food Policy 46, 1–12. doi: 10.1016/j.foodpol.2014.02.001
Labadarios, D., Steyn, N. P., and Nel, J. (2011). How diverse is the diet of adult South Africans? Nutr. J. 10:33. doi: 10.1186/1475-2891-10-33
Lachat, C., Raneri, J. E., Smith, K. W., Kolsteren, P., Van Damme, P., Verzelen, K., et al. (2018). Dietary species richness as a measure of food biodiversity and nutritional quality of diets. Proc. Natl. Acad. Sci. U.S.A. 115, 127–132. doi: 10.1073/pnas.1709194115
Layton, R., Foley, R., Williams, E., Chang, C., Ingold, T., Olszewski, D. I., et al. (1991). The transition between hunting and gathering and the specialized husbandry of resources: a socio-ecological approach. Curr. Anthropol. 32, 255–274. doi: 10.1086/203953
Lim, S. S., Vos, T., Flaxman, A. D., Danaei, G., Shibuya, K., Adair-Rohani, H., et al. (2012). A comparative risk assessment of burden of disease and injury attributable to 67 risk factors and risk factor clusters in 21 regions, 1990–2010: a systematic analysis for the global burden of disease study 2010. Lancet 380, 2224–2260. doi: 10.1016/S0140-6736(12)61766-8
McGarigal, K., Cushman, S. A., Neel, M. C., and Ene, E. (2002). FRAGSTATS: Spatial Pattern Analysis Program for Categorical Maps.
Ochieng, J., Afari-Sefa, V., Karanja, D., Kessy, R., Rajendran, S., and Samali, S. (2018). How promoting consumption of traditional African vegetables affects household nutrition security in Tanzania. Renew. Agric. Food Syst. 33, 105–115. doi: 10.1017/S1742170516000508
Ordway, E. M., Asner, G. P., and Lambin, E. F. (2017). Deforestation risks due to commodity crop expansion in sub-Saharan Africa. Environ. Res. Lett. 12:044015. doi: 10.1088/1748-9326/aa6509
Pinheiro, J., Bates, D., DebRoy, S., and Sarkar, D. (2018). nlme: Linear and Nonlinear Mixed Effects Models. R package ver. 3.1–317.
Popkin, B. M. (1993). Nutritional patterns and transitions. Popul. Dev. Rev. 19, 138–157. doi: 10.2307/2938388
Popkin, B. M. (2001). The nutrition transition and obesity in the developing world. J. Nutr. 131, 871S−873S. doi: 10.1093/jn/131.3.871S
Powell, B., Thilsted, S. H., Ickowitz, A., Termote, C., Sunderland, T., and Herforth, A. (2015). Improving diets with wild and cultivated biodiversity from across the landscape. Food Secur. 7, 535–554. doi: 10.1007/s12571-015-0466-5
Qaim, M., Kibrom, T., and Krishna, V. V. (2016). Market access and farm household dietary diversity. Rural 21, 12–14. Available online at: https://www.researchgate.net/profile/Kibrom_Sibhatu/publication/303278537_Market_access_and_farm_household_dietary_diversity/links/573ad48e08ae9f741b2cf4e6.pdf
Qaim, M., and Sibhatu, K. T. (2018). “On the link between production diversity and dietary quality in smallholder farm households,” in Hidden Hunger: Strategies to Improve Nutrition Quality Vol. 118 (Karger Publishers), 102–111.
R Core Team (2017). R: A Language and Environment for Statistical Computing. R Foundation for Statistical Computing, Vienna, Austria. Available online at: https://www.R-project.org
Rasmussen, L. V., Fagan, M. E., Ickowitz, A., Wood, S. L. R., Kennedy, G., Powell, B., et al. (2019). Forest pattern, not just amount, influences dietary quality in five African countries. Global Food Secur. 100331. doi: 10.1016/j.gfs.2019.100331
Rasolofoson, R. A., Hanauer, M. M., Pappinen, A., Fisher, B., and Ricketts, T. H. (2018). Impacts of forests on children's diet in rural areas across 27 developing countries. Sci. Adv. 4:eaat2853. doi: 10.1126/sciadv.aat2853
Rowland, D., Ickowitz, A., Powell, B., Nasi, R., and Sunderland, T. (2016). Forest foods and healthy diets: quantifying the contributions. Environ. Conserv. 44, 102–114. doi: 10.1017/S0376892916000151
Schreinemachers, P., Simmons, E. B., and Wopereis, M. C. (2018). Tapping the economic and nutritional power of vegetables. Glob. Food Secur. 16, 36–45. doi: 10.1016/j.gfs.2017.09.005
Sibhatu, K. T., Krishna, V. V., and Qaim, M. (2015). Production diversity and dietary diversity in smallholder farm households. Proc. Natl. Acad. Sci. U.S.A. 112, 10657–10662. doi: 10.1073/pnas.1510982112
Sibhatu, K. T., and Qaim, M. (2018). Farm production diversity and dietary quality: linkages and measurement issues. Food Secur. 10, 47–59. doi: 10.1007/s12571-017-0762-3
Siegel, K. R., Ali, M. K., Srinivasiah, A., Nugent, R. A., and Narayan, K. V. (2014). Do we produce enough fruits and vegetables to meet global health need? PLoS ONE 9:e104059. doi: 10.1371/journal.pone.0104059
Smith, L. C., Dupriez, O., and Troubat, N. (2014). Assessment of the reliability and relevance of the food data collected in national household consumption and expenditure surveys. Int Household Survey Netw. IHSN Working Paper No. 008.
Steyn, N. P., and Mchiza, Z. J. (2014). Obesity and the nutrition transition in Sub-Saharan Africa. Ann. N. Y. Acad. Sci. 1311, 88–101. doi: 10.1111/nyas.12433
Stifel, D., and Minten, B. (2017). Market access, well-being, and nutrition: evidence from Ethiopia. World Dev. 90, 229–41. doi: 10.1016/j.worlddev.2016.09.009
Sunderland, T. C., O'Connor, A., Muir, G., Nerfa, L., Nodari, G. R., Wildmark, C., et al. (2019). 2 SDG 2: Zero Hunger–Challenging the Hegemony of Monoculture Agriculture for Forests and People. Cambridge: Cambridge University Press.
Tebekaw, Y., Teller, C., and Colón-Ramos, U. (2014). The burden of underweight and overweight among women in Addis Ababa, Ethiopia. BMC Public Health 14:1126. doi: 10.1186/1471-2458-14-1126
Tittonell, P., and Giller, K. E. (2013). When yield gaps are poverty traps: the paradigm of ecological intensification in African smallholder agriculture. Field Crops Res. 143, 76–90. doi: 10.1016/j.fcr.2012.10.007
Tittonell, P., Muriuki, A., Shepherd, K. D., Mugendi, D., Kaizzi, K. C., Okeyo, J., et al. (2010). The diversity of rural livelihoods and their influence on soil fertility in agricultural systems of East Africa–A typology of smallholder farms. Agric. Syst. 103, 83–97. doi: 10.1016/j.agsy.2009.10.001
Verger, E. O., Ballard, T. J., Dop, M. C., and Martin-Prevel, Y. (2019). Systematic review of use and interpretation of dietary diversity indicators in nutrition-sensitive agriculture literature. Global Food Secur. 20, 156–169. doi: 10.1016/j.gfs.2019.02.004
Willett, W., Rockström, J., Loken, B., Springmann, M., Lang, T., Vermeulen, S., et al. (2019). Food in the anthropocene: the EAT–lancet commission on healthy diets from sustainable food systems. Lancet 393, 447–92. doi: 10.1016/S0140-6736(18)31788-4
World Health Organization (2005). Fruit and Vegetables for Health : Report of the Joint FAO/WHO Workshop on Fruit and Vegetables for Health, 1-3 September 2004, Kobe, Japan. Geneva: World Health Organization. Available online at: http://www.who.int/iris/handle/10665/43143
Keywords: Ethiopia, dietary diversity, forest cover, poverty, agriculture, cluster analysis
Citation: Rasmussen LV, Wood SLR and Rhemtulla JM (2020) Deconstructing Diets: The Role of Wealth, Farming System, and Landscape Context in Shaping Rural Diets in Ethiopia. Front. Sustain. Food Syst. 4:45. doi: 10.3389/fsufs.2020.00045
Received: 20 April 2019; Accepted: 30 March 2020;
Published: 07 May 2020.
Edited by:
Patrick Meyfroidt, Catholic University of Louvain, BelgiumReviewed by:
Emily A. Martin, Julius Maximilian University of Würzburg, GermanyGabriel da Silva Medina, University of Brasilia, Brazil
Copyright © 2020 Rasmussen, Wood and Rhemtulla. This is an open-access article distributed under the terms of the Creative Commons Attribution License (CC BY). The use, distribution or reproduction in other forums is permitted, provided the original author(s) and the copyright owner(s) are credited and that the original publication in this journal is cited, in accordance with accepted academic practice. No use, distribution or reproduction is permitted which does not comply with these terms.
*Correspondence: Sylvia L. R. Wood, sylvie.wood@gmail.com
†These authors share first authorship