Photobioreactor Limnospira indica Growth Model: Application From the MELiSSA Plant Pilot Scale to ISS Flight Experiment
 Laurent Poughon
 Catherine Creuly1
  Francesc Godia
 Natalie Leys
 Claude-Gilles Dussap
- 1Institut Pascal, Université Clermont Auvergne, CNRS, Clermont Auvergne INP, Aubière, France
- 2MELiSSA Pilot Plant—Laboratory Claude Chipaux, Escola d’Enginyeria, Universitat Autònoma de Barcelona, Bellaterra, Spain
- 3Interdisciplinary Biosciences Group, Belgian Nuclear Research Center (SCK CEN), Mol, Belgium
Bioregenerative life support systems (BLSS) are the foundation stone to self-sustainable manned space missions. The MELiSSA is a BLSS concept that has evolved through a mechanistic engineering approach designed to acquire both theoretical and technical knowledge on each subsystem independently and, therefore, produces the necessary knowledge and experience needed to co-integrate all the subsystems together with a high level of control. One of the subsystems is a photobioreactor colonized by an axenic culture of the cyanobacterium Limnospira indica PCC8005 for revitalizing the air for the crew. This subsystem was extensively studied, and a mass balanced mechanistic model was developed to describe, predict, and control the photobioreactor. The model was based on a light transfer limitation model coupled to a kinetic model for the cyanobacteria growth through a Linear Thermodynamics of Irreversible Processes (LTIP) approach, including substrate limitation. The model was integrated into several hydrodynamic models adapted to several photobioreactors design and experiments, from a 100 L airlift pilot scale ground photobioreactor to a 50 ml membrane photobioreactor for ISS flight. Through this article we detail the principles of this mechanistic model and their application to different photobioreactor scales for predictive and descriptive simulations.
Introduction
MELiSSA (Micro Ecological Life Support System Alternative) is an international effort developing technology for regenerative life support to enable long-term human exploration missions in space. Inspired by an aquatic ecosystem, it is conceived as a loop of interconnected bioreactors providing the basic functions of life support (Lasseur et al., 2010; Lasseur and Mergeay, 2021). MELiSSA has six major compartments (C1-C5) or subsystems, coupled together in a closed circulatory loop. Respectively, it involves an anaerobic digestion compartment (C1) followed by an anaerobic mineralization compartment to completely mineralize the organic wastes (C2), an aerobic nitrification compartment for ammonia and urine oxidation (C3), a photobioreactor (C4a), and a higher plants chamber (C4b) for air revitalization and to supply the crew compartment (C5) with water and food. Compared with their Earth counterpart, the drastic reduction in size of artificial LSS, the few degrees of freedom of BLSS, the presence of multiple producers and consumers, tight technical and operational restrictions, and the different dynamics interacting within and between different compartments result in a complex control problem that requires the replacement of the stochastic “natural” control by a brain-level (intelligent) control. So, it was obvious that an engineering approach for MELiSSA development was mandatory. On one hand, all unit operations in charge of the elementary functions constitutive of the entire Life Support System (LSS) are studied, up to a thorough understanding. On the other hand, the systemic approach of complex, highly branched systems with feed-back loops is performed. Intelligence of the system is based on the adequacy of the knowledge models for representing each unit operation and their interrelations in a suitable degree of accuracy and adequate range of validity of the models for implementing a hierarchical strategy of control. Such a mechanistic modeling is a key stone for supporting the understanding and the maturity of the knowledge of a compartment required, to integrate it in a complex recycling system.
The present work concerns the fourth MELiSSA compartment (C4a), which is the photosynthetic microalgae compartment in charge of producing part of oxygen for the LSS and converts part of waste nitrogen into consumable biomass material. A detailed mechanistic understanding of a light energy transfer mechanism in dense and absorbing media has permitted linking the metabolic activity of the microbial photosynthetic cells to the mixing properties of the reactor and to the light energy supply by external light sources. This has offered the possibility to control the productivity of C4a by modulating the external light supply, to satisfy a fluctuating oxygen demand. It has been shown that it was absolutely mandatory to develop an as complete as possible knowledge model for associating metabolism determinism with physical transfer limitation and mixing properties of the bioreactor. This modeling level has been achieved by integrating both radiative transfer mechanisms and thermodynamic constraints imposed on cell metabolism, including detailed light energy conversion mechanisms at the photosystems level. This level of understanding has been progressively developed during the past few decades by the MELiSSA team, leading to engineering different types of photobioreactors of different sizes.
The present article presents the progressive steps for developing such advanced knowledge models of microalgae photobioreactors and the elemental bricks of science that are necessary to assemble to achieve the suitable level of understanding for including photobioreactors in an LSS such as MELiSSA. Two examples of applications of the photobioreactor model are presented, the first one being related to the operation and control of a pilot scale 80 L airlift photobioreactor operated for years at the MELiSSA Pilot Plant at the University de Barcelona in real life support conditions, the second one being a miniaturized 50 ml membrane photobioreactor that has been operated during 4 weeks in microgravity aboard the ISS in space.
Growth Model for Cyanobacterium Limnospira (aka Arthrospira or Spirulina)
The mechanistic growth model proposed was developed for Limnospira, previously called Arthrospira and also commonly known as “Spirulina,” which is the cyanobacteria grown in the C4a photoautotrophic compartment of the MELiSSA loop (Lasseur et al., 2010). The strain used in MELiSSA is Limnospira indica PCC 8005, a Gram-negative photosynthetic cyanobacterium, from the “Pasteur Culture Collection” (PCC), which was cultivated and maintained in axenic conditions. Recently, taxonomic classification of cyanobacteria has been revised and a new genus, Limnospira, and species indica has been established in place of the former Arthrospira sp. PCC 8005 (Nowicka-Krawczyk et al., 2019).
The growth model detailed here was first proposed by Cornet et al. (1998) as “PhotoSim.” This model has been extended and improved since 1998 up to a complete modeling approach for photobioreactors and photoreactors for synthetic photosynthesis (Dauchet et al., 2016). This mechanistic growth model is one brick in a complete photobioreactor model (Figure 1). It predicts the growth and the oxygen production rates, and the biomass composition. It includes the mass balance constraints of L. indica as a function of reactor design and operating conditions (incident light), so that it can be used for various purposes and reactors. It is composed of two sub-models. The first one is a radiative transfer model, predicting the light distribution in the reactor. The second one is the biological model itself, predicting the biomass composition, the stoichiometric equation representative of cell growth, and the rates as a function of the previously predicted light distribution profile. The growth model presented and discussed hereafter is the essential part of the PBR model and is associated with a second brick, the reactor model, describing flow dynamics and mass transfer. The simplest approach used to describe the dynamic of a reactor is to consider a perfectly mixed reactor for both liquid and gas. The validity of this assumption is checked by either experimental methods (Residence Time Distribution) or numerical methods (Computed Fluid Dynamics). The results presented in the present article consider only perfectly mixed reactors (at least for the liquid phase), but depending on the design and operation of the reactor, the perfectly mixed assumption may not be satisfied, impacting mass and energy transfer. It must be outlined that the growth model proposed can be used for a non-perfectly mixed reactor by using a more complex reactor model with a discretized approach for example.
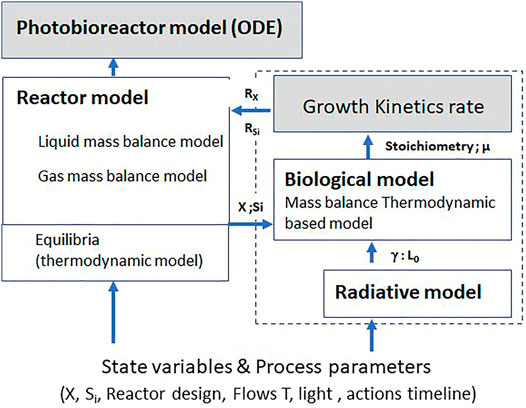
FIGURE 1. Principle of the modeling of photobioreactors using the LTIP growth kinetic model (dashed selection) as an elementary brick.
Radiative Transfer (Light) Model
A cell culture in photobioreactor (PBR) is heterogeneous in terms of light availability. The first approximation consists in considering that the system is uniformly distributed according to the direction of the light illumination. This direction is the depth (z) for the flat reactor with one or two sides lighted and the radius of the reactor (r) for cylindrical reactors (Supplementary Figure S1). The attenuation of light inside a photosynthetic culture can be calculated by determining the value of irradiance, G (z) (W.m−2 or μmol photons m−2.s−1), for any depth (z) or radius (r) of the culture, following the two-flux model analytical solution of one of the dimensionless equations (Eq. 1, Eq. 2, or Eq. 3) (Cornet and Dussap, 2009), respectively, for a flat reactor geometry with one side lighted, or flat two sides lighted and/or a cylindrical reactor radially lighted. Even if these analytical solutions result from a simplified approach of the problem of light diffusion, these equations have already been proved efficient in several studies (Cogne et al., 2005; Ifrim et al., 2014; Pruvost et al., 2016):
Here, n is the degree of collimation for the radiation field: n = 0 for isotropic intensities and n =
In is the modified Bessel function of the first kind.
Ea and Es are the mass absorption and the mass scattering coefficients and b is the backward scattering fraction (dimensionless). These optical and radiative properties are determined experimentally by spectrophotometric tools and for Limnospira indica PCC 8005 specifically. They are important variables describing the so-called shadow effect and how the absorption of light intensity is occurring in the dense media. For Limnospira indica PCC 8005, the Ea, Es, and b values are respectively 300, 1,100 m2.kg X−1, and 0.03 (Rochatte, 2016). q0 represents the hemispherical incident light flux or photons flux density (PFD). X is the biomass concentration inside the photobioreactor and L is the depth or radius of the photobioreactor. From a biological point of view, photosynthesis is driven by photon flow (µmol.s−1) and wavelength. The presented expressions of the radiative model are used for a single-photon wavelength and integrated over the spectrum of the light source. The radiative model used for the growth model (Figure 1) is an integrated expression over the light spectrum. Therefore, the radiative properties and the irradiance are averaged values that should be calibrated for the light spectrum used. The parameters used in this article are for a white lamp spectrum.
The radiative transfer model allows calculating the light availability that is defined by the liquid volume fraction:
Biological Model
The biological model is composed of the growth kinetic model, accounting for the photosynthetic activity of the cells, and for the stoichiometry of the photosynthetic growth leading to the relationships between the compounds consumption (nutrients) and production (biomass) rates.
A single mass and elemental (C, H, O, N, S, P) balance supported by the stoichiometric equation (Eq. 4) was obtained from a structured approach of the metabolism of Limnospira indica PCC 8005 including anabolic reactions rates coupled to the rate of chemical energy carriers (JATP) and of reduced power cofactors (Jcov) driven by photosynthesis (Z scheme) (Cornet et al., 1998). In this equation,
It was demonstrated (Dauchet et al., 2016) that the energy transducing process can be described by the ratio (JATP)/(Jcov), which is termed the P/2e− ratio, and thus can be handled with the theory of the linear energy converter in terms of Linear Thermodynamics of Irreversible Processes (LTIP) as:
where x is obtained as the solution of the following second-order equation:
for a flat reactor geometry with one side lighted
for a flat reactor with two sides lighted
for a cylindrical reactor radially lighted The kinetic of growth associated with Eq. 4 is equal to the average photosynthetic growth rate, <rx>, calculated for the full liquid volume of the reactor by integrating the local light flux G(z) along the culture depth (Eq. 10) (Cornet et al., 1998; Cornet and Dussap, 2009). The respiration of Limnospira indica PCC 8005 in the dark was assumed to be negligible for a perfectly mixed illuminated bioreactor with a low residence time of the liquid medium in the dark zone, so that only the illuminated fraction of the reactor was really active and contributed to the growth:
Therefore, this average photosynthetic growth rate considers the light limitation, but not other limitations such as substrates concentrations, effect of temperature and of pH. For substrates, a Monod limiting term was multiplied to
According to Cornet et al. (1998) temperature can be also taken into account for the calculation of
with R the perfect gas constant (8.314 J.mol−1.K−1) and T the temperature (in K).
The kinetic rate of each compound (i) involved in the mass balanced growth equation Eq. 4 is calculated as:
where
Model for the Prediction of Light Distribution, Biomass Composition, Oxygen Productivity, and Critical Size for three Photobioreactors Design
The first usage of the growth model of L. indica is its application with the three designs of reactor considered in the radiative transfer model, namely the one-side lighted flat reactor (1FR), the two-side lighted flat reactor (2FR), and the radially lighted cylindrical reactor (RCR). The simulation results presented here were obtained assuming no compound limitation, which also implies no pH-related equilibria for substrates and perfectly mixed reactor without other physical limitation than the light, and a white lamp spectrum for the light source. In such conditions, the four parameters required for the model are the characteristic dimension (L) of the reactor (the depth for flat reactor and the radius for the cylindrical reactor), the design dark fraction of the reactor (
The light availability defined by the lighted liquid volume fraction
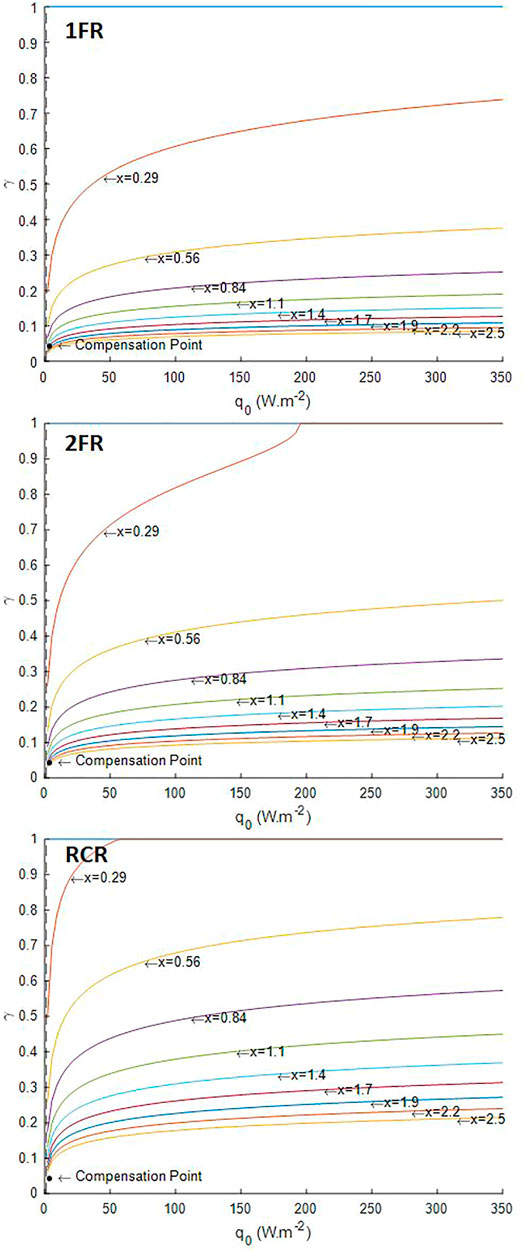
FIGURE 2. Illuminated fraction predicted by the radiative transfer model. 1FR—one-side lighted flat reactor; 2FR—two-side lighted flat reactor; RCR—radially lighted cylindrical reactor.
The mass fraction of exopolysaccharide (EPS) predicted for different incident light fluxes conditions using the LTIP model (Figure 3) is consistent with experimental observations and metabolic analysis of Limnospira indica PCC 8005 growth in the photobioreactor (Cogne et al., 2003). For P/2e− values greater than a thermodynamic threshold of 1.5, the light energy absorbed by the microorganisms is above their metabolic capacities and leading to physiological limitations. If from a numerical point of view, it is possible to solve the mass balance equation (Eq. 4, Eq. 5), such solutions are not possible from a biological point of view so that they were highlighted as black dotted area in Figure 3 and Figure 4. Cogne et al. (2003) have indeed demonstrated by analyzing the metabolic network of L. indica (formerly called Arthrospira platensis) that the metabolic constraint of converting NADH,H+ into NADPH,H+ (which is the only form regulated by photosynthesis) can only be achieved via a shunt of phosphoenolpyruvate (PEP) to pyruvate through PEP carboxylase. Calculating the metabolic fluxes for various P/2e−values has led us to demonstrate that an upper limit near 1.47 exists for the P/2e−. This threshold limit corresponds to a metabolic flux through the shunt tending to 0. This upper limit is close to the thermodynamic threshold of the P/2e− of 1.5. It can be observed in simulations, especially for RCR (Figure 2, Supplementary Figure S3), that the prediction of the metabolically unfeasible domain is very sensitive to the value of this threshold. For example taking a threshold at 1.482 (∼99% of 1.5) predicts that at 350 W.m−2, even at 2.5 gX.L−1L. indica is above its metabolic capacities (Supplementary Figure S4). As a consequence, this permits drawing the conclusion that the behavior of the cyanobacteria is more difficult to predict at high light flux in radially lighted cylindrical, where the high-intensity radiative energy is more homogeneous than in flat reactors where the presence of a dark zone buffers the average high light energy availability. In the same way, this also permits deriving that the lighting conditions need to be reduced at low biomass concentrations, i.e. at the beginning of a batch culture after the inoculation, to start the culture without inhibition by a surplus of light energy (also called photoinhibition).
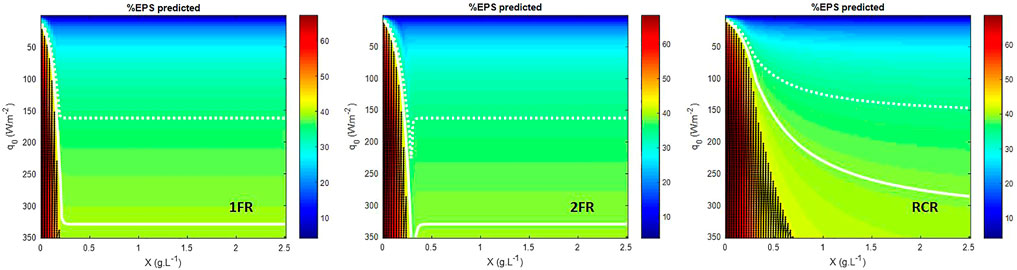
FIGURE 3. EPS biomass fraction predicted. 1FR—one-side lighted flat reactor; 2FR—two-side lighted flat reactor; RCR—radially lighted cylindrical reactor. Dark dot area is the metabolically unfeasible domain predicted for a P/2e− > 1.5. White dashed line gives the 35% EPS limit and plain white line gives the 39% EPS limit.
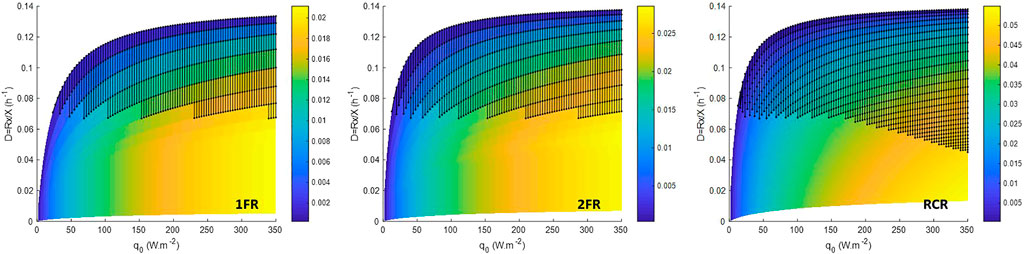
FIGURE 4. Volumetric oxygen productivity (in g.L−1 h−1) in steady-state CSTR for an operating domain for biomass ranging from 0.01 to 2.5 g.L−1. 1FR—one side lighted flat reactor; 2FR—two sides lighted flat reactor; RCR—radially lighted cylindrical reactor. Dark dot area is the metabolically unfeasible domain predicted for a P/2e− > 1.5.
For Continuous Stirred Tank Reactor (CSTR), in steady state, the dilution rate (D) is expressed as
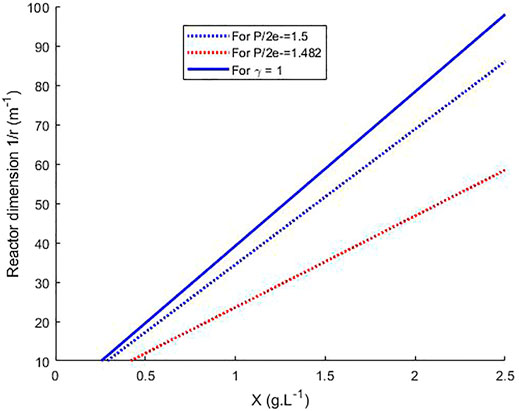
FIGURE 5. Calculation of the radius for a cylindrical PBR for the growth of L. indica without other limitations than light in continuous steady-state and for light incident flux of 200 W m−2, as a function of biomass concentration and for three criteria, γ = 1, P/2e− = 1.5 and P/2e− = 1.482.
Model for Operation of the C4a in MELiSSA Pilot Plant
The MELiSSA Pilot Plant was developed with the main goal of demonstrating long-term continuous operation feasibility of the MELiSSA loop under the supervision of a control system at a pilot-plant scale. In the MPP, the different compartments have been scaled up to achieve the oxygen production equivalent to the respiration needs of one human, with 20–40% concomitant production of food (Godia et al. 2014). The photosynthetic bioreactor (compartment 4a in the MELiSSA loop) is an 80 L cylindrical radially lighted external-loop gas lift photobioreactor providing between 5 and 10% of oxygen requirements for one human. Alemany et al. (2019) have demonstrated the validity of the radiative transfer model with a series of experimental tests of gas-connected C4a and mock-up crew compartment (C5) that has been conceived and operated as a 3-rats’ isolator. The photobioreactor model used by Alemany et al. (2019) is a “N-tank in series” model to characterize the nonideal mixing status of both liquid and gas phases into the 80 L air-lift PBR that is used. The biological model relies on a former approach of L. indica growth with a model based on separate kinetics for active biomass synthesis (proteins and main cell constituents) and exopolysaccharides (EPS).
The results obtained for a newer version of the MPP-PBR, which has been refurbished with an efficient LED-based lightening system, are presented hereafter. This equipment allows reaching up to 364 W.m−2 for incident light energy flux for the C4a. The LTIP model used for the growth of L. indica was associated (Figure 1) with a reactor model for the air lift PBR considering riser/downcomer sections. The reactor is sketched as a series of two perfectly mixed reactors for the liquid phase, one for the riser and one for the downcomer. The gas phase flow is represented by a plug flow model in the riser, which means the mass transfer driving force for gas/liquid exchange has to be considered a Log average between the top and the bottom of the column for the gaseous compounds (Figure 6). The TIC (i.e., all dissociated forms of CO2) are calculated considering the pH equilibria of CO2<-> HCO3−<-> CO32−, coupled to the CO2 gas/liquid mass transfer and equilibrium. The mass balance equations of the PBR are written and solved for each section. For simulations, the following parameters were used: liquid volume of 83 L, gas volume of 1 L, design dark fraction (
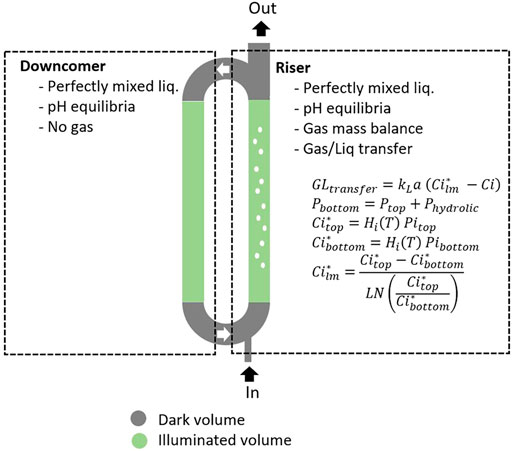
FIGURE 6. Principle of the hydrodynamic model for MELiSSA Pilot Plant PBR.
The accuracy of model prediction is compared for four steady-state experiments (SS1, SS2, SS3, SS4, with four different dilution rates) obtained at MELiSSA Pilot Plant (Table 1). At D = 0.01 h−1, the TIC limitation is predicted, indicating a fair consistency between observations and simulation. It is also to outline that for D = 0.025 h−1 the experiment has failed for an incident light of 364 W.m−2, which is consistent with the former predictions on the effect of light energy inhibition at high intensities and the maximum value of P/2e− and the threshold that is reached at the metabolic level when the metabolic flux of the phosphoenolpyruvate (PEP) shunt was decreased to 0. In engineering terms and bioreactor control, it was necessary to decrease light energy flux down to 250 W.m−2. The C4a MPP column, with a radius of 0.075 m, can be compared to the ideal RCR reactor (Figure 3, Figure 4). Interestingly, the previous conclusions obtained for bench scale reactors, when the operating conditions are too close to the metabolic P/2e− threshold, remain fully valid for the real pilot-scale reactor, having a much more complex liquid and gas phases behaviors.
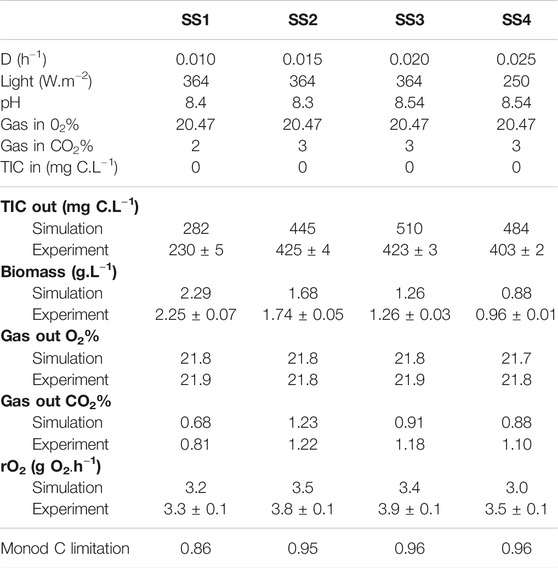
TABLE 1. Comparison between steady-state results (SS1—SS4) obtained with the C4a MPP model (simulation) and experiments.
Therefore, the model suitably describes and predicts the dynamic growth of the microalgae and the productivities (O2 production and CO2 uptake rates per unit of time and of PBR volume) for a large set of PBR operating conditions. This has been described in literature for various reactor designs (Cogne et al., 2005; Cornet and Dussap, 2009; Ifrim et al., 2014; Rochatte, 2016) and also for the MELiSSA C4a (Alemany et al., 2019).
From the above, the model can be used to simulate the PBR over a large range of conditions producing a large amount of data that could not be obtained experimentally without spending time and resources. From these simulations, abacuses are created, supporting a complete understanding of the process over various combinations of operating conditions. An example of abacuses is given in Figure 7 for the MPP C4a operated at steady state with a hydraulic residence time (HRT) of 100 h, at the maximum light flux allowed by the LED lighting system of the reactor and pH 9.5. With these abacuses the risk of C limitation is directly evaluated as a function of the two input variables TIC and yCO2, displaying the corresponding PBR performances, biomass concentration, and oxygen productivity. In terms of LSS control, namely in the MELiSSA loop, these inputs are not necessarily fixed, considering that TIC depends on the other MELiSSA compartments, as liquid output from C3 is the liquid input flow of C4a, and yCO2 depends on C5 (crew compartment). Conceptually, the MELiSSA LSS loop is a highly branched and interconnected system, which is a common situation for any LSS, calling for a strictly controlled system. By example, the interpretation of these abacuses indicates that if yCO2 is controlled at 1%, the minimal TIC input to provide is 600 mg C.L−1, leading to a steady-state biomass concentration of 2.4 g.L−1 and an oxygen production rate of 3.3 O2 h−1 defining directly the expected performances of the system.
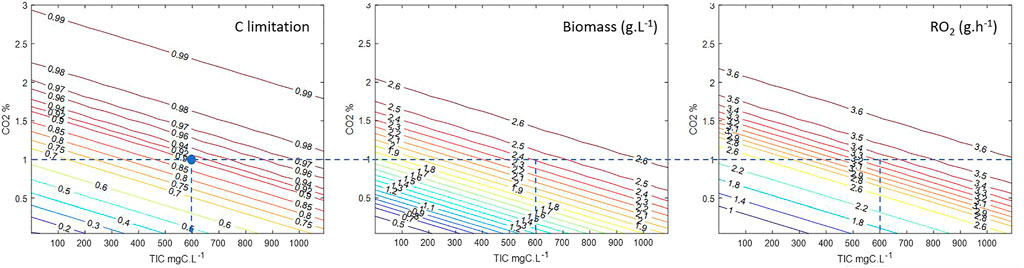
FIGURE 7. Abacuses calculated for simulation of MPP C4a at D = 0.01 h−1, pH = 9.5, q0 = 364 W.m−2 over a range of TIC inputs of 0–1,100 mg C.L−1 and yCO2 input of 0–3%. Dotted line gives a lecture of the figures for a criteria yCO2 = 1% and C limitation = 0.9.
Moreover, these abacuses can be fitted by quadratic functions to prevent an online integration of the model and therefore to obtain simpler expressions (Supplementary Figure S5) that are further used to define operating domain and operating set points. For example, the fit of yCO2 at the output and of Monod C limiting factor calculated by the model (average over the riser part and the downcomer part) for TIC input and yCO2 input varying respectively in a range of (0–1,100) mgC.L−1 and (0–2)% was done for a hydraulic retention time (HRT) of 100 h, for pH 9.5 and four different light incident fluxes. The correlations obtained were used to define the operating domain (Figure 8—domain between dashed lines and plain lines) for which C limitation is above 0.85 and yCO2 at output is below 0.2%. This indirect use of the mechanistic model of the PBR can be used for the control strategy of the complete MELiSSA loop, as it allows defining set points for the control of the complete loop under selected constraints. With the simple example presented here, it gives the set point domain for the TIC output of the C3, i.e., TIC input of the C4a, and for the yCO2 output of the C5, i.e., yCO2 input of the C4a as the selected constraints on C4a.
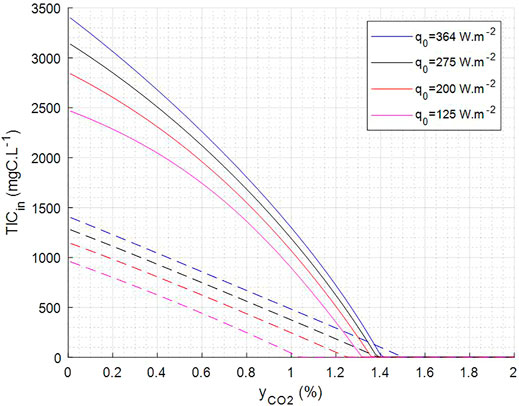
FIGURE 8. Predicted operating condition to keep C limitation = 0.85 (dashed lines) and yCO2 out = 0.2% (plain line). Operation shall be above dotted line to have >0.85 C limiting and below plain line to have <0.2% yCO2 at output.
Model for Description/Analysis of Arthrospira-B Photobioreactor Space Flight Experiment
Another application of the growth model of L. indica in PBR was also successfully used to describe the Arthrospira-B experiment, which was the first experiment in space with online measurements of both oxygen production rate and growth rate in four batch photobioreactors running under microgravity on-board ISS (Poughon et al., 2020). This application concerns a membrane PBR with a liquid volume of about 50 ml, which is a one-side lighted flat PBR, in a size 1,400 times smaller than the 80 L MPP C4a gas lift PBR. The ability to use a growth model with such different reactors in their design and scale demonstrates the robustness and the importance of the mechanistic approach that was followed for PBR modeling, including light energy transfer, mixing, and metabolism determinisms. As for the MPP C4a, the reactor model that was associated with the growth model (Figure 1) was developed specifically for the Arthrospira-B reactors. The liquid phase is described by a perfectly mixed model for implementing the mass balances for a batch reactor; the gas phase is described by a gas pressure/overpressure model. The micro-size reactor was only controlled for overpressure release and there was neither pH control nor pH measurement, due to the unavailability of a miniaturized space compatible pH probe stable operating in the high-pH medium. The growth model was therefore completed by a model for pH prediction in the liquid phase allowing the assessment of pH increase associated with the bicarbonate consumption for the biomass growth (Poughon et al., 2020). With a nominal incident light flux of 7.6 W.m−2 (maximum 9.8 W.m−2) and a depth of 0.015 m, the growth was never over the P/2e− threshold, even at start-up with low biomass concentrations (ca. 0.120 g.L−1), which guaranties the light inhibiting conditions were never reached. For this experiment the pH increase is a key factor for the prediction of the growth, the carbon source being bicarbonate ions HCO3−. Therefore, the important variable was not the TIC but the actual concentration of HCO3−. This allows considering the potential pH limitation due to the fact that pH was increasing as bicarbonate was exhausted in the liquid medium. When pH is modified, the equilibria of the dissolved carbon forms (carbonate, bicarbonate, and CO2) are displaced so that molecular dissolved CO2, which concentration is linked to the CO2 partial pressure, is decreased. In the Arthrospira-B experiment, the pressure increase is directly linked to the oxygen production, and the online pressure measurement and the cumulative pressure calculation were the main variables used to compare the experiments and the model simulations. Over the 16 batches produced on-board ISS (four batches for each of the four reactors integrated in the ISS Biolab facility) two were presented here (Figure 9): one is the first batch of reactor called B4 and one is for the fourth batch of the reactor called A1. A quite satisfactory fit was achieved between the experimental and simulation results, especially at the beginning of the batches. At the end of the batches, deviations are observed in the pressure profiles between simulation and measurements. A lower O2 productivity (lower pressure increase) observed is not fully explained in the model by the HCO3− limitation associated with the pH increase. The pH predicted by the model at the end of the batch is greater than 11 and limits for predictivity by the L. indica growth model were obviously reached considering that it was never experimentally verified and validated for such a high pH value. Nevertheless, when a suitable mixing of the liquid phase was maintained in microgravity conditions the satisfactory prediction of the model that was built from ground experiments has demonstrated that microgravity had no first-order effect on the oxygen production rate of Limnospira indica PCC8005 in a photobioreactor operating in space in zero gravity conditions.
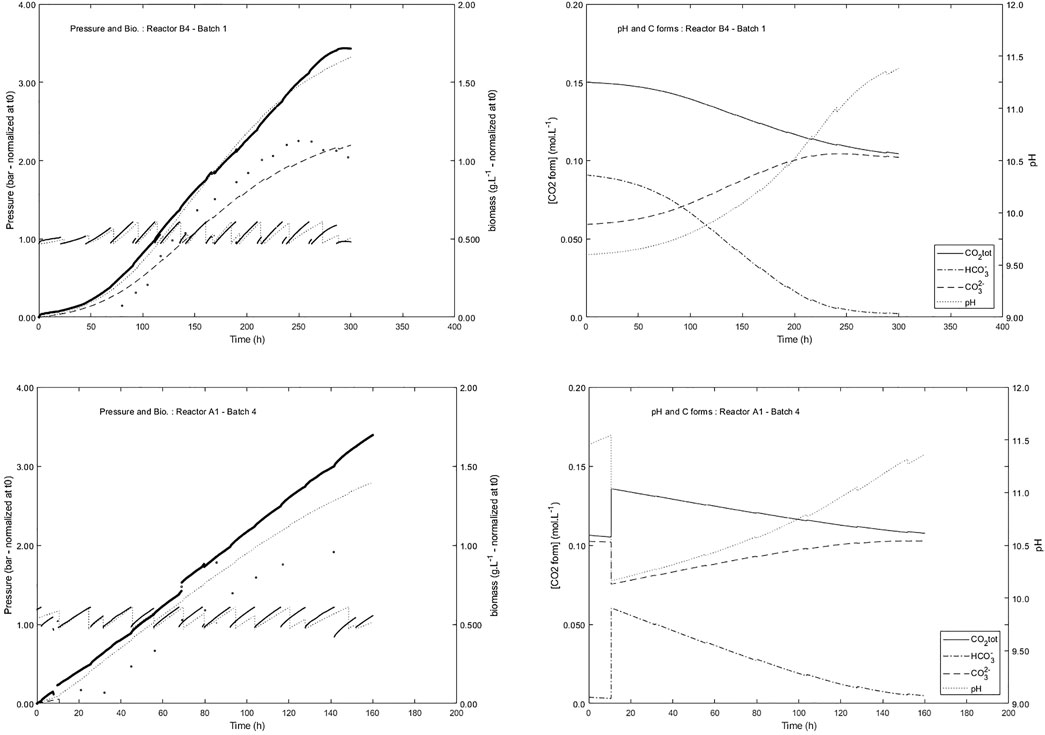
FIGURE 9. Comparison of experimental results (pressure and biomass) with simulation for two batches of reactors on board ISS during Arthospira-B experiment (dot and plain line are experimental results. Dashed lines are simulations). pH and ionic forms of inorganic carbon are predicted. The evolution of the pressure is the result of the release of the pressure relief valve either automatically (set point 1.15 bar) or daily scheduled for the biomass sampling.
Conclusion
Mechanistic modeling is a prerequisite for intensive applications of any system, whatever this system uses living microorganisms or not. The previous results clearly prove that a mechanistic modeling of a photobioreactor must associate physical understanding of light energy transfer in dense and absorbing media, physicochemical equilibria of dissociated electrolyte such as carbonate, bicarbonate and pH influence, liquid and gas phase mixing properties in defined volumetric characteristics and finally a thorough understanding of the metabolic level for describing the functioning and regulation of both photosynthetic organelles and metabolic fluxes, including thermodynamic constraints. This robust modeling strategy, which has been illustrated here, has permitted us to suitably understand and control a pilot-scale PBR (air-lift technology) functioning in actual LSS conditions and to interpret the results obtained from a micro-sized membrane reactor that has been operated in microgravity on ISS. Besides the fact that this modeling approach has been used in completely different and challenging conditions, including the design phases of the two PBR, it has permitted us to complete the unavailable non-measured variables, such as the pH and the production rates in microgravity, and to anticipate the control variables for supporting the respiration needs of a completely closed system, associating the constraints set related to a closed recirculating system functioning with minimal mass buffers.
Therefore, the modeling issues not only provide a clue for interpreting the metabolic functioning of living organisms in real environment of bioreactors but they also become a corner stone for designing efficient devices and intelligent multilayer control of complex systems. The price to pay is definitively to be capable of developing a totally multidisciplinary approach associating physical, chemical and biochemical sciences, in a common simulation platform, supporting the view of the phenomena at various scales, from molecular and metabolism to physical transfers and mixing properties and accounting for the coupling effects between different potentially limiting rates.
Data Availability Statement
The original contributions presented in the study are included in the article/Supplementary Material, further inquiries can be directed to the corresponding author.
Author Contributions
LP worked on the PhotoSim model (v20.1.1) implementing and compiling past results obtained by the GEPEB team of Institut Pascal under supervision of C-GD and CC. FG and NL are supervisors of MELiSSA related activities respectively at the MPP in UAB and for ArtEMISS project at SCK CEN, including the Arthrospira-B flight experiment. LP wrote the manuscript. All authors contributed equally to manuscript review.
Funding
This research work is part of the MELiSSA program, and was financially supported by, the European Space Agency, under several contracts, since 1986. The Arthrospira-B flight experiment was part of the ARTEMISS project, funded through the ESA PRODEX program and supported by the Belgian Science Policy (Belspo).
Conflict of Interest
The authors declare that the research was conducted in the absence of any commercial or financial relationships that could be construed as a potential conflict of interest.
Publisher’s Note
All claims expressed in this article are solely those of the authors and do not necessarily represent those of their affiliated organizations, or those of the publisher, the editors and the reviewers. Any product that may be evaluated in this article, or claim that may be made by its manufacturer, is not guaranteed or endorsed by the publisher.
Supplementary Material
The Supplementary Material for this article can be found online at: https://www.frontiersin.org/articles/10.3389/fspas.2021.700277/full#supplementary-material
References
Alemany, L., Peiro, E., Arnau, C., Garcia, D., Poughon, L., Cornet, J.-F., et al. (2019). Continuous Controlled Long-Term Operation and Modeling of a Closed Loop Connecting an Air-Lift Photobioreactor and an Animal Compartment for the Development of a Life Support System. Biochem. Eng. J. 151, 107323. doi:10.1016/j.bej.2019.107323
Cogne, G., Cornet, J. F., and Gros, J. B. (2005). Design, Operation, and Modeling of a Membrane Photobioreactor to Study the Growth of the Cyanobacterium Arthrospira Platensis in Space Conditions. Biotechnol. Prog. 21, 741–750. doi:10.1021/bp0495926
Cogne, G., Gros, J.-B., and Dussap, C.-G. (2003). Identification of a Metabolic Network Structure Representative Ofarthrospira (Spirulina) Platensis Metabolism. Biotechnol. Bioeng. 84, 667–676. doi:10.1002/bit.10808
Cornet, J.-F., and Dussap, C.-G. (2009). A Simple and Reliable Formula for Assessment of Maximum Volumetric Productivities in Photobioreactors. Biotechnol. Prog. 25, 424–435. doi:10.1002/btpr.138
Cornet, J. F., Dussap, C. G., and Gros, J. B. (1998). “Kinetics and Energetics of Photosynthetic Micro-organisms in Photobioreactors,” in Bioprocess and Algae Reactor Technology, Apoptosis, Advances in Biochemical Engineering Biotechnology (Berlin, Heidelberg: Springer Berlin Heidelberg), 153–224.
Dauchet, J., Cornet, J.-F., Gros, F., Roudet, M., and Dussap, C.-G. (2016). “Photobioreactor Modeling and Radiative Transfer Analysis for Engineering Purposes,” in Advances in Chemical Engineering, Photobioreaction Engineering. Editor J Legrand (Academic Press), 1–106. doi:10.1016/bs.ache.2015.11.003
Godia, F., Fossen, A., Peiro, E., Gerbi, O., Dussap, G., Leys, N., et al. (2014). “MELiSSA Pilot Plant: A Facility for Ground Demonstration of a Closed Life Support System,” in Presented at the 40th COSPAR Scientific Assembly.
Ifrim, G. A., Titica, M., Cogne, G., Boillereaux, L., Legrand, J., and Caraman, S. (2014). Dynamic pH Model for Autotrophic Growth of Microalgae in Photobioreactor: A Tool for Monitoring and Control Purposes. Aiche J. 60, 585–599. doi:10.1002/aic.14290
Lasseur, C., Brunet, J., Weever, H. D., Dixon, M., Dussap, G., Godia, F., et al. (2010). MELiSSA: The European Project of Closed Life Support System. Gravit. Space Res. 23, 3–12.
Lasseur, C., and Mergeay, M. (2021). Current and Future Ways to Closed Life Support Systems: Virtual MELiSSA Conference – a Review. Ecol. Eng. Environ. Prot. 1, 75–85. doi:10.32006/eeep.2021.1.2535
Nowicka-Krawczyk, P., Mühlsteinová, R., and Hauer, T. (2019). Detailed Characterization of the Arthrospira Type Species Separating Commercially Grown Taxa into the New Genus Limnospira (Cyanobacteria). Sci. Rep. 9, 1–11. doi:10.1038/s41598-018-36831-0
Poughon, L., Laroche, C., Creuly, C., Dussap, C.-G., Paille, C., Lasseur, C., et al. (2020). Limnospira Indica PCC8005 Growth in Photobioreactor: Model and Simulation of the ISS and Ground Experiments. Life Sci. Space Res. 25, 53–65. doi:10.1016/j.lssr.2020.03.002
Keywords: radiative transfer model, Growth model, bioregenerative life support system, Limnospira indica, MELiSSA loop
Citation: Poughon L, Creuly C, Godia F, Leys N and Dussap C-G (2021) Photobioreactor Limnospira indica Growth Model: Application From the MELiSSA Plant Pilot Scale to ISS Flight Experiment. Front. Astron. Space Sci. 8:700277. doi: 10.3389/fspas.2021.700277
Received: 25 April 2021; Accepted: 16 July 2021;
Published: 25 August 2021.
Edited by:
Tetyana Milojevic, University of Vienna, AustriaReviewed by:
Jack Legrand, Université de Nantes, FranceGary Anderson, South Dakota State University, United States
Copyright © 2021 Poughon, Creuly, Godia, Leys and Dussap. This is an open-access article distributed under the terms of the Creative Commons Attribution License (CC BY). The use, distribution or reproduction in other forums is permitted, provided the original author(s) and the copyright owner(s) are credited and that the original publication in this journal is cited, in accordance with accepted academic practice. No use, distribution or reproduction is permitted which does not comply with these terms.
*Correspondence: Laurent Poughon, Laurent.poughon@uca.fr