 Minychl G. Dersseh1
 Tammo S. Steenhuis1,2
 Aron A. Kibret3
 Bantesew M. Eneyew1Mebrahtom G. Kebedew4
 Fasikaw A. Zimale1
 Abeyou W. Worqlul5
 Mamaru A. Moges1,3
 Wubneh B. Abebe6
 Demesew A. Mhiret1
 Assefa M. Melesse7
 Seifu A. Tilahun1*
- 1Faculty of Civil and Water Resources Engineering, Bahir Dar Institute of Technology, Bahir Dar University, Bahir Dar, Ethiopia
- 2Department of Biological and Environmental Engineering, Cornell University, Ithaca, NY, United States
- 3Bureau of Water Resources, Irrigation and Energy, Bahir Dar, Ethiopia
- 4School of Civil Engineering, Mekelle University, Mekelle, Ethiopia
- 5Texas A&M AgriLife Research, Temple, TX, United States
- 6Amhara Design and Supervision Works Enterprise, Bahir Dar, Ethiopia
- 7Department of Earth and Environment, Florida International University, Miami, FL, United States
Nutrient enrichment from increased anthropogenic activities causes algal blooms and the proliferation of water hyacinth and other aquatic weeds. It is a recent phenomenon in developing nations where the link between water quality and water hyacinth infestation is not well studied. The objective of this study is to investigate the relationship between phosphorus, nitrogen, and chlorophyll-a on the distribution of water hyacinths in Lake Tana, located in the tropical highlands of Ethiopia. In this 3,000 km2 lake, water hyacinths have expanded from almost none to 25 km2 during the last 10 years. Water samples were taken near the four large rivers and at 27 nearshore stations. Samples were analyzed for total phosphorus, total nitrogen and chlorophyll-a. Our measurements were augmented with concentrations reported in the literature historically. Our results show that phosphorus concentration increased exponentially since the first measurements in 2003 from 0.01 mg P/l to near 1.8 mg P/l in 2020. Nitrogen concentrations increased from near zero at the end of the dry phase but remained nearly constant at around 2 mg total N/l after 2016. As a result, the ratio of nitrogen and phosphorus decreased in time, and the lake went from phosphorus to nitrogen limiting. Chlorophyll-a concentrations ranged from 0.3 to 104 μg/l. Water hyacinths appeared in the lake around 2010 after the nitrogen assimilation capacity of the lake was exceeded. They are found mainly in the northeastern part of Lake Tana, while nutrient concentrations are suitable for growing water hyacinths throughout the lake after 2010. Its location is mainly a consequence of lake circulation and wind direction. Minimum Chl-a concentrations were measured at locations with water hyacinths. Preventing future expansion of water hyacinth in Lake Tana is complicated but will require at minimum management practices that reduce the nitrogen and phosphorus loading from fertilizers applied in agriculture and prevent contributions from point sources.
Introduction
Freshwater lakes are an important income source for local communities. The lakes are used for fishing, transportation, agriculture, industry, recreation, tourism, and temperature regulation (Giardino et al., 2001). Lake water quality in countries with the highest GDP in Europe is improving (Steinebach, 2019). In contrast, lakes in developing countries are deteriorating rapidly because natural purification processes are insufficient to break down the increasing nutrient contributions of anthropogenic activities (Wold and Hershey, 1999; Giardino et al., 2001; Kanownik et al., 2019). Lake ecosystem services are severely affected by excess nutrients (Yang et al., 2013; Wondie, 2018).
Lakes receive nutrients from external and internal sources (Ramm and Scheps, 1997; Pettersson, 1998; Jeppesen et al., 2007; Mooney et al., 2020). External sources consist of point and non-point sources. For lakes in agricultural-dominated areas, nutrients from non-point sources could be substantially greater than point sources (Singh and Pandey, 2019). Non-point P sources are inorganic fertilizers, human and animal wastes, soil erosion, detergents discharges from septic systems, and runoff from farmlands (Robach et al., 1995; Jarvie et al., 2012; Kast et al., 2021). Point sources include sewer outlets and agricultural industries such as sugar factories and cheese plants. The major sources of total nitrogen (TN) are fertilizer, human waste, livestock, and atmospheric deposition and fixation (Preston and Brakebill, 1999; Zheng et al., 2008). The internal loading of nutrients is affected by lake morphology. Specifically, the wave base depth, the maximum depth at which a water wave's passage causes significant water motion (Kebedew et al., 2020b). In shallow lakes, the lake bottom sediment affects lake water quality due to the suspension of bottom sediments by wave actions (Osborne, 1980; Magnien et al., 1992; Kozerski et al., 1999; Burger et al., 2008). Several researchers (Osborne, 1980; Forsberg, 1989; Søndergaard et al., 1999) have shown that nitrogen and phosphorus fluxes from the bottom sediments increased the primary aquatic plant productivity and growth in shallow lakes.
Invasive aquatic weeds proliferation, such as water hyacinth, depends on the nutrient concentration in the lake water (Hecky et al., 2010). Various experimental data provide concentrations for its growth in lakes. Gaikwad and Gavande (2017) reported that the minimum requirement for the survival of water hyacinth was 5.5 mg N/l and 1.66 mg P/l. However, Center and Spencer (1981) reported that water hyacinths grew well at concentrations above 1 mg N-N03/l and between 0.5 and 2 mg total phosphate P. Concentrations for maximum growth of water hyacinth, according to Khan and Ansari (2005) and Gaikwad and Gavande (2017) are 20 mg/l N, and 3 mg/l P. Polomski et al. (2009) and Yan and Guo (2021) reported an optimum growth rate of water hyacinths was reported both under experimental conditions of N and P weight ratio of 4.5 to 7 with P concentrations greater than 0.39 mg P/l and N >2.3 mg N/l. Under low nutrient conditions, optimum N and P weight ratio of 1.5–5 have been reported (Reddy and Tucker, 1983). According to Smith (1982), Chl-a is dependent on total nitrogen (TN), and total phosphorus (TP) ratio (weight equivalent) is <5, it is dependent only on TN, and if the ratio is >10, it is dependent only on TP.
In Africa, water hyacinth was noted first in Egypt in the late 1880s, in South Africa in 1910, in Zimbabwe in 1937, and in Lake Victoria, growth started around 1990 (Navarro and Kanyama-Phiri, 2000). They appeared for the first time in 1956 in Ethiopia in Koka Lake of Awash river in a region with sugar cane factories (Navarro and Kanyama-Phiri, 2000; Firehun et al., 2007, 2014, 2015). In 2011, the first water hyacinths were noted in Lake Tana Anteneh et al. (2015). Dersseh et al. (2019) indicated that the 340 km2 is the maximum potential coverage, including the area of the flood plains around Lake Tana. Based on NDVI of satellite images, Dersseh et al. (2020; Figure 5) showed an upward trend in area coverage of water hyacinth. The maximum infestation area in 2015 was 5 km2, and in 2019, 25 km2 (Figure 5 in Dersseh et al., 2019, 2020). Most of the increase occurred from 2015 to 2016, but after that, the rate of increase seemed to level off. The minimum area in 2019 was 10–12 km2 at the end of the dry phase when the lake was at its lowest water level.
Several studies measured the nutrient concentrations in Lake Tana. Only a few studies related the nutrient concentration with the extent of the water hyacinth infestation. In 2003 and 2004, Wondie et al. (2007) measured a maximum concentration of 0.6 mg/l N-NO3 in November of 2003 and 2004, and the minimum concentration was close to nil during the dry monsoon phase. The greatest P-PO4 concentration was 0.085 mg P/l in April 2004, with an average concentration of 0.023 mg P/l. They did not find any water hyacinth in Lake Tana, and the algae group of diatoms was most abundant. In March 2010, an average NO3 concentration of 0.26 mg N/l was measured near the south shore (Goshu et al., 2017, 2020). Ewnetu et al. (2014) reported total phosphorus (TP) concentration in unfiltered samples collected in June and July 2013 ranged from 0.01 to 0.93 mg P/l and an average of 0.14 mg P/l. The highest concentrations were reported near the sewer outfall of Bahir Dar. Nitrate concentrations were between 0.61 and 2.72 mg N/l with a mean of 0.72 mg N/l. During several sampling campaigns from 2000 to 2014, Alemu et al. (2017) took water samples from the Lake and major rivers. Averaged total dissolved P concentration in the lake samples was 0.49 mg P/l. Concentration in rivers was generally greater than in the lake during the rain phase, with the highest concentrations of 2.7 mg P/l at the Gumara in August 2011 (Alemu et al., 2017). In March 2017, Kebedew et al. (2020b) measured a spatially average total dissolved P concentration of 0.21 mg P/l in the whole lake 2017. Total dissolved phosphorus (TDP) concentrations in the water hyacinth infected areas were as high as 0.45 mg P/l. Kebedew et al. (2020a) reported that the average Lake Tana sediment bottom TN concentration was 0.8 g.kg−1, and Olsen available phosphorus was 0.019 g.kg−1. Tibebe et al. (2019) reported nearshore NO3-N concentrations ranging from 0.28 to 1.56 mg N/l in the dry phase and 0.58–1.03 mg N/l in the rain phase with the same average concentration of 0.79 mg N/l in both phases. Average soluble reactive P concentrations were 0.43 mg P/l with the greatest concentration of 0.88 mg P/l in the rain phase and 0.26 mg P/l in the dry phase. The TP concentration of water that was not filtered averaged 0.99 and 0.75 mg P/l in the rain and dry phase, respectively. A sampling date was not given in Tibebe et al. (2019). Sishu et al. (2021), similarly to Alemu et al. (2017), observed for the Robit Bata watershed that drains to Lake Tana, the maximum dissolved TP concentrations in the rain phase was 3.4 mg DP/l. Baseflow concentrations during the dry phase were <0.1 mg DP/l. Finally, the maximum concentrations at the outlet of the Awramba watershed in the Fogera Plain during the 2013 rain phase were 0.8 mg P-PO4/l (Moges et al., 2016) and 1.8 mg N-NO3/l (not published).
Despite the various studies of nitrogen and phosphorus concentrations in Lake Tana and its rivers, a systematic survey of the trend of nutrient concentrations and its effect on water hyacinth (if any) has not been carried out. Knowledge of the nutrient dynamics of the lake is urgently needed to prevent further infestation of water hyacinths. Therefore, the main aim of this study was to characterize the phosphorus, nitrogen and Chl-a concentration of Lake Tana based on this study and previously collected data. The specific goals were to (1) evaluate the nutrient concentration and load of the four major tributary rivers flowing into the lake; (2) evaluate the distribution of TP, TN, and Chl-a in the water column; (3) evaluate spatial and temporal variation in TP, and TN in nearshore areas of the lake, and (4) analyze the linkage between the concentration of nutrients on the water quality and more specifically on the distribution of water hyacinth in the lake.
Materials and Methods
Study Area
Lake Tana is the largest freshwater lake in Ethiopia and the source of the Blue Nile (Poppe et al., 2013). It was designated as a world biosphere reserve by UNESCO in 2015. The lake is located between 11°30′ N-12°30′ N and 37° E-37°30′ E (Figure 1). The mean depth is 9.7 m, the median depth is 10.5 m, and the maximum depth is 14.8 m (Kebedew et al., 2020b). The wave depth is nearly the same as the maximum lake depth, indicating that the lake is fully mixed. The adsorbed concentration in the bottom sediment affects the dissolved concentration in the entire water column (Kebedew et al., 2020b). The lake surface area varies between 2,945 and 3,090 km2 depending on the time of the year, with the lowest water level in June and the highest at the end of the rain phase in September or October (Dersseh et al., 2020). The average water level observed is 1,786.2 m a.s.l. (Alemu et al., 2020). Historically, the lowest lake level was 1,784.2 m a.s.l. in June 2013, and the maximum lake level recorded in October 1998 was 1,787.72 m a.s.l. The lake's drainage area is around 12,000 km2 (Zimale et al., 2018). The total storage volume of the lake is ~30 km3, and its morphometric shape is nearly cylindrical (Kebedew et al., 2020b).
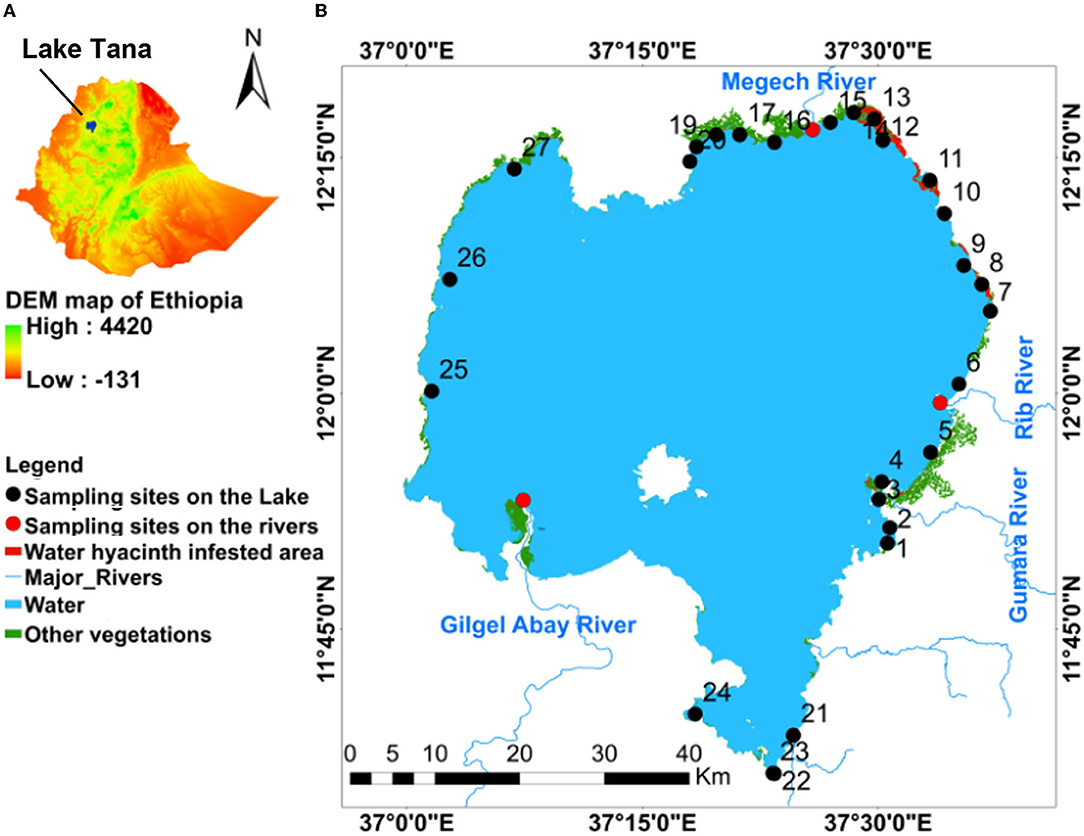
Figure 1. Maps of (A) Ethiopia with location of Lake Tana; (B) Spatial distribution of water hyacinth and other vegetation infested area in Lake Tana and map of sampling sites numbered 1–27; 1 = Korata; 2 = Mitsile; 3 = Tana Chirkos; 4 = Wagetera; 5 = Nabega; 6 = Tezamba; 7 = Agid; 8 = Kragna; 9 = Abaworka; 10 = Mtraha; 11 = Fkra Dangur; 12 = Shiha Gomengie; 13 = Lenba; 14 = Jarjar; 15 = Tana Woyna; 16 = Adisy Dengay Debir; 17 = Achera; 18 = Seraba; 19 = Dehanawawa; 20 = Gorgora; 21 = Chara- Chara; 22 = Lake shore; 23 = Bahir Dar port; 24 = Flower farm; 25 = Esey Debir; 26 = Chankebergen; and 27 = Tach-Alewa.
Lake Tana has significant socio-economic importance for Sudan and Egypt downstream. More than 80% of the Nile water comes from Ethiopian highlands (Johnson and Curtis, 1994; Conway, 1997). There are four seasons, a main-rain phase from July to September; a post-rainy phase from October to November; the dry phase that extends from December to April; and a pre-rainy phase from May to June. From 1990 to 2007, the average annual rainfall on the lake was 1,230 mm (Alemu et al., 2020). More than 40 seasonal rivers and four perennial rivers flow into the lake. The main rivers are the Gilgel Abay (Little Blue Nile), Gumara, Rib, and Megech (Kebede et al., 2006). The four major rivers contribute 93% of the total flow (Kebede et al., 2006). Dessie et al. (2015) estimated that the Gilgel Abay in the southern part of Lake Tana contributed 58% of the flow, Gumara and Rib in the east 30%, and Megech in the north 10% and several small rivers in the west 2%. The lake outflow after 2010 has been directed through a tunnel to the Beles River to generate 460 MW of electricity with hydroelectric power. Excess flow leaves the lake over the Chara-Chara weir to the Blue Nile. The annual outflow of the lake varies between around 3 and 5 km3 a–1 (Alemu et al., 2020). The lake is used for storage for hydropower generation, transportation, fishing, and recreation. It is a tourist attraction, with important religious sites on its islands.
Rainfed teff, maize, and sorghum are the main crops in the basin and cover three-fourths of the basin (Abera et al., 2021). During the dry monsoon phase, <20 % is cultivated using residual moisture (Abera et al., 2021). Nearly 20% of the basin is suitable for surface irrigation, but the water was only available for <1% of this potential area without constructing dams for surface storage (Worqlul et al., 2015). There are three major cities: Bahir Dar in south of the Lake, Debre Tabor in the upper watershed in the east, and Gonder in the north (Wondie, 2010). Most farmers grow eucalyptus trees (Tefera and Kassa, 2017). The wetlands have been severely affected by silt loads due to increased erosion from the degrading soil base due to deforestation followed by intensive agriculture (Wondie, 2010; Tebebu et al., 2017). Runoff is generated from saturation excess in the periodically saturated valley bottom and the degraded cropland with a hardpan (Moges et al., 2017b; Tebebu et al., 2017). The hydrology is complex, with many faults acting as conduits of subsurface flow and volcanic dikes as barriers (Adem et al., 2020).
Sampling Methods
Total phosphorus (TP) is the sum of all forms of phosphorus, including ortho-phosphates (soluble reactive phosphorus) and the phosphorus in plant and animal fragments suspended in lake water (Correll, 1998). Total nitrogen (TN) is the sum of nitrate, nitrite, ammonia, and organic nitrogen (Bremner, 1965; McGill and Figueiredo, 1993). Chlorophyll-a (Chl-a) is an indicator of water quality linked to productivity associated with nutrient levels in the lake (Koponen et al., 2001). The abundance of phytoplankton in freshwater lakes is strongly associated with TP (Guildford and Hecky, 2000).
River inlets and lakeshore areas were sampled to determine the concentration. The river inlet concentrations were used to calculate the nitrogen (TN) and phosphorus (TP) load delivered by the four major rivers. Water samples were collected at each of the four major rivers (Figure 1) in June, July, August, September, and December 2019. The lake depth at the river inlets was between 3 and 11 m. The other samples along the shores were taken to characterize the relationship between water hyacinth distribution and the nitrogen, phosphorus, and chlorophyll-a concentrations in the nearshore area of Lake Tana. Nearshore samples for determining TP, TN, and Chl-a were collected at 27 stations roughly divided evenly between water hyacinth-infested and non-infested regions (Figure 1). The samples were collected in two campaigns. For the first campaign, samples were taken at 0.5 m depth in August 2016, December 2016, and March 2017. In the second campaign, water samples were collected in June, July, August, September, December 2019, and March 2020 at the 0.5 m surface and just above the lake bottom. The sampling dates were chosen to represent the main rainy season (July-September), the dry season (December–April), and a pre-rainy season (May–June) to understand how seasonality influences the water quality parameters.
The water samples in all rounds were collected using a water sampler (Kemmerer—Model 12.07—Water Sampler Set and Beta Water Samplers, Horizontal Acrylic—Water sampler only, transparent acrylic, 3.2 L). The water samples were filtered and transferred to polyethylene bottles, 100 ml for TP, 100 ml for TN, and 500 ml for Chl-a. Samples were stored at −4°C until analysis by the Amhara Design and Supervision Works Enterprise.
Data Analysis
Annual inflow and outflow data for Lake Tana were taken from Alemu et al. (2020) study for a period with above and below-average rainfall. The proportion of mean annual flow rate from North, South, West and East side were calculated based on the measurements made by Dessie et al. (2017) and used in the nutrient loading calculation and balance.
An approximate P and N mass balance for the Lake was calculated by summing the products of discharges and measured concentrations near the four major rivers and subtracting that flowing through the outlets. The external phosphorus loading could not be estimated by the published functions in the literature by Larsen and Mercier (1976), Vollenweider (1976), Prairie (1989), and Hejzlar et al. (2006) because the lake was fully mixed, contrary to the assumptions on which those equations are based.
Image Analysis
The distribution of water hyacinth in Lake Tana was determined with a Sentinel-2 image on December 8, 2019. The image with a 10 m spatial resolution was classified with a supervised classification technique using the Google earth search engine platform. The relationship between the water quality parameters and water hyacinth was analyzed using ArcGIS spatial analyst tools and by comparing the values of the water quality parameters with the areas covered by water hyacinths.
Laboratory Analysis
Total phosphorus (TP) concentration was determined using PhosVer®3 based on the Acid persulfate digestion method in the range of 0.06–3.50 mg P/l. Total nitrogen (TN) concentrations were determined using the persulfate digestion method in the low range of 0.5–25.0 mg N/l. The digestion temperature of TN was 105°C and TP 150°C for 30 min. The absorption was then measured using HACH product DR.2008 and DR.3900 spectrophotometer at the wavelength of 410 and 890 nm for TN and TP, respectively (Dersseh et al., 2019).
Chlorophyll-a concentration was determined by the acetone extraction method after the sample filtration on 0.47 μm glass fiber filter (Whatman GF/C) using Gellman polycarbonate filtration towers, under low to moderate vacuum (10–40 cm Hg). Extracts were clarified by centrifugation at 4,000 rpm for 20 min. Sample and standard absorbance were read at 750 and 664 nm before acidification (750b and 664b) and 750 and 665 nm after acidification (750a and 665a). Chlorophyll-a concentration in the extract was determined with a spectrophotometer using the standard method of Perkin-Elmer Lambda 35 UV/VIS spectrophotometer with a 1 nm spectral bandwidth and optically matched 4 cm plastic micro-cuvettes.
Statistical Analysis
The spatial and temporal distributions of TP, TN and Chl-a were analyzed using descriptive statistics to determine the maximum, minimum, mean, and standard deviation (St.dev) values of each parameter. The difference in space, time, and water depth were evaluated using a one-way ANOVA and multi-comparison tests employed for the 27 sampling points. The spatial and temporal changes of the water quality parameters were considered based on the coefficient of variation (CV). The spatial and temporal variability in the parameters were categorized as weak (CV < 0.1), moderate (CV = 0.1–1), and strong (CV > 1, Zhang et al., 2007).
Results
Nutrient Concentrations of Major Rivers
The average total phosphorus, TP, concentrations for the Rib, Gumara, and Gilgel Abay inlets was just under 2 mg/l in 2019 (Table 1). The TP concentration in the Megech that originated in the Simien mountains with little agriculture was half of the other three rivers (Table 1). The average total nitrogen, TN, concentrations of the three rivers Gumara, Rib and Megech, with a large flood plain, were just above 2 mg/l, and for the Gilgel Abay, 3.5 mg/l (Table 1). The difference was statistically not significant. The Gilgel Abay has only a very small flood plain, and thus the opportunity for the nitrate to denitrify is smaller. The maximum concentrations of TP and TN in the four rivers were observed in December. The minimum was in June (Table 1). Wondie et al. (2007) found a similar trend for nitrate but not for phosphates in Lake Tana in 2003 and 2004.
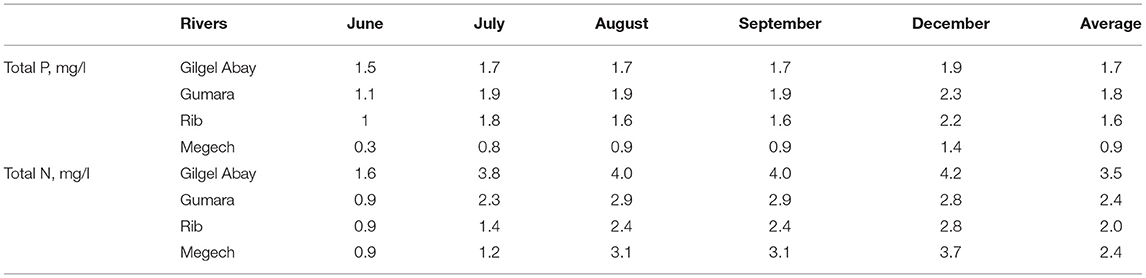
Table 1. Temporal variability of total phosphorus and total nitrogen concentration of the major tributary rivers of Lake Tana from June to December of 2019.
Distribution of TP, TN, and Chl-a in the Water Column
Water samples at the surface and the bottom were taken monthly from June to December in 2019 and March 2020. The average TP concentration in water samples at the lake bottom was, on average, 20% greater than in samples taken at 0.5 m from the surface (Table 2). Four-fifths of the water samples near the lake bottom exceeded the TP taken at the surface. Average TN was 16% lower at the bottom than at the surface, mainly because of the low concentration in the lake bottom samples for the sampling station near Bahir Dar (Stations 22–24, Figure 1; Table 2). Chl-a at the surface was greater than the bottom for two-thirds of the sampling locations (Table 2). Samples near the surface contain more Chl-a than the bottom samples following the pattern of TN. The small differences in surface and bottom concentration confirm the finding of Kebedew et al. (2020b) that the water column is mixed due to its shallow depth.
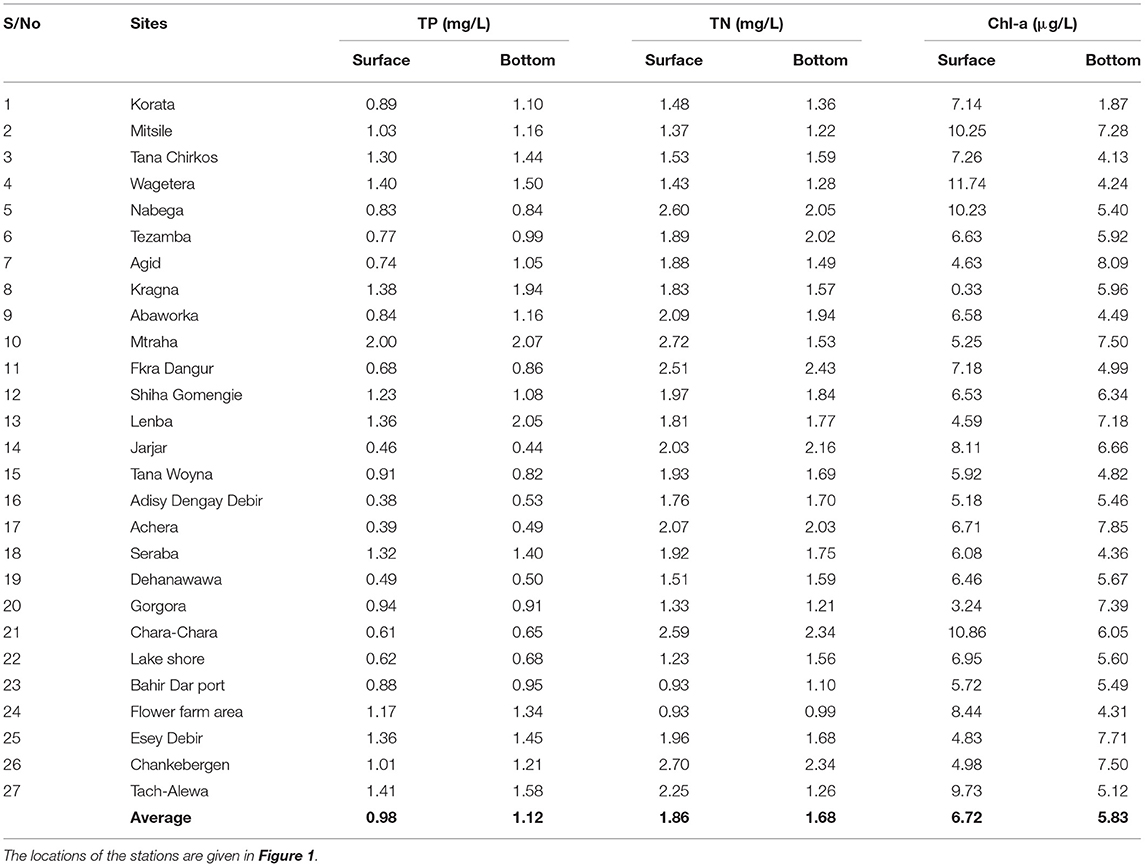
Table 2. The average concentration of total phosphorus (TP), total nitrogen (TN), and chlorophyll-a (Chl-a) in lake water at the 0.5 m depth (surface) and bottom from June to December of 2019 in Lake Tana.
Lake TP, TN, and Chl-a Concentrations
The water quality parameters of 27 stations (location shown in Figure 1) between 2016 and 2020 are given in Table 3. Mean TP concentrations increased about 5–10-fold over the 4 years. It increased from an average of 0.2 mg/l in 2016 to 1.8 mg/l in 2020, Table 3. Over the same period, TN concentrations in 2016 and 2020 were nearly the same, around 2 mg/l. The TN:TP ratio ranged from 0.4 to 29.5 (Table 3). The mean Chl-a concentrations did not show a clear trend. Average Chlorophyll-a concentrations ranged from 1 to 22 μg/l in 2016 and 2017. In 2019–2020 concentrations were between 4 and 9 μg/l (Table 3). Wondie et al. (2007) found the mean chlorophyll-a concentrations varied from 2.6 to 8.5 μg/l in 2003 and 2004.
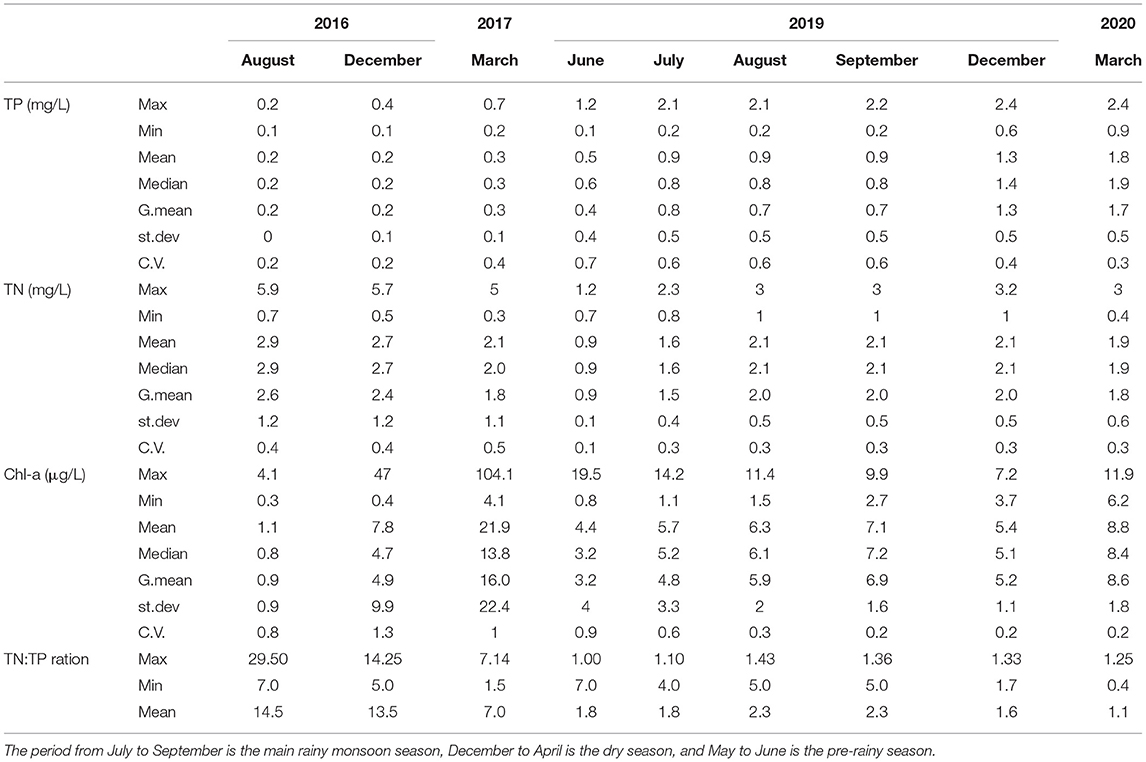
Table 3. The mean, maximum, minimum and standard deviation (st.dev) and coefficient of variability (CV) for concentrations of total phosphorus (TP), total nitrogen (TN), and chlorophyll-a (Chl-a) concentrations in Tana Lake at the 0.5 m depth between 2016 and 2020.
Spatial Distribution of TP, TN, and Chl-a
The spatial distribution of water hyacinth and other aquatic vegetation is shown in Figure 1. The total area with water hyacinths was around 2,500 ha, and most was found on the eastern shore north of the Rib outlet (Figure 1). Some water hyacinths locations showed elevated TP concentrations. TP concentrations for samples collected in 2019 and 2020 of >1 mg/l were recorded for stations 4, 8, 10, 12, 13 on the eastern side with the main water hyacinth infestation, station 18 near the north shore with some water hyacinths, and stations 25 and 27 near the western shore (Figure 1). The TN/TP ratio was also less for the high P sites. Stations 14, 16, 17, 19 near the Megech and 21 and 22 near the Blue Nile outlet had an average TP concentration of <0.5 mg/l (Figure 1; Table 4). Except for station 14, water hyacinths were not present at these sites. The calculated spatial weight-based TN/TP ratios ranged from 1.3 to 6.4 (Table 4).
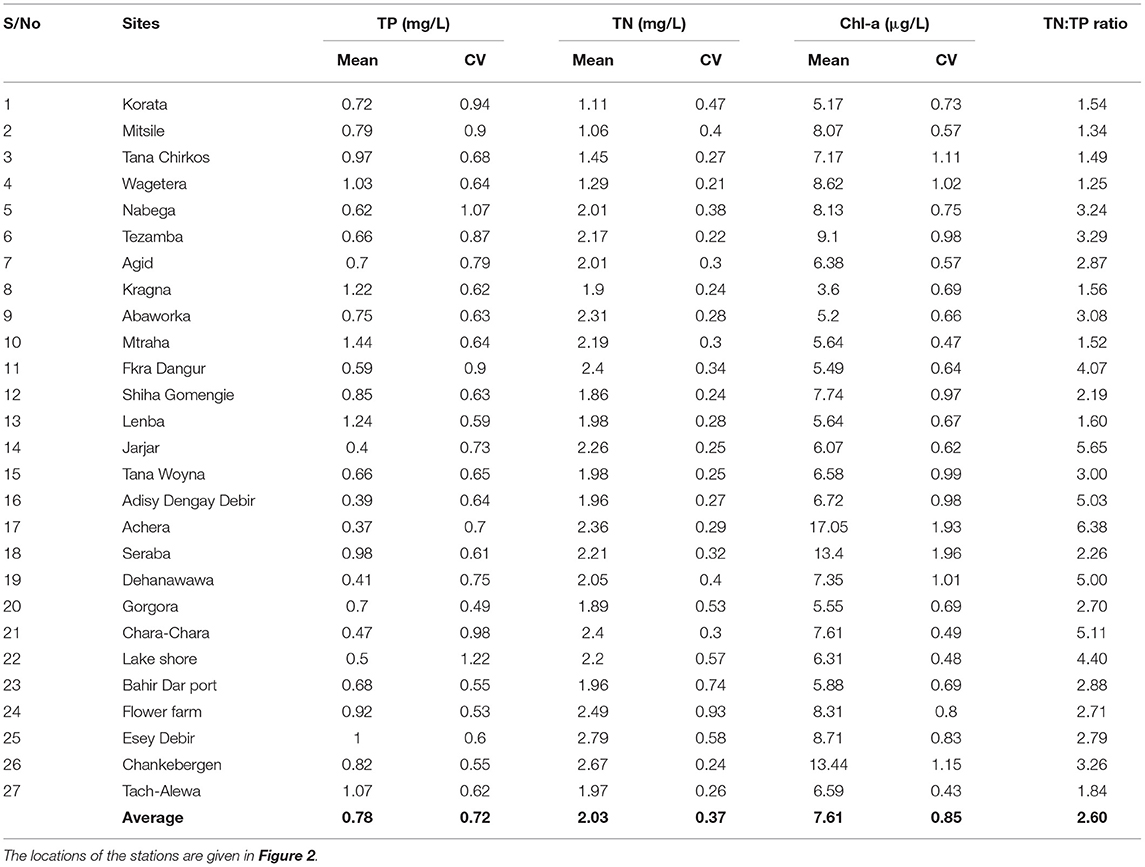
Table 4. The mean, maximum, minimum and standard deviation (st.dev) and coefficient of variability (CV) for concentrations of total phosphorus (TP), total nitrogen (TN), and chlorophyll-a (Chl-a) concentrations in lake water at the 0.5 m depth (surface) between 2016 and 2020 for 27 stations in the nearshore area of Lake Tana.
Total N concentrations over 2 mg/l were observed at stations 5, 7, 10, and 11 near the eastern shore, station 17 in the north, station 21 at the Chara-Chara weir near the outlet to the Blue Nile and 26 on the west shore. The lowest TN concentrations were observed at Stations 1–4 south of the Gumara (Table 4).
The maximum Chl-a concentrations were seen in parts of the lake that were not or minimally infested by water hyacinths (Stations 4, 5, 6 17 24, 25, and 26, Figure 1; Table 4). The minimum Chl-a concentrations in the lake were most severely infested by water hyacinths (Stations 8, 13, and 20, Figure 1; Table 4).
Discussion
Lake Water Quality
The TP concentrations in the Lake near Gumara, Rib and Gilgel Abay of 1.7 mg P/l (Table 4) were 30 times the lake water quality standard of the United States Environmental Protection Agency recommended level in streams entering lakes or reservoirs of 0.05 mg·P l−1 (USEPA US Environmental Protection Agency, 1986, 2000) and was 10 times the European standard (Berzina and Sudars, 2010). The average TP lake concentrations were 1.1 mg P/l in 2019 and an order of magnitude greater than the USEPA standard. The average total nitrogen concentration near the rivers was 2.6 mg N/l which is 45% greater than the lake of 1.8 N mg/l in 2019 (Table 2) and approximately three times that USEPA US Environmental Protection Agency (2000) recommended level. The chlorophyll-a concentration of around 6 μg l−1 in 2019 (Table 4) were about three times less than the concentration in shallow areas with a depth <20 m in Lake Victoria in 2005–2008 (Sitoki et al., 2010).
Historical Trends of P and N in the Lake Tana Basin
Phosphorus
The observed phosphorus concentrations in both rivers and the lake in the Lake Tana Basin over nearly 20 years are shown in Figure 2A. The figure requires explanation to be fully understood. The solid-filled symbols are measurements that have been made in the Lake. The various forms of symbols are the analyzed phosphorus type: circle represents the phosphorus in the form of PO4 (P-PO4) by Wondie et al. (2007) and Ewnetu et al. (2014). The triangles are the total phosphorus measured on unfiltered samples (TPu) by Alemu et al. (2017), and the diamonds indicate the total phosphorus measurements on the filtered samples (TDP) by Moges et al. (2017a, 2018). The soluble reactive phosphorus (SRP) by Tibebe et al. (2019) is indicated by solid spheres and is assumed to be similar to the orthophosphates. The plus signs represent the TDP measurement of Gilgel Abay (gray), Rib (green), Gumara, (yellow) by Alemu et al. (2017), Awramba watershed in the 2013 rain phase by Moges et al. (2016), and the Robit Bata (blue) watershed during the rain phase in 2017 and 2018 of Sishu et al. (2021). The Awramba P-PO4 concentrations in the Rib watershed in the Fogera Plain are indicated by a multiplication sign and flow-weighted concentration in the lake near the outlet measured by us by a green star.
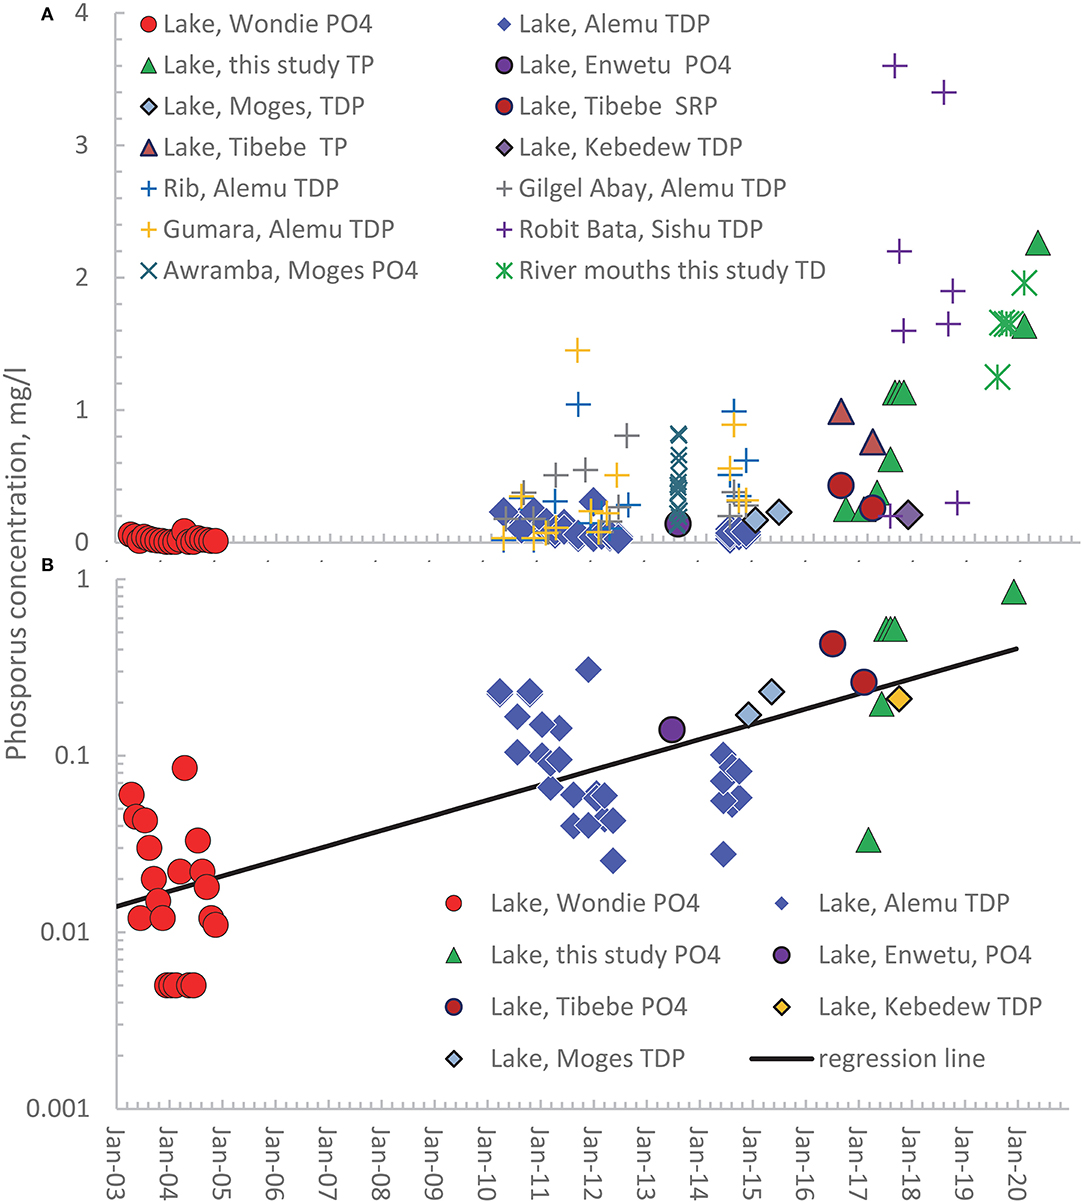
Figure 2. Published and observed concentrations of orthophosphate (PO4), soluble reactive phosphorus (SRP), total dissolved phosphorus (TDP) on filtered samples, and total phosphorus (TP) on unfiltered samples in the rivers in the Lake Tana basin and the lake from 2003 to 2020. (A) Observed concentrations in the Lake (solid symbols) and rivers (mathematical signs); (B) Actual and converted P-PO4 concentrations and TDP concentration for the lake plotted on a log10 scale. The names in the legend refer to the first author of the publication in which the data are listed.
Since the rivers contribute approximately annually 20% of the lake volume (Alemu et al., 2020), the annual variation in phosphorus concentrations in the rivers is, as expected, greater than in the Lake (Figure 2A). The low flow P concentrations in the rivers are equal to that in the groundwater in the valley bottom (Moges et al., 2016, 2018). In contrast, the saturation excess surface runoff originates from the degraded and fertilized cropland outside the valley bottom during high flow. Thus, the greatest river flows also have the greatest concentrations and are dampened in Lake that integrates all concentrations.
It is obvious from Figure 2A that there is an upward trend in phosphorus concentrations, but the different phosphorus forms make the interpretation problematic. We, therefore, made various approximations to convert TP and SRP measurements to orthophosphate (P-PO4). The SRP and orthophosphate indicate the inorganic form of P and have been used interchangeably (Carlson and Simpson, 1996). To convert our TP measurements to orthophosphate, we regressed the orthophosphate and total P concentration made on the same samples collected by Tibebe et al. (2019) around the same time (Supplementary Figure S1). The regression equation with an R2 of 0.63 was
where P-PO4 is the orthophosphate concentration and TP is the total phosphorus concentration, both in mg/l. We could not find a relationship between TDP and P-PO4 and assumed they were of the same order. The converted TP (as P-PO4) and the TDP are plotted in Figure 2B on the log scale. A straight line fits the data well with an R2 = 0.67 and a regression of
where DP is the dissolved phosphorus concentration (either P-PO4 or TDP) in mg/l and t is the years after January 1, 2003. Thus, the dissolved phosphorus concentrations in Lake Tana are exponentially increasing.
Nitrogen
Fewer nitrogen than phosphorus concentrations are published for Lake Tana and its main tributaries. The data available are plotted in Figure 3. As with Figure 2, the solid symbols are for concentration measurements. The spheres in Figure 3 are the nitrate measurement consisting of the early measurement in 2003 and 2004 of Wondie et al. (2007), the observations by Goshu and Aynalem (2017) in the southern part of Lake Tana in 2010, and the nitrate concentrations determination in the northern and southern nearshore area by Tibebe et al. (2019) around 2017. Nitrate concentrations at the Awramba watershed outlet were measured by Moges et al. in the rain phase in 2013 but have not been published before (Figure 3). Finally, TN (green stars) near the lake around the river mouths were measured by us (shown in Table 2) are the weighted average of the four rivers. The green triangles represent our TN observations in the Lake.
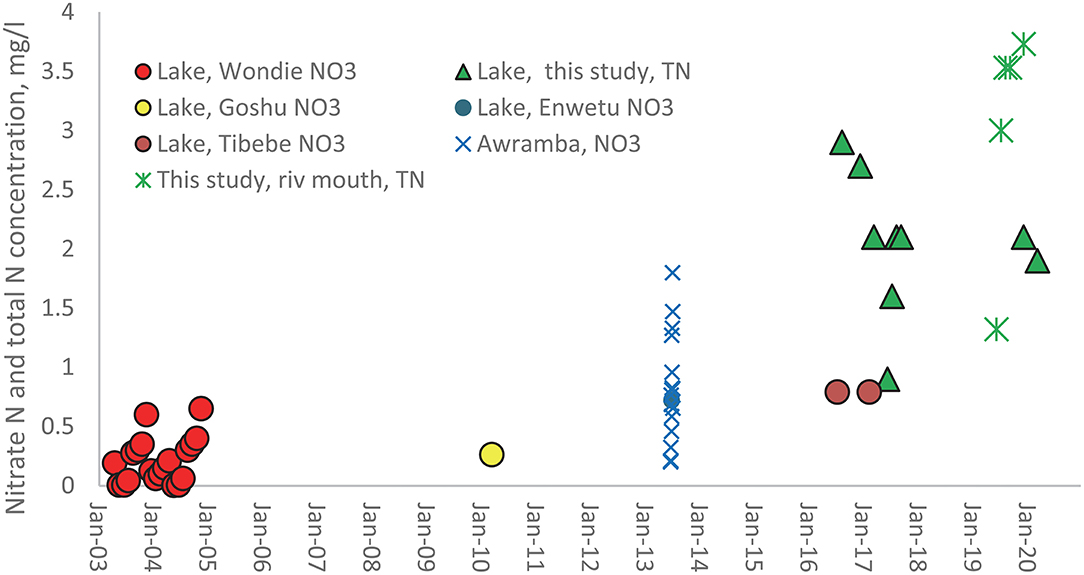
Figure 3. Available nitrate and total N concentrations in Lake Tana (solid symbols) and the rivers (mathematical signs) in the basin from 2003 to 2020. The names in the legend refer to the first author of the publication in which the data are listed.
The nitrate data taken by Wondie et al. (2007) have the same annual pattern in both years. The concentrations increase from July to November or December when the discharges are relatively the greatest and then decline rapidly of the dry phase to almost zero at the end of the dry phase. The only physical or chemical process that can explain this decrease is denitrification at this time of the year since river discharge is negligible. Other processes such as evaporation and nitrogen-fixing from the atmosphere would increase the concentration (Howarth et al., 1988; Preston and Brakebill, 1999; Wortman and Dawson, 2015). Especially, the wetlands play a critical role in denitrification (Abrahamsson and Håkanson, 1998; Ayele and Atlabachew, 2021). The increase during the rain phase is likely due to the contribution of nitrate by the rivers. It cannot be verified since the nitrate concentration in the rivers was not available before 2013.
The nitrate concentration at the outlet of Awramba in 2013 measured by Moges et al. shows that high flows at the Awramba outlet exceeded the concentration in Lake Tana during the rain phase. Interestingly, the data also show that nitrate concentrations positively correlate with the P losses (R2 = 0.76, Supplementary Figure S2). Baseflow concentrations originate from the saturated valley bottoms where nitrate decreases due to denitrification (Akale et al., 2017). High flows come from the degraded soils on the hill slopes with cultivated and fertilized land that drains between rainstorms. The Moges data agree with our hypothesis on the increase in nitrate concentrations during the rain phase, as the data set of Wondie et al. (2007) showed.
The nitrate concentrations in Figure 3 increase (Wondie et al., 2007; Goshu and Aynalem, 2017; Tibebe et al., 2019), but it is not significant due to large variation in the observed data. It is not obvious whether the trend is linear or exponentially. Our TN measurements do not indicate an increasing trend in nitrogen concentrations over the last few years.
Nitrogen and Phosphorus Ratio
The nitrogen and phosphorus (N/P) ratio, according to the literature, affects eutrophication and the growth of water hyacinths (Downing and McCauley, 1992; Guildford and Hecky, 2000; Elser et al., 2009). The weight-based ratios shown in Figure 4 are calculated from the publications that published both nitrogen and phosphorus measurements. The nitrate and orthophosphate ratios of Wondie et al. (2007), Ewnetu et al. (2014), and Tibebe et al. (2019) are depicted as solid spheres in Figure 4. The large fluctuations in TN and TP ratios in 2003 and 2004 in Figure 4 from near zero in the dry phase to near 60 just after the rain phase mirror the nitrogen concentration in the Lake in Figure 3 since the phosphorus concentrations are relatively constant (Figure 2). Our TN/TP ratios for the lake are shown as green triangles, and the ratios at the river mouths as green stars. Figure 4 shows a downward trend in the data, but the regression with time has only an R2 = 0.21.
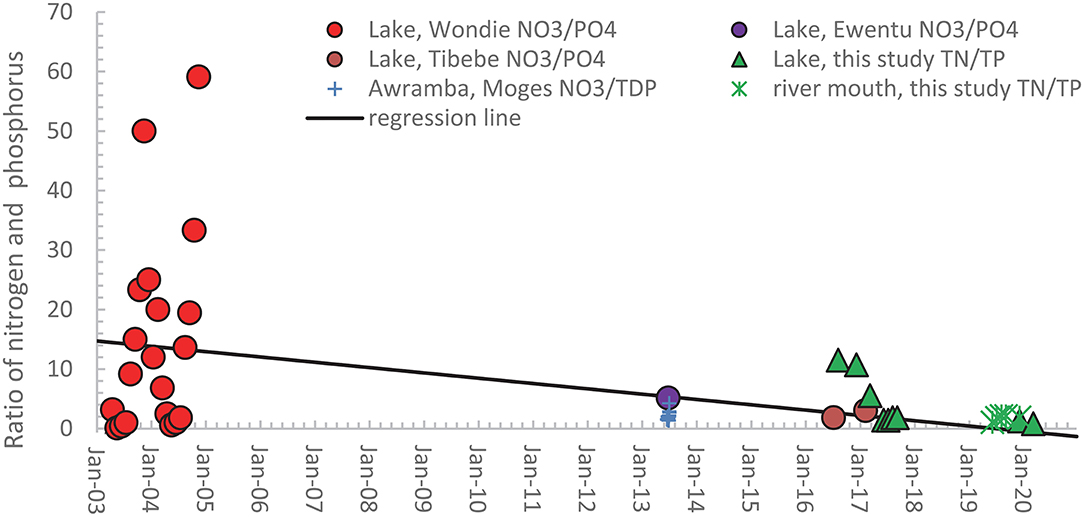
Figure 4. Calculated nitrogen phosphorus ratios on a weight basis for available studies with pairs of nitrate, orthophosphate concentrations or total N and total P concentrations in Lake Tana (solid symbols) and the rivers (mathematical signs) in the basin from 2003 to 2020. The names in the legend refer to the first author of the publication in which the data are listed.
Taking the Redfield weight ratio between 6 and 8 as the boundary between phosphorus and nitrogen-limited conditions (Redfield, 1958; Howarth et al., 1988), the lake in 2003 and 2004 was phosphorus limited during the rain and early dry phase. It becomes nitrogen-limited in the last half of the dry phase when the nitrate concentrations decrease to near zero. Except for two TN/TP ratios in 2017 just above the Redfield ratio, all other N and P ratios indicate the lake and the rivers were nitrogen-limited in 2013 and later (Figure 4).
P and N Mass Balance in Lake Tana
Annual inflow and outflow data were taken from Alemu et al. (2020) study for a period with above and below-average rainfall. To understand the future trend of the nutrient concentration, we calculated the annual incoming nutrient load from the rivers in Lake Tana and the load leaving either through the Tana Beles tunnel or the Blue Nile outlet. We approximated the concentrations in the rivers as the average annual concentration in 2019 presented in Table 1. The proportion of the annual flow originating in the south, west, north and east sides of the lake was based on the measurements made by Dessie et al. (2017). Finally, the annual lake elevation patterns were assumed the same so that the elevation changes in the lake could be neglected.
The load of TP and TN for the sides was calculated as the product of the observed concentration and the annual river flow (Table 5). The greatest TN and TP load was contributed to the lake in the south, where the Gilgel Abay entered the lake. The Gilgel Abay has the largest drainage basin and the highest rainfall over 2 m per year in the headwaters. The eastern side where the Rib and the Gumara enter the lake had the next highest load. It was followed by the Megech River in the north and a few minor streams in the west (Table 5). To calculate the load leaving the lake, we multiplied the discharge from the lake by the average concentration. We find an annual excess of ~5.5 Gg TN and TP (Table 5).
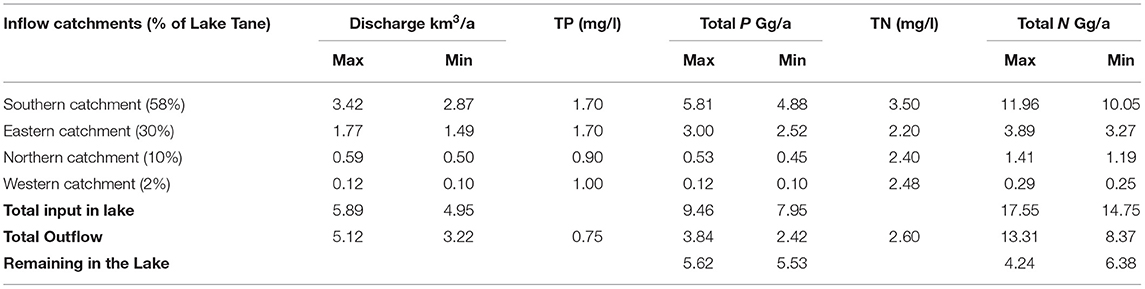
Table 5. Mass balance of total phosphorus (TP) and total nitrogen (TN) of Lake Tana using concentrations observed in 2019 and average discharges during a wet and dry period taken from Alemu et al. (2020).
Since the average volume of the lake is 30 km3, the excess load is equivalent to an increase in the concentration of 0.18 mg P/l/a. Over the 3.5 years of the study, we would expect an increase of 0.6 mg P/l. As shown in Table 3, the concentration difference between August 2016 and September 2019 is 0.8 P/mg/l, which is in the same order as the load calculations in Table 5. However, TP concentrations increased steeply in December 2019 and March 2020 to 1.8 mg P/l. The load calculation underestimated this rapid rise. One of the reasons that the P loads were underestimated over the 3.5 years was because the samples for concentration determination were taken in the lake near the mouth of the rivers, and lake water might have mixed with river water resulting in lower concentrations. Another reason could be the arithmetic averages calculation of the concentrations. The highest flows have the greatest concentrations, as the Moges et al. (2016) data showed for the Awramba watershed.
Since TP and TN loads were approximately equal (Table 5), we expected, based on the load calculations, to see a similar increase in TN concentrations of 0.18 mg N/l/a. The expected increase in nitrogen concentrations due to the surplus of nitrogen added did not materialize as the concentration of TN during the last 4 years remained nearly the same (Table 4; Figure 3).
The difference between P and N accumulation in the lake can be explained by considering the difference in sinks. The phosphorus concentration in the water column is in equilibrium with the bottom sediment (Table 2) because the lake is shallow and fully mixed (Kebedew et al., 2020b). The incoming sediment from the rivers that have settled on the lake bottom will mix with the bottom sediment with a lower P concentration deposited earlier, lowering the P concentration in the water column. Therefore, the lake's increase in concentration is delayed compared to that in the rivers. This trend is visible in Figure 2, where the TDP concentrations around the same date during the rain phase were greater in the river than in the lake. The lake P concentration catches up with the river after 3–4 years. Thus, unlike deep lakes, where sediment deposition takes P out of the water column, there is no sink term for P in lake Tana because of its shallow depth. Consequently, the P concentration in the lake can only decrease when the load in the outflow is greater than the load from the rivers.
The lake nitrogen concentration can be lowered by denitrification of nitrate to nitrogen gasses, plant uptake, and outflow (Abrahamsson and Håkanson, 1998; Ayele and Atlabachew, 2021) in the lake and surrounding wetlands. Abrahamsson and Håkanson (1998) show that denitrification is essential in nitrogen assimilation in the lake. The assimilation capacity of the Lake has been changing over the 17 years that data were collected. In 2003 and 2004, denitrification brought down the nitrogen concentrations to near zero at the end of the dry phase (Figure 3). In March 2010, the nitrate concentration was 0.25 mg N/l (Goshu and Aynalem, 2017), indicating that not all sources (i.e., fixing atmospheric nitrogen loads) delivered by the rivers could not be assimilated. Therefore, it does not seem accidental that in 2010, when the lake and its wetlands could not fully assimilate the nitrogen, the first water hyacinths were noted in Lake Tana.
Spatial Distribution of Water Quality Chlorophyll and Water Hyacinths
We found that the greatest infestation of water hyacinths occurred in the northeastern part of the Lake. To investigate whether the location of water hyacinth was related to TN, TP concentrations or the TN/TP ratio, we plotted the average values of these parameters over the measurement period (shown in Table 4) counterclockwise starting at the Gumara in Figure 5. There is not a unique relationship between any of the variables. It could be argued that the phosphorus concentrations are greater in the water hyacinth-infested area. But at the same time, phosphorus concentrations are just high without water hyacinth on the western shore (sampling locations 27, 26, 25) and location 24 on the southern shore near the flower greenhouse. The nitrate concentrations and the TN/TP ratios are not different in the water hyacinth-infested areas than elsewhere.
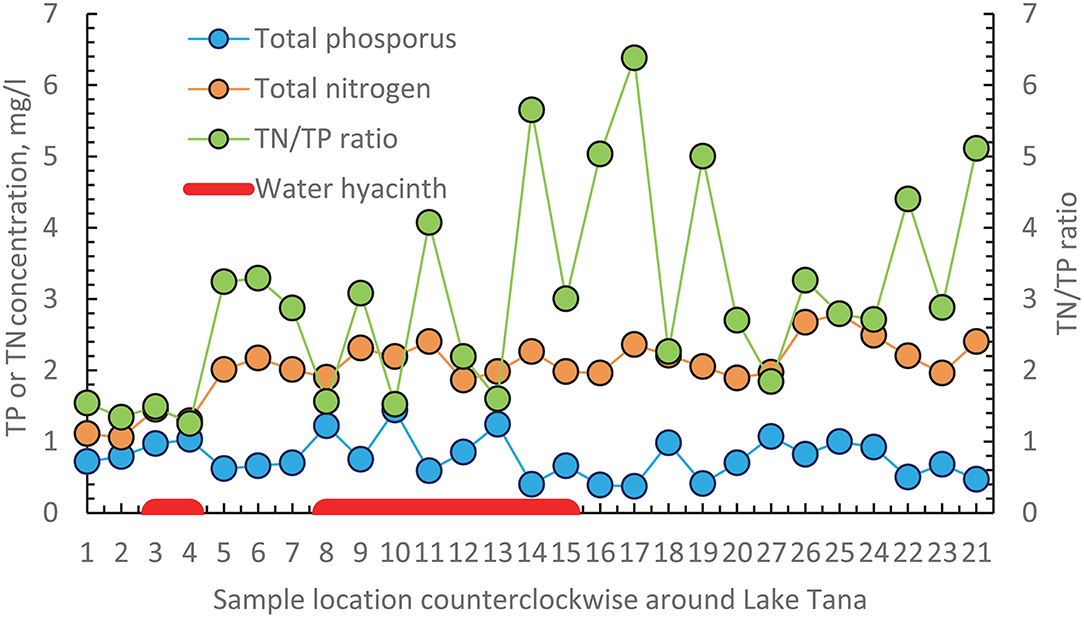
Figure 5. Average values over the 3.5 years experimental period of total phosphorus (TP) and total nitrogen (TN) concentration and the average TN and TP ratio are plotted in a counterclockwise direction for all sampling points starting at the Gumara. The red bar indicates the location where the water hyacinth is present. Figure 1 gives the location of the sampling stations.
Water hyacinth is a floating plant that will move with the water currents and be pushed by the wind. With a TN/TP ratio below the critical value of 7 and TN concentrations >1 mg N/l, water hyacinths can potentially emerge anywhere in Lake Tana (Center and Spencer, 1981). Thus, it should not be limited to the northeast. Kebedew et al. (2020b) show that the water of the Gumura and the Rib moves to the north and then to the west, where it will eventually evaporate. The flow from the Gilgel Abay flows directly to the outlet of the Tana Beles hydroelectric power plant or when the lake is at its maximum level to the Blue Nile inlet. The wind over the lake is predominantly southeast. Thus, water hyacinths emerging in the northern paper part of the lake will eventually end up in the northeast. It will not flow westward with the lake current due to the wind. Water hyacinth in the southern part of the lake will likely leave through one of the outlets. Thus, the elevated phosphorus concentration in the water hyacinths area might be due to dying off the water hyacinths and not the cause of the water hyacinths in these locations.
Finally, to investigate the relationship between Chl-a and the remaining nutrients, we plotted the average Chl-a concentrations as a function of the ratio of TN and TP (all listed in Table 4) for the 17 sampling points that were located in areas without water hyacinth and the 10 with water hyacinths. Figure 6 shows that Chl-a concentrations in water hyacinth-infested areas were generally lower than elsewhere. The lower concentration is a consequence of water hyacinth shading the water. Consequently, the algae that need sunlight for growth do not multiply. In the non-shaded areas, the CHL-a concentrations depended on the nutrient concentration. Only in the locations shaded by the water hyacinth (Figure 5) do the Chl-a concentrations decrease linearly with the TN and TP ratio. Wondie et al. (2007) showed the algae group of diatoms was most abundant in 2003, but currently, the blue-green algae (in the non-shaded areas) could dominate, which needs future research.
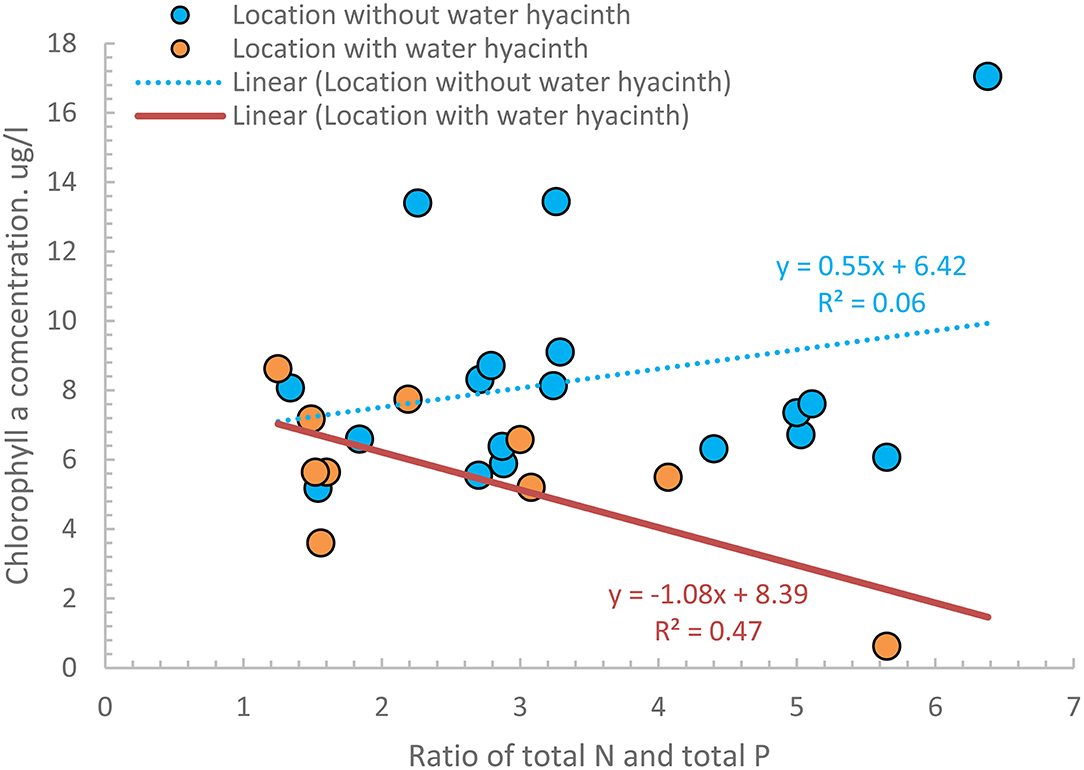
Figure 6. Four-year averages concentrations of the ratio of TN and TP and chlorophyll-a concentrations for 27 nearshore stations in Lake Tana, of which 10 were infested with water hyacinth.
Management of the Lake for Water Quality
Water quality has decreased slowly in the once pristine lake (Cheesman, 1936). Water hyacinth appeared first in the lake around 2010 when the assimilation capacity of the lake and wetland for nitrogen was exceeded, and nitrate was available for plant uptake year around. Currently, the area coverage of water hyacinth is 1% of the lake area, which is manageable. However, measures should be taken to prevent further expansion.
To consider what management practices are effective, we note that the N and P ratio is below the Redfield ratio of 6–8 (Figure 4), and the lake is nitrogen-limited. Thus, water hyacinths growth depends on the nitrogen concentration that, according to our findings (Figure 3; Table 3), increases slightly throughout the measurement period but has not increased significantly in the last few years. Therefore, to manage the water hyacinth expansion, the nitrogen concentration in the lake needs to be controlled, which is problematic because blue-green algae will fix atmospheric nitrogen when the N and P ratio is <6–8, as currently is the case. When the lake was free of water hyacinth in 2003, the N and P ratio was greater than during the rain and post-rain phase, diatoms instead of blue-green algae were dominant, and nitrogen was not fixed from the air (Wondie et al., 2007). Thus, to prevent nitrogen fixation, the growth of blue-green algae, both P and N concentrations in the lake need to be reduced and the P and N ratio increased (Bulgakov and Levich, 1999).
Several practices can decrease the N and P concentrations in the lake. They consist of reducing nitrogen and phosphorus input by the rivers, removing water hyacinths from the lake, and enhancing denitrification in case of nitrogen (Mucheye et al., 2018; Worku and Sahile, 2018). Since phosphorus cannot be removed from the lake other than with the water flowing out, phosphorus concentration can only be reduced by decreasing the P load.
Our results indicate that the largest source of nutrients is the fertilizers applied on the cropland, as large flows that originate from the croplands have the greatest P and N concentrations and contribute the greatest loads. Leaching of nutrients from the soil cannot be prevented with the high rainfall amounts. Therefore, fertilizers should be applied ideally in small quantities throughout the rainy period at a time so that crops need to reduce the concentrations. Point source pollution and animal manure (Goshu et al., 2020) result in a steady increase during the whole year. It might also be occurring and can become a greater source in the future.
To evaluate the effectiveness of water hyacinth harvesting on improving the water quality in Lake Tama, we calculated the nitrogen and phosphorus mass harvested from the 25 km2 water hyacinth infestation. Tewabe et al. (2017) found that 82 Mg/ha of fresh weight can be harvested during the dry phase and 270 Mg/ha during the rainy phase for a total of 352 Mg/ha/year in Lake Tana. The dry mass is ~5% of the fresh weight. Su et al. (2018) found that the P content was 0.5% and N was 2.8% on a dry weight basis. Based on these numbers, 88 kg P and 492 kg N can be removed per hectare per year. For an area of 25 km2 of water hyacinth, 0.22 Gg P/year and 1.2 Gg N/year can be harvested. It is <5% of the excess P added to the lake and around 20% of the N added (Table 5).
Finally, nitrate can be reduced by enhancing denitrification. Lake water levels perhaps could be managed to optimize denitrification. To do this will require more research. Moreover, wetlands within the watershed should be preserved to denitrify the nitrates before entering Lake Tana. Thus, it is not too late to prevent the expansion of water hyacinths by carefully controlling the nitrogen and phosphorus sources for both point and non-point sources. Finding the most effective measures will require more research, and implementation might be politically difficult. However, if no measures are taken, Lake Tana's water quality will decrease further due to the imbalance of nutrient input and that taken out of the Lake.
Conclusions
The objective of this study was to characterize the phosphorus, nitrogen and Chlorophyll-a concentration of Lake Tana currently infested with water hyacinth based on data collected by us from 2016 to 2020 and that available in the literature. We found that the average total lake phosphorus concentrations increased exponentially. Nitrogen increased at a lower rate, although the load was nearly the same due to loss of nitrogen due to denitrification. As a result, the ratio of N and P decreased to below the Redfield ratio of 6–7, and the lake became nitrogen limiting. The intensifying agriculture is likely partly to blame due to the fertilizers applied, of which the crops only use a small percentage. The remainder is transported with the water and deposited in the lake. Since the lake is shallow and fully mixed, the sediment on the bottom is continuously suspended.
We found that the greatest infestation of water hyacinths occurred in the northeastern part of the Lake that had at the same time the greatest TP concentrations of over 1 mg/L. The lake circulation pattern and the prevailing wind direction are the most likely reason the water hyacinths are in the northeast. The high TP might be a consequence of the water hyacinths but not the cause for its expansion in the northeast.
Since the expansion of water hyacinth in Lake Tana can be slowed down by reducing the nitrogen and phosphorus input, identifying the locations in the landscape that produce more runoff and erosion and the point sources with high N and P loads are essential. Based on experiences in other watersheds, removing point sources will result in a faster improvement in water quality. In addition, optimizing the timing in the application and the amount of fertilizers on runoff and erosion-prone areas due to the legacy P in the landscape restore the lake water quality.
While in temperate climates with modest rainfall, best agricultural management practices have been established in improving water quality in landscapes with saturation excess runoff (Hoang et al., 2019), such as in the Catskill Mountains, NY, US, it is not known if these practices are effective in climates with daily rainfall amounts far exceeding that in temperate climates during the growing season. Since time is of the essence in preventing greater water hyacinth infestation and water quality degradation, this research on best management practices should start immediately so that effective practices can be implemented in the near future.
Data Availability Statement
The raw data supporting the conclusions of this article will be made available by the authors, without undue reservation.
Author Contributions
MD: conceptualization, methodology, data curation, data analysis, and writing an original draft. AK, BE, MK, FZ, WA, and DM: data collection and laboratory analysis. AM, ST, AW, MM, and TS: conceptualization, supervision, and rewriting and editing. FZ, WA, DM, and MK: reviewing and editing. All authors contributed to the article and approved the submitted version.
Funding
This research was funded by Bahir Dar University (Bahir Dar Institute of Technology, School of Research and Postgraduate) and International Water Management Institute (IWMI) as part of Feed the Future Innovation Lab for Small Scale Irrigation (AID-OAA-A-13-0005), the Feed the Future Innovation Lab for Sustainable Intensification (AID-OAA-L-14-00006) through the Sustainably Intensified Production Systems Impact on Nutrition (SIPSIN) and Blue Nile Water Institute for data collection.
Conflict of Interest
The authors declare that the research was conducted in the absence of any commercial or financial relationships that could be construed as a potential conflict of interest.
Publisher's Note
All claims expressed in this article are solely those of the authors and do not necessarily represent those of their affiliated organizations, or those of the publisher, the editors and the reviewers. Any product that may be evaluated in this article, or claim that may be made by its manufacturer, is not guaranteed or endorsed by the publisher.
Acknowledgments
We would like to thank the boat operator, Gizework Abate and the Chemical Lab Personnel, Lidya Tesfaye, and Mestawot Girma for their dedication. Without them, the project could not have been carried out.
Supplementary Material
The Supplementary Material for this article can be found online at: https://www.frontiersin.org/articles/10.3389/frwa.2022.774710/full#supplementary-material
References
Abera, A., Verhoest, N. E., Tilahun, S., Inyang, H., and Nyssen, J. (2021). Assessment of irrigation expansion and implications for water resources by using RS and GIS techniques in the Lake Tana Basin of Ethiopia. Environ. Monit. Assess. 193, 1–17. doi: 10.1007/s10661-020-08778-1
Abrahamsson, O., and Håkanson, L. (1998). Modelling seasonal flow variability of European rivers. Ecol. Model. 114, 49–58. doi: 10.1016/S0304-3800(98)00117-3
Adem, A. A., Addis, G. G., Aynalem, D. W., Tilahun, S. A., Mekuria, W., Azeze, M., et al. (2020). Hydrogeology of volcanic highlands affects prioritization of land management practices. Water 12, 2702. doi: 10.3390/w12102702
Akale, A. T., Dagnew, D. C., Giri, S., Belete, M. A., Tilahun, S. A., Mekuria, W., et al. (2017). Groundwater quality in an up-land agricultural watershed in the sub-humid ethiopian highlands. J. Water Resou. Prot. 9, 1199–1212. doi: 10.4236/jwarp.2017.910078
Alemu, M. L., Geset, M., Mosa, H. M., Zemale, F. A., Moges, M. A., Giri, S. K., et al. (2017). Spatial and temporal trends of recent dissolved phosphorus concentrations in Lake Tana and its four main tributaries. Land Degrad. Dev. 28, 1742–1751. doi: 10.1002/ldr.2705
Alemu, M. L., Worqlul, A. W., Zimale, F. A., Tilahun, S. A, and Steenhuis, T. S. (2020). Water balance for a tropical lake in the volcanic highlands: lake Tana, Ethiopia. Water 12, 2737. doi: 10.3390/w12102737
Anteneh, W., Tewabe, D., Assefa, A., Zeleke, A., Tenaw, B., and Wassie, Y. (2015). Water Hyacinth Coverage Survey Report on Lake Tana Biosphere Reserve, Technical Report Series 2. Bahir Dar: Bahir Dar University.
Ayele, H. S., and Atlabachew, M. (2021). Review of characterization, factors, impacts, and solutions of Lake eutrophication: lesson for lake Tana, Ethiopia. Environ. Sci. Pollut. Res. 28, 14233–14252. doi: 10.1007/s11356-020-12081-4
Berzina, L., and Sudars, R. (2010). Seasonal characterisation and trends study of nutrient concentrations in surface water from catchments with intensive livestock farming. Environ. Clim. Technol. 5, 8–15. doi: 10.2478/v10145-010-0029-0
Bremner, J. M. (1965). Total nitrogen. Methods of Soil Analysis: Part 2 Chemical and Microbiological Properties, 9, pp.1149–1178.
Bulgakov, N. G., and Levich, A. P. (1999). The nitrogen: phosphorus ratio as a factor regulating phytoplankton community structure. Archiv. Hydrobiol. 146, 3–22. doi: 10.1127/archiv-hydrobiol/146/1999/3
Burger, D. F., Hamilton, D. P., and Pilditch, C. A. (2008). Modelling the relative importance of internal and external nutrient loads on water column nutrient concentrations and phytoplankton biomass in a shallow polymictic lake. Ecol. Model. 211, 411–423. doi: 10.1016/j.ecolmodel.2007.09.028
Carlson, R. E., and Simpson, J. (1996). A Coordinator's Guide to Volunteer Lake Monitoring Methods. North American Lake Management Society. 96. Available online at: https://www.nalms.org/secchidipin/monitoring-methods/phosphorus/ (accessed January 1, 2022).
Center, T. D., and Spencer, N. R. (1981). The phenology and growth of water hyacinth (Eichhornia-crassipes (Mart) Solms) in a eutrophic north-central Florida lake. Aquat. Bot. 10, 1–32. doi: 10.1016/0304-3770(81)90002-4
Cheesman, R. E. (1936). Lake Tana and the Blue Nile: An Abyssinian Quest. London: Macmillan and Co, 400
Conway, D. (1997). A water balance model of the Upper Blue Nile in Ethiopia. Hydrol. Sci. J. 42, 265–286. doi: 10.1080/02626669709492024
Correll, D. L. (1998). The role of phosphorus in the eutrophication of receiving waters: a review. J. Environ. Qual. 27, 261–266. doi: 10.2134/jeq1998.00472425002700020004x
Dersseh, M. G., Kibret, A. A., Tilahun, S. A., Worqlul, A. W., Moges, M. A., Dagnew, D. C., et al. (2019). Potential of water hyacinth infestation on lake Tana, Ethiopia: a prediction using a GIS-based multi-criteria technique. Water 11, 1921. doi: 10.3390/w11091921
Dersseh, M. G., Tilahun, S. A., Worqlul, A. W., Moges, M. A., Abebe, W. B., Mhiret, D. A., et al. (2020). Spatial and temporal dynamics of water hyacinth and its linkage with lake-level fluctuation: lake Tana, a sub-humid region of the Ethiopian highlands. Water 12, 1435. doi: 10.3390/w12051435
Dessie, M., Verhoest, N. E., Adgo, E., Poesen, J., and Nyssen, J. (2017). Scenario-based decision support for an integrated management of water resources. Int. J. River Basin Manag. 15, 485–502. doi: 10.1080/15715124.2017.1345917
Dessie, M., Verhoest, N. E., Pauwels, V. R., Adgo, E., Deckers, J., Poesen, J., et al. (2015). Water balance of a lake with floodplain buffering: lake Tana, Blue Nile Basin, Ethiopia. J. Hydrol. 522, 174–186. doi: 10.1016/j.jhydrol.2014.12.049
Downing, J. A., and McCauley, E. (1992). The nitrogen: phosphorus relationship in lakes. Limnol. Oceanogr. 37, 936–45. doi: 10.4319/lo.1992.37.5.0936
Elser, J. J., Andersen, T., Baron, J. S., Bergström, A. K., Jansson, M., Kyle, M., et al. (2009). Shifts in lake N: P stoichiometry and nutrient limitation driven by atmospheric nitrogen deposition. Science 326, 835–837. doi: 10.1126/science.1176199
Ewnetu, D. A., Bitew, B. D., and Chercos, D. H. (2014). Determination of surface water quality status and identifying potential pollution sources of Lake Tana: particular emphasis on the Lake Boundary of Bahirdar City, Amhara Region, North West Ethiopia, 2013. J. Environ. Earth Sci. 4, 88–97. doi: 10.20372/nadre:1547201708.57
Firehun, Y., Abera, T., Tariku, G., and Taye, T. (2007). Distribution, impact and management of water hyacinth at Wonji-Shoa sugar factory. Eth. J. Weed Manage. 1, 41–52.
Firehun, Y., Struik, P. C., Lantinga, E. A., and Taye, T. (2014). Water hyacinth in the Rift Valley water bodies of Ethiopia: its distribution, socio-economic importance and management. Int. J. Curr. Agric. Res. 3, 67–75.
Firehun, Y., Struik, P. C., Lantinga, E. A., and Taye, T. (2015). Adaptability of two weevils (Neochetina bruchi and Neochetina eichhorniae) with potential to control water hyacinth in the Rift Valley of Ethiopia. Crop Prot. 76, 75–82 doi: 10.1016/j.cropro.2015.06.015
Forsberg, C. (1989). Importance of sediments in understanding nutrient cyclings in lakes. Hydrobiologia 176, 263–277. doi: 10.1007/BF00026561
Gaikwad, R. P., and Gavande, S. (2017). Major factors contributing growth of water hyacinth in natural water bodies. Int. J. Eng. Res. 6, 304–306. doi: 10.5958/2319-6890.2017.00024.1
Giardino, C., Pepe, M., Brivio, P. A., Ghezzi, P., and Zilioli, E. (2001). Detecting chlorophyll, Secchi disk depth and surface temperature in a sub-alpine lake using Landsat imagery. Sci. Total Environ. 268, 19–29. doi: 10.1016/S0048-9697(00)00692-6
Goshu, G., and Aynalem, S. (2017). “Problem overview of the lake Tana basin, ” in Social and Ecological System Dynamics. AESS Interdisciplinary Environmental Studies and Sciences Series, eds K. Stave, G. Goshu, and S. Aynalem (Cham: Springer), 9–23. doi: 10.1007/978-3-319-45755-0_2
Goshu, G., Koelmans, A. A., and de Klein, J. J. M. (2017). “Water quality of lake tana basin, upper blue nile, ethiopia. A review of available data, ” in Social and Ecological System Dynamics. AESS Interdisciplinary Environmental Studies and Sciences Series, eds K. Stave, G. Goshu, and S. Aynalem (Cham: Springer). doi: 10.1007/978-3-319-45755-0_10
Goshu, G., Strokal, M., Kroeze, C., Koelmans, A. A., and de Klein, J. J. M. (2020). Assessing seasonal nitrogen export to large tropical lakes. Sci. Total Environ. 731, 139199. doi: 10.1016/j.scitotenv.2020.139199
Guildford, S. J., and Hecky, R. E. (2000). Total nitrogen, total phosphorus, and nutrient limitation in lakes and oceans: is there a common relationship? Limnol. Oceanogr. 45, 1213–1223. doi: 10.4319/lo.2000.45.6.1213
Hecky, R. E., Mugidde, R., Ramlal, P. S., Talbot, M. R., and Kling, G. W. (2010). Multiple stressors cause rapid ecosystem change in Lake Victoria. Freshwater Biol. 55, 19–42. doi: 10.1111/j.1365-2427.2009.02374.x
Hejzlar, J., Šámalová, K., Boers, P., and Kronvang, B. (2006). Modelling phosphorus retention in lakes and reservoirs Water, Air, and Soil Pollution. Focus. 6, 487–494. doi: 10.1007/s11267-006-9032-7
Hoang, L., Mukundan, R., Moore, K. E. B., Owens, E. M., and Steenhuis, T. S. (2019). Phosphorus reduction in the New York City water supply system: A water-quality success story confirmed with data and modeling. Ecol. Eng. 135, 75–88. doi: 10.1016/j.ecoleng.2019.04.029
Howarth, R. W., Marino, R., and Cole, J. J. (1988). Nitrogen fixation in freshwater, estuarine, and marine ecosystems. 2. Biogeochemical controls. Limnol. Oceanogr. 33, 688–701. doi: 10.4319/lo.1988.33.4_part_2.0688
Jarvie, H. P., Sharpley, A. N., Scott, J. T., Haggard, B. E., Bowes, M. J., and Massey, L. B. (2012). Within-river phosphorus retention: accounting for a missing piece in the watershed phosphorus puzzle. Environ. Sci. Technol. 46, 13284–13292. doi: 10.1021/es303562y
Jeppesen, E., Meerhoff, M., Jacobsen, B. A., Hansen, R. S., Søndergaard, M., Jensen, J. P., et al. (2007). Restoration of shallow lakes by nutrient control and biomanipulation—the successful strategy varies with lake size and climate. Hydrobiologia 581, 269–285. doi: 10.1007/s10750-006-0507-3
Johnson, P. A., and Curtis, P. D. (1994). Water balance of Blue Nile river basin in Ethiopia. J. Irrig. Drainage Eng. 120, 573–590. doi: 10.1061/(ASCE)0733-9437(1994)120:3(573)
Kanownik, W., Policht-Latawiec, A., and Fudała, W. (2019). Nutrient pollutants in surface water—assessing trends in drinking water resource quality for a regional city in central Europe. Sustainability 11, 1988. doi: 10.3390/su11071988
Kast, J. B., Apostel, A. M., Kalcic, M. M., Muenich, R. L., Dagnew, A., Long, C. M., et al. (2021). Source contribution to phosphorus loads from the Maumee River watershed to Lake Erie. J. Environ. Manag. 279, 111803. doi: 10.1016/j.jenvman.2020.111803
Kebede, S., Travi, Y., Alemayehu, T., and Marc, V. (2006). Water balance of Lake Tana and its sensitivity to fluctuations in rainfall, Blue Nile basin, Ethiopia. J. Hydrol. 316, 233–247. doi: 10.1016/j.jhydrol.2005.05.011
Kebedew, M. G., Kibret, A. A., Tilahun, S. A., Belete, M. A., Zimale, F. A., and Steenhuis, T. S. (2020b). The relationship of lake morphometry and phosphorus dynamics of a tropical highland lake: lake Tana, Ethiopia. Water 12, 2243. doi: 10.3390/w12082243
Kebedew, M. G., Tilahun, S. A., Zimale, F. A., and Steenhuis, T. S. (2020a). Bottom sediment characteristics of a tropical lake: lake Tana, Ethiopia. Hydrology 7, 18. doi: 10.3390/hydrology7010018
Khan, F. A., and Ansari, A. A. (2005). Eutrophication: an ecological vision. Botan. Rev. 71, 449–482. doi: 10.1663/0006-8101(2005)0710449:EAEV2.0.CO;2
Koponen, S., Pulliainen, J., Servomaa, H., Zhang, Y., Hallikainen, M., Kallio, K., et al. (2001). Analysis on the feasibility of multi-source remote sensing observations for chl-a monitoring in Finnish lakes. Sci. Total Environ. 268, 95–106. doi: 10.1016/S0048-9697(00)00689-6
Kozerski, H. P., Behrendt, H., and Köhler, J. (1999). “he N and P budget of the shallow, flushed lake Müggelsee: retention, external and internal load, ” in Shallow Lakes' (Dordrecht: Springer), 159–166.
Larsen, D. P., and Mercier, H. T. (1976). Phosphorus retention capacity of lakes. J. Fish. Board Canada 33, 1742–1750. doi: 10.1139/f76-221
Magnien, R. E., Summers, R. M., and Sellner, K. G. (1992). External nutrient sources, internal nutrient pools, and phytoplankton production in Chesapeake Bay. Estuaries 15, 497–516. doi: 10.2307/1352393
Moges, M. A., Schmitter, P., Tilahun, S., Ayana, E., Ketema, A., Nigussie, T., and Steenhuis, T. (2017a). Water quality assessment by measuring and using landsat 7 etm+ images for the current and previous trend perspective: lake Tana Ethiopia. J. Water Res. Prot. 9, 1564–1585. doi: 10.4236/jwarp.2017.912099
Moges, M. A., Schmitter, P., Tilahun, S. A., Langan, S., Dagnew, D. C., Akale, A. T., et al. (2017b). Suitability of watershed models to predict distributed hydrologic response in the awramba watershed in the Lake Tana basin. Land Degr. Dev. 28, 1386–1397. doi: 10.1002/ldr.2608
Moges, M. A., Schmitter, P., Tilahun, S. A., and Steenhuis, T. S. (2018). Watershed modeling for reducing future non-point source sediment and phosphorus load in Lake Tana Basin, Ethiopia. Journal Soils and Sediment 18, 309–322. doi: 10.1007/s11368-017-1824-z
Moges, M. A., Tilahun, S. A., Ayana, E. K., Moges, M. M., Gabye, N., Giri, S., et al. (2016). Non-point source pollution of dissolved phosphorus in the ethiopian highlands: the awramba watershed near Lake Tana. CLEAN–Soil Air Water. 44, 593–737. doi: 10.1002/clen.201500131
Mooney, R. J., Stanley, E. H., Rosenthal, W. C., Esselman, P. C., Kendall, A. D., and McIntyre, P. B. (2020). Outsized nutrient contributions from small tributaries to a Great Lake. Proc. Natl. Acad. Sci. 117, 28175–28182. doi: 10.1073/pnas.2001376117
Mucheye, T., Yitaferu, B., and Zenebe, A. (2018). Significance of wetlands for sediment and nutrient reduction in Lake Tana Sub-Basin, Upper Blue Nile Basin, Ethiopia. Sustain. Water Resour. Manag. 4, 567–572. doi: 10.1007/s40899-017-0140-5
Navarro, L. A., and Kanyama-Phiri, G. Y. (2000). Water Hyacinth in Africa and the Middle East: A Survey of Problems and Solutions. Ottawa, ON: International Development Research Centre.
Osborne, P. L. (1980). Prediction of phosphorus and nitrogen concentrations in lakes from both internal and external loading rates. Hydrobiologia 69, 229–233. doi: 10.1007/BF00046797
Pettersson, K. (1998). Mechanisms for internal loading of phosphorus in lakes. Hydrobiologia 373, 21–25. doi: 10.1023/A:1017011420035
Polomski, R. F., Taylor, M. D., Bielenberg, D. G., Bridges, W. C., Klaine, S. J., et al. (2009). nitrogen and phophorus remediation by three floating aquatic Macrophytes in greenhousebased laboratory-scale surface constructed wetlands. Water Air Soil Pollut. 197, 223–232. doi: 10.1007/s11270-008-9805-x
Poppe, L., Frankl, A., Poesen, J., Admasu, T., Dessie, M., Adgo, E., et al. (2013). Geomorphology of the Lake Tana basin, Ethiopia. J. Maps 9, 431–437. doi: 10.1080/17445647.2013.801000
Prairie, Y. T. (1989). Statistical models for the estimation of net phosphorus sedimentation in lakes. Aquatic Sci. 51, 192–210. doi: 10.1007/BF00877742
Preston, S. D., and Brakebill, J. W. (1999). Application of Spatially Referenced Regression Modelling for the Evaluation of Total Nitrogen Loading in the Chesapeake Bay Watershed, 99–4504. Reston, VA: US Department of the Interior, US Geological Survey. doi: 10.3133/wri994054
Ramm, K., and Scheps, V. (1997). “Phosphorus balance of a polytrophic shallow lake with the consideration of phosphorus release, ” in Shallow Lakes' (Dordrecht: Springer), 43–53.
Reddy, K. R., and Tucker, J. C. (1983). Productivity and nutrient uptake of water hyacinth, Eichhornia crassipes. I. effect of nitrogen source. Econ. Bot. 37, 237–247. doi: 10.1007/BF02858790
Redfield, A. C. (1958). The biological control of chemical factors in the environment. Am. Sci. 46, 230A−221.
Robach, F., Hajnsek, I., Eglin, I., and Trémolières, M. (1995). Phosphorus sources for aquatic macrophytes in running waters: water or sediment?. Acta Botanica Gallica 142, 719–731. doi: 10.1080/12538078.1995.10515296
Singh, R., and Pandey, J. (2019). Non-point source-driven carbon and nutrient loading to Ganga River (India). Chem. Ecol. 35, 344–360. doi: 10.1080/02757540.2018.1554061
Sishu, K., Bekele, A. M., Schmitter, P., Tilahun, S. A., and Steenhuis, T. S. (2021). Phosphorus export from two contrasting rural watersheds in the (sub) humid Ethiopian Highlands. Front. Earth Sci. 9, e762703. doi: 10.3389/feart.2021.762703
Sitoki, L., Gichuki, J., Ezekiel, C., Wanda, F., Mkumbo, O. C., and Marshall, B. E. (2010), The Environment of Lake Victoria (East Africa): current status historical changes. Int. Rev. Hydrobiol. 95, 209–223. 10.1002/iroh.201011226
Smith, V. H. (1982). The nitrogen and phosphorus dependence of algal biomass in lakes: an empirical and theoretical analysis, Limnol. Oceanogr. 27, e1101. doi: 10.4319/lo.1982.27.6.1101
Søndergaard, M., Jensen, J. P., and Jeppesen, E. (1999). Internal phosphorus loading in shallow Danish lakes. Hydrobiologia 408, 145–152.
Steinebach, Y. (2019). Water quality and the effectiveness of european union policies. Water 11, 2244. doi: 10.3390/w11112244
Su, W., Qingping, S., Meisheng, X., Zhengshun, W., and Zhitong, Y. (2018). The resource utilization of water hyacinth (Eichhornia crassipes [Mart.] Solms) and its challenges. Resources. 7, 46. doi: 10.3390/resources7030046
Tebebu, T. Y., Bayabil, H. K., Stoof, C. R., Giri, S. K., Gessess, A. A., Tilahun, S. A., et al. (2017). Characterization of degraded soils in the humid Ethiopian highlands. Land Degrad. Dev. 28, 1891–1901. doi: 10.1002/ldr.2687
Tefera, B., and Kassa, H. (2017). “Trends and driving forces of eucalyptus plantation by smallholders in the Lake Tana watershed of Ethiopia, ” in Stave K, Goshu G, Aynalem S, eds. Social and Ecological System Dynamics (Cham: Springer, AESS Interdisciplinary Environmental Studies and Sciences Series).
Tewabe, D., Asmare, E., Zelalem, W., and Mohamed, B. (2017). Identification of impacts, some biology of water hyacinth (Eichhornia crassipes) and its management options in Lake Tana, Ethiopia. Net. J. Agric. Sci. 5, 8–15. doi: 10.30918/NJAS.51.16.039
Tibebe, D., Kassa, Y., Melaku, A., and Lakew, S. (2019). Investigation of spatio-temporal variations of selected water quality parameters and trophic status of Lake Tana for sustainable management, Ethiopia. Microchem. J. 148, 374–384. doi: 10.1016/j.microc.2019.04.085
USEPA US Environmental Protection Agency (1986). Quality Criteria for Water. Washington, DC: EPA Rpt. 440/5-86-001. U.S. EPA Office of Water Regulations and Standards. U. S. Gov. Print. Office (PB87-226759).
USEPA US Environmental Protection Agency (2000). Nutrient Criteria Technical Guidance Manual-Lakes and Reservoirs: Environmental Protection Agency, Office of Water, Office of Science and Technology. Washington, DC. EPA-822-B00-001.
Vollenweider, R. A. (1976). Advances in Defining Critical Loading Levels for Phosphorus in Lake Eutrophication. Memorie dell'Istituto Italiano di Idrobiologia. 33, 53–83.
Wold, A. P., and Hershey, A. E. (1999). Spatial and temporal variability of nutrient limitation in 6 North Shore tributaries to Lake Superior. J. N Am. Benthol. Soc. 18, 2–14. doi: 10.2307/1468005
Wondie, A. (2010). Improving management of shoreline and riparian wetland ecosystems: the case of Lake Tana catchment. Ecohydrol. Hydrobiol. 10, 123–131. doi: 10.2478/v10104-011-0017-4
Wondie, A. (2018). Ecological conditions and ecosystem services of wetlands in the Lake Tana area, Ethiopia. Ecohydrol. Hydrobiol. 18, 231–244. doi: 10.1016/j.ecohyd.2018.02.002
Wondie, A., Mengistu, S., Vijverberg, J., and Dejen, E. (2007). Seasonal variation in primary production of a large high altitude tropical lake (Lake Tana, Ethiopia): effects of nutrient availability and water transparency. Aquatic Ecol. 41, 195–207. doi: 10.1007/s10452-007-9080-8
Worku, M., and Sahile, S. (2018). Impact of water hyacinth, Eichhornia crassipes (Martius) (Pontederiaceae) in lake Tana Ethiopia: a review. J. Aquac. Res. Dev. 9, 520. doi: 10.4172/2155-9546.1000520
Worqlul, A. W., Collick, A. S., Rossiter, D. G., Langan, S., and Steenhuis, T. S. (2015). Assessment of surface water irrigation potential in the Ethiopian highlands: the Lake Tana Basin. Catena 129, 76–85. doi: 10.1016/j.catena.2015.02.020
Wortman, S. E., and Dawson, J. O. (2015). Nitrogenase activity and nodule biomass of cowpea (Vigna unguiculata L. Walp.) decrease in cover crop mixtures. Commun. Soil Sci. Plant Anal. 46, 1443–1457. doi: 10.1080/00103624.2015.1043457
Yan, S., and Guo, J. Y. (2021). Water Hyacinth: Environmental Challenges, Management and Utilization. Boca Raton FL: CRC Press.
Yang, L., Lei, K., Meng, W., Fu, G., and Yan, W. (2013). Temporal and spatial changes in nutrients and chlorophyll-α in a shallow lake, Lake Chaohu, China: an 11-year investigation. J. Environ. Sci. 25, 1117–1123. doi: 10.1016/S1001-0742(12)60171-5
Zhang, X. Y., Yue-Yu, S. U. I., Zhang, X. D., Kai, M. E. N. G., and Herbert, S. J. (2007). Spatial variability of nutrient properties in black soil of northeast China. Pedosphere 17, 19–29. doi: 10.1016/S1002-0160(07)60003-4
Zheng, B. H., Cao, C. J., Qin, Y. W., and Huang, M. S. (2008). Analysis of nitrogen distribution characters and their sources of the major input rivers of Three Gorges Reservoir. Huan jing ke xue Huanjing kexue 29, 1–6.
Keywords: Lake Tana, Nile, eutrophication, longterm, nitrogen, N/P ratio, phosphorus water quality, water hyacinth
Citation: Dersseh MG, Steenhuis TS, Kibret AA, Eneyew BM, Kebedew MG, Zimale FA, Worqlul AW, Moges MA, Abebe WB, Mhiret DA, Melesse AM and Tilahun SA (2022) Water Quality Characteristics of a Water Hyacinth Infested Tropical Highland Lake: Lake Tana, Ethiopia. Front. Water 4:774710. doi: 10.3389/frwa.2022.774710
Received: 12 September 2021; Accepted: 04 February 2022;
Published: 10 March 2022.
Edited by:
Jan Pietron, WSP Sverige, SwedenReviewed by:
Paul Christiaan Struik, Wageningen University and Research, NetherlandsShimelis Dessu, South Florida Water Management District, United States
Copyright © 2022 Dersseh, Steenhuis, Kibret, Eneyew, Kebedew, Zimale, Worqlul, Moges, Abebe, Mhiret, Melesse and Tilahun. This is an open-access article distributed under the terms of the Creative Commons Attribution License (CC BY). The use, distribution or reproduction in other forums is permitted, provided the original author(s) and the copyright owner(s) are credited and that the original publication in this journal is cited, in accordance with accepted academic practice. No use, distribution or reproduction is permitted which does not comply with these terms.
*Correspondence: Seifu A. Tilahun, satadm86@gmail.com