 Michael B. Tchintcharauli-Harrison1*
 Mary V. Santelmann1
 Hattie Greydanus1†Omar Shehab2Maria Wright3,4
- 1College of Earth, Ocean and Atmospheric Sciences, Oregon State University, Corvallis, OR, United States
- 2Natural Resources Consulting Engineers, Inc., Fort Collins, CO, United States
- 3Institute for Water and Watersheds, Oregon State University, Corvallis, OR, United States
- 4College of Engineering, Oregon State University, Corvallis, OR, United States
We used the EPA SWMM-5. 1 model to evaluate the relative impact of neighborhood design and constructed Low Impact Development (LID) features on infiltration, evaporation, and runoff for three future scenarios. In the Current Course (CC) future, current regulations and policies remain in place under lower rates of climate change and population growth. In the Stressed Resources (SR) future, rapid rates of population growth and climate change stress water systems, and conventional development patterns and management actions fail to keep pace with a changing environment. In the Integrated Water (IW) future, with the same rapid rates of climate change and population growth as the SR future, informed water management anticipates and adapts to expected changes. The IW scenario retains public open space, extensive use of constructed LID features, and has the lowest proportion of impervious surface. Neighborhood designs varied in the number of dwelling units, density of development, and spatial extent of nature-based solutions and constructed LID features used for stormwater management. We compared the scenarios using SWMM-5.1 for a set of NRCS Type 1a design storms (2-yr, 25-yr, 20% increase over 25-yr, 30% increase over 25-yr) with precipitation input at 6-min time steps as well as a set of 10-year continuous runs. Results illustrate the importance of neighborhood design in urban hydrology. The design with the highest proportion of impervious surface (SR future) produced runoff of up to 45–50% of precipitation for all variations of the 25-year storm, compared to 34–44 and 23–39% for the CC and IW futures, respectively. Evaporation accounted for only 2–3% of precipitation in the 25-year design storm simulations for any scenario. Results of continuous 10-year simulations were similar to the results of design storms. The proportion of precipitation that became runoff was highest in the SR future (33%), intermediate in the CC (16%), and lowest in the IW future (9%). Evaporation accounted for 6, 11, and 14 of precipitation in the SR, CC, and IW futures with LID, respectively. Infiltration was higher in scenarios with LID than for the same scenario without LID, and varied with the extent of LID employed, accounting for 59, 71, and 74% of precipitation in the SR, CC, and IW scenarios with LID. In addition to differences in performance for stormwater management, the alternative scenarios also provide different sets of co-benefits. The IW and SR future designs both provide more housing than the CC, and the IW future has the lowest cost of development per dwelling unit.
Introduction
The demands on urban water systems have become increasingly complex as cities seek to provide housing for larger populations, plan for and adapt to climate change, and comply with environmental regulations, while maintaining the livability and community identity sought by their residents (Wu, 2014; Childers et al., 2015). Recently, landscape architects, urban planners, and others have promoted the potential for a nexus approach (Liu et al., 2018), including use of nature-based solutions (such as riparian buffers, flood plain restoration, parks, and public open spaces) to help solve many of the problems posed by urbanization in the context of an uncertain future climate (Andersson et al., 2014; Meerow and Newell, 2017). Examples include the development of “sponge cities” in China and Southeast Asia (Jiang et al., 2018), as well as efforts in cities such as Portland, OR to reduce overflows from combined sewer systems through both sewer system redesign (Adderley and Mandilag, 2002), and installation and incorporation of multiple types of green infrastructure (City of Portland Bureau of Environmental Services, 2021). Numerous studies [e.g., those reviewed by Jefferson et al. (2017) and Bell et al. (2020)] have explored the impact of constructed Low Impact Development (LID) features such as bioretention cells, rain gardens and bioswales, rain barrels and green roofs on reducing stormwater runoff in cities.
However, relatively few studies have specifically assessed the relative impact of neighborhood design and constructed LID features for meeting multiple objectives during urban development. This project used a stakeholder-guided process to design alternative future scenarios representing contrasting approaches to development that would accommodate population growth, climate change, and meet current construction and design standards, and assessed the performance of each scenario at the scale of an urbanizing neighborhood. This work was part of a larger project to investigate the effectiveness of multiscale planning efforts to mitigate the impacts of both population growth and climate change in the Willamette Valley, Oregon (Santelmann et al., 2019; Wright et al., 2021). Here, we focused at the neighborhood scale to explore the impacts of different approaches to urbanization and stormwater management on catchment hydrology and other metrics reflecting co-benefits such as spatial extent of public open space and cost per dwelling unit. Our stakeholders were interested in exploring the extent to which retention of riparian forest and development designs that vary housing density and preserve public open space might contribute to the achievement of desired stormwater management goals, and the magnitude of these effects as compared to the impact of constructed LID features.
This work addresses the following research questions about the hydrologic effects of urbanization at the scale of an urbanizing neighborhood:
• Can nature-based solutions as part of neighborhood development design effectively manage stormwater while meeting other objectives for urban residents?
• How do differences in development patterns that result from different policies affect the response to storms, the overall water balance of the neighborhood, and the degree to which the pre-development flow regime is altered?
• What is the relative magnitude of impact of LID features (such as bioretention cells, bioswales, green roofs, rain barrels, and pervious pavement) compared to neighborhood designs that incorporate nature-based solutions (riparian buffers, parks, and public open space) for stormwater management?
We used the Stormwater Management Model (SWMM v 5.1) to evaluate the performance of three alternative future scenarios for neighborhood development pattern, with and without additional constructed LID features (Rossman, 2015). SWMM is an open-source model designed to calculate urban storm water runoff in urban catchments. The model has been effective in hydrologic assessment for urban planning (Jang et al., 2007). Studies have used SWMM to apply projected future climate data to assess runoff for future climate scenarios (Moghadas et al., 2018). SWMM has also been used to predict LID performance regarding water quantity and quality to further understand the impacts of land-use and development (Palla and Gnecco, 2015; Kong et al., 2017; Baek et al., 2020; Hamedani et al., 2021). Our objective in this modeling effort was to better understand the relative impacts of both innovative neighborhood design and constructed LID features associated with each design (such as rain barrels, bioretention cells, bioswales, and detention ponds) used to manage stormwater on site.
We compared the performance of the neighborhood designs with and without constructed LID features at two temporal scales. We ran a set of simulations of four different 24-h NRCS Type 1a design storms; the 2-year storm, 25-year storm, and the 25-year design storm with an increase of 20 and 30% in total precipitation and intensity. Recent future climate projections indicate that storm intensity in the Pacific Northwest may increase by 20–30% in the twenty-first century (Trenberth, 1998; Dominguez et al., 2012). These simulations were intended to investigate whether development that meets current construction and design standards might not perform as well in the future if the region experiences storms of greater intensity. We also ran four different 10-year continuous simulations, across a range of historic and future climate inputs, described in more detail below.
Methods
Study Area
The West Sherwood Neighborhood is a neighborhood of about 187 ha in area, located along the Portland, Oregon Metropolitan Urban Growth Boundary (UGB). Land use in the modeled neighborhood for our baseline date of 2010 was primarily rural residential and agricultural. These land use data were available at a 10 m resolution and represent the most accurate LULC coverage available for the Willamette River Basin, and were also used for the larger project at the basin and watershed scale (Santelmann et al., 2019; Wright et al., 2021). Local city planning is expecting further development with the construction of a new school in the northeast section of the neighborhood (Figure 1). The climate of the region is characterized as a Mediterranean climate with cool, wet winters and warm, dry summers. The regional average annual temperature is 11.3°C and annual precipitation ranges from 100 to 130 cm (Hulse et al., 2002).
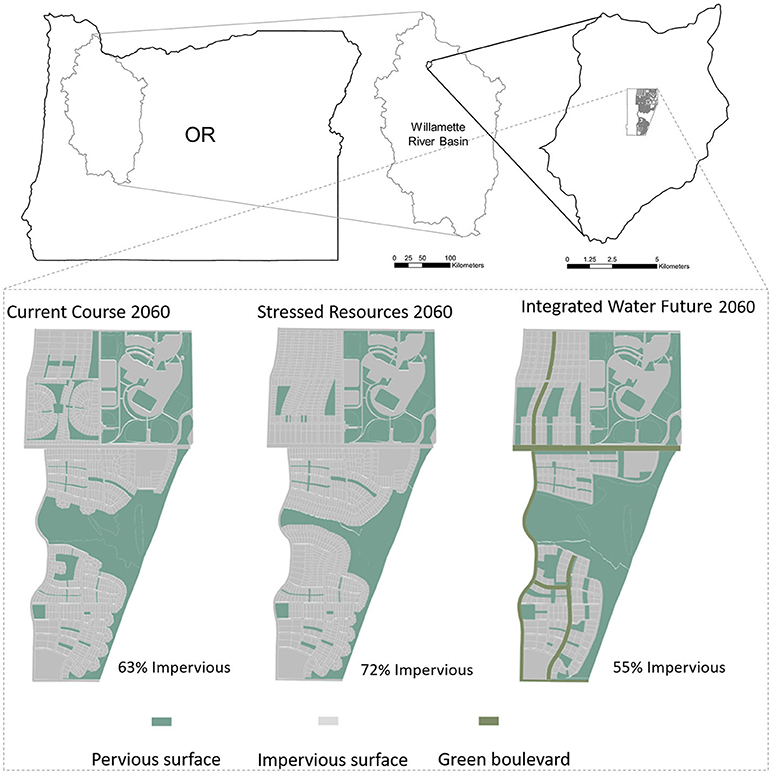
Figure 1. Map showing the location of the West Sherwood neighborhood within the Chicken Creek Watershed, which is located within the Willamette River Basin in the state of Oregon. The three alternative future scenarios are shown for the West Sherwood neighborhood, from left to right: Current Course, Stressed Resources, and Integrated Water future scenarios (Supplementary Figure 1 illustrates the delineation of the sub-catchments used in the SWMM simulations and detailed land use information).
Alternative Future Scenarios
Our research team collaborated with a Stakeholder Advisory Committee (SAC) consisting of local water managers, regional water experts, and agency professionals in the development of three alternative future scenarios that would explore plausible outcomes of different choices for development circa 2060 in the urban reserves surrounding the city of Portland. Stakeholders were interested in having the research team explore the landscapes that would emerge given three different sets of policy priorities. The process of scenario development and neighborhood design is described in detail in Santelmann et al. (2019). We met at 3- to 4-month intervals between 2015 and 2019 to develop three alternative future scenarios that we named the Current Course Future, Stressed Resources Future, and Integrated Water Future. In the Current Course (CC), current trends, policies and regulations remain in place with no anticipation of a changing environment. Development patterns in this scenario reflect the assumption of lower rates of climate change and population growth in the region. The Stressed Resources (SR) alternative future is characterized by higher rates of population growth and changing climate, placing increasing stress on water systems with mitigation actions falling behind a changing environment. This scenario has the greatest proportion of impervious surfaces in the neighborhood design. In the Integrated Water Future (IW), policies of informed and pro-active water management anticipate and adapt rapidly to the same high rates of climate change and population growth as in the SR future. The IW future conserves riparian areas and public green space and has the lowest proportion of impervious surface. The IW future with LID also employs the most extensive use of constructed LID. The three scenarios thus compare development patterns that our SAC envisioned as plausible outcomes by the year 2060, in response to two different rates of climate change and population increase.
Each scenario developed with the SAC was then translated into maps of the watershed-scale land cover at 10 m resolution as well as neighborhood-scale maps for the West Sherwood neighborhood, as an example of how policies in each scenario might be manifested on the same urbanizing area (Figure 1). The sub-catchments in the SWMM input files were hand-delineated using the existing land cover and scenario designs draped over a DEM with a 5 m contour interval as a backdrop. A general assumption was made that lots would be graded so that any building would be located at the highpoint and runoff would then flow from the back of lot to the front of lot and into the public right of way. Storm sewer pipes were assumed to run parallel to the street and it was also assumed that each block would include an inlet that would allow water to enter the separate storm sewer system.
The models were developed using design standards and parameters defined by Clean Water Services (Clean Water Services, 2019). Additionally, as is typical for many urban modeling applications when calibration data are not available, the physical characteristics of each sub-catchment (area divided by the average overland flow length) was used for the initial estimate of width, which is the most sensitive parameter of SWMM applications. When designing the detention ponds, a general assumption was made that the detention ponds were constructed as rectangles with 2:1 length to width ratio. For neighborhood topography, we used Digital Elevation Maps at 5 m contour intervals that restricted height to what was available given existing topography. The detention ponds were then sized to treat the water quality rainfall event (0.76 cm), the 25-year storm (9.9 cm), and the 10-year storm (11.4 cm) according to design criteria. The design of each detention basin was then assessed using region-specific design storms to ensure that the initial input files met construction and design standards for stormwater management (Clean Water Services, 2019) using detention ponds (water storage units which were open to the air) for managing stormwater runoff.
We then generated versions of each neighborhood design with added constructed LID features such as bioswales, infiltration trenches, rain barrels, green roofs, and permeable pavement incorporated into the SWMM input files (Rossman, 2010, 2015). These GI elements are described for each neighborhood design in Table 1. For the scenarios with the more extensive LID features added (CC and IW), the size of detention ponds was reduced by the volume of water that would be removed through infiltration by GI. However, because the design of the SR future included few constructed LID features, the detention ponds in this scenario remained the same size as in the scenario without LID, in order to meet the regional construction and design standards. The resulting sub-catchments as delineated and modeled here are shown for the CC future in Supplementary Figure 1.
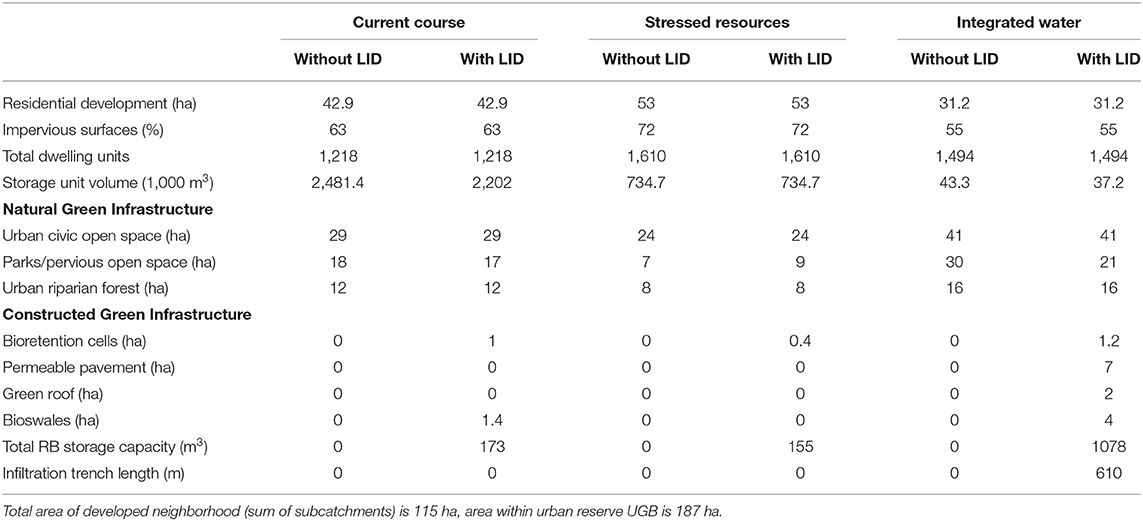
Table 1. Descriptive features of scenarios.
Simulations using SWMM 5.1 for 24-h design storms at a 6-min time step were run to evaluate performance metrics such as storm-based runoff ratios, peak flows, node surcharge and flooding, and deficient links. We used results from the continuous 10-year runs to evaluate how well each alternative scenario performed with respect to maintaining the pre-development hydrologic regime (proportion of annual rainfall lost through runoff, infiltration, and evapotranspiration).
Researchers and the SAC developed neighborhood designs for the IW future to emphasize innovation in street design (green boulevards), lot sizes, and housing patterns. The term green infrastructure is often used to refer to low impact development (LID) features that are both natural and built. Examples of natural LID features include parks, wetlands, urban riparian forest, and unpaved open spaces that are capable of infiltration and retention without being explicitly designed for stormwater management. Here, we consider these natural features as aspects of the neighborhood designs, and use the term constructed LID features to refer to neighborhood features that are explicitly designed and constructed to capture and store stormwater (such as permeable pavement, bioswales, green roofs, infiltration trenches, rain barrels, rain gardens, and bioretention cells).
We ran simulations for each of the three alternative future scenarios both (a) with only detention ponds for stormwater storage (to compare the scenarios based on the impact of neighborhood design only), and (b) with all LID features prescribed for the scenario by the design team (to allow comparison among scenarios of the relative impact of more extensive LID features). Table 1 displays the parameters of GI (natural and constructed) for each scenario within the modeled area. Figure 1 illustrates the different development patterns that characterize each scenario and the proportion of impervious surface in each scenario.
Model Inputs
The EPA Storm Water Management Model (SWMM) is a dynamic rainfall-runoff simulation model designed for use in primarily urban areas. It can be used to model single storm events or for long-term (continuous) simulation of runoff quantity and quality (US EPA, 2017). The runoff component of SWMM operates on a set of subcatchment areas that receive precipitation and generate runoff, with the remainder of the precipitation partitioned into evapotranspiration and infiltration. While SWMM can also model pollutant loads, we did not use this feature, since water quantity rather than water quality was the focus of our study.
The SWMM model uses a routing component that transports runoff through a system of pipes, channels, storage/treatment devices, pumps, and regulators, as defined by the input file used to run the model. Flow routing and infiltration parameters were kept consistent across all design storm and continuous models. Dynamic wave was applied as the routing method and the force main junction was set to the Hazen-Williams equation. To capture heavy rainfall that would exceed the capacity of the designed stormwater drainage system, surface ponding was allowed. Surface ponding allows the ponding volume at the respective junction to become an input parameter that reintroduces the volume back into the system within the time and design constraints of the model.
The output from SWMM reports the quantity of runoff generated within each subcatchment, and the flow rate, flow depth, and quality of water in each pipe and channel during the simulation period. The time steps used to run the model are user-defined. Parameters used in the SWMM simulations are presented in Supplementary Table 1.
Input for Simulations Using Design Storms
For this project, we ran simulations with 24-h NRCS Type 1a design storms for both the 2-year (6.4 cm rainfall) and 25-year (9.9 cm rainfall) storm. In addition, we simulated the 25-year storm with a 20 and 30% increase in precipitation (11.9 and 12.9 cm, respectively) to explore the potential effects of storms of greater intensity projected for the future. Although we ran simulations for the 100-year storm, we do not present those results here since they were nearly identical to the 25-year storm with a 20% increase in intensity of precipitation (the precipitation total for the 100-year storm for the region is 11.4 cm). The Green-Ampt model was used for infiltration calculations for each alternative future scenario where infiltration is calculated from precipitation and ponded water. The Green-Ampt equation is expressed as:
Where I is the infiltration rate expressed as [L/T], Kv is the vertical saturated hydraulic conductivity expressed as [L/T], H is the initial ponding depth from the surface expressed as [L], S is the suction at the wetting front expressed as [L/T] and L is the distance between the surface to wetting front expressed as [L].Evaporation was based on the addition of monthly factor values for the region to the SWMM model. Detention ponds have an open, non-inhibited evaporation factor of 1 so that evaporation can occur easily from any stored volume.
Several gage stations are placed within the West Sherwood model for assessment of hydrologic response to the design storms and 10-year continuous simulations. Each design storm has a 6-min time interval using the Soil Conservation Service (SCS) curve number method using local data from the National Weather Service (NWS).
Design criteria require post-development runoff rates to not exceed pre-development conditions. Pervious area and LID features pre- and post-development are used to calculate infiltration in SWMM and to size the stormwater management features.
For example, for subcatchments which use bioretention cells for stormwater treatment, the size of the bioretention cell is based on the impervious area treated. Bioretention cell size is expressed as:
The placement of LID features derives from attributes of ArcGIS shapefiles developed by our research group and the SAC. Table 1 shows the total area in natural green infrastructure as well as the area devoted to specific LID features in each scenario. Details on the placement of LID features in the scenarios and description of the preparation of the SWMM input files are provided in Supplementary Materials.
Input Specific to 10-Year Continuous Simulations
Both historic and future climate data were used to test the relative performance of the output for each neighborhood designs. One set of runs used daily precipitation inputs for 2060–2069 from downscaled, bias corrected climate projections (MACAv1) from the HadGEM-ES Global Climate Model (GCM) and the RCP 8.5 greenhouse gas concentration pathway (Abatzoglou, 2013). This dataset was selected so that SWMM output for the West Sherwood neighborhood could be compared with a companion study of climate and development effects on the future water balance in the surrounding Chicken Creek Watershed (Wright et al., 2021), and to results from a previous project investigating impacts of climate change and population growth in the Willamette River Basin (Jaeger et al., 2017). Modeling in the companion study generated monthly average evaporation data for the years 2010-2059, and that input was used in the continuous simulations reported here. Under the basin-scale project (Jaeger et al., 2017), the HadGEM-ES RCP 8.5 future climate scenario was selected to represent a “high change” scenario from 41 different GCM climate projections using a sensitivity analysis of the regional hydrologic response to precipitation and temperature changes. The comparison and selection processes for the climate scenarios are presented in Rupp et al. (2013) and Vano et al. (2015).
In addition to the simulation with the HadGEM-ES model, we also ran three sets of simulations with hourly historic precipitation data from the REX 1S OR US (45.3033°N,−122.9133°W; Network ID GHCND:USC00357127) station located near Chehalem, Oregon. We selected three time periods from this dataset for continuous runs, the wettest decade (October 1, 1966—September 30, 1976; average annual precipitation 110 cm), the driest decade (October 1, 1956—September 3, 1966; average annual precipitation 98 cm) and an average decade (October 1, 1975—September 30, 1985; average annual precipitation 104 cm). The finer temporal resolution of the historical data set (hourly) provided a way to compare neighborhood performance under precipitation intensity with greater variability than possible with the future climate data.
Comparison of the annual precipitation for the historic data to the simulated precipitation from the downscaled, bias-corrected HadGEM-ES projection for 2060–2069 showed that the modeled precipitation data for the 2060's lie within the range of the wettest decade in the historic precipitation data (Supplementary Figure 2). The GCM produced annual precipitation ranging from 84 to 134 cm, with an average annual precipitation of 114 cm for 2060–2069. For comparison, annual precipitation ranged from 83 to 134 cm for the 1966–1976 decade, with average annual precipitation of 110 cm.
In summary, three of the 10-year continuous runs use hourly precipitation input from the historic data to explore the performance of each of the neighborhood designs for the wettest, driest, and average decades in the historic past, and the fourth projects performance under the HadGEM-ES future climate scenario for the period 2060–2069.
Comparison of Simulation Results
To evaluate the impacts of different development patterns and LID features in the future scenarios, we compared a number of stormwater performance indicators based on simulation output. For the design storms, we compared the following metrics across scenarios: runoff, infiltration (from pervious surface and LID features), evapotranspiration, number of deficient links, maximum storage unit volume, and peak system runoff. For the continuous simulations, we calculated annual values for the following metrics: surface runoff, total system infiltration volume, evaporation, maximum storage unit volume, and peak system runoff. Because the neighborhoods envisioned in our scenarios do not yet exist, we could not use traditional validation methods comparing simulated and observed results (Rosa David et al., 2015; Wright et al., 2021). We did, however, perform sensitivity analyses of the key parameters used in SWMM to help provide context for the SWMM results. Methods used for sensitivity analyses as well as the results of the sensitivity analyses (Jewell et al., 1978) are further described in Supplementary Materials.
Evaluating Scenario Co-benefits
Two co-benefits of the different alternative futures were evaluated in this study; provision of housing and cost of stormwater management infrastructure per dwelling unit. Although many more co-benefits of the green infrastructure incorporated into the neighborhood designs could be assessed (Entrix, 2010), exhaustive assessment of co-benefits was beyond the scope of this analysis. The number of dwelling units in each scenario provide a direct measure of the ability of the neighborhood to provide housing for urban residents. Estimates of the cost of stormwater management infrastructure were based on data from the City of Portland Bureau of Environmental Services website (City of Portland Bureau of Environmental Services, 2008) as well as data from RS Means Site Work and Landscaping costs (Spencer et al., 2009).
Results
Design Storms
The IW scenario outperformed both the CC and SR scenarios for all design storm performance metrics (Table 2), with the lowest percent runoff, highest rates of infiltration, lowest peak flows, and fewest node flooding events and deficient links. The proportion of rainfall that is removed as runoff is lowest in the IW future with LID, highest in the SR future that relies on detention ponds alone for stormwater management, and intermediate in the CC future (Figure 2, Table 2).
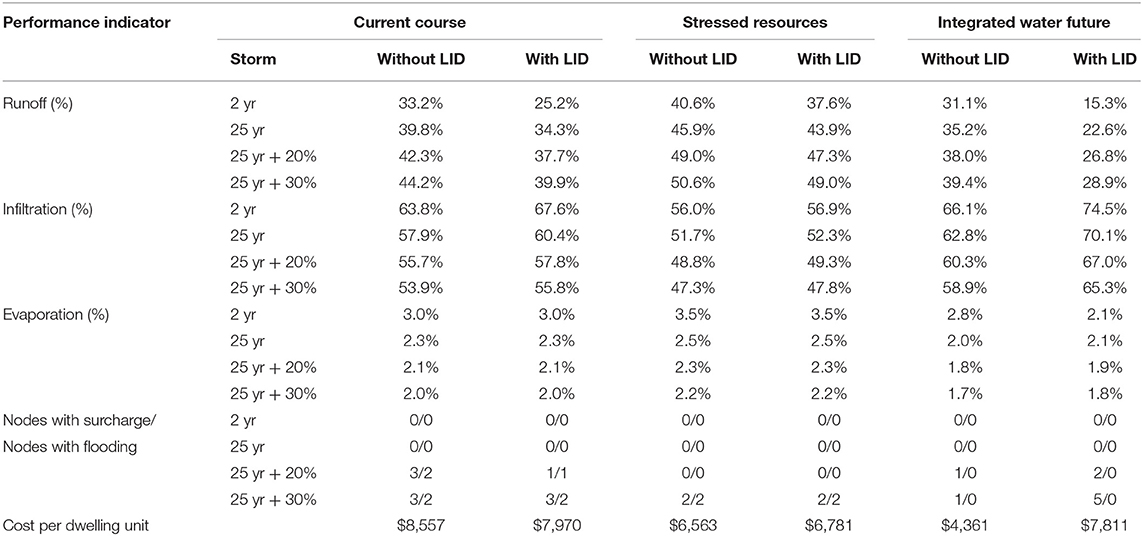
Table 2. Performance indicators for 2 year and all versions of the 25 year design storms for scenarios, both without and with LID.
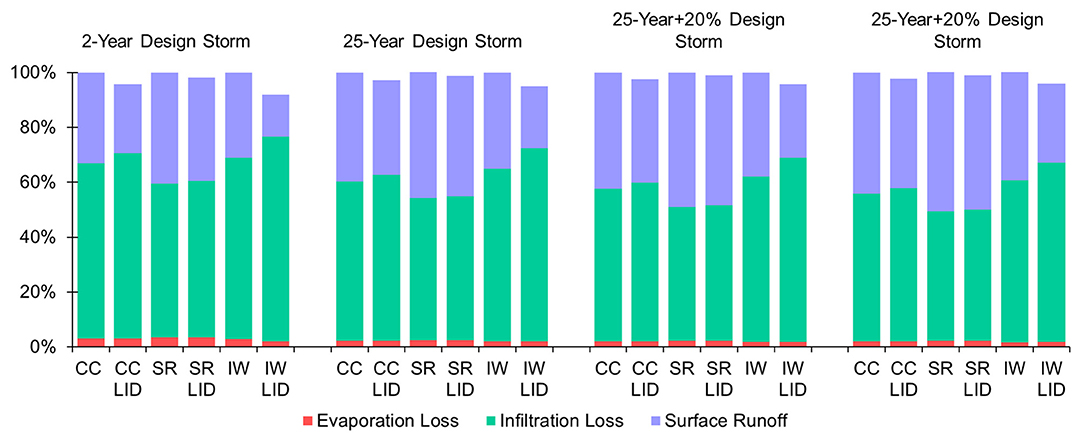
Figure 2. Results of design storm simulations showing the fate of precipitation (infiltration, runoff, and evaporation) for each 24-h design storm; 2-year storm, 25-year storm, 25-yeatr + 20%, and 25-year + 30%.
Results of all design storm simulations show that for all scenarios, development patterns that include LID have less runoff and greater infiltration. Incorporation of LID features also leads to lower peak flows (Figure 3) relative to the same scenario with stormwater managed using detention ponds only.

Figure 3. Rainfall-runoff relationships from the design storms; included here are results from simulations for the 2-year storm (6.4 cm), 25-year storm (9.9 cm), 25-year storm +20% (11.9 cm), and 25-year storm + 30% (12.9 cm). Solid symbols are for the scenarios with LID incorporated, open symbols are for scenarios without LID features. Symbols used are circles for the IW future results, squares for the CC results, and triangles for the SR results. Note that in all cases, the IW future has the lowest proportion of rainfall as runoff, whereas the SR future has the highest runoff ratio. The addition of constructed LID features decreases runoff for the IW and CC futures.
Increasing precipitation inputs by 20% in the 25-year design storm (to mimic potential increases in storm intensity in the future) resulted in an increase in runoff of 2.5, 2.8, and 3.1%, respectively for the CC, IW, and SR future scenarios without LID (scenarios relying on detention ponds only for stormwater management), and by 3.4, 3.4, and 4.2% for the CC, IW, and SR futures that incorporated LID features for stormwater management. Infiltration decrease was inversely proportional to the increased runoff in each scenario. The change in proportion lost by evaporation was negligible (decreased by 0.2% in all scenarios).
Increasing precipitation inputs by 30% in the 6-h storm resulted in an increase in runoff of 4.4, 4.2, and 4.7%, respectively for the CC, IW, and SR future scenarios (i.e., for the versions of the designs with detention ponds only for stormwater management), and by 5.6, 6.2, and 5.1% for the CC, IW, and SR futures that incorporated LID features (bioretention cells, bioswales, rain barrels, infiltration trenches, etc.) for stormwater management. Infiltration decrease was inversely proportional to the increased runoff in each scenario, and changes in evaporation were negligible (decreased by 0.3% in all scenarios).
The peak flows from the 25-year design storm illustrate the differences among scenarios in rates of runoff generation (Figure 3), with peak runoff from the IW+LID reaching only 4.6 cms, whereas in both the SR and CC, peak flows reach ~6.5 cms. In addition, whereas there were no deficient links (pipe segments in which Maximum flow/Full flow > 1.2) in the IW future with or without LID, both the CC and SR futures had deficient links (3 and 5, respectively) under the 25-year storm conditions. In addition, by concentrating development in areas of higher dwelling units within the neighborhood, and retaining more public open space and pervious surface, the IW future has the lowest cost per dwelling unit for stormwater management.
Continuous 10-Year Simulations
In continuous runs, each future scenario demonstrates similar trends across all decades. The IW scenario outperforms the CC and SR future scenarios with higher infiltration loss, higher evaporation loss, and low surface runoff (Table 3, Figure 4). Within both the CC and IW scenarios, addition of LID features increases evaporation and infiltration, and decreases surface runoff. In the SR future, while the addition of LID features in the forms of bioretention cells and rain barrels increases infiltration, the limited amount of LID in this scenario (0.4 ha of bioretention cells and rain barrels with only 155 m3 storage capacity, Table 1) are not sufficient to reduce surface runoff (Figure 5), which reaches highest proportions in the SR future with LID.
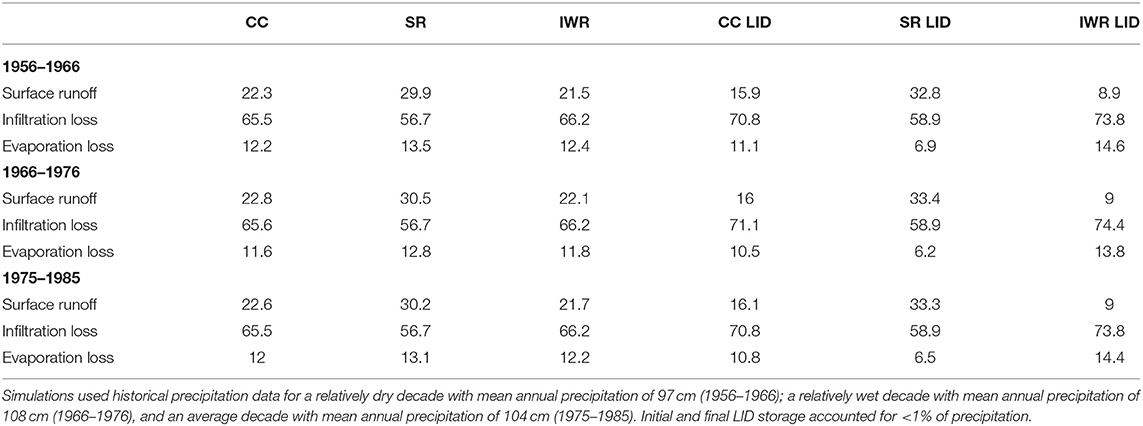
Table 3. Fate of precipitation as a percentage of total precipitation from 10-year continuous simulations for scenarios without LID (first three columns) and with LID (three columns at right).
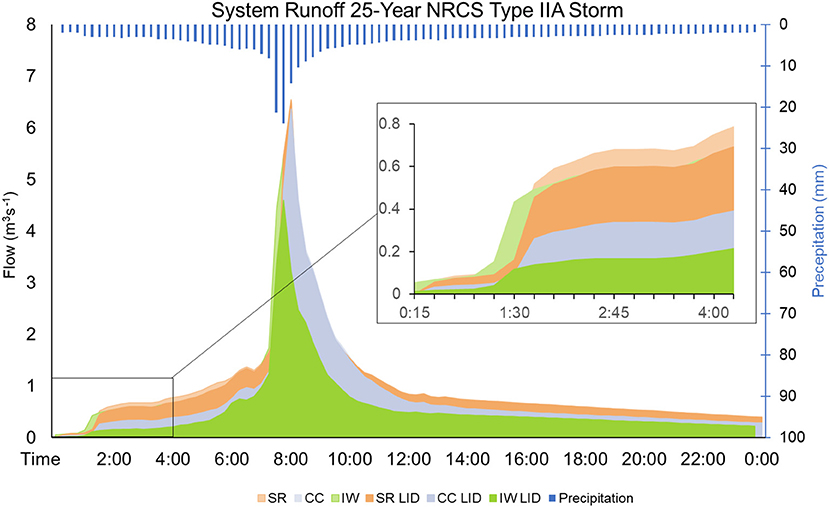
Figure 4. Results of SWMM simulation for the 25-year design storm illustrating the lower peak flows associated with the IW future, and high peak flows in the SR future.
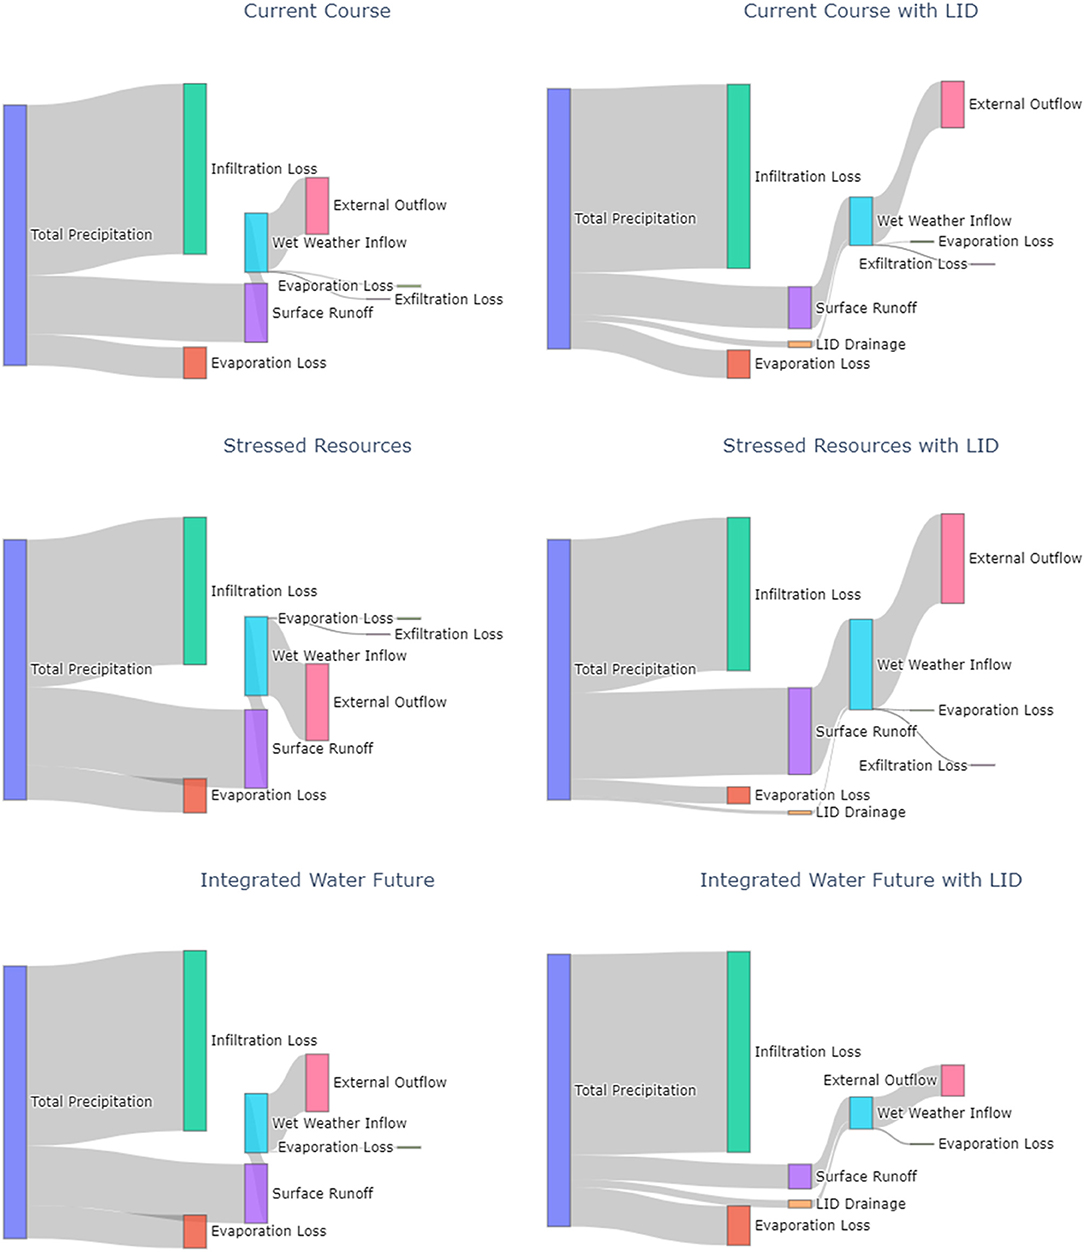
Figure 5. Sankey diagrams for each scenario both without LID (left side) and with LID (right side). These diagrams show the fate of precipitation in the 10-year continuous simulations. The width of each of the bars and arrows is proportional to the volume of precipitation or flow in that portion of the hydrologic cycle.
The CC with LID scenario has low surface runoff, ranging between 15 and 18 cm yr−1. In the CC future scenario, across all decades simulated, surface runoff accounts for 22–23% of precipitation. Runoff decreases to only 16% of precipitation with LID. The SR with LID scenario produces the highest surface runoff across all scenarios, with values ranging between 31 and 37 cm yr−1. In the SR future scenario without LID, surface runoff accounts for 30–31% of precipitation. That proportion increases to 33% for the SR future with LID. Across all scenarios, the IW future scenario with LID has the lowest surface runoff, ranging between 8 and 10 cm yr−1 across all decades. In the IW future scenario, surface runoff accounts for 22% of precipitation; that proportion decreases to 9% of precipitation when the extensive LID features that characterize this future are implemented (Table 3, Figures 6, 7).
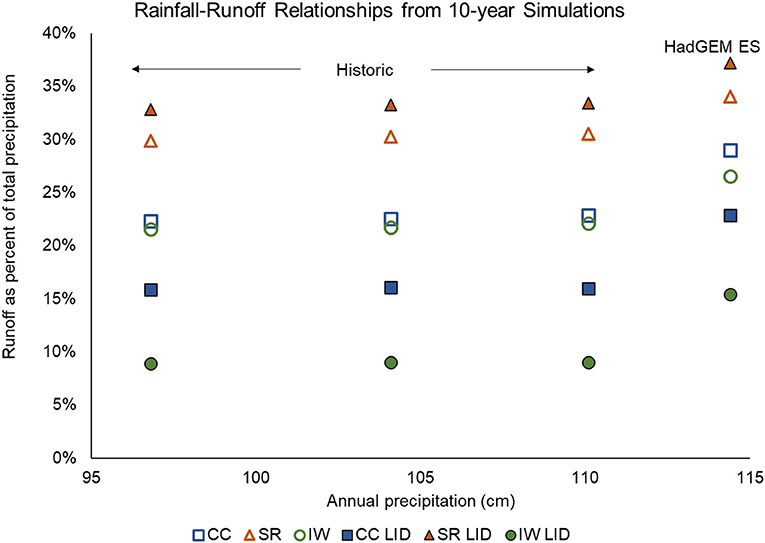
Figure 6. Rainfall-runoff relationships from the 10-year continuous simulations. The values on the X-axis are the average annual precipitation for the decade. Included here are results from simulations of future climate projected by the HadGEM-ES for 2060–2069 (114 cm, at the far right) as well as results from simulations of historic data for 1956–1966 (dry decade with average annual precipitation of 98 cm), 1966–1977 (wet decade, average annual precipitation 110 cm), and 1975–1985 (average decade, average annual precipitation 104 cm). All 10-year periods start on October 1. Solid symbols are for the scenarios with LID incorporated, open symbols are for scenarios without LID features. Symbols used are circles for the IW future results, squares for the CC results, and triangles for the SR results.
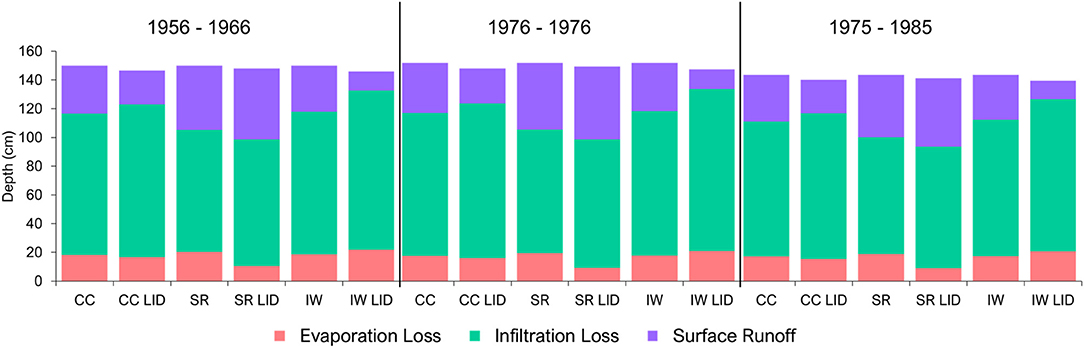
Figure 7. Results of 10-year simulations showing fate of precipitation for each decade modeled. Within all decades, there is an increase in infiltration loss for scenarios with LID features compared to those without LID features (relying on detention ponds only to manage stormwater). In this region, goals for stormwater management include reducing runoff by increasing infiltration and/or increasing evapotranspiration, so scenarios with the lowest runoff represent the desired alternative.
Infiltration tends to be highest in scenarios with less impervious area, and increases when LID features are added to the scenarios in all cases. The CC with LID scenario has high infiltration loss ranging between 68 and 79 cm yr−1. In the CC, infiltration loss makes up 65–66% of precipitation and increases to 71% with LID included. The SR with LID scenario has infiltration loss ranging between 57 and 65 cm yr−1. The SR future scenario has an infiltration loss that makes up 57% of precipitation and increases to 59% of precipitation with LID. The IW with LID scenario has the highest infiltration loss ranging between 71 and 82 cm yr−1. Infiltration loss in the IW future accounts for 66% of precipitation, infiltration increases to 74% of precipitation in with LID included.
In simulations of the CC with LID scenario, evaporation loss ranges between 11.8 and 12.8 cm yr−1. In the CC future scenario, evaporation loss accounts for 12% of precipitation; that proportion decreases to 11% when LID features are included. The SR scenario has relatively low evaporation loss, ranging from ~11.8 cm yr−1 in the future (in which detention ponds alone are used for stormwater management) to 6.7 cm yr−1 in the SR future with LID features added (evaporation can occur from the detention ponds in our simulations). The SR future scenario has an evaporation loss of 13% of the precipitation that decreases to 6–7% of precipitation in the SR future with LID as a higher proportion of precipitation goes to infiltration. The IW scenario with LID has the highest evaporation loss (Figures 4, 6) ranging from ~14 to 15.5 cm yr−1. Evaporation loss for the IW future accounts for 12% of the precipitation; that proportion increases to 15% of precipitation with LID included.
Discussion
The key finding from this research is that neighborhood development design (here manifested in the conservation of open space and riparian forest, and the use of nature-based solutions for stormwater management) can have a greater impact on urban hydrology than the incorporation of built LID features. The neighborhood designs with a higher proportion of impervious surfaces had increased runoff, whereas designs that preserved open space and riparian areas had the lowest runoff. Built green infrastructure increased infiltration in all scenarios, but had less impact than preservation of open space and riparian protection, especially under the more intense precipitation events predicted under climate change.
Can Development Design Help to Effectively Manage Stormwater?
All scenarios between continuous and design storms models have demonstrated similar trends regarding runoff. Scenarios with relatively high impervious surfaces such as SR produce higher surface runoff compared to CC and IW in both models. Our results have also demonstrated that scenarios with more LID and permeable surfaces such as the IW have relatively high evaporation and infiltration rates.
Results from our simulations indicate that neighborhood designs that reduce imperviousness can play a major role in managing stormwater, especially for the more intense rainfall events anticipated under future climate change. For example, the results of the simulations for the design storms demonstrate the potential impact of design alone on runoff (Figure 2) and peak flows (Figure 3). Even for designs without LID features, in which detention ponds are the only means of stormwater management (open symbols in Figures 2, 5), the hydrologic response of the IW future to storm events outperforms the CC and SR futures. Adding LID features enhances this impact for the CC and IW futures, which both incorporate more extensive LID features than the SR scenario. The IW future with LID (Figure 2, solid circles) has the lowest peak flows, lowest runoff, and greatest amount of infiltration, whereas the performance of the CC future with LID (Figure 2, solid squares) is similar to that of the IW future without LID (open circles). The SR future, with and without LID features, has the highest runoff and highest peak flows.
The IW future also performs best under the more intense design storms intended to mimic the storms of the future. While under the most intense design storms (25-year +30%) one node experiences a surcharge for the IW future, there are still no node flooding events, and no deficient links. In contrast, the same storm produced two and three node surcharge events, two node flooding events, as well as 12 and 8 deficient links, for the CC and SR futures, respectively.
The decadal continuous runs demonstrate that the implementation of LID features is effective in managing stormwater by increasing infiltration across all scenarios. The effect of LID features on infiltration loss varies substantially between scenarios, however (Table 3, Figure 6). For example, the IW has four-fold increase in infiltration loss when LID is added relative to the increase in infiltration observed with the addition of LID features in the SR future.
The addition of constructed LID features is also effective in decreasing the surface runoff in CC and IW future scenarios. The extensive implementation of LID in the IW future (Table 1) results in the IW future producing nearly half of the surface runoff compared to the CC future. The increase in surface runoff in SR with LID demonstrates that while LID features can increase infiltration, if the spatial extent of LID is insufficient, these features may be ineffective in reducing runoff, particularly in areas with extensive impervious surfaces.
How Do Differences in Development Patterns Affect Neighborhood Hydrologic Response?
The CC and SR scenarios demonstrate similar patterns in evaporation loss. A difference across scenarios can be seen in the IW future, in which LID has the highest evaporation loss due to the nature of the extensive LID features implemented in the scenario design (e.g., vegetated bioswales, green roofs, permeable pavement) relative to CC and SR future scenarios. Relative magnitude of impact of LID features vs. neighborhood design
Results of the simulations for both the design storms and the 10-year continuous simulations indicate that neighborhood development design can have a substantial impact on the urban water system. Designing developments with lower impervious area can be at least as important as incorporating constructed LID features into developments to manage stormwater. Results from the 25-year design storms for the scenarios without LID (in which all stormwater management is done using detention ponds) show a 10% decrease in runoff between the SR future (with 72% impervious surface) and the IW future (in which impervious surfaces cover only 55% of the neighborhood), whereas runoff from the CC (63% impervious) is 6% less than the SR future.
Incorporation of constructed LID features into a neighborhood design can increase infiltration and further reduce runoff. These impacts increase with more extensive implementation of LID features. For example, the addition of extensive LID features in the IW future (see Table 1) reduces runoff from the 25-year storm from 35.2 to 22.6%, and from 39.8 to 34.3% in the CC future (which incorporates moderate levels of LID features) for the same storm. For the SR future, in which LID features are relatively sparse (0.5 ha of bioretention cells and 155 m3 of storage in rain barrels), the reduction in runoff from the 25-year storm with the addition of LID is only 2%, from 45.9 to 43.9%.
Neighborhood design plays a key role in provision of housing and managing development cost. The scenario designs specified that both the SR and IW futures would need to house more people than the CC future given the expectation that the population in the Willamette River Basin (WRB) would increase to 6.2 million people by 2060 in the SR and IW futures, but only reach 4.5 million in the CC future. As a result, the neighborhood designs included 1610, 1494, and 1218 dwelling units, respectively for the SR, IW and CC futures. Affordable housing is becoming increasingly scarce in the region (Ellis, 2021). The scenarios that assume relatively rapid rates of climate change (IW and SR) also assume that there will be even greater demand for housingin the region in the future. The juxtaposition of public open space with moderate- and high-density housing that characterizes the IW future is a design that could optimize onsite stormwater management while at the same time providing public green space and amenities that make a neighborhood with relatively dense housing more attractive to live in. The IW future design also provides the most riparian habitat for wildlife as well as shade and vegetation to mitigate urban heat (e.g., Ibsen et al., 2021).
Even without adjusting for the number of dwelling units, the lowest overall cost for stormwater management was calculated for the IW future without LID (Table 2). Adding LID features increases the efficacy of the neighborhood design in managing stormwater, but the improvement comes at a cost. However, because the IW future also adds a large number of dwelling units to the neighborhood, the cost per dwelling unit is lowest among all scenarios. The costs presented here represent only construction costs. The authors recognize that a more complete economic analysis should include annualized costs of construction (with contingencies), maintenance, and other costs, ideally representing a life cycle analysis comparing the conventional construction with the constructed LID features. However, an economic analysis at this level of detail was beyond the scope of this paper.
In sum, while both the SR and IW futures house more people, the IW future preserves more open space at a lower cost per dwelling unit. The co-benefits of public open space are well-documented by Zhang et al. (2020).
Comparison of Our Results With Those of Similar Studies
Numerous studies have been conducted using models such as SWMM to investigate the impact of LID features on urban development, summarized in reviews by Jefferson et al. (2017). They found that studies of peak flows and flow volume were relatively common, whereas studies of baseflow, groundwater recharge and evapotranspiration are less well-studied. Lack of treatment of stormwater generated from all impervious surfaces (an attribute of our SR future) was associated with lower success in achieving goals of mitigating impacts of development to restore watershed function to pre-development conditions. For example, simulations of stormwater runoff from a redevelopment project (Pyke et al., 2011) indicated that stormwater runoff was most sensitive to changes in impervious cover, with lesser effects of precipitation volume and event intensity. These findings are consistent with the results of our simulations, particularly the versions of the SR future.
More recently, Bell et al. (2020) conducted a meta-analysis of watershed modeling studies. Based on their review of 52 modeling studies selected as suitable for their meta-analysis, Bell et al. (2020) estimated that for each additional 1% of impervious area in a watershed mitigated by stormwater control measures (what we call constructed LID features in this paper), there is a reduction of 0.43% in runoff and 0.6% reduction in peak flows. They also noted that as mitigated impervious surface decreases (as in our SR future) the probability of reaching reduction targets also decreases. Inadequate treatment of impervious surfaces with LID in a development can result in higher costs without a detectable improvement in overall water system performance.
Our results, including both 10-year simulations and design storms, provide an additional opportunity to observe the effects of neighborhood design and proportion of impervious surface, as well as the impact of LID on a suite of responses, including losses to evaporation and infiltration, processes whose importance to simulation results differs depending on the time scale used.
Modeling of these same future scenarios at the scale of the Chicken Creek watershed containing this neighborhood (Wright et al., 2021) produced similar rankings of the scenarios with respect to their performance in retaining pre-development hydrology (IW> CC > SR). In that study, SWMM was used to model the hydrologic response of the developed portions of the watershed and HBV was used for areas in natural vegetation and agriculture. In addition, a factorial design was used to explore not only different scenarios, but also effects of forest harvest, spatial extent of development, alternative climate scenarios, and addition of LID. Spatial extent of development as well as scenario design were the most important factors influencing hydrologic response at the watershed scale; incorporation of LID had the least impact of the factors varied at the watershed scale. At the watershed scale, evapotranspiration became a much more important part of the hydrologic system. These results, as well as the differences between the 10-year simulations and the design storm simulations, highlight the importance of considering spatial and temporal scale in hydrologic modeling (Baffaut et al., 2015). Processes that are important for large spatial extents over longer time periods (such as evapotranspiration) may not emerge as key processes in modeling much smaller areas over shorter time periods (e.g., modeling the West Sherwood neighborhood using 24-h design storms).
The results of the simulations presented here exemplify the application of SWMM as a tool to inform planning and design of urban developments. Our stakeholders had specific questions that they wanted to have our research team explore through the modeling of the future scenarios, all of them seen as potentially plausible outcomes by 2060. These stakeholders were interested in comparing scenarios with the lowest anticipated rates of climate change and development (such as the Current Course) with those in which rates of climate change and urban development were much higher (e.g., the Stressed Resources and Integrated Water futures). In addition, they wanted us to explore the outcomes of different human responses to the high rates of change; contrasting a scenario (SR) in which more conventional approaches were used in stormwater management and low and moderate density housing were the predominant choices of developers with a scenario (IW) in which planners and developers collaborate to anticipate and adapt to the challenges posed by rapid rates of climate change and concomitant urban development. These are not the only future scenarios possible for the region, but they are the ones our stakeholder group was interested in investigating.
Relatively few studies have used a stakeholder guided approach to design and evaluate urban development at the scale of the study presented here. A search of the Web of Science from 1980 to 2021 using search terms “urban runoff SWMM” produced 453 references, whereas filtering these results by adding the term “scenario” reduced the number of references to 63, most of which used the term scenario in reference to future climate scenarios. When a scenario-based approach is used to contrast future alternatives, scenario development is often done through simulations as well (e.g., Wang et al., 2018; Raei et al., 2019).
The approach used here has benefits in that we were able to investigate the outcomes of future scenarios that are of interest to the SAC. Because regional water providers and other professional stakeholders were involved in the design of these futures, we anticipate that they will be more likely to use our results to inform development and water management decisions. However, there are trade-offs in using designed alternative futures compared to approaches that use simulations to produce multiple scenarios. Studies using designed futures tend to produce fewer scenarios to compare, and more than one attribute of the future changes between the different scenarios. For example, in the scenarios that were the basis for this study, the amount and types of LID features vary among scenarios, making the comparison across futures with and without LID more complicated.
The confounding of multiple dynamic aspects of the scenarios (climate change as well as population growth) as well as the degree to which each neighborhood design conserves public open space and incorporates the use of green infrastructure in the neighborhood design is one of the limitations of designed alternative future scenarios. However, the advantage of the use of designed alternative future scenarios is in their realism and value for communication with stakeholders. The designed futures incorporate knowledge of regional development patterns, local land use regulations and place-based knowledge, making these designs more realistic than those that would be generated by a landscape-change simulation model. We discuss some of the trade-offs from this approach in the article by Santelmann et al. (2019). We explored the issue of multiple factors changing simultaneously in the paper by Wright et al. (2021) using a factorial design to explore watershed scale response to climate change and population growth varying only one factor at a time. In the Wright et al. (2021) paper, development pattern (which dictates the proportion of impervious surface in developing neighborhoods) and the spatial extent of development had by far the greatest impact on the hydrologic response of the watershed.
Simulated future alternatives can be highly useful in exploring a range of choices for development, and in developing systematic approaches to explore specific alternatives in a range of contexts. Our intent with the scenario-based approach employed here was to involve end-users of the information in the co-production of the knowledge that could be used to inform development choices. Involving regional water managers and experts in scenario development is intended to help us engage the professional community in using the results of our modeling efforts to inform planning and communicate with developers in the region.
Conclusion
Simulations using the SWMM model to investigate the influence of neighborhood design across three scenarios, in both design storms and 10-year simulations, demonstrated that reducing impervious surfaces can be highly effective in reducing surface runoff.
Results of our simulations with SWMM using 24-h design storms indicated that for all scenarios, development patterns that include LID have less runoff and greater infiltration. Incorporation of LID features also led to lower peak flows relative to the same scenario with stormwater managed using detention ponds only.
The continuous 10-year simulations produced similar results to the design storms, except that at the longer time periods, evaporation became a more important component of the hydrologic response. The impacts of high levels of imperviousness, coupled with insufficient treatment from impervious surfaces, combine to exacerbate the impacts of urbanization in the SR future. Development patterns with more pervious surfaces (CC and IW futures) and extensive use of LID features to treat stormwater (IW future with LID) can lower runoff and increase infiltration substantially, and may even be more cost-effective in the long run.
Designs such as the IW future scenario with low proportion of impervious cover and extensive implementation of LID features not only perform well in stormwater management, they can also provide desirable co-benefits in the form of affordable housing, preservation of public open space that residents enjoy as an amenity, and lower costs of development per dwelling unit.
Data Availability Statement
The original contributions presented in the study are included in the article/Supplementary Material, further inquiries can be directed to the corresponding author.
Author Contributions
MT-H: co-designed the study, performed the continuous model runs, completed statistical analysis, and wrote the manuscript. MS: co-designed the study, provided guidance for and review of model runs and statistical analysis, and wrote portions of the manuscript. HG: prepared input files for scenarios, performed design storm model runs and sensitivity analyses, and wrote portions of the manuscript and Appendix 1. OS: delineated the sub-catchments and performed calibration of initial SWMM input files and assisted with writing portions of the manuscript. MW: supervised and managed development of the SWMM input files for the scenarios, took the lead in organization and sharing of data, and read and edited manuscript. All authors contributed to the article and approved the submitted version.
Funding
Financial support was provided from the Urban Water Innovation Network (UWIN) National Science Foundation Grant Award #1444758.
Conflict of Interest
OS was employed by company Natural Resources Consulting Engineers, Inc.
The remaining authors declare that the research was conducted in the absence of any commercial or financial relationships that could be construed as a potential conflict of interest.
Publisher's Note
All claims expressed in this article are solely those of the authors and do not necessarily represent those of their affiliated organizations, or those of the publisher, the editors and the reviewers. Any product that may be evaluated in this article, or claim that may be made by its manufacturer, is not guaranteed or endorsed by the publisher.
Acknowledgments
The authors thank our Stakeholder Advisory Committee for their time and for sharing the insights that informed the scenario designs. We are grateful to our colleagues David Hulse, Chris Enright, Allan Branscomb, and Megan Little for the carefully developed neighborhood designs. We thank Tyler Dell for assistance with development of SWMM input files.
Supplementary Material
The Supplementary Material for this article can be found online at: https://www.frontiersin.org/articles/10.3389/frwa.2021.757420/full#supplementary-material
Appendix 1. Methods for incorporating LID features.
Appendix 2. Summary of sensitivity analysis.
Supplementary Figure 1. Sub-catchments as delineated for the West Sherwood Neighborhood representing the Current Course alternative future scenario, with land use as a backdrop.
Supplementary Figure 2. Comparison of historic data from the REX 1 S OR US precipitation gage located near Chehalem, OR for the 1967–1976 water years (based on rank from lowest to highest) to modeled data for this watershed based on HAD-GEM ES climate model. Note that the range of annual precipitation for the historic results and the range of annual precipitation for modeled results are nearly identical, between 83 and 134 cm for modeled results, and between 84 and 134 cm for historic data.
Supplementary Figure 3. Relative sensitivity of continuous simulations. Values for the sensitivity index are <0.8 for all parameters across all scenarios with the exception of the IW scenario with LID, in which has the highest mean relative sensitivity across all parameters (ranging from 0.7 to 1.03).
Supplementary Figure 4. Relative sensitivity of design storm. The parameter of conductivity has the highest relative sensitivity, with the highest impact occurring in the IW future with a 50% decrease in conductivity.
Supplementary Table 1. Initial values of parameters used in SWMM simulations for West Sherwood neighborhood subcatchments with LID.
Supplementary Table 2. Initial values of surface runoff to parameters adjusted ± 50% for decadal continuous simulation.
Supplementary Table 3. Initial values of surface runoff to parameters adjusted ± 50% for 25-year design storm.
Supplementary Table 4. Relative sensitivity of surface runoff to parameters adjusted ± 50% for decadal continuous simulation.
Supplementary Table 5. Relative sensitivity of surface runoff to parameters adjusted ± 50% for 25-year design storm.
References
Abatzoglou, J. T. (2013). Development of gridded surface meteorological data for ecological applications and modeling. Int. J. Climatol. 33, 121–131. doi: 10.1002/joc.3413
Adderley, V., and Mandilag, A. (2002). Portland's CSO program modeling: reflecting the city's priorities for CSO and stormwater pollutants using real time controls. Glob. Solutions Urban Drainage 329, 1–15. doi: 10.1061/40644(2002)329
Andersson, E., Barthel, S., Borgström, S., Colding, J., Elmqvist, T., Folke, C., et al. (2014). Reconnecting cities to the biosphere: stewardship of green infrastructure and urban ecosystem services. Ambio 43, 445–453. doi: 10.1007/s13280-014-0506-y
Baek, S., Ligaray, M., Pyo, J., Park, J.-P., Kang, J.-H., Pachepsky, Y., et al. (2020). A novel water quality module of the SWMM model for assessing low impact development (LID) in urban watersheds. J. Hydrol. 586:124886. doi: 10.1016/j.jhydrol.2020.124886
Baffaut, C., Dabney, S. M., Smolen, M. D., Youssef, M. A., Bonta, J. V., Chu, M. L., et al. (2015). Hydrologic and water quality modeling: spatial and temporal considerations. Trans. ASABE 58, 1661–1680. doi: 10.13031/trans.58.10714
Bell, C. D., Wolfand, J. M., Panos, C. L., Bhaskar, A. S., Gilliom, R. L., Hogue, T. S., et al. (2020). Stormwater control impacts on runoff volume and peak flow: a meta-analysis of watershed modeling studies. Hydrol. Proces. 34, 3134–3152. doi: 10.1002/hyp.13784
Childers, D. L., Cadenasso, M. L., Grove, J. M., Marshall, V., McGrath, B., and Pickett, S. T. (2015). An ecology for cities: a transformational nexus of design and ecology to advance climate change resilience and urban sustainability. Sustainability 7, 3774–3791. doi: 10.3390/su7043774
City of Portland Bureau of Environmental Services (2008). Cost Benefit Evaluation of Ecoroofs. Available online at: https://www.portlandoregon.gov/bes/50818 (accessed July 01, 2019).
City of Portland Bureau of Environmental Services (2021). Stormwater Management Manual 2020. Available online at: https://www.portland.gov/bes/stormwater/swmm (accessed July 11, 2021).
Clean Water Services (2019). Design and Construction Standards, R&O 19–5 as Amended by R&O 19–22. Clean Water Services. Available online at: http://cleanwaterservices.org/permits-development/design-construction-standards/ (accessed July 3, 2021).
Dominguez, F., Rivera, E., Lettenmaier, D. P., and Castro, C. L. (2012). Changes in winter precipitation extremes for the western United States under a warmer climate as simulated by regional climate models. Geophys. Res. Lett. 39:L05803. doi: 10.1029/2011GL050762
Ellis, R. (2021). A Portland Suburb Is Poised to Lose One-Fifth of Its Affordable Housing. Experts Say It's the Tip of the Iceberg. Oregon Public Broadcasting. Available online at: https://www.opb.org/article/2021/06/15/tigard-oregon-poised-to-lose-one-fifth-of-its-affordable-housing/ (accessed August 8, 2021).
Entrix (2010). Portland's Green Infrastructure: Quantifying the Health, Energy, and Community Livability Benefits. Report to City of Portland Bureau of Environmental Services. Portland, OR.
Hamedani, A. S., Soleimanifar, H., Barkley, M., Abounasr, M., do Lago, C., Shipley, H., et al. (2021). “Study the performance of various stormwater control measures in a single full-scale low impact development (LID) testbed under changing environments using SWMM,” in World Environmental and Water Resources Congress 2021, Proceedings, San Antonio, TX. 314–323. doi: 10.1061/9780784483466.030
Hulse, D. W., Gregory, S. V., and Baker, J. P. (2002). Willamette River Basin: Trajectories of Environmental and Ecological Change. Corvallis, OR: Oregon State University Press.
Ibsen, P. C., Borowy, D., Dell, T., Greydanus, H., Gupta, N., Hondula, D. M., et al. (2021). Greater aridity increases the magnitude of urban nighttime vegetation-derived air cooling. Environ. Res. Lett. 16:034011. doi: 10.1088/1748-9326/abdf8a
Jaeger, W. K., Amos, A., Bigelow, D. P., Chang, H., Conklin, D. R., Haggerty, R., et al. (2017). Finding water scarcity amid abundance using human–natural system models. Proc. Natl. Acad. Sci. U. S. A. 114, 11884–11889. doi: 10.1073/pnas.1706847114
Jang, S., Cho, M., Yoon, J., Yoon, Y., Kim, S., Kim, G., et al. (2007). Using SWMM as a tool for hydrologic impact assessment. Desalination 212, 344–356, doi: 10.1016/j.desal.2007.05.005
Jefferson, A. J., Bhaskar, A. S., Hopkins, K. G., Fanelli, R., Avellaneda, P. M., and McMillan, S. K. (2017). Stormwater management network effectiveness and implications for urban watershed function: a critical review. Hydrol. Proces. 31, 4056–4080. doi: 10.1002/hyp.11347
Jewell, T. K., Nunno, T. J., and Adrian, D. D. (1978). Methodology for calibrating stormwater models. J. Environ. Eng. Div. 104, 485–501. doi: 10.1061/JEEGAV.0000772
Jiang, Y., Zevenbergen, C., and Ma, Y. (2018). Urban pluvial flooding and stormwater management: a contemporary review of China's challenges and “sponge cities” strategy. Environ. Sci. Pol. 80, 132–143. doi: 10.1016/j.envsci.2017.11.016
Kong, F., Ban, Y., Yin, H., James, P., and Dronova, I. (2017). Modeling stormwater management at the city district level in response to changes in land use and low impact development. Environ. Mod & Softw. 95, 132–142. doi: 10.1016/j.envsoft.2017.06.021
Liu, J., Hull, V., Godfray, H. C. J., Tilman, D., Gleick, P., Hoff, H., et al. (2018). Nexus approaches to global sustainable development. Nat. Sustainabil. 1, 466–476. doi: 10.1038/s41893-018-0135-8
Meerow, S., and Newell, J. P. (2017). Spatial planning for multifunctional green infrastructure: growing resilience in Detroit. Landscape Urban Plan. 159, 62–75. doi: 10.1016/j.landurbplan.2016.10.005
Moghadas, S., Leonhardt, G., Marsalek, J., and Viklander, M. (2018). Modeling urban runoff from rain-on-snow events with the U.S. EPA SWMM model for current and future climate scenarios. J. Cold Reg. Eng. 32:147. doi: 10.1061/(ASCE)CR.1943-5495.0000147
Palla, A., and Gnecco, I. (2015). Hydrologic modeling of low impact development systems at the urban catchment scale. J. Hydrol. 528, 361–368, doi: 10.1016/j.jhydrol.2015.06.050
Pyke, C., Warren, M., Johnson, T., La, G., Scharfenberg, J., Groth, P., et al. (2011). Assessment of low-impact development for managing storm water with changing precipitation due to climate change. Landscape Urban Plan. 103, 66–173. doi: 10.1016/j.landurbplan.2011.07.006
Raei, E., Alizadeh, M. R., Nikoo, M. R., and Adamowski, J. (2019). Multi-objective decision-making for green infrastructure planning (LID-BMPs) in urban storm water management under uncertainty. J. Hydrol. 579:124091. doi: 10.1016/j.jhydrol.2019.124091
Rosa David, J., Clausen, J. C., and Dietz, M. E. (2015). Calibration and verification of SWMM for low impact development. J. Am. Water Resour. Assoc. 51, 746–757. doi: 10.1111/jawr.12272
Rossman, L. A. (2010). Modeling low impact development alternatives with SWMM. J. Water Manag. Model. R236:11. doi: 10.14796/JWMM.R236-11
Rossman, L. A. (2015). Storm Water Management Model User's Manual Version 5.1 (No. EPA-600/R-14/413b). Washington, DC: U.S. Environmental Protection Agency.
Rupp, D. E., Abatzoglou, J. T., Hegewisch, K. C., and Mote, P. W. (2013). Evaluation of CMIP5 20th century climate simulations for the Pacific Northwest USA. J. Geophys. Res. Atmos. 118, 10884–10906. doi: 10.1002/jgrd.50843
Santelmann, M., Hulse, D., Wright, M., Enright, C., Branscomb, A., Tchintcharauli-Harrison, M., et al. (2019). Designing and modeling innovation across scales for urban water systems. Urban Ecosyst. 22, 1149–1164. doi: 10.1007/s11252-019-00882-6
Spencer, E., Babbitt, C., Baker, T., Balboni, B., and Bastoni, R. A. (2009). RS Means Site Work and Landscaping Cost Data 2009. RS Means Co., 787.
Trenberth, K. E. (1998). Atmospheric moisture residence times and cycling: implications for rainfall rates and climate change. Climat. Change 39, 667–694. doi: 10.1023/A:1005319109110
US EPA (2017). Storm Water Management Model (SWMM) v. 5.1.010. Available online at: https://www.epa.gov/water-research/storm-water-management-model-swmm (accessed August 8, 2021).
Vano, J. A., Kim, J. B., Rupp, D. E., and Mote, P. W. (2015). Selecting climate change scenarios using impact-relevant sensitivities. Geophys. Res. Lett. 42, 5516–5525. doi: 10.1002/2015GL063208
Wang, M. D., Zhang, Q, Su, J., Dong, J. W., and Tan, S. K. (2018). Assessing hydrological effects and performance of low impact development practices based on future scenarios modeling. J. Clean. Prod. 179, 12–23. doi: 10.1016/j.jclepro.2018.01.096
Wright, M. S., Santelmann, M. V., Vaché, K. B., and Hulse, D. W. (2021). Modeling the impact of development policies and climate on suburban watershed hydrology near Portland, Oregon. Landscape Urban Plan. 214:104133. doi: 10.1016/j.landurbplan.2021.104133
Wu, J. (2014). Urban ecology and sustainability: the state-of-the-science and future directions. Landscape Urban Plan. 125, 209–221. doi: 10.1016/j.landurbplan.2014.01.018
Keywords: green infrastructure, stormwater, SWMM, urban development, future scenarios
Citation: Tchintcharauli-Harrison MB, Santelmann MV, Greydanus H, Shehab O and Wright M (2022) Role of Neighborhood Design in Reducing Impacts of Development and Climate Change, West Sherwood, OR. Front. Water 3:757420. doi: 10.3389/frwa.2021.757420
Received: 12 August 2021; Accepted: 07 December 2021;
Published: 07 January 2022.
Edited by:
Sara Hughes, University of Michigan, United StatesReviewed by:
Ankit Agarwal, Indian Institute of Technology Roorkee, IndiaErik Porse, California State University, Sacramento, United States
Copyright © 2022 Tchintcharauli-Harrison, Santelmann, Greydanus, Shehab and Wright. This is an open-access article distributed under the terms of the Creative Commons Attribution License (CC BY). The use, distribution or reproduction in other forums is permitted, provided the original author(s) and the copyright owner(s) are credited and that the original publication in this journal is cited, in accordance with accepted academic practice. No use, distribution or reproduction is permitted which does not comply with these terms.
*Correspondence: Michael B. Tchintcharauli-Harrison, harrimic@oregonstate.edu
†Present address: Hattie Greydanus, Stillwater Sciences, Arcata, CA, United States