 Yaofa Li
 Gianluca Blois
 Farzan Kazemifar
 Razin S. Molla1
 Kenneth T. Christensen
- 1Department of Mechanical & Industrial Engineering, Montana State University, Bozeman, MT, United States
- 2Department of Aerospace and Mechanical Engineering, University of Notre Dame, Notre Dame, IN, United States
- 3Department of Mechanical Engineering, San Jose State University, San Jose, CA, United States
- 4Departments of Mechanical, Materials and Aerospace Engineering, Civil, Architectural and Environmental Engineering, Illinois Institute of Technology, Chicago, IL, United States
Resolving pore-scale transient flow dynamics is crucial to understanding the physics underlying multiphase flow in porous media and informing large-scale predictive models. Surface properties of the porous matrix play an important role in controlling such physics, yet interfacial mechanisms remain poorly understood, in part due to a lack of direct observations. This study reports on an experimental investigation of the pore-scale flow dynamics of liquid CO2 and water in two-dimensional (2D) circular porous micromodels with different surface characteristics employing high-speed microscopic particle image velocimetry (μPIV). The design of the micromodel minimized side boundary effects due to the limited size of the domain. The high-speed μPIV technique resolved the spatial and temporal dynamics of multiphase flow of CO2 and water under reservoir-relevant conditions, for both drainage and imbibition scenarios. When CO2 displaced water in a hydrophilic micromodel (i.e., drainage), unstable capillary fingering occurred and the pore flow was dominated by successive pore-scale burst events (i.e., Haines jumps). When the same experiment was repeated in a nearly neutral wetting micromodel (i.e., weak imbibition), flow instability and fluctuations were virtually eliminated, leading to a more compact displacement pattern. Energy balance analysis indicates that the conversion efficiency between surface energy and external work is less than 30%, and that kinetic energy is a disproportionately smaller contributor to the energy budget. This is true even during a Haines jump event, which induces velocities typically two orders of magnitude higher than the bulk velocity. These novel measurements further enabled direct observations of the meniscus displacement, revealing a significant alteration of the pore filling mechanisms during drainage and imbibition. While the former typically featured burst events, which often occur only at one of the several throats connecting a pore, the latter is typically dominated by a cooperative filling mechanism involving simultaneous invasion of a pore from multiple throats. This cooperative filling mechanism leads to merging of two interfaces and releases surface energy, causing instantaneous high-speed events that are similar, yet fundamentally different from, burst events. Finally, pore-scale velocity fields were statistically analyzed to provide a quantitative measure of the role of capillary effects in these pore flows.
1. Introduction
Multiphase flow in porous media is ubiquitous in natural systems as well as engineering applications, such as enhanced oil recovery (EOR) (Simjoo et al., 2013), ground water remediation (Dawson and Roberts, 1997), water management in fuel cells (Bazylak, 2009) and carbon capture and storage (CCS) (Huppert and Neufeld, 2014). Notably, the sequestration of carbon dioxide (CO2) in deep saline aquifers is considered to be a viable technology to reduce carbon emissions into the atmosphere as a means of mitigating green house effect (Koide et al., 1992; Gunter et al., 1997; Bachu, 2000; Pacala and Socolow, 2004; Huppert and Neufeld, 2014). Under typical reservoir conditions (i.e., 2–28 MPa and 20°C to 100°C Xu et al., 2015), the injection of CO2 into saline aquifers often leads to complex and unstable displacement patterns both during and after injection due to the large density and viscosity contrasts between CO2 and resident brine (Kazemifar and Kyritsis, 2014). These complex processes are crucial to CO2 injection efficiency as well as storage safety and security, which are key aspects of carbon sequestration planning and operation. It is therefore critical to understand the fundamental mechanisms of immiscible multiphase flow interactions of CO2 and water in porous media, specifically under reservoir-relevant conditions.
In practical applications, it is desirable to model and predict multiphase flow and transport at the macro/continuum scale (e.g., field) in order to improve system-level performance. However, macroscopic phenomena are governed collectively by various processes at the pore scale, where fundamental flow and transport take place (Sheng and Thompson, 2013; Moebius and Or, 2014; Mehmani and Balhoff, 2015). For instance, a recent study by Ferrari and Lunati (2014) suggested that local instability-induced oscillations of the menisci between the CO2 and water phases can modify the constitutive relationships adopted in macroscale models, and that pore-scale phenomena should be incorporated in upscaling applications. Therefore, an accurate continuum description of these processes always requires a rigorous understanding of the underlying pore-scale physics (Sheng and Thompson, 2013; Moebius and Or, 2014; Mehmani and Balhoff, 2015).
Over the last few decades, the study of multiphase flow in porous media, specifically at the pore-scale, has received growing attention across the experimental, numerical, and theoretical paradigms. Traditional experimental techniques include the use of x-ray micro-computed tomography (micro-CT) and magnetic resonance imaging (MRI) for visualization of flow patterns in complex 3D geometries (Perrin and Benson, 2010; Song et al., 2013). Direct flow visualization and quantification in specially-designed microfluidic channels incorporating 2D porous structures, hereafter micromodels, have also been accomplished using fluorescent microscopy and microscopic particle-image velocimetry (μPIV) (Lenormand et al., 1988; Zhang et al., 2011a,b; Armstrong and Berg, 2013; Karadimitriou et al., 2014; Blois et al., 2015; Kazemifar et al., 2015, 2016; Roman et al., 2016; Li et al., 2017, 2019). The optical access afforded by micromodels has enabled the application of scientific cameras which overcome the low spatial and temporal resolution limitations typically suffered by the aforementioned 3D approaches. The experimental data generated via micromodel measurements not only allow direct observation of the complex flow dynamics at the pore scale, but also provide a basis to validate numerical and theoretical models with high spatial and temporal resolution. Although extreme care must be taken when extrapolating 2D micromodel results to realistic 3D systems, micromodel experiments have played an important role in visualizing and quantifying pore-scale processes as a means to clarify the underlying flow physics of pore-scale flows in porous media.
Our current understanding of the pore-scale mechanisms of multiphase flow in porous media is based on the notion of two dimensionless numbers: the capillary number, Ca, and the viscosity ratio, M defined as follows Lenormand et al. (1988):
Here, μ is the dynamic viscosity, γ is the interfacial tension between the two fluids, and Ubulk is the bulk velocity, Ubulk = Q/(Aφ), where Q is the volumetric flow rate, A is the cross-sectional area of the porous media, and φ is the porosity of the porous media. Indices 1 and 2 refer to the resident and invading phases, respectively (Kazemifar et al., 2016). The capillary number defines the ratio between viscous and capillary forces whereas the viscosity ratio defines the ratio between the dynamic viscosity of the invading fluid and that of the resident fluid. Depending on the balance of viscous and capillary forces, three distinct flow regimes exist: (i) stable displacement; (ii) viscous fingering; and (iii) capillary fingering. These regimes are associated with complex displacement patterns that depend on pore-scale dynamics. For example, during fingering dominated by capillary forces, the menisci are susceptible to strong instabilities. This behavior can lead to pore-scale burst events, so-called Haines jumps (Haines, 1930), which occur at the time scale of milliseconds and can appreciably affect regions of flow in the domain of up to 30 pore diameters (Armstrong and Berg, 2013; Li et al., 2017). Recent studies have highlighted that these events can greatly accelerate the flow near the fluid–fluid interfaces and render inertial effects as or more important than viscous and capillary ones (Li et al., 2017, 2019). This behavior is quantified by the Reynolds number, Re = ρUD/μ, which represents the ratio of inertial forces to viscous forces (Here, U is a characteristic velocity and D is a characteristic length scale). Dynamic Haines-jump events yield increases in Re by orders of magnitude to , indicating that inertial effects may be significant to CO2 mobility. The intensity and spatiotemporal range of influence of these events illustrate the importance of appropriately defining the elemental volume over which the effects of non-linear (i.e., inertial) mechanisms should be incorporated in subgrid models (Ferrari and Lunati, 2014; Kazemifar et al., 2016).
Despite the progress made by recent work to elucidate the interface dynamics of these flow systems, many fundamental questions remain unanswered. One relevant question concerns the nature of high-speed burst events (hereinafter used interchangeably with the term Haines jumps). The temporal and spatial characteristics of these events have not been experimentally investigated in detail in a quantitative fashion, in part due to their extremely fast dynamics (i.e., a few milliseconds), and in part due to the technical challenges associated with faithfully capturing such events with sufficient temporal and spatial resolution. Armstrong et al. (2014) performed real-time 3D imaging of Haines jumps in a porous medium using a high-speed, synchrotron-based micro-CT with a temporal resolution of 40 ms, which was believed to be sufficient to temporally resolve the burst events. However, this time was much longer than the sub-10 ms time scale suggested by acoustic measurements and optical visualization using a high-speed camera (DiCarlo et al., 2003; Armstrong and Berg, 2013). Moreover, burst events, traditionally referred to as single-pore events (i.e., tens of micrometers in scale), have been recently shown to directly influence much larger regions of the porous media up to a few millimeters (Armstrong and Berg, 2013; Li et al., 2017). These more recent observations highlight the need to revisit the assumptions traditionally made when modeling these highly dynamic systems. Our previous efforts using high-resolution μPIV allowed random capturing of burst events in rectangular micromodels at a single evolutionary stage (Li et al., 2017). However, due to the relatively low imaging rate of the cameras utilized in this past study, it was not possible to record the evolution of these burst events over time which limited our ability to fully elucidate their dynamics.
Another critical parameter in immiscible multiphase flows concerns the surface property of the porous matrix, often defined in terms of wettability. This parameter is extremely difficult to control experimentally and model numerically and poses a further layer of complexity in the study of these dynamic systems (Zhao et al., 2016; Hu et al., 2017). The wettability refers to the “affinity” of a solid surface for one fluid in the presence of one or more other immiscible fluids, and it is often characterized by the contact angle, θ. Fluid–fluid displacement in porous media is classified into drainage and imbibition. Drainage refers to the scenario where the invading fluid is less wetting to the solid surface than the resident fluid (i.e., a non-wetting phase displacing a wetting phase), whereas imbibition refers to the opposite scenario. In practical applications where CO2 is injected into geological reservoirs (e.g., CCS and EOR), a wide range of wettability conditions can be encountered (Chang et al., 2020). For instance, while deep saline aquifers are typically water-wet to CO2 injections, depleted hydrocarbon reservoirs can be intermediate-wet or mixed-wet (Salathiel, 1973; Anderson, 1987). Moreover, these conditions may even change over time due to rock reactions modifying surface properties of the porous matrix (Broseta et al., 2012; Seyyedi et al., 2015; Wang and Tokunaga, 2015). Wettability is important as it is well known to dramatically impact the efficiency of the displacement process (Morrow, 1990; Iglauer et al., 2012) and therefore affect the efficiency of oil recovery in EOR and the CO2 storage capacity in CCS.
From a pore scale perspective, wettability governs the capillary force and directly impacts the interface stability and displacement efficiency (Holtzman and Segre, 2015). A majority of previous studies considering wettability effects on flow behavior in porous media reported that increasing contact angle of the resident wetting phase stabilizes the displacement interface under various flow conditions, leading to more compact displacement patterns and thus increasing the displacement efficiency (Cottin et al., 2011; Holtzman and Segre, 2015; Trojer et al., 2015). Holtzman and Segre (2015) employed a pore-scale model to capture wettability and dynamic effects and showed that increasing the wettability of the invading fluid promotes cooperative pore filling that stabilizes the invasion. Hu et al. (2017) used a high-pressure micromodel-microscopy system to study supercritical CO2 (scCO2) invasion into brine-saturated water-wet and intermediate-wet micromodels, and observed a smaller number of fingers with larger finger width under intermediate-wet conditions. Zhao et al. (2016) performed a more comprehensive investigation of wettability effects by systematically varying the wettability of the porous flow cell over a wide range of contact angles. They found that increasing the solid matrix affinity to the invading fluid results in more efficient displacement of the resident fluid up to a critical wetting transition, beyond which the trend is reversed. This behavior was attributed to two pore-scale mechanisms: cooperative pore filling (increasing displacement efficiency) and corner flow (decreasing displacement efficiency). These studies have greatly advanced our understanding of pore scale mechanisms controlled by wettability. However, to the best of our knowledge, most, if not all, of the experimental work has been restricted to qualitative visualizations of the interface movement, with little to no quantification of the flow distribution and quantitative reconstruction of the interface dynamics. This missing information limits one's ability to further characterize certain important aspects of pore flow and wettability effects. For instance, without detailed fluid velocity information, it is not possible to perform accurate energy balance analysis (i.e., kinetic energy), or to assess the relative importance of various forces in the flow (i.e., viscous vs. capillary vs. inertial forces). In that regard, precise wettability control of the solid matrix provides a great opportunity to control the capillary force. For example, by fine-tuning the solid matrix to be neutrally wetting (i.e., θ ~ 90°) to both fluids, it is possible to eliminate the capillary force, whose effect can then be quantitatively evaluated by performing a simple comparison between a neutrally wetting case and a non-neutrally wetting case under otherwise identical conditions.
Additionally, it has been shown that energy balance analyses are particularly insightful in understanding the parameters affecting flow regimes, capillary filling rules and hysteresis (Liu et al., 2011; Berg et al., 2013; Zacharoudiou et al., 2017; Hu et al., 2018). Energy balance analysis is generally performed by breaking down the different energy contributions at each stage of an evolving phenomenon together with computing the total energy. This allows one to track energy fluxes from one component to the other as well as energy dissipation. In addition, the approach may allow one to identify whether a specific component may be disproportionately contributing to dissipation. An important conclusion made by previous studies is that surface energy and external work can only be partially converted to each other or to kinetic energy, with a majority of the energy being dissipated due to the irreversible and non-equilibrium redistribution of the fluids (Morrow, 1970; Ferrari and Lunati, 2014; Zacharoudiou et al., 2017). For example, Berg et al. (2013) performed an energy analysis based on their 3D micro-CT data, and discovered that Haines jumps, typically cascading through 10–20 geometrically defined pores per event, account for 64% of the energy dissipation. Hu et al. (2018) analyzed various energy contributions and conversions in a multiphase flow within a rough fracture and found a fundamental link between regime transition and energy conversion. In the capillary regime, surface energy is partially transformed into external work and about 51–58% is dissipated via local rapid, irreversible events, whereas in the capillary-viscous regime, surface energy and external work are partially transformed into kinetic energy and partially dissipated. Unfortunately, despite the importance of energy analysis, little has been done to experimentally quantify the contributions of various forms of energy, especially kinetic energy. For instance, in the energy analysis by Hu et al. (2018), an assumption had to be made to neglect kinetic energy changes during a Haines jump for this analysis, whereas in the work by Berg et al. (2013), it is not clear how kinetic energy or energy dissipation was evaluated. While it is possible to estimate surface energy and external work based on flow visualizations and bulk pressure measurements, it is particularly challenging to quantify the kinetic energy contribution, which requires a comprehensive knowledge of the instantaneous fluid velocity fields.
To this end, the dynamic interactions of water and CO2 at the pore scale were captured and quantified using high-speed μPIV in 2D circular micromodels meant to mitigate side-wall effects. Particular effort was placed on mimicking realistic conditions. The high-speed μPIV measurements were achieved with the aid of an epi-fluorescence microscope, a high-speed laser and a high-speed camera, allowing for the acquisition of temporally- and spatially-resolved data, which is indispensable to advance our understanding of the flow dynamics at the pore-scale characterized by highly intermittent behaviors as well as to gain further insight into the effects of wettability. The overarching goals of the study include: investigating the transient behavior of Haines jumps to understand how they control the surrounding flow under strong drainage conditions, and evaluating the effect of wettability and capillarity on the pore-scale flow by comparing the former case with a case featuring nearly neutral wettability.
2. Materials and Methods
This section provides a brief overview of the experimental methodology, schematically illustrated in Figure 1, including the design and fabrication of the micromodels, a description of the high-pressure flow apparatus and an overview of the flow imaging setup and image processing procedures.
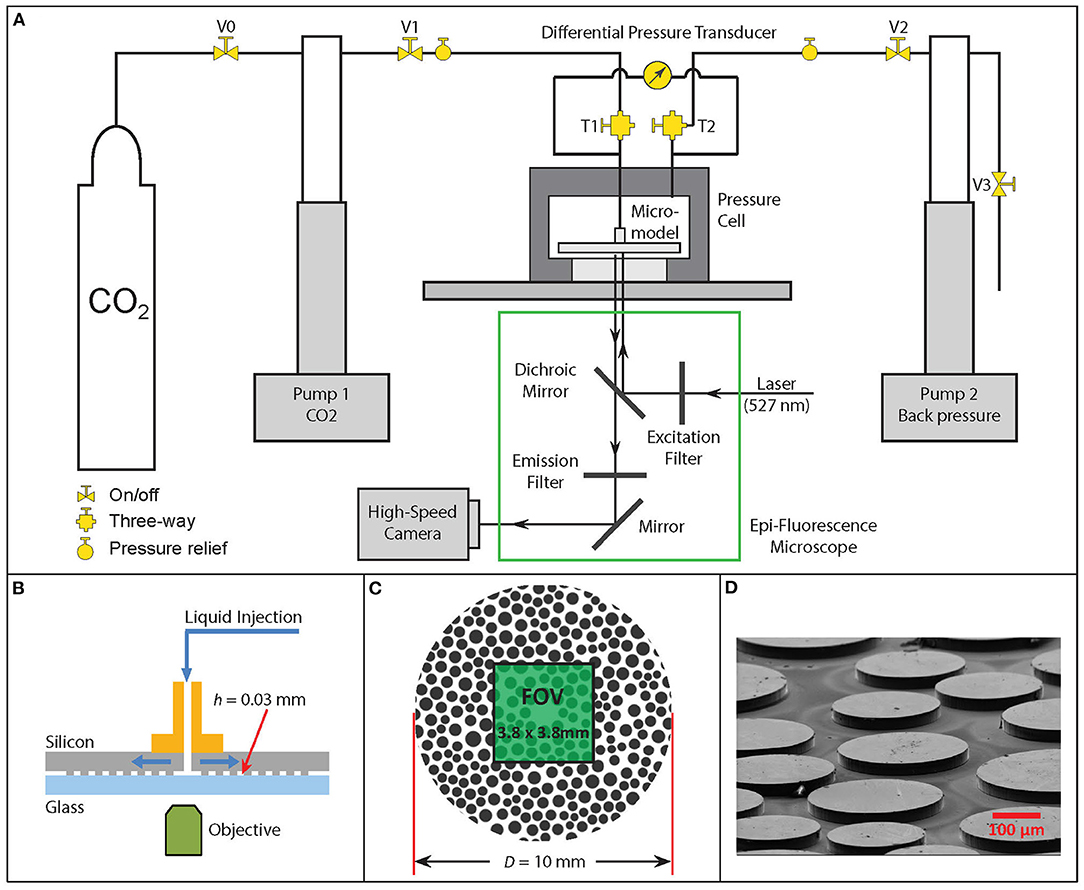
Figure 1. Schematic diagrams depicting (A) the experimental apparatus; (B) the micromodel in side view showing the flow configuration; and (C) the micromodel in top view showing the 2D porous matrix and the imaging field of view (FOV), noted in green; (D) an SEM image of part of the porous section within the micromodel.
2.1. Micromodels
Circular micromodels (see Figure 1C) were used in this study as they significantly mitigate side boundary effects which are inevitably present in rectangular micromodels (Fakhari et al., 2018). Each micromodel consisted of a heterogeneous porous region, an inlet, and an outlet, as shown in Figures 1B,C. The micromodels were fabricated from silicon and glass using microfabrication techniques (Chomsurin and Werth, 2003; Kazemifar et al., 2015; Ilin et al., 2020), with the porous matrix formed with irregularly patterned 2D poly-disperse cylinders mimicking a natural porous medium, inspired by a previous study (Zhao et al., 2016). The porous pattern was based on an irregular mesh created using the pdemesh tool in MATLAB. The entire porous section had dimensions of (D, h) = (10, 0.030) mm and a porosity of φ = 0.44. The average equivalent pore diameter was 102 μm and the minimum throat size was 10 μm, yielding an absolute permeability of 624 md based on single-phase flow measurement and Darcy's law for radial flow. A fabrication protocol involving, in sequence, standard photolithography, inductively coupled plasma-deep reactive ion etching (ICP-DRIE) and Piranah cleaning was used to create the heterogeneous structures in the silicon wafer with a nominal depth of 30 μm. It is worth noting that, unlike glass, silicon is naturally hydrophobic, making the Piranah cleaning a critical step in order to render the silicon surface as hydrophilic as the glass wafer, to which the silicon wafer was bonded to form a closed micromodel. Finally, two nanoports (IDEX Health & Science) were attached to the micromodel for fluid delivery (Kazemifar et al., 2015).
The fabrication protocol described above yielded baseline hydrophilic micromodels for drainage experiments. For these micromodels, the static contact angle of water on both surfaces was measured to be ~ 9 ± 1° using CO2 as the non-wetting phase under actual experimental conditions. Starting from the baseline hydrophilic micromodels, the wettability was modified by the method of silanization (Trojer et al., 2015; Hu et al., 2017). To this end, both silicon and glass wafers were immersed in a saline solution (2% Dichlorodimethylsilane in hexane) for 20 min and baked at 110°C for 10 min prior to adhesive bonding. The static contact angle of water on the modified surfaces was measured to be ~ 120°. It is worth noting that during dynamic flow processes, what is most relevant is the dynamic contact angle (Sedev et al., 1993; Jafari and Jung, 2017). Figure 2 presents in-situ measurements of the contact angles under dynamic flow conditions in a baseline hydrophilic micromodel (Figure 2A), and a modified hydrophobic micromodel (Figure 2B), confirming that the receding contact angles are ~ 9° and ~ 98° for the former and latter cases, respectively. As mentioned before, the second case was deliberately designed to have a contact angle that is as close as possible to ~ 90° (i.e., neutral wetting), in order to minimize capillary forces in the multiphase flow within such a micromodel.
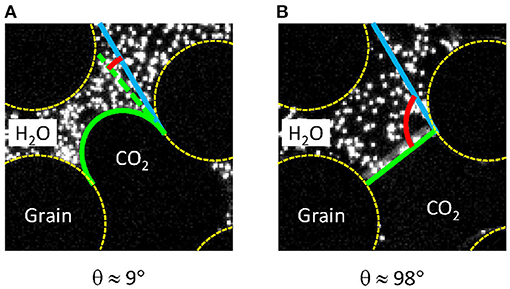
Figure 2. Measurements of receding contact angles of water within a new hydrophilic micromodel (A), and a newly modified micromodel for wettability alteration (B) under dynamic flow conditions at 8 MPa, 21°C. The green and blue lines delineate the fluid–fluid interfaces and the tangent lines of the solid grain, respectively.
2.2. Flow Apparatus and Experimental Procedure
The working fluids used in this study were distilled water and liquid CO2, which was achieved by maintaining flow conditions at 8 MPa, 21°C. The physical properties of the working fluids are reported in Table 1. Note that, while the experimental pressure was above the critical pressure of CO2, the experimental temperature was below its critical temperature. As such, the CO2 phase herein was therefore in a compressed liquid state (Kazemifar and Kyritsis, 2014). To facilitate μPIV measurement in the water phase, the distilled water was seeded with fluorescent polystyrene particles of 1 μm in diameter (Invitrogen F8819), at a nominal volume fraction of 3 × 10⁻⁴. The volume fraction of the solid particles is low so as to not appreciably change the water properties and their density matched that of water so as to behave in a neutrally buoyant manner. It is also worth noting that tracer particles were only seeded in the water phase. Seeding the CO2 phase under these operating conditions is extremely challenging owing to its compressibility which makes it impossible to find tracer particles that would consistently behave in a neutrally buoyant manner throughout an experiment. As such, only the water-phase velocity fields were captured by μPIV.
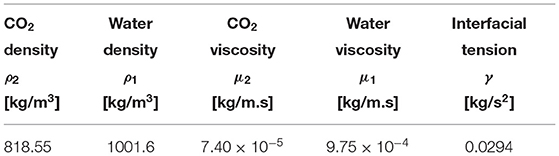
Table 1. Physical properties of CO2 and water at reservoir-relevant conditions (8 MPa and 21°C) (Linstrom and Mallard, 2001).
Due to the relatively high operating pressures, the micromodel was encapsulated within an overburden pressure cell designed to protect the micromodel from over-pressurization while still providing optical access (Kazemifar et al., 2015, 2016). The layout of the high-pressure flow apparatus is shown in Figure 1A. A brief description of this system, which is slightly modified from our previous work (Kazemifar et al., 2015, 2016; Li et al., 2017, 2019, 2021; Chen et al., 2018; Fakhari et al., 2018), is provided here. For additional technical details on each of the components illustrated in Figure 1A the reader is kindly referred to our previous studies (Kazemifar et al., 2015, 2016; Li et al., 2017, 2019, 2021; Chen et al., 2018; Fakhari et al., 2018). As shown schematically in Figure 1A, the coupled flow of water and CO2 through the micromodel was controlled by two high-pressure syringe pumps (Teledyne Isco 100 DM). Pump 1 was used to push the CO2 into the micromodel through the inlet, while pump 2 was used to withdraw the resident water from the outlet as well as to maintain the back pressure. Prior to each experiment, the CO2 in Pump 1 was pressurized to 8 MPa and allowed to equilibrate at room temperature for over 2 h. Meanwhile, the micromodel was mounted in the overburden pressure cell with the micromodel center port connected to the pressure cell center port. The pressure cell was then filled with distilled water under ambient conditions. As the outer edge of the micromodel is open, it was partially pre-saturated with distilled water during the pressure cell filling operation. Additionally, ~ 1 mL distilled water seeded with fluorescent tracer particles was injected into the center port of the pressure cell and temporally stored therein. The center and the side ports of the pressure cell were then connected to Pump 1 and Pump 2, respectively, and pressurized to 8 MPa while valve V1 was kept closed. At this high pressure, all air bubbles that may have been trapped in the porous section initially under ambient pressure quickly shrunk and dissolved into the water phase, leading to an initial condition of liquid water only in the micromodel. After the pressures on the water side and CO2 side both reached equilibrium, valve V1 was opened and the CO2 and water pumps were simultaneously initiated to run at the desired volumetric flow rates, each with an accuracy of 0.3% of the setpoint.
2.3. Image Acquisition and Processing
A high-speed, dual-head, frequency-doubled Nd:YLF laser (Litron LPY300) with a wavelength of 527 nm was used to excite the fluorescent particles in the water phase. The fluorescence emitted from the tracer particles was passed through a λ = 575±13 nm bandpass filter (Semrock BrightLine FF02-575/25-25) and focused by an Olympus IX-73 microscope equipped with an objective lens with 4x magnification and 0.1 numerical aperture (NA), onto the detector of a high-speed scientific CMOS camera (Phantom v641). With this imaging setup, the resultant field of view (FOV) after cropping out the relatively low quality marginal regions was approximately 3.75 × 3.75 mm, located at the center of the porous section, as indicated by the green region in Figure 1B. As the water phase was the only one seeded with tracer particles, this was the only phase in which velocity measurements were conducted.
In order to accurately resolve the instantaneous water velocity fields during a burst, a “frame straddling” scheme was used (Li et al., 2014; Li and Yoda, 2016). In this scheme, the camera recorded pairs of sequential images, frame A and frame B, in each image pair. It is important to note that the images were only exposed during the duration of the laser pulse, which was ~ 10 ns in these experiments. Such a short exposure provides a snapshot of the distributed tracer particles “frozen” at that time instant of each pulse. The caveat is that the two laser pulses can be conveniently timed to illuminate the particles once in frame A and once in frame B. The time interval between the laser pulses within one frame pair, Δt, can be adjusted for each experiment based on the average particle velocity expected and with the goal to optimize the particle displacement within a 1–15 pixel range. In the experiments reported herein, the Δt was set to be 500 μs for the drainage case and 2 ms for the imbibition case. In addition to the ability of performing frame-straddle imaging, the camera allowed time-resolved acquisitions by acquiring frame pairs at 500 Hz. This frame rate provided sufficient temporal resolution to capture the evolution of dynamic pore-scale phenomena.
The multi-phase nature of the flow requires the identification of the fluid–fluid interfaces in the resulting PIV images and the masking out of unseeded regions prior to image interrogation for quantification of the water velocity distribution. In previous studies (Li and Yoda, 2014; Li et al., 2017), this masking was obtained manually since the datasets were limited to a few images. However, the high-speed imaging used herein yielded 3800 PIV image pairs per experimental run for which the interface must be tracked accurately over its evolution, making manual masking impractical. As such, a novel image segmentation and interface detection method was developed and tested on samples of particle images experimentally acquired for the present study (Li et al., 2021). As described in Li et al. (2021), the accuracy of this methodology enabled automatic interface detection and tracking in all of the PIV images acquired herein. In particular, this method provided, for each image pair, a digital mask that excluded the CO2 phase from image interrogation to determine the water velocity field. In this study, for each image pair, a mask based on the segmentation of the first frame was utilized for masking.
For details regarding the image segmentation and image mask creation, the reader is referred to Li et al. (2021). Briefly, for a given image, all tracer particle images seeded in the water phase were detected using a particle tracking algorithm with their coordinates accurately determined, based upon which a triangulation mesh was constructed to link each particle to its nearest neighbors. The regions covered by the mesh were labeled as the water phase, whereas the edges of the mesh were demarcated as interfaces, which were then individually fit to arcs to help clarify interface shapes and locations. This image segmentation process was performed by implementing automatic procedures using an in-house MATLAB code, and the root-mean-square-error (RMSE) of interface detection in experimental images under the current condition was estimated to be ~ 1.5 pixels.
To calculate the water velocity field, both frames in an acquired frame pair were first masked using the mask created in the previous steps and then interrogated in the LaVision DaVis software using a multi-pass, two-frame cross-correlation method (Kazemifar et al., 2015). Unless otherwise stated, the sizes of the initial and final interrogation windows were 1282 and 162 pixels, respectively, both with 50% overlap, which yielded a velocity vector spacing of 20 μm and a spatial resolution of 40 μm. It is worth noting that due to the dynamic nature of these multiphase flows, the fluid–fluid interfaces were continuously deforming and moving throughout an experiment. For instance, during the occurrence of a Haines jump, the meniscus can significantly change in shape and location from the first frame to the second frame of a frame pair. When the tracer particles in the two frame are cross-correlated to compute the velocity vectors, there will be an unavoidable lack of tracer particles in the second frame in the displaced region between the initial and final interfaces, which potentially leads to a loss of velocity vectors in the specific region of the image. And even worse, these lost velocity vectors represent ones of the highest velocities one would expect in the flow. As such, μPIV is likely to underestimate the maximum velocities that exist in the flow, which tend to occur near the displacing menisci. To overcome this challenge and complement our μPIV measurement, we also computed the near meniscus velocities by directly tracking the interface movements during Haines jumps. This approach filled the data gap and produced a more comprehensive set of statistics. This issue will be revisited in § 4.2 in the discussion of flow statistics.
3. Results
The results presented herein consist of sequences of water velocity fields, illustrating some of the dynamic phenomena associated with CO2 infiltration into a water-saturated micromodel under two different wetting conditions. More specifically, we focus on the migration of the CO2 front, the evolution of individual menisci, and the growth of dendritic structures (i.e., the fingers) (Lenormand et al., 1988; Kazemifar et al., 2016; Li et al., 2017, 2019). Two wettability cases were considered herein: a hydrophilic case (strong drainage) and a hydrophobic case (weak imbibition), for which the receding contact angles of the micromodel surface with water were ~ 9° and ~ 98°, respectively. The bulk flow rate for both cases was the same: 5 μl/min. Based on Equation (1) and the bulk velocity corresponding to the midpoint in the radial direction, the prescribed flow rate corresponds to a capillary number of logCa = −5.7. Note that the contact angle θ is not included in the definition of Ca (Equation 1) and the calculation of this capillary number in order to provide a meaningful (Ca > 0) measure for both drainage (hydrophilic) and imbibition (hydrophobic) cases (Trojer et al., 2015; Hu et al., 2017).
3.1. Prefront Single-Phase Flow
Each experiment involved an initial injection stage in which the micromodel was saturated with water and the CO2 was being pushed toward the model but had not yet reached the micromodel entrance. This stage is refereed to as prefront single-phase flow. This simple experiment allowed us to test the system and assess potential sources of measurement error that can be useful in interpreting the subsequent and more complex multiphase flow. Before discussing these results, it is useful to clarify aspects of the flow domain. First, the circular micromodel employed has a constant depth. Unlike the rectangular micromodels used in previous studies (Zhang et al., 2011a,b; Blois et al., 2015; Kazemifar et al., 2016; Roman et al., 2016; Li et al., 2017, 2019), the cross-sectional area was not constant, but instead a function of radial position. As such, for the flow rate to remain constant at each radial distance, the velocity must vary inversely with increasing radius, i.e., higher where cross sectional area is smaller (i.e., near the center). The variation in cross sectional area therefore resulted in a strong radial velocity gradient and the dynamic range of the measurements is expected to reflect this gradient along the radius. Other conditions such us fluctuations in the flow rate and transient phenomena further broadened the dynamic range, so variations in accuracy away from this region were expected. With this in mind, Figure 3a presents the ensemble-averaged velocity field of the single-phase flow of water obtained from 200 PIV realizations (i.e., 0.4 s), prior to the CO2 phase entering the porous micromodel. This result primarily quantifies the radial flow of water, which was injected through the center port. As expected from mass conservation for an incompressible flow, Figure 3a confirms faster flow near the center and a progressive decrease of velocity as water migrates toward the outer edge of the micromodel. The flow accelerates through the pore throats where the grains are closer together and decelerates within pore spaces, where grains are further apart, all expected based on continuity. Interestingly, Figure 3a shows that the water has formed preferential paths of high-momentum that correlate well with the grain distribution.
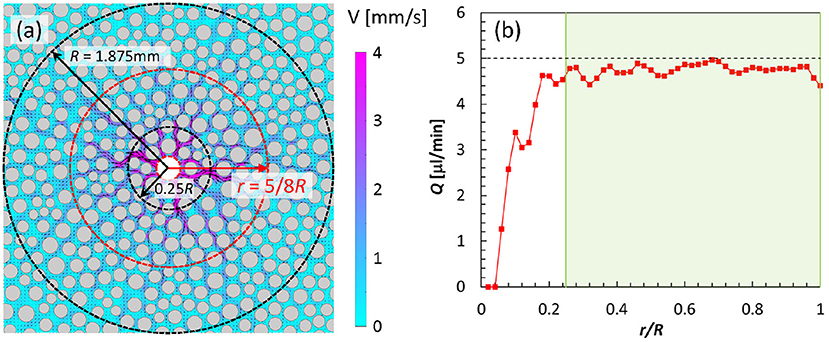
Figure 3. Pre-drainage stage: (a) Ensemble-averaged water velocity field obtained from 200 PIV realizations depicting water flow prior to the entry of CO2; contours reflect velocity magnitude and arrows indicate flow directions; gray regions represent solid grains; unless otherwise stated, only every other vector is shown in both the horizontal and vertical directions for clarity. The black dashed lines define the inner and outer edges of the “annulus,” which is the region considered for bulk flow analysis; The red dashed at r = 5/8R, indicates the location where Ubulk was calculated. (b) Integrated volumetric flow rate as a function of radial location; the green shading demarcates the region where flow rate measurements accurately reflect conservation of mass. Experimental conditions: 0.005 mL/min, 8 MPa, and 21°C.
The accuracy of these single-phase flow of water results can be assessed as a function of radial position. Since water is incompressible, the concept of continuity means that the volumetric flow rate crossing any circle enclosing the center injection port should be constant and equal to the actual injection rate. This observation offers an opportunity to quantify the fidelity of the measurements presented herein. Figure 3b presents volumetric flow rate, obtained by integrating the velocity vectors along a circle of given radius centered at the center of the injection port, as a function of radial location. This result shows that the volumetric flow rate, which is accurately measured for r/R > 0.25 (i.e., 5 μl/min), is largely underestimated near the center of the micromodel, r/R < 0.25. A less severe underestimation seems to persist also for r/R > 0.25, where the measured flow rate oscillates around the value of approximately 4.8 μl/min. This result highlights some of the challenges faced when measuring a flow with a high dynamic range such as that considered herein. The velocity is, in fact, extremely high near the injection port, suggesting that the Δt set for this experiment, which was optimized for the velocities at the middle radius, may have been too long to accurately capture the displacement of the particles near the micromodel entrance. In the region 0.25 < r/R < 1, the measured flow rate agrees with the prescribed value, with a maximum deviation of ~ 8% with the best agreement in the 0.6 < r/R < 0.7 region, confirming the high fidelity of our μPIV measurements in this range. The ~ 8% deviation elsewhere does not, however, suggest a low quality measurement. In particular, these small differences could be associated with the high compressibility of the CO2 that is pushing the water phase through the micromodel. Though the CO2 has yet to enter the micromodel, its properties are extremely sensitive to small changes in temperature and pressure, particularly under the current experimental conditions (Kazemifar and Kyritsis, 2014), and it represents the driving force behind the water displacement. Similar observations have been reported in previous studies (Kazemifar et al., 2016; Li et al., 2017). As the near-entrance μPIV measurements have relatively low fidelity, in the following statistical and energy analyses, only data within the annulus region of 0.25 < r/R < 1 are considered.
3.2. Water Velocity Field Evolution During Drainage
In this section, measurements are presented illustrating CO2 infiltration into the water-saturated micromodel causing dynamic drainage (see Supplementary Movie 1). Figure 4 shows representative snapshots depicting the very first stage of the drainage process featuring resident water being displaced by the arrival of CO2. Here, t = 0 signifies the instant when the CO2 front crosses the line of r/R = 0.25. Results show that at t = 0, the water velocities in the entire field are low, even lower than that in the prefront stage, indicating low flow rate in the water phase. This behavior reflects pinning of the CO2 front at the narrow throats of the porous section where high capillary pressure impedes the flow on both sides of the interface. As the CO2 pump continuously pushes CO2 into the micromodel, the pressure behind the interface (i.e., on the CO2 side) gradually increases to contrast the capillary pressure. Once the capillary pressure is finally exceeded, CO2 suddenly breaks through into the pore space behind the throat in the form of a burst event (Haines, 1930). The external work due to high pressure is partially converted into kinetic energy and causes high-momentum pathways that propagate at high speed for several pores into the water phase. For instance, the burst event occurring at t = 4 ms extends as far as approximately 2 mm away from the pore where it originates, which is ~ 20 times larger than the average pore diameter. Additionally, unlike the single-phase flow whose direction is dictated by the bulk pressure gradient, the local flow produced by a burst does not necessarily follow the radial direction. Instead, it can proceed in any direction, including against the bulk pressure gradient. This observation is in agreement with previous findings on water drainage in a rectangular micromodel (Kazemifar et al., 2016; Roman et al., 2016; Zhao et al., 2016; Li et al., 2017; Chen et al., 2018), and highlights the critical role of the local pressure gradient under the capillary flow regime considered herein. It is also evident that the flow is highly intermittent, meaning that it constantly goes through cycles of deceleration and acceleration associated with compression and expansion of CO2, respectively. As previously observed, these stages correspond to accumulation followed by release of capillary pressure associated with the occurrences of Haines jumps. When a burst event is occurring, the flow is accelerated in the direction of the local pressure gradient produced by the build up of capillary pressure at the meniscus, and after the energy is released the flow is dramatically decelerated. The typical lifetime of a burst is found to be a few milliseconds in the current experiments. As evident at t = 8 ms, the flow quickly subsides following the preceding burst event at t = 4 ms. At t = 16 ms, a new burst event occurs, bringing the flow into a new cycle, similar to the one before.
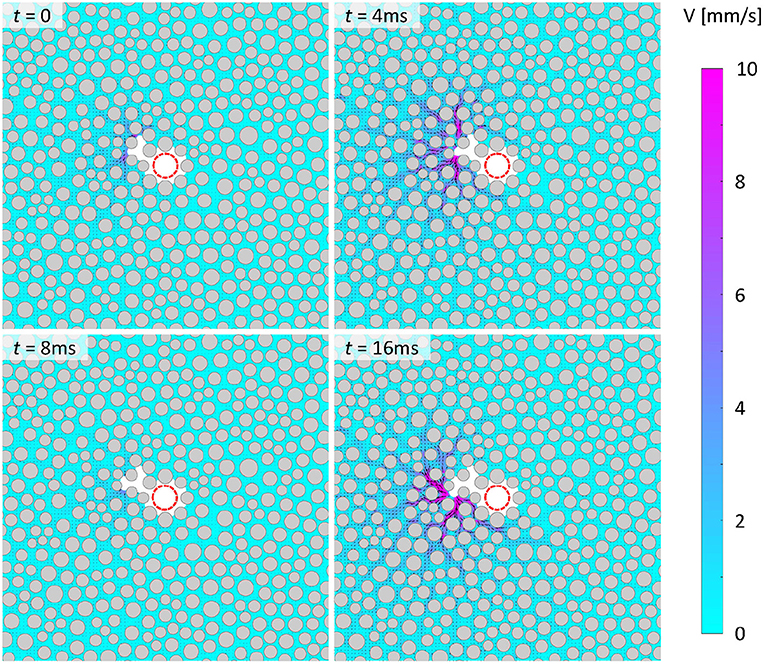
Figure 4. Instantaneous velocity fields depicting water flow owing to displacement by invading CO2 under drainage conditions. Gray and white regions represent solid grains and CO2 phase, respectively; purple and cyan colors denote high and low velocities, respectively; arrows in the water phase denote flow direction. Experimental conditions: logCa = −5.7, 8 MPa, 21°C, and θr ~ 9°. (For interpretation of the references to contour in the text, the reader is referred to the web version of this article).
The entire drainage process of water is essentially dominated by a succession of local bursts events like the one just described. Figure 5 presents the occurrences of additional selected burst events later in the drainage process. These events occur at various locations and along various directions, confirming that water can displace along, normal to and even against the bulk pressure gradient in the radial direction. It is worth noting that these burst events do not necessarily occur one after another, but instead they can occur in a cascading manner, meaning that multiple pores can be invaded at once, and that multiple burst events can occur simultaneously at different locations. This is particularly evident from the velocity field at t = 956 ms in Figure 5. In this particular experiment, this repeated quiescence-burst process continues for over ~ 1 s and can be observed until the CO2 phase completely breaks through the boundaries of the domain imaged. At ~ 1.8 s the bursting process completely subsides, leaving the remaining water quiescent. From this instant, the CO2 continues to flow through the region of displaced water, although its dynamics cannot be directly observed due to lack of tracers in the CO2. These results show that the growth pattern of the CO2 front is quite irregular and asymmetric about the center, which is indicative of capillary fingering, due to which a large portion of water is left trapped in the porous section behind the CO2 front.
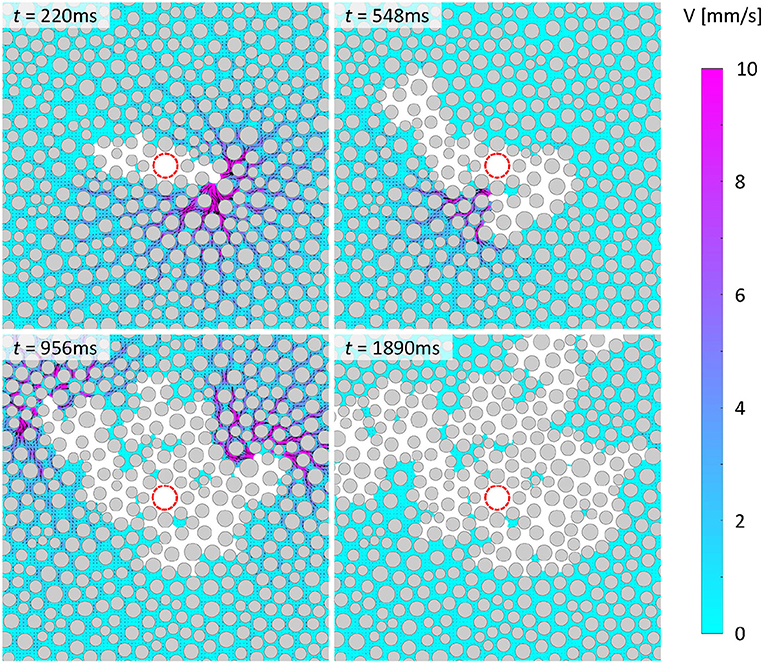
Figure 5. As in Figure 4, but showing burst events occurring at different times as CO2 continuously displaces water under drainage conditions. Experimental conditions: logCa = −5.7, 8 MPa, 21°C, and θr ~ 9°.
3.3. Water Velocity Field Evolution During Imbibition
Figures 6, 7 show similar sequences of representative snapshots illustrating the evolution of water flow responding to a condition of imbibition, herein experimentally induced by modifying the wettability of the micromodel (see Supplementary Movie 2) where the receding contact angle of water, θr, was modified to ~ 98 °. As expected, the behavior of the water displacement process is fundamentally altered. First, the maximum water flow speed in this imbibition case is much lower than in the drainage case (note the different scale bars used in Figure 4 compared to Figure 6), indicating that the flow discharge is more uniformly distributed across the micromodel, resulting in a more axisymmetric distribution that is reminiscent of the prefront single-phase behavior. While flow continues to be concentrated in high-momentum paths, these paths appear more correlated to the geometry of the porous matrix compared to the drainage burst events whose displacement patterns were not restricted to the radial direction. Under imbibition conditions, flow proceeds more smoothly, which reflects a lack of burst events in this flow scenario. As all other experimental conditions were held constant in this imbibition case compared to the drainage case, these drastically different flow dynamics are entirely due to changes in the wettability of the porous matrix for which the capillary forces in the system have been significantly reduced. Essentially, unlike in the previous case, where the capillary pressure exerted at the CO2 interface competed against the bulk driving pressure, leading to flow instabilities, in this case the menisci curvatures are inverted, which means that the capillary pressure works to drive the flow forward, significantly mitigating flow instability and burst events. The CO2 invasion is also much more compact, with very little water phase left behind the radially migrating CO2 front. These results confirm that modifying the wettability of the porous matrix from a strongly hydrophilic state to one of intermediate wetting dramatically mitigates flow instability and enhances displacement efficiency as reported in with previous studies (Cottin et al., 2011; Holtzman and Segre, 2015; Trojer et al., 2015).
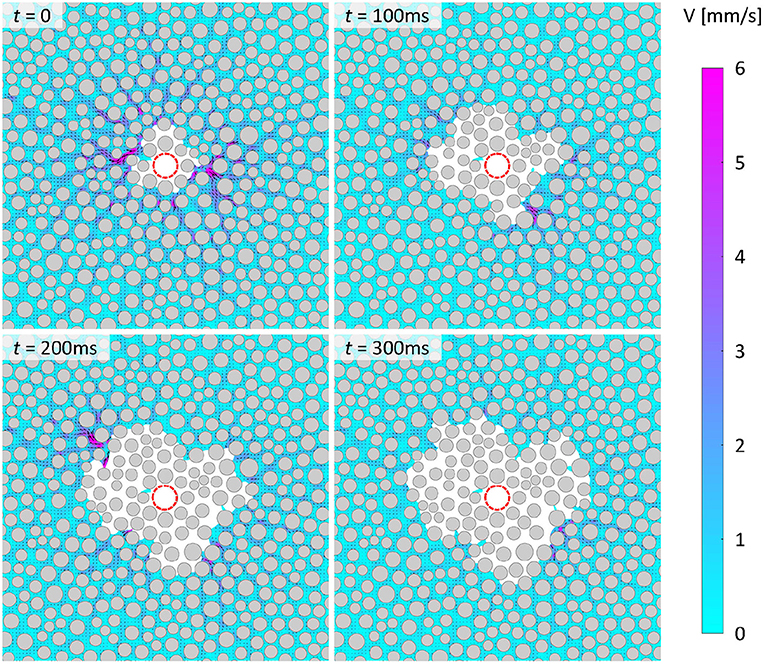
Figure 6. As in Figure 4, but showing instantaneous velocity fields depicting water flow as CO2 continuously displaces water in 2D circular hydrophobic micromodels under imbibition conditions. Experimental conditions: logCa = −5.7, 8 MPa, 21°C, and θr ~ 98°.
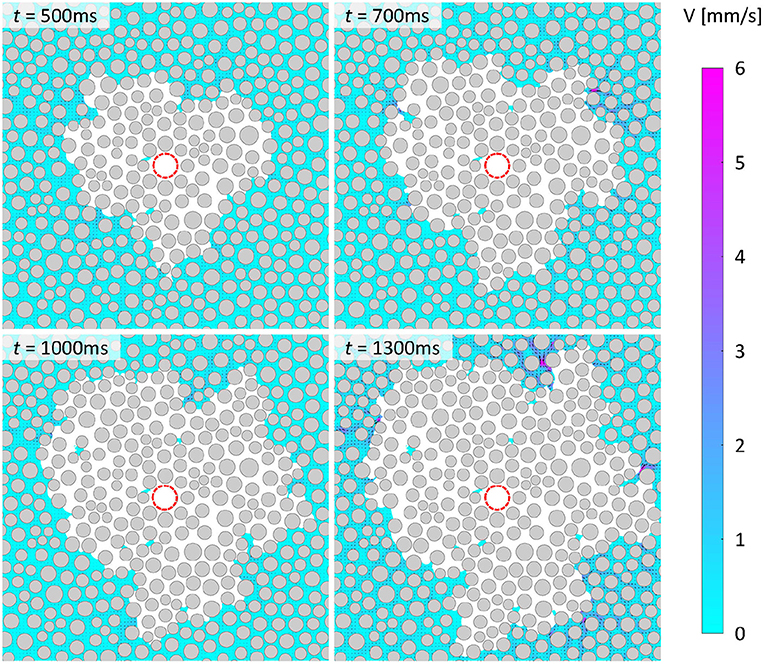
Figure 7. A continuation of Figure 6, showing instantaneous velocity fields depicting water flow as CO2 continuously displaces water in 2D circular hydrophobic micromodels under imbibition conditions. Experimental conditions: logCa = −5.7, 8 MPa, 21°C, and θr ~ 98°.
3.4. Pressure Drop and Saturation Curves
The temporal evolution of the bulk flow properties for both drainage and imbibition cases were investigated by quantifying CO2 saturation from the PIV images and measuring the bulk pressure drop across the micromodel. The CO2 saturation, defined as the ratio between the volume occupied by CO2 and the total pore volume within the measurement domain (taken here as the annulus in the range 0.25 < r/R < 1), was obtained from the segmented particle images. The bulk pressure across the micromodel was measured using a differential pressure transducer (Validyne, P55E-1-N-2-42-S-5-A, 0−140 kPa, 0.1% accuracy) between the inlet and outlet (see Figure 1). To avoid potential cross interference between tracer particles and the pressure measurement, all pressure measurements were performed in separate experiments but under identical conditions as that in the μPIV measurements, using a clean micromodel. Likewise, in the actual μPIV measurements the pressure transducer and the tees (i.e., T1 and T2) were not included. Although the pressure drop was measured separately, based on the repeatability of flow patterns and pressure drops, we believe the pressure drop history is a good representation of the actual pressure evolution during a given μPIV experiment. Measurements are presented herein by plotting pressure drops and CO2 saturation against the number of injected pore volumes, PV. Here, PV is defined as PV = Q*t/Vpore, where Q is the volumetric flow rate, t is time and Vpore is the total volume of the pore space falling within the annulus region (as indicated in Figure 3) and represents a normalized total accumulated volume of CO2 that was injected into the porous section at any moment. Additionally, simple algebraic manipulation yields that PV = t/tc as a normalized time, with tc = φ(r2 − r1)/Ubulk, where r1 and r2 are the radii of the inner and outer edges of the annulus, respectively, and Ubulk is the bulk velocity corresponding to the midpoint of the annulus in the radial direction. As PV is effectively a normalized time, any PV value corresponding to a moment prior to t = 0 (i.e., when the CO2 front crosses the circle of r/R = 0.25) is negative in the reference adopted herein.
Figure 8A presents the variations of the bulk pressure drop as a function of PV for both drainage and imbibition conditions and highlight the distinct behaviors of these two conditions. The initial pressure drop, up to PV ~ −1.5, is almost identical between the two conditions and represents the baseline pressure due to viscous forces and is the sum of the pressure required to push water thorough the micromodel and CO2 through the tubing on its path to the micromodel entrance. The time up to PV ~ −1.5 is the time window corresponding to the steady state single-phase flow stage, which is the same for both cases, indicating that the modification of the micromodel surface does not impact its permeability to water. The pressure drops deviate at PV ~ −1.5, which corresponds to the moment the CO2 phase enters the micromodel. At this moment, the wettability begins to impact flow resistance as the onset of capillary forces modify the force balance. In the drainage case, since the micromodel surface is hydrophilic, the capillary pressure across the interface causes pressure to build up in front of the CO2-water interface, which adds onto the baseline pressure drop, leading to a steep increase in the total pressure drop. As the CO2 front migrates through the porous section, the pressure drop continues to increase linearly, roughly until PV ~ 0, which corresponds to r/R = 0.25. After this point, the rate of increase reduces and the pressure drop reaches a maximum at ΔP = 3 kPa, for PV ~ 1. After this point, the pressure drop decreases with further increase in PV. In contrast to the drainage case, the pressure drop during the imbibition case remains constant up to PV ~ 0. After this point, the bulk pressure drop becomes negative and remains nearly constant at ΔP = −0.2 kPa. This negative value of the pressure drop is expected since in this case the micromodel is hydrophobic, causing an inversion of the interfacial curvature, meaning that the capillary pressure induces a higher pressure on the water side, which is high enough to counterbalance the small viscous pressure drop, leading to an overall negative pressure across the micromodel. This behavior also suggests that the external work done by bulk pressure is negative during imbibition, meaning that the system is doing work to the surroundings (i.e., the pumps in the current experimental arrangement) (Hu et al., 2018).
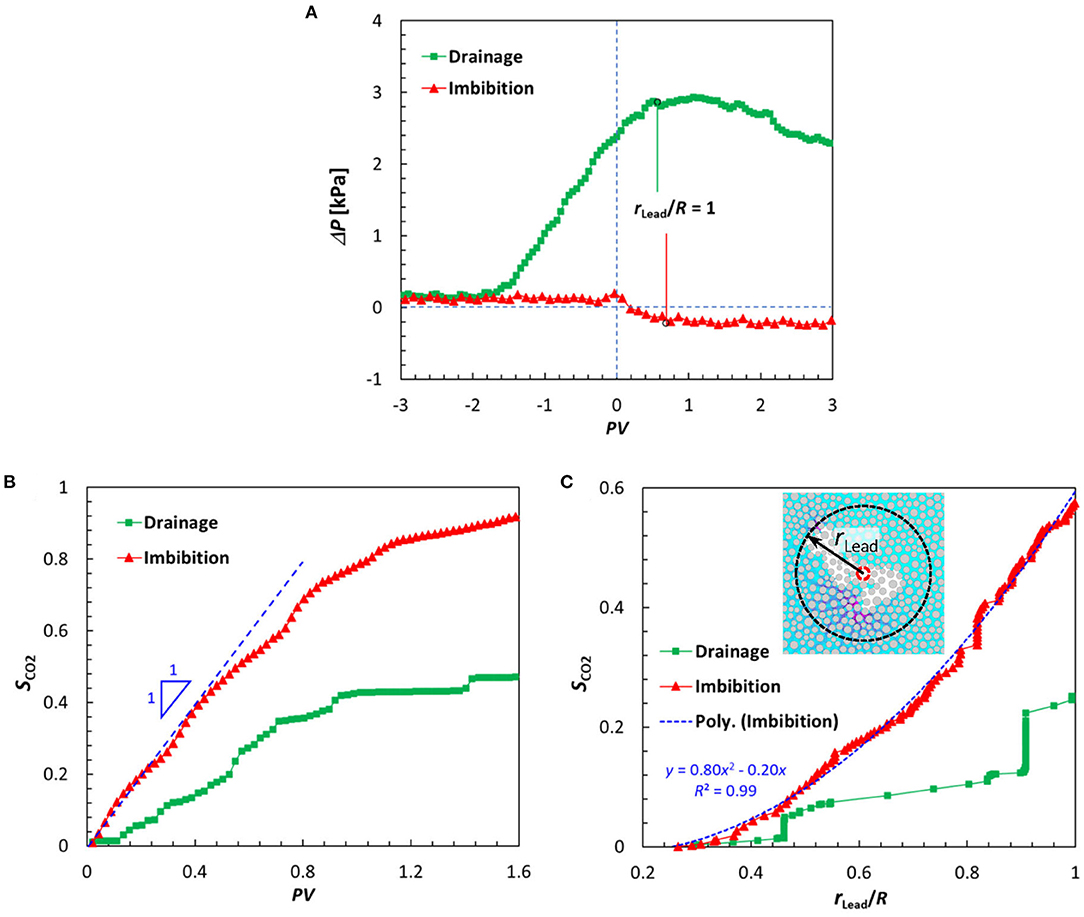
Figure 8. (A) Instantaneous pressure drop across the micromodel measured during drainage and imbibition plotted against the injected pore volume, PV. (B) Variation of CO2 saturation, SCO2, vs. injected pore volume, PV. Profiles are truncated at PV = 1.6 when both cases reach a quasi-steady state. PV = 0 signifies when CO2 first enters the annulus of interest. (C) Variation of CO2 saturation, SCO2, vs. the CO2 leading front position, rLead. Here, the CO2 leading front position is defined as the farthest position of the CO2 phase in the radial direction at any moment, as illustrated in the inset.
Figure 8B presents the variation of CO2 saturation within the measurement domain, SCO2, as a function of PV for both drainage and imbibition cases. Note that PV physically represents the total accumulated volume of CO2 that has been injected into the porous section at any moment, whereas SCO2 represents the total volume of CO2 that is present in the porous section at that moment. As shown in Figure 8B for the imbibition case, the saturation curve begins with an approximately linear increase, with PV growing at the same rate as saturation. This behavior supports PV = SCO2 which is consistent with conservation of mass for incompressible flow. However, when CO2 begins to exit from the outer edge of the annulus region, the relation deviates from a linear one, simply because mass storage (SCO2) now is not equal to mass entering the control domain. This simple yet rigorous mass conservation is not, however, satisfied in the drainage case, even for the initial part of the curve (i.e., before CO2 exits from the outer edge). While the saturation curve initially follows a linear trend, SCO2 (i.e., volume stored) is always lower than PV (i.e., volume injected). This is in fact consistent with the expected compression of CO2 caused by the bulk pressure increase under these conditions. It is important to recall that the CO2 phase under the experimental conditions herein is in near-critical conditions and, as such, is highly compressible (Kazemifar and Kyritsis, 2014). Given the large volume (compared with the pore volume) contained in the upstream plumbing lines, any small change in pressure could potentially result in an appreciable change in the volume of CO2 that is contained in the syringe pump and pluming lines. According to Figure 8A, the pressure on the CO2 does increase by ~ 500 Pa during this process. Based on the compressibility of CO2 (Law and Bachu, 1996) and the cumulative volume of the pluming lines, we estimated that for a pressure change of 500 Pa, a volume change of up to 0.05 μl is possible, which is ~ 30% of the total pore volume. In this regard, conservation of mass cannot translate to conservation of volume within the system.
Figure 8C presents the variation of CO2 saturation with the CO2 leading front position under both drainage and imbibition conditions. Here, the leading front position rLead is defined as the farthest position of the CO2 phase in the radial direction at any moment, as illustrated by the figure inset. This metric has been used in previous studies to reveal key characteristics of drainage for different flow regimes and the effects of wettability on the displacement process (Tsuji et al., 2016; Hu et al., 2017). As illustrated in Figure 8C, in the drainage case, the CO2 saturation varies in a step-wise manner with the leading front position, revealing that CO2 saturation continues to increase even when the leading front is pinned at a fixed location. This behavior can be understood by recognizing that capillary fingers can grow in all directions, not just with the radial bulk pressure gradient. Thus, increased CO2 saturation at constant leading front position is possible due to finger growth in the azimuthal and/or reverse radial directions. Furthermore, this trend implies that the leading edge of the CO2 front advancing further downstream is not necessarily associated with the same finger, but can instead alternate between fingers at different spatial locations. In contrast, this relationship is much smoother in the imbibition case, with very little stepwise behavior. The relationship also displays a parabolic trend, suggesting that the CO2 invasion is marked by very compact and axisymmetric displacement, reflecting the flow patterns shown in Figures 6, 7. These results reveal distinct pore-scale invasion mechanisms for drainage and imbibition that are in agreement with previous experimental studies in rectangular micromodels (Li et al., 2019), rough fractures (Chen et al., 2017; Hu et al., 2017) and simulations in 3-D porous rocks (Yamabe et al., 2014; Tsuji et al., 2016).
4. Discussion
The results presented herein are consistent with current knowledge and existing studies, confirming again the validity of these measurements. To gain further insight into the unrevealed pore-scale dynamics and the effects of wettability on the multiphase flow of CO2 and water in 2D micromodels, the temporal resolution of these measurements is leveraged to investigate unknown aspects of the underlying physics.
4.1. Drainage: Haines Jump
This section focuses on using this data to characterize aspects of the drainage process and the dynamics and nature of Haines jumps. In particular, how large is the region of influence of an individual Haines jump and how long can the perturbation induced by a burst last? As previously mentioned, conflicting results have been reported regarding the temporal and spatial scales of a Haines jump. While acoustic measurements and optical visualizations suggest that Haines jumps occur on a time scale as short as a few milliseconds, and even sub-millisecond (DiCarlo et al., 2003; Armstrong and Berg, 2013), fast micro-CT measurements suggest that the time scale is in the range of 40−200 ms, and the relaxation following a Haines jump can be as long as 2 s (Armstrong et al., 2014). Regarding the spatial size of a Haines jump, at least two different metrics have been proposed. Armstrong et al. (2014) defined the event size as the volume of the wetting phase that is displaced by the non-wetting phase during a certain period of time. They reported that the average volume of the events is approximately two orders of magnitude larger than the average volume of the pores. While this metric properly measures the displacement of the meniscus following a burst, it underestimates its region of influence, which can extend far beyond the new position of the meniscus. On the other hand, Armstrong and Berg (2013) reported that the zone of influence extends at least four pores away from the location where the burst event occurs. Using a similar approach, Li et al. (2017) reported that the zone of influence can extend as far as 30 pore diameters. However, due to the temporally uncorrelated nature of those measurements, it was not possible to determine the temporal duration of these events. Moreover, those observations did not provide conclusive evidence as to the spatial extent of the influence of an individual burst since the possibility of multiple successive jumps acting along the same direction could not be ruled out. Herein, the temporally and spatially resolved water velocity data is leveraged for direct observations of the dynamics of each independent jump along their entire life cycle and to revisit these important questions.
Figure 9 presents selected snapshots illustrating a typical burst event throughout its entire lifetime under drainage conditions. At t = 0 s, the CO2–water interface is pinned at a throat with little flow in the water phase behind the interface. This instant is defined as the temporal origin of the jump for which the meniscus is relatively flat and the water ahead of the meniscus is quiescent. At t = 2 ms, the meniscus increases its curvature, thus indicating a build up of capillary pressure. Simultaneously, the interface advances slightly and manages to pass through the narrowest point of the pore throat. This movement results in a slight increase in water velocity, revealing the onset of high-momentum displacement pathways whereby the meniscus is ready to burst into the open pore space. At t = 4 ms, the jump of the interface begins, as witnessed by the dramatic acceleration in the water phase, with velocities peaking at t = 6 ms. Shortly thereafter, at t = 8 ms, the water flow suddenly decelerates returning to the pre-burst state of quiescent water. In this case, two new interfaces form and pin at the new throats. To the best of our knowledge, these results represent the first complete experimental characterization of a pore-scale burst event, reporting detailed velocity information of the surrounding flow from inception to end. These results suggest that the acceleration and deceleration stages have different duration. As shown in Figure 9, the acceleration (from quiescence to peak water velocity) of the burst event lasted for ~ 6 ms, whereas the relaxation (from peak back to quiescence) period only lasted for ~ 2 ms, due presumably to the combined effects of a high viscous dissipation rate in the water phase and the capillary forces induced by the next set of throats.
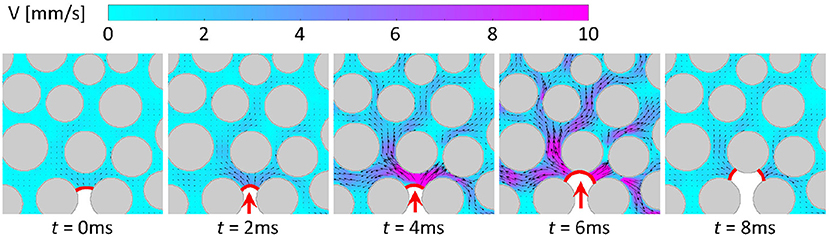
Figure 9. Velocity distribution near a Haines jump revealing the life of an individual burst event. Here, red lines demarcate the interfaces and the red arrows denote the advancing directions of the interfaces.
Figure 9 also reveals the transient behavior of the surrounding water velocity field induced by a burst event with spikes of high momentum flow, followed by quiescent flow, which is consistent with the intermittent behavior noted in Figures 4, 5. This observation enables the identification of Haines jump occurrences in the micromodel based on instantaneous flow rate. Figure 10A presents the instantaneous volumetric flow rate by integrating the flow at the outer edge of the annulus (r/R = 1) from t = 0 to t = 1.6 s. Spikes in flow rate are presumably induced by the occurrences of Haines jumps, while the width of these spikes represent burst durations. The highest instantaneous flow rate noted is 14.7 μL/min, which is three times higher than the prescribed bulk flow rate. Guided by this instantaneous flow rate metric, a total of 51 burst events were visually identified based on the 800 (i.e., 2 ms per field) instantaneous velocity fields during this 1.6 s period. The spatial size and temporal duration of these burst events and their statistical behavior are presented below.
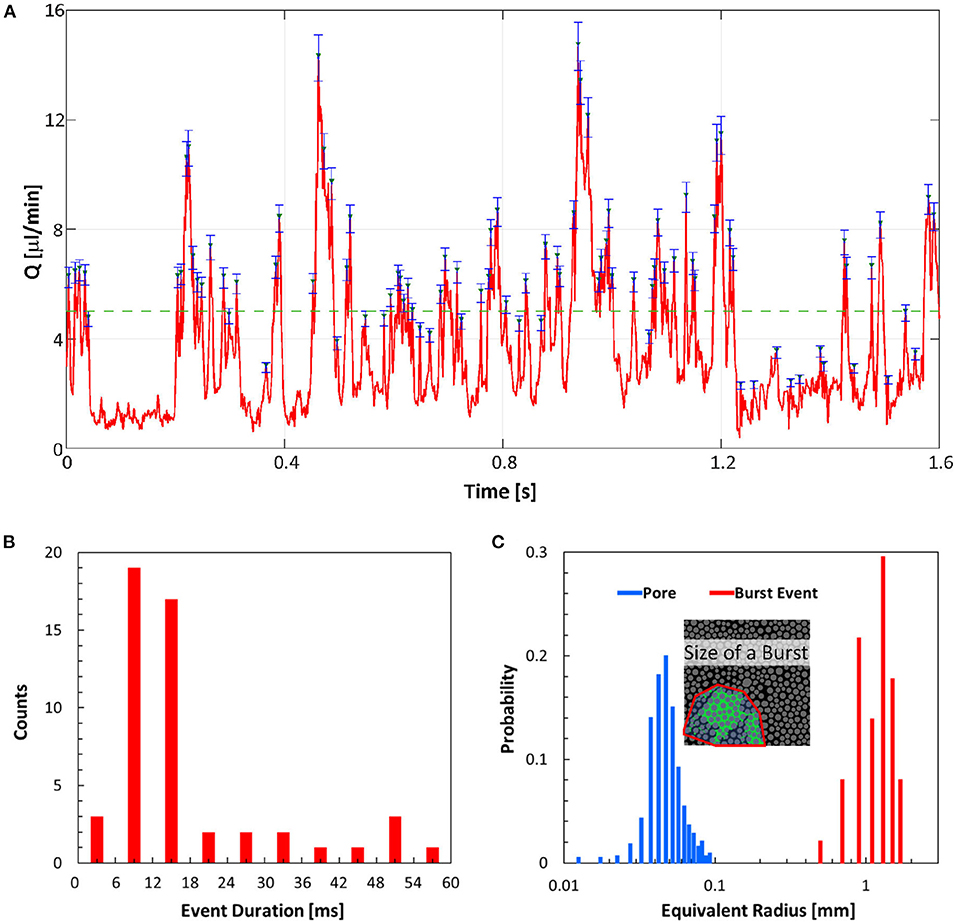
Figure 10. (A) Instantaneous volumetric flow rate exiting the domain of interest. The green triangles denotes the peak locations, indicating the occurrences of Haines jumps, whereas the green dashed line denotes the prescribed flow rate, 5 μl/min. Blue error bars represent 6% of the peak flow rates obtained from the validation experiment. (B) Histogram of burst event duration. (C) Histograms of burst size and pore size. The inset illustrates how the size of a burst event is calculated.
Figure 10B presents a histogram of the event duration, defined as the entire period from quiescence immediately preceding a burst event until a new quiescent state is achieved immediately following the burst event. This metric highlights that burst event duration ranges from 4 ms to approximately 60 ms, with 22 (out of 51) falling within the 0 − 12 ms range and five falling within the 42 − 60 ms range. The shortest duration (i.e., 4 ms) most likely corresponds to the occurrences of individual isolated events, whereas the longer duration events correspond to burst events occurring in a cascading manner over multiple pores and throats. Examination of instantaneous water velocity fields indicate that it is possible for one event to cascade through up to 16 throats. Furthermore, our measurement of burst event duration is in good agreement with previous acoustic measurements and optical visualizations (DiCarlo et al., 2003; Armstrong and Berg, 2013), but is not consistent with the micro-CT measurement in 3D porous media (Armstrong et al., 2014). This discrepancy could be in part due to the distinct nature of 2D and 3D flows, and in part due to the fact that micro-CT cannot sufficiently resolve these highly intermittent events. It is worth noting that the total time of all 51 burst events adds up to 0.83 s (out of 1.6 s), corresponding to approximately half of the total time. However, this half of total time is found to be responsible for more than 75% of the total accumulated volume exiting the outer boundary (i.e., water drainage), suggesting that the drainage process is dominated by successive Haines jumps.
Another key property of the burst events is their spatial footprint. While it was traditionally believed that burst events are local, single-pore processes, more recent studies have called this assumption into question. As mentioned previously, Armstrong et al. (2014) reported a two orders of magnitude difference between the average pore volume and the average burst volume, defined as the volume of the fluid that is displaced during a period of time, whereas Armstrong and Berg (2013) reported that the zone of influence in a 2D porous micromodel is at least four pores from the location where the drainage event occurs. Note that, however, the volume of displaced fluid is not a faithful measure of burst event size, as it depends highly on the chosen time interval and does not include the zone of influence. Li et al. (2017) found that the zone of influence can extend as far as 30 pore diameters, which brings the radius of influence close to the Darcy scale (i.e., a few millimeters). The significant data spread in the literature on this topic shows that the distribution of burst event size remains unclear.
Figure 10C shows a histogram of the burst event size along with a histogram of the pore sizes obtained from our measurements. The burst event size was calculated by comparing the instantaneous water velocity field of the corresponding burst event at its peak with the steady-state water velocity field (i.e., Figure 3A). For each instantaneous velocity field, any region that displayed a higher velocity than the baseline was considered to be influenced by an ongoing burst event. The total area, Aevent, was computed through an integration process, as illustrated in the inset of Figure 10C. The equivalent radius of the event was then calculated as
Similarly, the equivalent pore radius was calculated based on the pore areas, which was in turn determined using the watershed segmentation algorithm (Rabbani et al., 2014). Figure 10C clearly shows a large gap between the pore and burst event radii, with the mean pore radius and mean event radius being 0.051 and 1.21 mm, respectively, a difference of ~ 24 fold. The ratio between these radii would presumably translate into a volume difference of 243 ~ 14, 000 in a 3D flow (Armstrong et al., 2014). This analysis agrees with the previous estimate based on one single burst event by Li et al. (2017), confirming that burst events are nonlocal and that their influence extends well beyond what is typically considered as Darcy scale. Note that despite the relatively large size of the burst events, they may still, to some extent, be underestimated in this work, due to the finite size of the imaging FOV which could cause an event to be partially cropped at its boundaries (cf, inset of Figure 10C).
4.2. Effect of Wettability
The impact of wettability on the aforementioned physics and dynamics is now considered by comparing results obtained in the two micromodels with different surface characteristics. Since the micromodel surfaces in the hydrophobic case were modified to be nearly neutral wetting under a weak imbibition condition, capillary forces in this scenario are expected to be largely absent, as confirmed by the bulk pressure measurements shown in Figure 8A. Therefore, given that the two cases operated under otherwise identical conditions, any changes in the pore processes and flow pattern can be largely attributed to the effect of capillarity.
The characterization of the fluid–fluid interface is the first focus of this analysis. In multi-phase flow in porous media, many heat, momentum, and mass transfer processes, including shear-induced flow, dissolution, exsolution, and subsequent chemical reactions occur at the fluid–fluid interfaces (Zhang et al., 2011b; Zuo et al., 2013; Liu et al., 2015; Kazemifar et al., 2016; Li et al., 2017), which are strongly affected by wettability. Studying the dynamics of fluid–fluid interfaces is critical for understanding long-term CO2 solubility and mineral trapping as well as capillary pressure hysteresis (Gray et al., 2019). It is now well accepted that the total fluid–fluid interfaces are due to two distinct contributions: the capillary-associated interfaces and the film-associated interfaces (Porter et al., 2010; Liu et al., 2015; Li et al., 2019), with the former consisting of all non-wetting interfaces in contact with the bulk, mobile wetting phase and wetting phase pendular rings in pore bodies and throats. The latter consist of non-wetting interfaces in contact with the thin wetting films that adhere to the solid grains of pores occupied by the nonwetting phase. For a solid matrix that is highly hydrophilic (i.e., strong drainage), both types of interfaces exist. However, for a neutrally wetting solid matrix (i.e., weak imbibition), only the capillary-associated interfaces are possible (Porter et al., 2010; Kazemifar et al., 2016; Zhao et al., 2016; Li et al., 2017). Additionally, for flow in the 2D micromodels used herein, interfaces are projected to interfacial lines, and interfacial areas become interfacial lengths (Zhang et al., 2011b; Liu et al., 2015).
Figure 11A presents the variations of capillary-associated specific interfacial length, Anw, with CO2 saturation for both drainage and imbibition. Note that the specific interfacial length, Anw with a unit of mm−1, is simply the interfacial length, anw with a unit of mm, normalized by the total pore area, in order to account for the finite size of the measurement domain. For the drainage case, the capillary-associated specific interfacial length begins by increasing linearly with CO2 saturation, up until approximately SCO2 = 0.25, corresponding to when the CO2 front arrives at the boundary of the measurement domain (i.e., rLead/R = 1). This linear behavior is consistent with previous studies and can be understood by considering the following observations. First, for the porous section under study (and this is presumably true for most other porous patterns too), the number of pores within a given sub-domain statistically scales linearly with the number of throats that are associated with the pores in the same sub-domain. Second, for pore invasion during strong drainage, at any moment the majority of the capillary-associated interfaces sits at the throats (as opposed to in the middle of the pore spaces). Consequently, for each pore invaded, the number of throats gained is statistically a constant, statistically corresponding to a constant gain of the newly-created interfacial length at those throats. This behavior is further reinforced by capillary fingering during the drainage process, ensuring that the newly created interfaces are separated and sustained by the trapped water ganglia. In fact, as the drainage process continues, the trapped water ganglia slowly drain through wetting films and corner flows, causing the increase of Anw to slow down. This behavior causes the interfacial length growth to depart from a linear relationship, as evident in this result for SCO2 > 0.25.
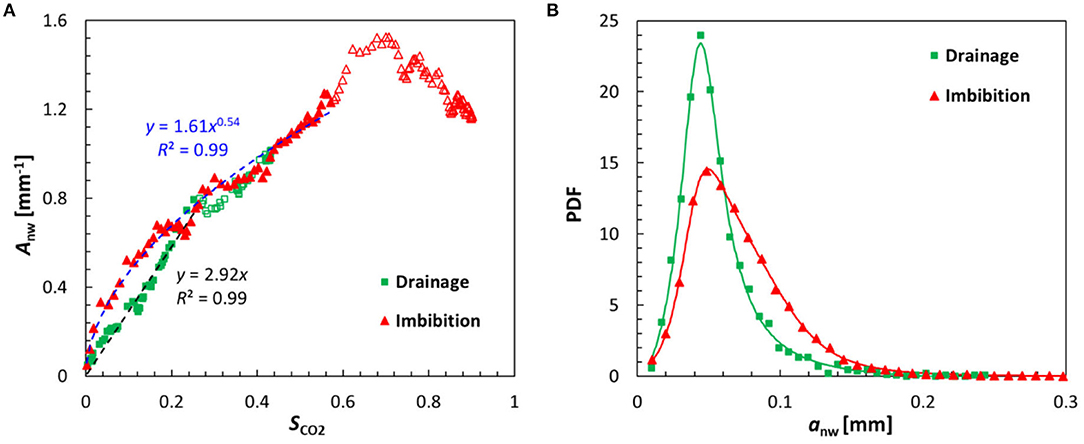
Figure 11. (A) Capillary-associated specific interfacial length functions of CO2 saturation; dashed lines denote a linear fit to the drainage data and power-law fit to the imbibition data. (B) Probability density functions (PDFs) of the individual capillary-associated interfacial lengths under both drainage and imbibition; the symbols represent the original data, whereas the lines are fitted curves using rational polynomial formulas to serve as a visual guide.
This behavior is significantly altered in the weak imbibition case, to yield a relationship , as indicated by the fitted curve. Indeed this nearly 1/2 power law relation is a reflection of the compact displacement pattern during imbibition. The compact and yet relatively axisymmetric pattern caused the fluid–fluid interfaces to form only at the outer rim of the displaced region, with the interior of the region completely occupied by CO2 (i.e., very few water ganglia). To illustrate this behavior, consider an ideal stable displacement in a circular Hele-Shaw cell, with an injection port in the center similar to our current configuration. The interfacial length is simply the perimeter of the displaced circle, which scales linearly with its radius, whereas the saturation is essentially the area of the same circle, which scales with the square of its radius, leading to a 1/2 power law between interfacial length and saturation. Again, the distinct behaviors of the interfacial length are consistent with the displacement patterns, as illustrated in Figures 4–7, and in the imbibition case, is the result of the relative absence of capillarity.
Figure 11B presents the probability density functions (PDFs) of the individual capillary-associated interfacial lengths under both drainage and imbibition conditions. The PDF of the imbibition case is clearly skewed toward larger values compared with the drainage case, indicating that statistically longer interfaces are generated in the former case. As discussed before, fluid interfaces migrated through the porous section via high-speed burst of individual menisci in the drainage case, with a majority of the interfaces remaining static at the throats, which are the narrowest points within the porous section. This leads to a dominance of short interfaces. On the contrary, a majority of interfaces migrated slowly through open pore spaces in the imbibition case, producing long segments of interfaces. Moreover, as shown in Figure 13, in the cooperative pore filling process, interfaces merge into longer ones, contributing to the shift of the PDF to larger values.
Besides interfacial length, the flow dynamics are also significantly impacted by the alteration of wettability. Figures 12A,B present PDFs of velocity magnitude and direction for single-phase flow and multiphase flows under both drainage and imbibition conditions. The single-phase flow data corresponds to the steady-state water flow prior to the arrival of CO2 in the porous section, as shown in Figure 3, and is presented as a baseline for comparison. As the porous matrix is fully saturated with just one fluid (i.e., no presence of fluid–fluid interfaces) in the single-phase flow, it is unaffected by the wetting conditions of the porous matrix. For multiphase flow, the PDF of velocity magnitude in the drainage case displays a large tail of high velocities, induced by pore-scale burst events, as expected. The highest velocity captured by μPIV in this case is about 50 mm/s, which is almost 50 times larger than Ubulk as defined in Figure 3. Additionally, the Reynolds number calculated based on this velocity and the average pore diameter is Rewater ~ 5.2. On the contrary, the PDF of velocity magnitude in the imbibition case resembles the single-phase curve very well, suggesting capillarity and burst events are significantly suppressed, and the statistical behavior of the multiphase flow with little capillarity is quite similar to that of a single-phase flow, as expected. Figure 12B presents the PDFs of velocity vector directions for the single-phase flow, drainage and imbibition cases. Here, Θi is the difference between the polar angle of a velocity vector and the azimuth angle of its corresponding coordinate. As such, if the flow aligns perfectly with the radial direction, Θi = 0. As shown in Figure 12B, Θi spans over a broad range even for the single-phase flow due to the complex geometry of the porous section where pores and throats are oriented in various directions. Compared with the single-phase flow case, the PDF of the imbibition case is slightly broader, due to the cooperative pore-filling process as will be discussed in relation to Figure 13. In cooperative filling, the merging of interfaces induces instantaneous high-speed streams, causing disturbances in the local water flow (note that this is fundamentally different than a burst event during drainage). In fact, this is also the reason why the velocity magnitude PDF of the imbibition case displays a slightly longer tail than the single-phase flow in Figure 12A. On the contrary, the PDF of Θi in the drainage case is much flatter. This is because the burst events, which can occur in any direction, induce strong disturbance to water flow, causing the velocity vector to deviate even more from the radial direction, and statistically leveling the number of velocity vectors in each direction. These PDFs provide further insight into the drainage processes that are not readily obvious by looking at individual water velocity fields. Moreover, in numerical model validation, it is often difficult to do a pore-by-pore comparison due to random errors and perturbations. As such, statistical comparisons serve as a better option for model validation.
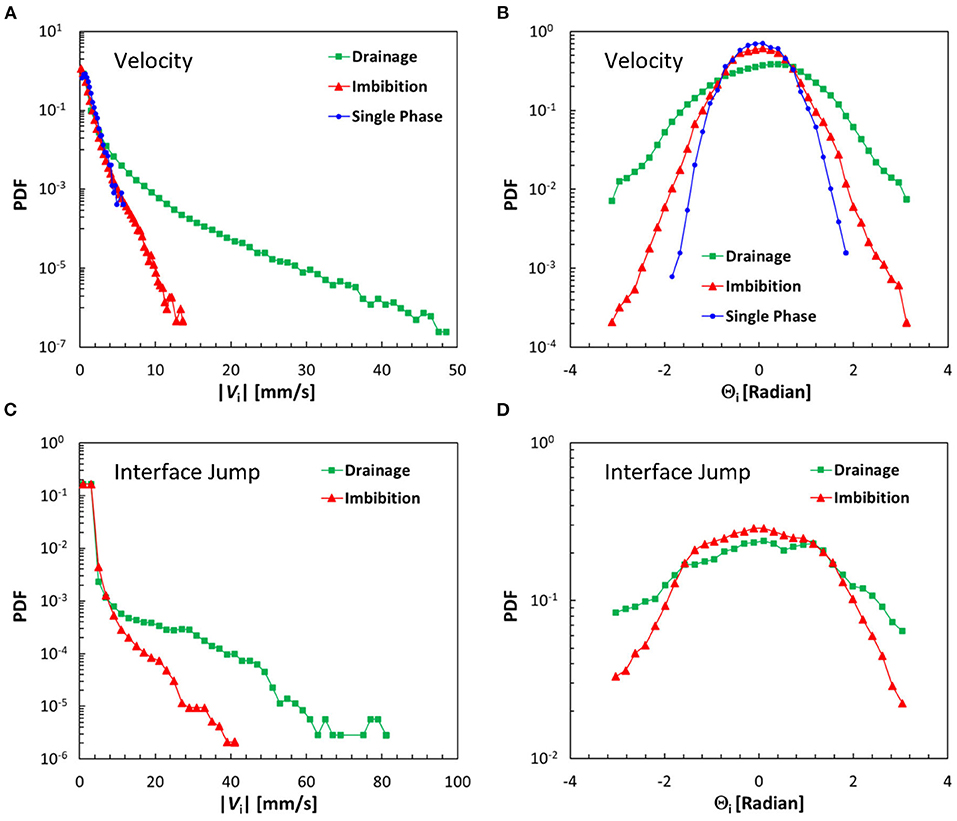
Figure 12. PDFs of velocity (A) magnitude and (B) direction. The single-phase flow result is based on the data as shown in Figure 3, and is presented as a baseline case for comparison purpose. Here, Θi is the difference between the polar angle of a velocity vector and the azimuth angle of its corresponding coordinate. PDFs of interface jumps for their (C) magnitude and (D) direction. Again, Θi is the difference between the polar angle of a jump vector and the azimuth angle of its corresponding coordinate.
As discussed in § 2.3, there is reason to believe that, occasionally, flow velocities measured herein by μPIV may be underestimated during Haines jumps. In PIV, velocity vectors are determined by tracking the motion of groups of tracer particles between two successive image frames contained in interrogation windows. This approach has limitations near boundaries, particularly moving boundaries. As such, PIV typically fails to correctly evaluate the velocity vectors in the vicinity of morphological change (i.e., moving fluid–fluid interfaces). To partially overcome this limitation and complement the μPIV measurements presented herein, interface movements were also evaluated by directly tracking the interface throughout subsequent image frames (Li et al., 2019). Figures 12C,D present PDFs of interface jumps based on their magnitude and jumping direction. Again, Θi represents the difference between the polar angle of a jump vector and the azimuth angle of its corresponding coordinate. While the general behavior of these PDFs is very similar to the previous velocity PDFs, a maximum jumping speed of ~ 80 mm/s is observed based on this analysis approach (vs. 50 mm/s based on the μPIV velocity measurements). This new value enables a more accurate estimate of the maximum Reynolds number achieved in these experiments, which is on the CO2 side of the interface and corresponds to ReCO2 ~ 89, suggesting the importance of inertial effects during Haines jumps.
As bulk properties and statistical behaviors are rooted in pore-scale processes, the effects of wettability on the pore filling process are assessed, which provides further explanation on why and how bulk flow properties are altered. Figure 13 presents the invasion of a fixed pore space during imbibition. Unlike what is shown in Figure 9 under drainage conditions, where pore invasion occurs through one throat at the time, pore invasion under imbibition can simultaneously occur through multiple throats, and is therefore referred to as cooperative filling. At t = 0 ms, the two menisci identified migrate from the two sides of a grain and toward the same pore. At t = 2 ms, the two menisci begin to touch each other and are ready to merge. At t = 4 ms, the two menisci merge into one and cause a release of surface energy, which is partially converted into kinetic energy and significantly accelerates the water behind the newly formed fluid–fluid interface, leading to high-speed water displacement. Note that unlike the drainage case, where the burst of the meniscus is driven by high capillary pressure, here the formation of a new meniscus directly energizes the flow. Once the surface energy release is complete, the water flow quickly diminishes due to high viscous dissipation rate, similar to that in Figure 9. This new pore filling mechanism identified herein is caused by the merging of two interfaces. The release of surface energy causes instantaneous high-speed events, that are similar to, yet due to fundamentally different mechanisms, than burst events under drainage conditions. This simple but important mechanism can now be used to explain the observations made in relation to Figures 11, 12. In particular, the interface merging at t = 4 ms, is responsible for the PDF shift in Figure 11, and the water flow acceleration due to surface energy release at t = 4 ms is responsible for the long tail in the PDF of the velocity magnitude during imbibition, compared to the baseline single-phase case, as shown in Figure 12A.
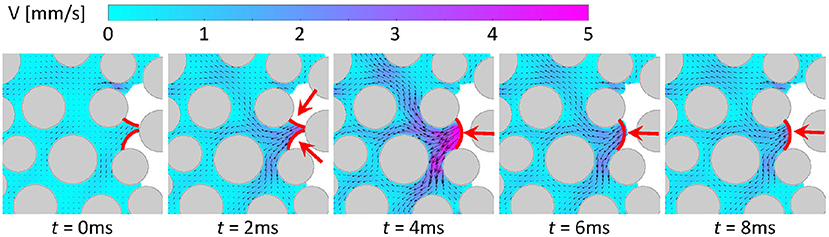
Figure 13. Cooperative filling of a pore during imbibition, with red lines demarcating the interfaces and red arrows denoting the advancing directions of the interfaces.
4.3. Energy Analysis
As mentioned previously, energy balance analysis can aid the development of predictive models and is particularly insightful for understanding the phenomena impacting capillary filling rules and hysteresis in multiphase flow in porous media. However, kinetic energy is a crucial component of energy balance analysis but has heretofore not been properly evaluated experimentally due to a lack of suitable measurements. Enabled by the spatially and temporally resolved velocity measurements presented herein, a breakdown of the energy budget is presented in order to achieve a better understanding of the importance of each energy contribution and the conversion between them during Haines jumps under drainage conditions as well as interface merging under imbibition conditions.
Following the derivations by Ferrari and Lunati (2014), energy balance in a multiphase flow system in porous media can be described as
where is the surface free energy with ψ being the free-energy density, is the total kinetic energy, P = ΔpQ is the work per unit time (i.e., power) done by external forces and Φ is the energy dissipation rate. Herein, Ek can be evaluated based on the instantaneous water velocity field, and dF can then be calculated according to
where Anw and Ans are the fluid–fluid interfacial area and non-wetting-fluid-solid interfacial area, respectively. The power exerted by external forces can be estimated as
As shown in Figure 8A, Δp is positive during drainage but negative during imbibition, meaning that the external work is positive and negative for drainage and imbibition, respectively. According to Equation (5), in the case of drainage, external work is partially converted to kinetic energy and surface energy, with the remainder dissipated by viscosity. On the contrary, in the imbibition case, energy is released from surface energy, which is in turn partially converted to kinetic energy and external work, with the rest dissipated away (Hu et al., 2018). It is worth noting that due to the practical difficulty in measuring pressure in the vicinity of the fluid–fluid interface, Δp here is approximated by the pressure transducer measurements between the inlet and outlet of the micromodel. Because of the small viscous pressure drop in the plumbing lines at such a low flow rate, the pressure transducer offers a good estimate of the actual pressure acting on the interface.
The energy budget for 25 individual burst events was calculated during drainage by excluding the cascaded and overlapped ones from the list created in § 4.1. Figure 14A presents surface energy and kinetic energy as a function of external work for these 25 burst events. Both surface energy and kinetic energy vary linearly with external work, with slopes of 0.90 and 0.48 × 10⁻³, respectively. These slopes suggest that during burst events, about 90% of the external work is converted to surface energy, and only 0.048% of the external work is converted to kinetic energy. Therefore, although extremely high velocities were observed during burst events, as show by the PDFs in Figure 12, the associated kinetic energy is negligibly small. Additionally, this energy balance suggests that about 10% of the external work is dissipated through viscous effects, which is much less than the 64% dissipation observed during drainage in 3D sandstone by Berg et al. (2013). The difference is presumably due to the fact that our 2D micromodel has higher porosity, which reduces the viscous dissipation rate compared with 3D porous media. Figure 14B presents a similar energy breakdown for 16 cooperative pore filling events that are similar to what is shown in Figure 13 during imbibition. Although the different forms of energy are less correlated for this case, presumably due to the relatively high measurement uncertainty, nevertheless, based on order of magnitude, ~ 20% of the released surface energy is converted into external work, with ~ 80% of it being dissipated through viscous effects. Again the conversion of kinetic energy from released surface energy is <0.1%. This important finding validates the assumption made by previous studies that the change in kinetic energy of such flow systems is negligible even during Haines jumps and cooperative pore filling events (Berg et al., 2013; Hu et al., 2018).
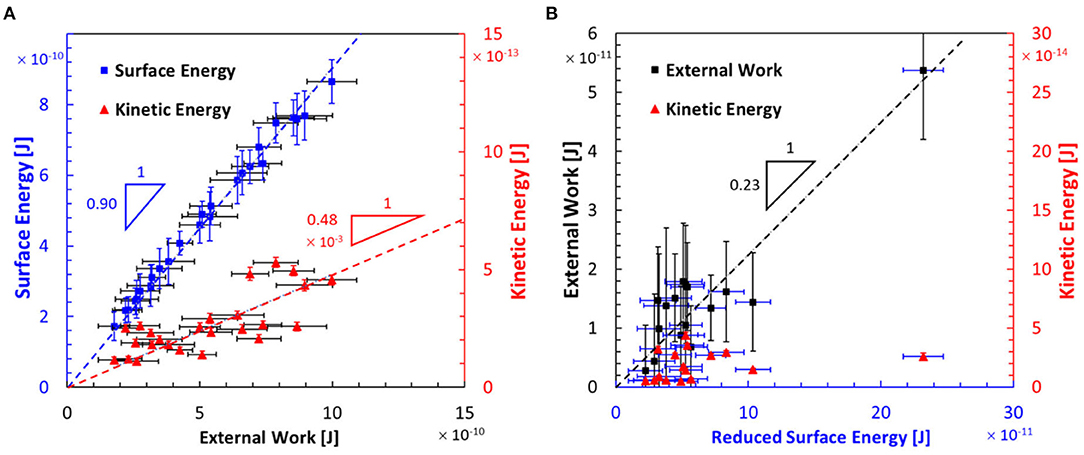
Figure 14. (A) Surface energy and kinetic energy as a function of external work for the largest 25 burst events during the drainage process. (B) External energy and kinetic energy as a function of reduced surface energy for 16 selected pore filling events during the imbibition process.
5. Conclusion
In this study, a high-speed μPIV technique was employed that captured spatially and temporally resolved dynamics of multiphase flow of CO2 and water in 2D microfluidic porous media under reservoir-relevant conditions for both strong drainage and weak imbibition. When CO2 displaces water in a hydrophilic micromodel (i.e., drainage), unstable capillary fingering occurs along, normal to, and opposing the bulk flow direction. Under these conditions, the pore flow is dominated by successive pore-scale burst events (i.e., Haines jumps), leading to a high degree of fluctuation in the instantaneous water velocity fields. When the micromodel surface was altered to be nearly neutral wetting, consistent with weak imbibition conditions, flow instability and fluctuation were significantly suppressed, leading to more compact and axisymmetric displacement patterns with narrower flow velocity distribution, consistent with existing studies.
Leveraging the unique spatially and temporally resolved datasets, detailed analyses were performed on the pore-scale flow dynamics, flow statistics, the effects of capillarity, and flow energy balance, which has revealed valuable insights, including:
1. The drainage process is dominated by a succession of Haines jumps, which cause extremely high velocities, typically two orders of magnitude higher than the bulk velocity, resulting in , confirming the importance of inertial effects.
2. Haines jump duration ranges from 4 ms to approximately 60 ms in the current micromodels, with the shortest burst events corresponding to individual isolated events and the longer duration events corresponding to burst events occurring in a cascading manner over multiple pores and throats. The instantaneous water velocity fields indicate that it is possible for one event to cascade over 16 throats.
3. The radius of influence of Haines jumps is estimated to be as large as 1.21 mm, a ~ 24 fold increase over the mean pore radius, 0.051 mm, suggesting that burst events are highly nonlocal and their influence extends up to and perhaps beyond what is typically considered as Darcy scale in these applications.
4. Modifying the wettability of the porous matrix, from being strongly hydrophilic to intermediate wetting, fundamentally and dramatically changes the behavior of the displacement process. In particular, doing so mitigates the flow instability and enhances displacement efficiency. Due to a reduction of capillarity and thus instability, the maximum flow speed in the imbibition case is much lower.
5. Direct observation of the pore filling behavior on an individual pore basis reveals a significant alteration of the pore filling mechanisms during drainage and imbibition. While the former typically features a burst event, which occurs only at one of the several throats connecting a pore, the latter is typically dominated by a cooperative filling mechanism, which involves simultaneous invasion of a pore from multiple throats. This mechanism leads to merging of two interfaces and a subsequent release of the surface energy, inducing instantaneous high-momentum flow events that appear similar, but are fundamentally different from, a burst event.
6. Energy balance analyses indicate that the conversion efficiency between surface energy and external work is as high as 90%, with the remaining energy dissipated instantaneously. Moreover, kinetic energy is disproportionately smaller than surface energy and external work (by more than three orders of magnitude), despite the extremely high flow velocities that occur during flow drainage. This finding validates the assumption made in previous studies that the change in kinetic energy is negligible during Haines jumps and cooperative pore filling events.
To our knowledge, the observations reported herein and afforded by the innovative experimental protocol used represent the first of their kind. They have advanced our fundamental understanding of these flow processes and will hopefully contribute to the next generation of pore-scale model development and validation.
Data Availability Statement
The original contributions presented in the study are included in the article/Supplementary Material, further inquiries can be directed to the corresponding author/s.
Author Contributions
KTC, GB, and YL conceived and planned the experiments. YL and FK built the apparatus and carried out the experiments. YL, GB, FK, RSM, and KTC contributed to the data processing, analysis and interpretation of the results. RSM contributed to literature review, micromodel characterization and revision of the manuscript. YL took the lead in writing the manuscript. All authors provided critical feedback and helped shape the research, analysis and manuscript.
Funding
This work was jointly funded by the U.S. Department of Energy, Office of Science, BES under award SC0C12504, the International Institute for Carbon-Neutral Energy Research (WPI-I2CNER) sponsored by the Japanese Ministry of Education, Culture, Sports, Science and Technology, and the Faculty Excellence Grants at Montana State University. This work was performed in part at the Montana Nanotechnology Facility, an NNCI facility supported by NSF Grant ECCS-1542210, and with support by the Murdock Charitable Trust.
Conflict of Interest
The authors declare that the research was conducted in the absence of any commercial or financial relationships that could be construed as a potential conflict of interest.
Publisher's Note
All claims expressed in this article are solely those of the authors and do not necessarily represent those of their affiliated organizations, or those of the publisher, the editors and the reviewers. Any product that may be evaluated in this article, or claim that may be made by its manufacturer, is not guaranteed or endorsed by the publisher.
Acknowledgments
YL thanks the Faculty Excellence Grants and the Norm Asbjornson College of Engineering at Montana State University for their support.
Supplementary Material
The Supplementary Material for this article can be found online at: https://www.frontiersin.org/articles/10.3389/frwa.2021.710370/full#supplementary-material
References
Anderson, W. G. (1987). Wettability literature survey-part 6: the effects of wettability on waterflooding. J. Petrol. Technol. 39, 1–605. doi: 10.2118/16471-PA
Armstrong, R. T., and Berg, S. (2013). Interfacial velocities and capillary pressure gradients during Haines jumps. Phys. Rev. E 88, 043010. doi: 10.1103/PhysRevE.88.043010
Armstrong, R. T., Ott, H., Georgiadis, A., Rücker, M., Schwing, A., and Berg, S. (2014). Subsecond pore-scale displacement processes and relaxation dynamics in multiphase flow. Water Resour. Res. 50, 9162–9176. doi: 10.1002/2014WR015858
Bachu, S. (2000). Sequestration of CO2 in geological media: Criteria and approach for site selection in response to climate change. Energy Conversion Manag. 41, 953–970. doi: 10.1016/S0196-8904(99)00149-1
Bazylak, A. (2009). Liquid water visualization in PEM fuel cells: a review. Int. J. Hydrogen Energy 34, 3845–3857. doi: 10.1016/j.ijhydene.2009.02.084
Berg, S., Ott, H., Klapp, S. A., Schwing, A., Neiteler, R., Brussee, N., et al. (2013). Real-time 3D imaging of haines jumps in porous media flow. Proc. Natl. Acad. Sci. U.S.A. 110, 3755–3759. doi: 10.1073/pnas.1221373110
Blois, G., Barros, J. M., and Christensen, K. T. (2015). A microscopic particle image velocimetry method for studying the dynamics of immiscible liquid-liquid interactions in a porous micromodel. Microfluid Nanofluidics 18, 1391–1406. doi: 10.1007/s10404-014-1537-1
Broseta, D., Tonnet, N., and Shah, V. (2012). Are rocks still water-wet in the presence of dense CO2 or H2S? Geofluids 12, 280–294. doi: 10.1111/j.1468-8123.2012.00369.x
Chang, C., Kneafsey, T. J., Wan, J., Tokunaga, T. K., and Nakagawa, S. (2020). Impacts of mixed-wettability on brine drainage and supercritical CO2 storage efficiency in a 2.5-d heterogeneous micromodel. Water Resour. Res. 56:e2019WR026789. doi: 10.1029/2019WR026789
Chen, Y., Li, Y., Valocchi, A. J., and Christensen, K. T. (2018). Lattice Boltzmann simulations of liquid CO2 displacing water in a 2D heterogeneous micromodel at reservoir pressure conditions. J. Contam Hydrol. 212:14–27. doi: 10.1016/j.jconhyd.2017.09.005
Chen, Y.-F., Fang, S., Wu, D.-S., and Hu, R. (2017). Visualizing and quantifying the crossover from capillary fingering to viscous fingering in a rough fracture. Water Resour. Res. 53, 7756–7772. doi: 10.1002/2017WR021051
Chomsurin, C., and Werth, C. J. (2003). Analysis of pore-scale nonaqueous phase liquid dissolution in etched silicon pore networks. Water Resour. Res. 39. doi: 10.1029/2002WR001643
Cottin, C., Bodiguel, H., and Colin, A. (2011). Influence of wetting conditions on drainage in porous media: a microfluidic study. Phys. Rev. E 84:026311. doi: 10.1103/PhysRevE.84.026311
Dawson, H. E., and Roberts, P. V. (1997). Influence of viscous, gravitational, and capillary forces on DNAPL saturation. Groundwater 35, 261–269. doi: 10.1111/j.1745-6584.1997.tb00083.x
DiCarlo, D. A., Cidoncha, J. I., and Hickey, C. (2003). Acoustic measurements of pore-scale displacements. Geophys. Res. Lett. 30. doi: 10.1029/2003GL017811
Fakhari, A., Li, Y., Bolster, D., and Christensen, K. T. (2018). A phase-field lattice Boltzmann model for simulating multiphase flows in porous media: application and comparison to experiments of CO2 sequestration at pore scale. Adv. Water Resour. 114, 119–134. doi: 10.1016/j.advwatres.2018.02.005
Ferrari, A., and Lunati, I. (2014). Inertial effects during irreversible meniscus reconfiguration in angular pores. Adv.Water Resour. 74, 1–13. doi: 10.1016/j.advwatres.2014.07.009
Gray, W. G., Bruning, K., and Miller, C. T. (2019). Non-hysteretic functional form of capillary pressure in porous media. J. Hydraulic Res. 57, 747–759. doi: 10.1080/00221686.2019.1671520
Gunter, W., Wiwehar, B., and Perkins, E. (1997). Aquifer disposal of CO2-rich greenhouse gases: extension of the time scale of experiment for CO2-sequestering reactions by geochemical modelling. Mineral. Petrol. 59, 121–140. doi: 10.1007/BF01163065
Haines, W. B. (1930). Studies on the physical properties of soil. V. The hysteresis effect in capillary properties, and the modes of moisture distribution associated therewith. J. Agric. Sci. 20, 97–116. doi: 10.1017/S002185960008864X
Holtzman, R., and Segre, E. (2015). Wettability stabilizes fluid invasion into porous media via nonlocal, cooperative pore filling. Phys. Rev. Lett. 115, 164501. doi: 10.1103/PhysRevLett.115.164501
Hu, R., Wan, J., Kim, Y., and Tokunaga, T. K. (2017). Wettability effects on supercritical CO2-brine immiscible displacement during drainage: Pore-scale observation and 3d simulation. Int. J. Greenhouse Gas Control 60, 129–139. doi: 10.1016/j.ijggc.2017.03.011
Hu, R., Wu, D.-S., Yang, Z., and Chen, Y.-F. (2018). Energy conversion reveals regime transition of imbibition in a rough fracture. Geophys. Res. Lett. 45, 8993–9002. doi: 10.1029/2018GL079302
Huppert, H. E., and Neufeld, J. A. (2014). The fluid mechanics of carbon dioxide sequestration. Annu. Rev. Fluid Mech. 46, 255–272. doi: 10.1146/annurev-fluid-011212-140627
Iglauer, S., Fernø, M., Shearing, P., and Blunt, M. (2012). Comparison of residual oil cluster size distribution, morphology and saturation in oil-wet and water-wet sandstone. J. Colloid Interface Sci. 375, 187–192. doi: 10.1016/j.jcis.2012.02.025
Ilin, E., Li, Y., Colla, E. V., Christensen, K. T., Sahimi, M., Marchevsky, M., et al. (2020). Nanoscale detection of metastable states in porous and granular media. J. Appl. Phys. 127, 024901. doi: 10.1063/1.5135321
Jafari, M., and Jung, J. (2017). Direct measurement of static and dynamic contact angles using a random micromodel considering geological CO2 sequestration. Sustainability 9, 2352. doi: 10.3390/su9122352
Karadimitriou, N., Hassanizadeh, S., Joekar-Niasar, V., and Kleingeld, P. (2014). Micromodel study of two-phase flow under transient conditions: quantifying effects of specific interfacial area. Water Resour. Res. 50, 8125–8140. doi: 10.1002/2014WR015388
Kazemifar, F., Blois, G., Kyritsis, D. C., and Christensen, K. T. (2015). A methodology for velocity field measurement in multiphase high-pressure flow of CO2 and water in micromodels. Water Resour. Res. 51, 3017–3029. doi: 10.1002/2014WR016787
Kazemifar, F., Blois, G., Kyritsis, D. C., and Christensen, K. T. (2016). Quantifying the flow dynamics of supercritical CO2-water displacement in a 2D porous micromodel using fluorescent microscopy and microscopic PIV. Adv. Water Resour. 95, 352–368. doi: 10.1016/j.advwatres.2015.05.011
Kazemifar, F., and Kyritsis, D. C. (2014). Experimental investigation of near-critical CO2 tube-flow and Joule-Thompson throttling for carbon capture and sequestration. Exp. Therm. Fluid Sci. 53, 161–170. doi: 10.1016/j.expthermflusci.2013.11.026
Koide, H., Tazaki, Y., Noguchi, Y., Nakayama, S., Iijima, M., Ito, K., et al. (1992). Subterranean containment and long-term storage of carbon dioxide in unused aquifers and in depleted natural gas reservoirs. Energy Conversion Manag. 33, 619–626. doi: 10.1016/0196-8904(92)90064-4
Law, D. H.-S., and Bachu, S. (1996). Hydrogeological and numerical analysis of co2 disposal in deep aquifers in the alberta sedimentary basin. Energy Conversion Manag. 37, 1167–1174. doi: 10.1016/0196-8904(95)00315-0
Lenormand, R., Touboul, E., and Zarcone, S. (1988). Numerical models and experiments on immiscible displacements in porous media. J. Fluid Mech. 189:165–187. doi: 10.1017/S0022112088000953
Li, Y., Blois, G., Kazemifar, F., and Christensen, K. T. (2019). High-speed quantification of pore-scale multiphase flow of water and supercritical CO2 in 2-D heterogeneous porous micromodels: flow regimes and interface dynamics. Water Resour. Res. 55, 3758–3779. doi: 10.1029/2018WR024635
Li, Y., Blois, G., Kazemifar, F., and Christensen, K. T. (2021). A particle-based image segmentation method for phase separation and interface detection in piv images of immiscible multiphase flow. Meas. Sci. Technol. 32, 095208. doi: 10.1088/1361-6501/abf0dc
Li, Y., Grigoriev, R., and Yoda, M. (2014). Experimental study of the effect of noncondensables on buoyancy-thermocapillary convection in a volatile low-viscosity silicone oil. Phys. Fluids 26, 122112. doi: 10.1063/1.4904870
Li, Y., Kazemifar, F., Blois, G., and Christensen, K. T. (2017). Micro-PIV measurements of multiphase flow of water and liquid CO2 in 2-D heterogeneous porous micromodels. Water Resour. Res. 53, 6178–6196. doi: 10.1002/2017WR020850
Li, Y., and Yoda, M. (2014). Convection driven by a horizontal temperature gradient in a confined aqueous surfactant solution: the effect of noncondensables. Exp. Fluids 55, 1–11. doi: 10.1007/s00348-013-1663-7
Li, Y., and Yoda, M. (2016). An experimental study of buoyancy-marangoni convection in confined and volatile binary fluids. Int. J. Heat Mass. Transf. 102, 369–380. doi: 10.1016/j.ijheatmasstransfer.2016.06.004
Linstrom, P. J., and Mallard, W. G. (2001). The NIST chemistry webbook: a chemcial data resource on the internet. J. Chem. Eng. Data 46, 1059–1063. doi: 10.1021/je000236i
Liu, H., Zhang, Y., and Valocchi, A. J. (2015). Lattice boltzmann simulation of immiscible fluid displacement in porous media: Homogeneous versus heterogeneous pore network. Phys. Fluids 27, 052103. doi: 10.1063/1.4921611
Liu, Y., Nolte, D., and Pyrak-Nolte, L. (2011). Hysteresis and interfacial energies in smooth-walled microfluidic channels. Water Resour. Res. 47. doi: 10.1029/2010WR009541
Mehmani, Y., and Balhoff, M. T. (2015). Mesoscale and hybrid models of fluid flow and solute transport. Rev. Mineral. Geochem. 80, 433–459. doi: 10.2138/rmg.2015.80.13
Moebius, F., and Or, D. (2014). Inertial forces affect fluid front displacement dynamics in a pore-throat network model. Phys. Rev. E 90:023019. doi: 10.1103/PhysRevE.90.023019
Morrow, N. R. (1970). Physics and thermodynamics of capillary action in porous media. Ind. Eng. Chem. 62, 32–56. doi: 10.1021/ie50726a006
Morrow, N. R. (1990). Wettability and its effect on oil recovery. J. Petrol. Technol. 42, 1–476. doi: 10.2118/21621-PA
Pacala, S., and Socolow, R. (2004). Stabilization wedges: Solving the climate problem for the next 50 years with current technologies. Science 305, 968–972. doi: 10.1126/science.1100103
Perrin, J.-C., and Benson, S. (2010). An experimental study on the influence of sub-core scale heterogeneities on CO2 distribution in reservoir rocks. Transp. Porous Media 82, 93–109. doi: 10.1007/s11242-009-9426-x
Porter, M. L., Wildenschild, D., Grant, G., and Gerhard, J. I. (2010). Measurement and prediction of the relationship between capillary pressure, saturation, and interfacial area in a napl-water-glass bead system. Water Resour. Res. 46. doi: 10.1029/2009WR007786
Rabbani, A., Jamshidi, S., and Salehi, S. (2014). An automated simple algorithm for realistic pore network extraction from micro-tomography images. J. Petrol. Sci. Eng. 123, 164–171. doi: 10.1016/j.petrol.2014.08.020
Roman, S., Soulaine, C., AlSaud, M. A., Kovscek, A., and Tchelepi, H. (2016). Particle velocimetry analysis of immiscible two-phase flow in micromodels. Adv. Water Res. 95, 199–211. doi: 10.1016/j.advwatres.2015.08.015
Salathiel, R. (1973). Oil recovery by surface film drainage in mixed-wettability rocks. J. Petrol. Technol. 25, 1–216. doi: 10.2118/4104-PA
Sedev, R., Budziak, C., Petrov, J., and Neumann, A. (1993). Dynamic contact angles at low velocities. J. Colloid Interface Sci. 159, 392–399. doi: 10.1006/jcis.1993.1338
Seyyedi, M., Sohrabi, M., and Farzaneh, A. (2015). Investigation of rock wettability alteration by carbonated water through contact angle measurements. Energy Fuels 29, 5544–5553. doi: 10.1021/acs.energyfuels.5b01069
Sheng, Q., and Thompson, K. (2013). Dynamic coupling of pore-scale and reservoir-scale models for multiphase flow. Water Resour. Res. 49, 5973–5988. doi: 10.1002/wrcr.20430
Simjoo, M., Dong, Y., Andrianov, A., Talanana, M., and Zitha, P. (2013). CT scan study of immiscible foam flow in porous media for enhancing oil recovery. Ind. Eng. Chem. Res. 52, 6221–6233. doi: 10.1021/ie300603v
Song, Y., Zhu, N., Zhao, Y., Liu, Y., Jiang, L., and Wang, T. (2013). Magnetic resonance imaging study on near miscible supercritical CO2 flooding in porous media. Phys. Fluids 25, 053301. doi: 10.1063/1.4803663
Trojer, M., Szulczewski, M. L., and Juanes, R. (2015). Stabilizing fluid-fluid displacements in porous media through wettability alteration. Phys. Rev. Appl. 3:054008. doi: 10.1103/PhysRevApplied.3.054008
Tsuji, T., Jiang, F., and Christensen, K. T. (2016). Characterization of immiscible fluid displacement processes with various capillary numbers and viscosity ratios in 3d natural sandstone. Adv. Water Resour. 95, 3–15. doi: 10.1016/j.advwatres.2016.03.005
Wang, S., and Tokunaga, T. K. (2015). Capillary pressure-saturation relations for supercritical CO2 and brine in limestone/dolomite sands: implications for geologic carbon sequestration in carbonate reservoirs. Environ. Sci. Technol. 49, 7208–7217. doi: 10.1021/acs.est.5b00826
Xu, R., Li, R., Ma, J., and Jiang, P. (2015). CO2 exsolution from CO2 saturated water: Core-scale experiments and focus on impacts of pressure variations. Environ. Sci. Technol. 49, 14696–14703. doi: 10.1021/acs.est.5b03826
Yamabe, H., Tsuji, T., Liang, Y., and Matsuoka, T. (2014). Lattice Boltzmann simulations of supercritical CO2-water drainage displacement in porous media: CO2 saturation and displacement mechanism. Environ. Sci. Technol. 49, 537–543. doi: 10.1021/es504510y
Zacharoudiou, I., Chapman, E. M., Boek, E. S., and Crawshaw, J. P. (2017). Pore-filling events in single junction micro-models with corresponding lattice boltzmann simulations. J. Fluid Mech. 824, 550–573. doi: 10.1017/jfm.2017.363
Zhang, C., Oostrom, M., Grate, J. W., Wietsma, T. W., and Warner, M. G. (2011a). Liquid CO2 displacement of water in a dual-permeability pore network micromodel. Environ. Sci. Technol. 45, 7581–7588. doi: 10.1021/es201858r
Zhang, C., Oostrom, M., Wietsma, T. W., Grate, J. W., and Warner, M. G. (2011b). Influence of viscous and capillary forces on immiscible fluid displacement: pore-scale experimental study in a water-wet micromodel demonstrating viscous and capillary fingering. Energy Fuels 25, 3493–3505. doi: 10.1021/ef101732k
Zhao, B., MacMinn, C. W., and Juanes, R. (2016). Wettability control on multiphase flow in patterned microfluidics. Proc. Natl. Acad. Sci. U.S.A. 13, 10251–10256. doi: 10.1073/pnas.1603387113
Keywords: porous media, pore scale, micromodel, multiphase flow, particle image velocimetry, drainage, imbibition, wettability
Citation: Li Y, Blois G, Kazemifar F, Molla RS and Christensen KT (2021) Pore-Scale Dynamics of Liquid CO2–Water Displacement in 2D Axisymmetric Porous Micromodels Under Strong Drainage and Weak Imbibition Conditions: High-Speed μPIV Measurements. Front. Water 3:710370. doi: 10.3389/frwa.2021.710370
Received: 16 May 2021; Accepted: 22 July 2021;
Published: 16 August 2021.
Edited by:
James E. McClure, Virginia Tech, United StatesReviewed by:
Apostolos Kantzas, University of Calgary, CanadaHolger Steeb, University of Stuttgart, Germany
Copyright © 2021 Li, Blois, Kazemifar, Molla and Christensen. This is an open-access article distributed under the terms of the Creative Commons Attribution License (CC BY). The use, distribution or reproduction in other forums is permitted, provided the original author(s) and the copyright owner(s) are credited and that the original publication in this journal is cited, in accordance with accepted academic practice. No use, distribution or reproduction is permitted which does not comply with these terms.
*Correspondence: Yaofa Li, yaofa.li@montana.edu