 Wesley Schultz
 Shahram Javey2
- 1California State University, San Marcos, CA, United States
- 2Badger Meter, Los Gatos, CA, United States
Many regions around the world experience both chronic and intermittent needs for residents to reduce their water consumption. Recent advances in water metering infrastructure offer opportunities to provide customers with detailed feedback about their consumption, but research in behavioral science suggests that feedback by itself is not enough to motivate conservation. The current empirical work builds on previous studies showing the ability of an augmented feedback approach to promote reductions in residential water consumption, and extends previous research by exploring the variability in responses to this feedback. A sample of Sacramento customers was provided with printed home water reports in which they could see their household water consumption compared with similar homes in their area. The results showed that households that received the report used 8.35% less water in the subsequent 6 months than did similar households that did not receive the printed reports. Additional analyses showed that the effect was particularly strong for high-consuming households, and that the discrepancy between household consumption and similar homes influenced the amount of water savings.
Introduction
As the world's population grows, the demand for natural resources will continue to increase. Among the many finite resources, fresh water stands out as one of the most critical. While 70% of the earth's surface is water, less than 1% is available for human consumption—the vast majority is either frozen in ice sheets or salty in the ocean (Perlman, 2016). Fresh water is essential for life, and the World Health Organization estimates that each person needs 15 liters per day for basic necessities such as drinking, cooking, and sanitation (Reed et al., 2013). Beyond basic necessities, the United Nations estimates that 50–100 liters per person per day is sufficient for personal and domestic uses, including washing clothes, personal, and household hygiene, and other activities. While most of the world's population now has access to improved sources of drinking water (91% according to the United Nations), managing the availability of water is an ongoing local and global challenge (United Nations, 2017).
Water demand management involves both more efficient uses of water, along with conservation. Efficiency in this context means producing the same outcome with fewer resources. So for example, using less water for bathing, or agricultural practices that maximize harvest while minimizing water use. Conservation refers to reduced consumption, and while efficiency can oftentimes lead to reductions in consumption, conservation also includes curtailing activities. For example, an efficient showerhead can reduce the water consumption of an 8-min shower from 120 liters to 80 liters. But conserving water by reducing shower times to 4 min, even without an efficient showerhead, can reduce consumption to 60 liters.
This paper focuses on demand management, and the integration of behavioral science with engineering and software to create an effective feedback platform that can promote both water efficiency and conservation in a residential setting. While residential water metering has been in place for more than 100 years, recent technological developments have resulted in high-resolution meters that can provide residents with near-real-time feedback about their consumption (Boyle et al., 2013). These technologies offer an exciting opportunity to educate customers about the ways in which they use water, and to motivate changes in behavior that can help to manage water demand (Anda et al., 2013). Importantly, while traditional approaches to demand management have focused on the costs associated with water consumption and the corresponding potential for saving money, recent developments in behavioral science have uncovered potentially more effective strategies for encouraging efficiency and conservation.
Strategies for Demand Management
Reducing demand for water typically reqiuires behavior change—either encouraging individuals to engage in different behaviors, or to do existing behaviors differently. Perhaps surprisingly, few behavioral science studies have directly tested strategies for water conservation and efficiency, compared with other areas of conservation and sustainability such as energy consumption or recycling. In their review of 253 behavioral science studies of pro-environmental behavior, 26 studies were identified that focused on water conservation (Osbaldiston and Schott, 2012). Of these, the most commonly-tested strategies were education (including instructions and justifications), pricing, and feedback. This paper focuses on feedback, with a special emphasis on social comparisons as a form of feedback.
While simple feedback is generally associated with small overall changes in behavior, feedback paired with a meaningful comparison can be powerful (Kluger and DeNisi, 1996). Meaningful comparisons come in many forms, including a personal goal, a contest to win a prize, a prior commitment, or a social referent. In recent years, social comparison has emerged as a strong foundation for behavior change, and the approach has been used to encourage residential energy conservation (Schultz et al., 2015) and recycling (Schultz, 1999; Varotto and Spagnolli, 2017). In the energy domain, social comparisons have been widely used through OPOWER home energy reports, which have reached more than 60 million households worldwide (Allcott and Rogers, 2014). The results from these large-scale deployments have consistently shown reductions in household electricity consumption by 2–5% (Schultz et al., 2018a).
Personalized normative feedback provides individuals with information about their level of consumption, coupled with a comparison to a social referent. In their initial use of personalized normative feedback to reduce electricity consumption, Schultz et al. (2007) provided residents with weekly feedback about their household's electricity consumption, coupled with feedback about “other households in your neighborhood.” For high-consuming households, this personalized normative comparison resulted in reduced consumption; but for low-consuming households, the simple social comparison resulted in a boomerang effect of increased consumption. In a second variation, the researchers added a message of social approval (a smiley face in the case of low-consuming households) or social disapproval (a frowny face for high-consuming households). This addition enhanced the reduction in consumption for high-consuming households, but eliminated the boomerang effect for low-consuming households.
In the area of water conservation, social comparison has been shown to effectively reduce consumption—especially for high consuming households. In their 2012 meta-analysis (Osbaldiston and Schott, 2012), identified only 1 study that tested social modeling related to water conservation, and they reported that it had a significant effect. In a large-scale test, Ferraro et al. (2011) provided personalized normative feedback about the amount of water consumed by neighboring households to nearly 12,000 homes in the Atlanta region. Compared to more than 71,000 households in the control condition, normative feedback reduced water consumption by 5% for high-consuming households, and 3% for low-consuming households. See also Ferraro and Price (2013).
The Current Study
The current study reports the results from a large-scale deployment using smart water meters, and communication strategies to promote water conservation. Residential water consumption data were obtained from 2015 through 2017, during which the region was experiencing extreme drought. In 2015, the State of California had mandated a 25% statewide reduction in consumption, and water utilities were deploying water restrictions along with efforts to raise awareness and encourage voluntary reductions. The current project was conducted in Sacramento, CA, in partnership with the meter manufacturing company (Badger Meter, Inc) and the city's water utility. Sacramento had recently upgraded more than 85,000 residential water meters, and the water utility was able to leverage the automated meter infrastructure to provide residents with augmented information about their household's consumption. The research reported below focused on single-family households and summarizes secondary data analysis testing the effectiveness of the augmented feedback.
Methods and Results
Personalized Water Reports
Personalized water reports (Water Focus Reports®) were developed to provide Sacramento residents with monthly feedback about their consumption coupled with a comparison to similar households (see example in Figure 1). The printed reports were divided into six panels, using a tri-fold design on 8.5 × 11 paper, to give residents feedback about their level of consumption over the past month, a comparison to similar homes, and targeted behaviors that could help to reduce their water consumption. The targeted behaviors were aligned with state and local water conservation programs. Water reports provided feedback to individual homes based on a “similar homes” estimate. In instances where the property consumed less water than similar homes, the message was shaded in green with a smiley face; in instances where the property consumed more water than similar homes, the message was shaded in red with a frowny face. The “similar homes” value was calculated as the average water consumption for the month preceding the mailed reports, and was equal to 276 gallons.
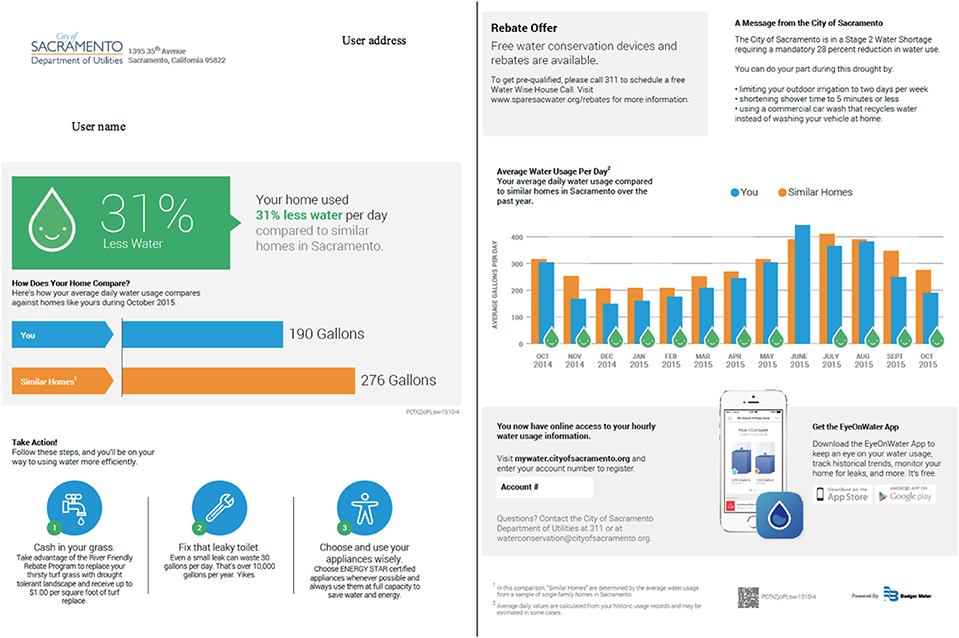
Figure 1. Water report design (front side and back side).
The backside of the report presented a historical comparison of water consumption for both the household and “similar homes” over the past year. It also displayed a rebate offer and a conservation message from the local water utility. Finally, instructions to access higher-resolution data through the web and mobile application (EyeOnWater®) were provided. Water reports were sent from the utility using postal mail to homes located in selected regions of Sacramento. The selection of homes that received the reports was based on targeted geographic regions. The reports were sent to a small number of billing routes. Billing routes are based on geographic proximity, and allow water utilities to divide out the service region into smaller areas and to spread the billing across the days in a month. In total, 8,362 single-family homes received the reports during the study period, corresponding to approximately 5% of the utility's residential customers.
Dwelling Characteristics
Property characteristics were obtained for each of the addresses in the region, drawing on publicly available data from the county records office. From the public data source, we obtained:
• the number of bedrooms (range from 0 to 9, mean = 2.96, SD = 0.86),
• number of bathrooms (range from 1 to 6, mean = 1.76, SD = 0.66),
• land area (range from 1017sf to 96,268sf, mean = 7,030, SD = 4,171),
• living area (range from 308sf to 5878sf, mean = 1486, SD = 585),
• and number of stories (range from 1 to 2, mean = 1.21, SD = 0.41).
These dwelling characteristics were used as covariates in some of our analyses, to control for possible pre-existing differences between the treatment and comparison conditions.
The study was reviewed by the Institutional Review Board (IRB) at California State University, San Marcos (IORG0002037) and was determined to qualify as exempt. The exemption was based on the fact that the analyses were performed using water consumption data provided by the utility (secondary data analysis), and the analyses were conducted using a de-identified datafile.
Results
For the current analyses, we identified a stable group of 18,711 homes that provided uninterrupted smart meter data from June, 2015 through December, 2016. Of these 18,711 households, 8,362 received water reports at the end of October, 2015. The remaining 10,349 households were classified as a non-treatment comparison group.
Using the 18,711 homes across 19 months resulted in an analytic data set of 352,757 data points of monthly water usage. To clean the data, we excluded monthly readings that showed negative flow (168 instances, 0.07%) or that had zero flow (4053 instances, 1.1%). The resulting distribution was positively skewed, and extreme outliers >4-times the interquartile range were excluded (38,996 gallons per month, corresponding to 5,750 datapoints, 1.6%). With these exclusions, we included 97.2% of the initial data for our analyses. Data screening was done on a case-wise basis, allowing homes with missing data to remain in the analysis. Data analyses were conducted using a long dataset, and sample sizes varied slightly from month to month due to changes in account status.
To illustrate the overall water consumption pattern, Figure 2 shows a histogram of water usage in October 2015. We chose October 2015 because it was the month prior to sending the water reports. As shown in the Figure, the average monthly water consumption during October was 8297 gallons. This equates to a daily consumption rate of 276 gallons (1,045 liters).
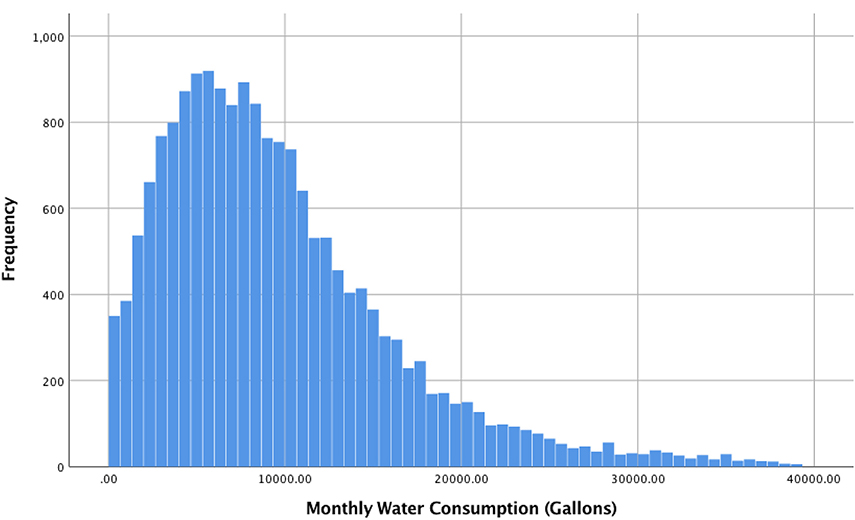
Figure 2. Histogram of average monthly water usage of sample homes.
To test the impact of the printed water reports, we plotted the average monthly water consumption patterns for the households that received the reports and comparison groups (see Figure 3). In the Figure, the vertical red line represents the point at which homes received the printed reports (October, 2015). The blue line shows water usage of homes who received the reports (water report group) and the orange line shows the water consumption pattern of the comparison group. The error bars show the 95% confidence interval calculated using the standard error of the monthly water consumption based on the between-group variability of the homes in each of the treatment conditions, and the normal curve. As evidenced in the Figure, there was a strong seasonal pattern for water consumption—both groups had higher water usage during summer months than in winter. The reason is additional outdoor water usage during the summer which is caused by irrigation practices. Winter water usage is almost exclusively indoor water consumption.
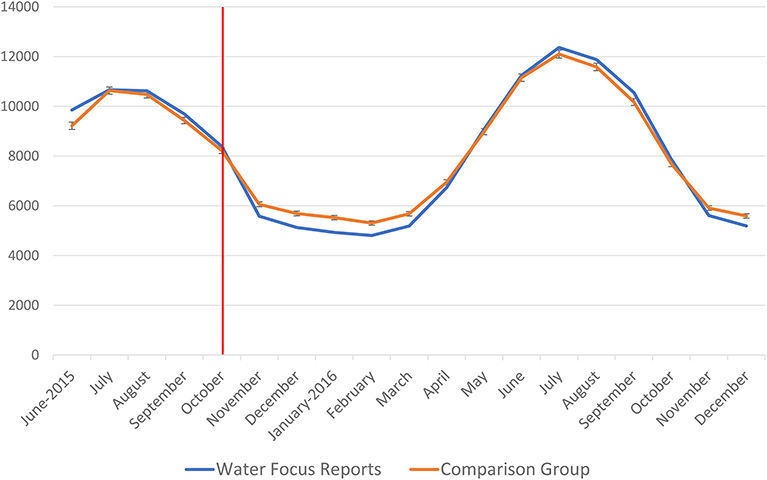
Figure 3. Average monthly water consumption for households that received water reports and a comparison group. Error bars represent the 95% Confidence Interval (CI) around the mean.
Figure 3 also shows the conservation impact associated with the water reports. Through October 2015, the water report and comparison groups were statistically similar in terms of their water consumption. Then in October 2015 water reports were sent, and over the next 6 months (November 2015—April 2016) homes that received water reports used less water than the comparison group. The effect persisted for 6 months, after which the groups converged in their level of consumption. To quantify the water savings associated with the water reports, we calculated the percentage difference in consumption for each of the months during the analytic period. The water savings effect was highest in the three months following the mailing (−8% in November, −10% in December, and −11% in January). The effect began to dissipate over the next 3 months (−9% in February, −9% in March, −4% in April), and then returned to parity after 6 months. Combined over the first 6 months households, households that received the reports used 8.3% less water, compared to households that did not receive the report.
Our next set of analyses explored the differential impact of water reports on high and low water users. Our prediction was that water reports would have more influence on the behavior of high water users, whereas low water users may have already implemented water conservation practices. We tested whether households that received a negative report (i.e., they used more water than the presented monthly norm of 276 gallons) reduced their consumption more than households that received a positive report indicating that they used less than the norm. Figure 4 illustrates water consumption patterns of households above/below the presented norm, and shows their breakdown into homes who received water reports (water report group) and those who did not (comparison group). As we predicted, the water consumption patterns for the water reports and comparison groups is similar among low water users (see blue bar and blue line in Figure). The influence of water reports is much stronger on high users. High users in the two groups initially had a similar water usage, but after receiving the reports high users in water report group demonstrated lower water consumption up to May 2016.
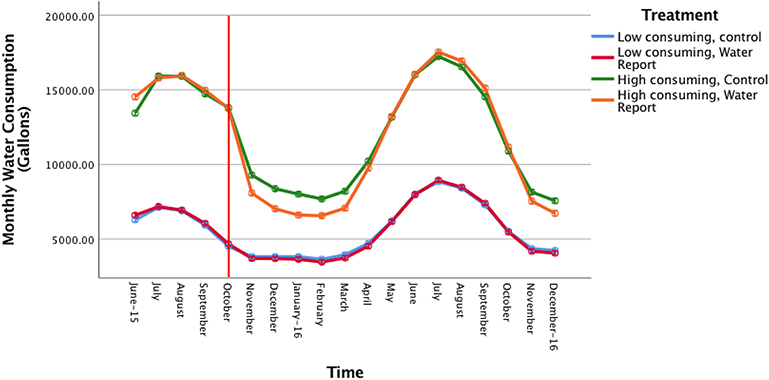
Figure 4. Differential changes in water consumption for high and low water users that received water reports vs. a comparison group. High and low users defined as above or below the norm consumption of 8,280 gallons per month in October. Errors bars represent 95% confidence intervals around the mean.
To estimate the impact of the water reports on high and low users, we calculated the percentage difference in consumption between the two groups. As shown in Figure 5, high water users reduced their consumption in the 6 months following the reports by 13, 16, 18, 15, 14, and 5%, relative to high using households that did not receive water reports. The average across the 6 months was 13.5%. By comparison, low consuming households also reduced their consumption, but the effects were muted: 3, 3, 5, 5, 5, and 4% in the 6 months following the reports, relative to low consuming households that did not receive the report. The average was 5%.
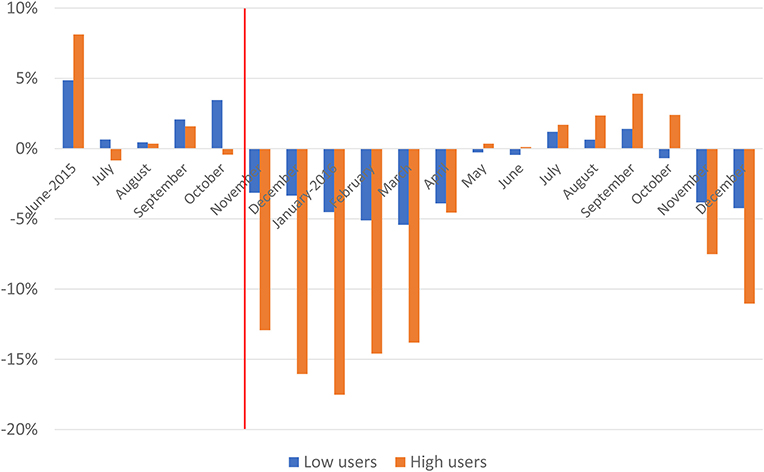
Figure 5. Water savings among high and low water users due to water reports.
Converting percentage savings into gallons, the typical high-using household in the comparison group consumed 8,632 gallons per month in the 6 months following the report. The 13.5% average savings rate resulted in water savings of 1,165 gallons, per household, per month, relative to the comparison group. Low consuming households in the comparison group used an average of 3,963 gallons per month in the 6 months following the water focus reports. The 5% average savings rate resulted in 198 fewer gallons consumed per month as a result of receiving the water focus reports.
Multi-Level Modeling
An additional set of analyses were conducted to explore the effectiveness of the water reports at reducing consumption among high and low water users. Growth curve analyses were conducted focusing on water consumption for the 1 month preceding intervention (October, 2015) and then for 6 months following intervention (November through April). The analysis followed the growth curve analytic framework in hierarchical linear modeling, in which change over time in water consumption was modeled mathematically, and then predictor variables were used to test hypotheses about the differential impact of water focus reports on change in consumption (Raudenbush and Bryk, 2002). In these analyses, time was centered, with October representing time 0. Analyses were conducted using SPSS 25, MIXED.
In the first analysis, time (0–6) and water report (0 = no, 1 = yes) were used to predict water consumption. In this analysis, dwelling features of bathroom, bedrooms, living area, land area, and number of stories were entered as covariates. Then on the second step, the time x water report multiplicative term was entered into the equation. The detailed results are summarized in Table 1. Cross-level interactions in the multi-level modeling framework allow for tests of moderation, and a significant interaction suggests that the effect of one variable differs as a function of the other (Curran et al., 2010). In our analyses, the interaction tests that the change over time in water consumption is different for households that received the water report, compared to those that did not. Results from the multi-level model showed that dwelling features of bathrooms, bedrooms, living area, land area, and number of stories were all significantly predictive of water consumption. Time was a significant predictor, as was water report, and the time x report interaction. The statistically significant interaction shows that households that received the water focus report decreased their consumption over the 7-month period more than did households that did not receive the report. This is consistent with the previously-reported results using the 95% confidence intervals and plotted in Figure 2.
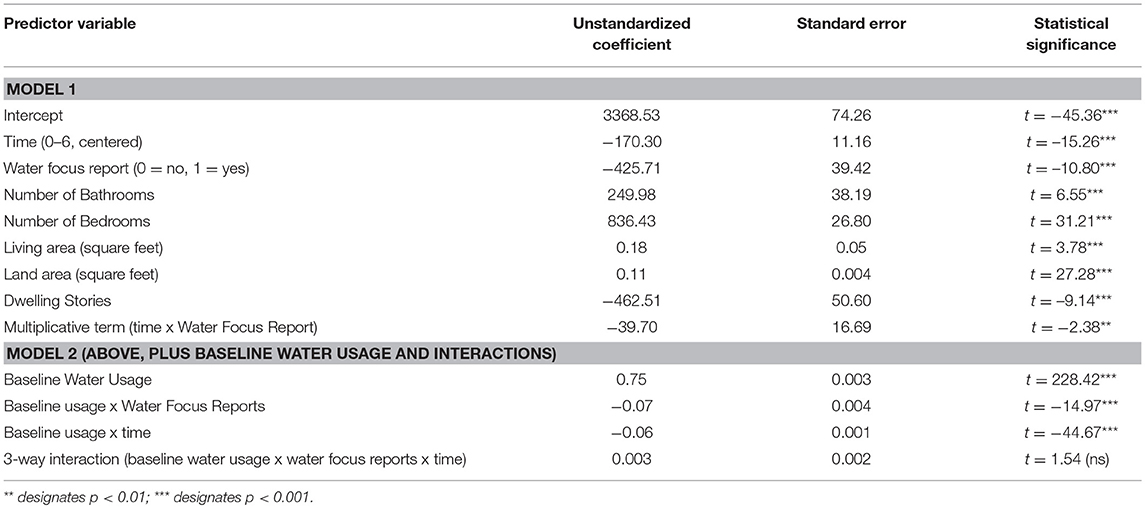
Table 1. Results from multi-level model testing impact of water focus reports on water consumption over time.
A second multi-level model was calculated to compare the effect of water focus reports for high/low consuming households. Similar to the previous multi-level model, time (centered at 0 = pre-intervention month and extending for 6 months following treatment) was entered as a fixed-effect level 1 predictor. Then at level 2, water report (0 = no, 1 = yes) and the five property features were entered along with the random effect of time. The new addition was the use of baseline water consumption (continuous) as a level-2 predictor, along with the three 2-way interaction terms and the 3-way interaction term.
The results showed a 2-way interaction for water focus reports x baseline water consumption, suggesting that households with differing baseline levels of consumption responded differently to the reports. To graphically illustrate this effect, baseline consumption was divided into deciles with the first five deciles receiving positive water reports (consumed <276 gallons per day) and the second five deciles receiving a negative report (consumed more than 276 gallons per day). The difference was then calculated between households that received the water focus reports, and households that were in the comparison group, for each of the 10 deciles. The results are shown in Figure 6. As shown in the figure, households that received a positive report (left five deciles) reduced consumption in the month following the report (3% on average). For households that received a negative report (right five deciles), water savings rates were higher (average of 13%). These results are in line with our hypothesis. For households that were above the norm, greater deviation resulted in more water conservation; and for households below the norm, greater deviation resulted in less water conservation.
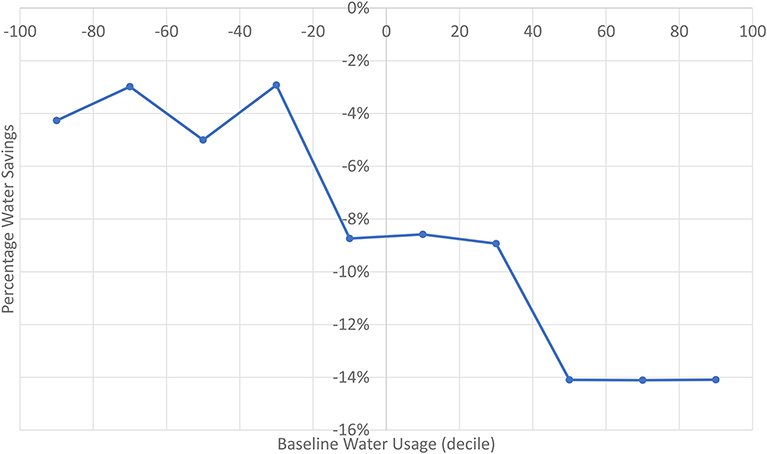
Figure 6. Water savings associated with water reports by baseline usage (deciles). Baseline water usage is based on decile of consumption in the month prior to intervention. Water savings is calculated as the difference between the households that received a water report, relative to households of similar baseline water usage for comparison households.
Discussion
This paper presents an empirical study examining the impact of customized water reports on residential water consumption, and the variability in response to these reports. Results showed that personalized home water reports significantly reduced the amount of water consumed by households. The water savings were −9.7% in the first 3 months, −7.0% in the next 3 months, and then returning to parity with the comparison group after 6 months. Additional analyses showed that the effect was particularly strong for high-consuming households (e.g., 13.5% reductions) compared to lower consuming households (e.g., 5% reductions). These water savings are in line with previously reported studies (Ferraro et al., 2011; Liu et al., 2015), although our results show a larger water savings than reported elsewhere (cf., Mitchell et al., 2013).
Importantly, we attribute the conservation effect for the water reports to the “similar homes” comparison, rather than to the educational components of the report. Providing a “similar homes” comparison serves to activate a social norm, and households that use more water than the norm will be perceived as socially deviant (Lima and Navas, 2012; DeDominicis et al., 2019). This interpretation is strengthened by the finding that high-consuming households showed greater reductions in water consumption than did low consuming households. Previous work has shown that providing consumption information for neighboring homes can produce an increase in consumption for low-consuming households because the community norm is to use more water than they do (Schultz et al., 2007). However, the addition of the smiley face and green color to communicate social approval for low consumption can counteract this tendency and eliminate the potential boomerang effect.
Extending these findings, additional results showed that the size of the water savings was moderated by baseline consumption. The overall findings about the water savings associated with normative feedback is not new, and these results replicate and extends previous findings into a large residential water application. However, a new finding is that high consuming households that deviated more from the reported norm reduced their consumption more than high consuming households that were closer to the reported norm. For low consuming households, the effect was more modest, and showed that greater discrepancy from the norm resulted in lower levels of water savings. These results show an effect that is beyond just receiving a positive or negative message. For households that received a negative report (indicating that they consumed more than similar households), degree of deviation from the norm predicted the impact of the report. The pattern indicated that high consuming households that deviated more from the norm reduced their consumption more in the month following the report than did households who were closer to the norm.
Another noteworthy aspect of the water reports is the durability of the impact. The reported results in this paper are based on a single mailed report, and our results showed an effect that lasted for 6 months. Other similar applications have used repeated communications, with reports sent monthly for 6 months, or quarterly on an ongoing basis (cf., Allcott and Rogers, 2014). Our results suggest that repeated communications are needed in order to sustain the reductions over time. In addition, because the effect dissipated over time, it suggests that the reductions in consumption were due to recurring behavior change (e.g., taking shorter showers), rather than infrastructure changes (e.g., installing low flow showerheads). Infrastructure changes would be more likely to produce longer-term sustained changes over time, whereas habit and behaviors are more likely to fluctuate without repeated reinforcement.
With regard to practical application, it's tempting to send focused communications, like the water focus reports, just to high-consuming households. However, our results here suggest that there is value to sending the reports to all households. First, low consuming households showed a reduction in consumption, albeit at a lower level (5% reduction, compared with 13.5% reduction for high consuming households). Unlike prior studies that showed a potential for low-consuming households to increase consumption following social comparison feedback (Schultz et al., 2007), our inclusion of social approval prevented this boomerang effect from occurring. In addition, it's possible that sending social approval messages to low-consuming households can promote a conservation identity, whereby the residents see themselves as valuing conservation (Van der Werff et al., 2013, 2014). This identity can help produce long-term water conservation and efficiency behaviors, even in the absence of additional communications (Fritsche et al., 2018).
Limitations
While the research reported in this paper has several clear findings, it lacks a random assignment to condition. The comparison group was naturally occurring, rather than randomly assigned. To reflect this distinction, we have used the term “comparison group” throughout, rather than “control group.” The lack of random assignment reduces the strength of our causal claims and limits the internal validity of our design. In the case of water reports, the treatment and comparison groups were based on geographic region of the utility's service area, and while they are likely to differ in a number of demographic ways, the large number of homes from diverse regions helps to support our conclusion that water reports caused a reduction in consumption. In addition, our use of dwelling features as statistical controls in our statistical models reduces the probability that the results can be explained by pre-existing differences between the groups.
Conclusion
This paper reports a study of residential water customers who received customized home water reports sent by postal mail. Results showed that homes that received the reports reduced their consumption by 8.35% in the six months following the reports, relative to similar homes that did not receive the report.
Importantly, the work summarized in this paper highlights the critical need to engage customers. Smart meters by themselves do not produce changes in consumption patterns. Rather, it's the behavior of the residents that drives water demand, at it is behavior change that produces water conservation and efficiency. Smart meters can provide a valuable tool for motivating residents to change, but communications to customers need to go beyond information. In line with previous research in behavioral science, simply providing factual information or simple feedback about consumption is generally not motivational. But as we demonstrated, using a “similar homes” comparison was effective at motivating conservation, especially among high-consuming households. These results highlight the importance of understanding consumer behavior with regard to conservation, and the value of linking behavioral science with new technologies in ways that can maximize their impact.
Data Availability
The datasets generated for this study are available on request to the corresponding author.
Ethics Statement
The study was reviewed and determined to be exempt from IRB.
Author Contributions
All authors listed have made a substantial, direct and intellectual contribution to the work, and approved it for publication.
Conflict of Interest Statement
The work was conducted under contract with Badger Meter.
Acknowledgments
The work reported in this paper was supported by the team at Badger Meter, Inc., especially Senior Project Manager John Wolfson. We also acknowledge the important reviews and feedback provided by Arthur Ryman, Adjunct Professor at Ryerson University, Canada. Finally, we want to acknowledge the support of Sheri Adams, Program Manager at the City of Sacramento, and William Granger, Water Conservation Administrator at the City of Sacramento, Department of Utilities.
References
Allcott, H., and Rogers, T. (2014). The short-run and long-run effects of behavioral interventions: experimental evidence from energy conservation. Am. Econom. Rev. 104, 3003–3037. doi: 10.1257/aer.104.10.3003
Anda, M., Brennan, J., and Paskett, E. (2013). Combining smart metering infrastructure and behavioural change for residential water efficiency. Water 40, 66–72.
Boyle, T., Giurco, D., Mukheibir, P., Liu, A., Moy, C., White, S., et al. (2013). Intelligent metering for urban water: a review. Water 5, 1052–1081. doi: 10.3390/w5031052
Curran, P. J., Obeidat, K., and Losardo, D. (2010). Twelve frequently asked questions about growth curve modeling. J. Cogn. Dev. 11, 121–136. doi: 10.1080/15248371003699969
DeDominicis, S., Sokoloski, R., Jaeger, C., and Schultz, P. W. (2019). Making the smart meter social promotes long-term energy conservation. Palgrave Communicat. 51, 1–8. doi: 10.1057/s41599-019-0254-5
Ferraro, P., and Price, M. (2013). Using nonpecuniary strategies to influence behavior: evidence from a large-scale field experiment. Rev. Econ. Statist. 95, 64–73. doi: 10.1162/REST_a_00344
Ferraro, P. J., Miranda, J. J., and Price, M. K. (2011). The persistence of treatment effects with norm-based policy instruments: evidence from a randomized environmental policy experiment. Am. Econom. Rev. 101, 318–322. doi: 10.1257/aer.101.3.318
Fritsche, I., Barth, M., Jugert, P., Masson, T., and Reese, G. (2018). A social identity model of pro-environmental action (SIMPEA). Psychol. Rev. 125, 245–269. doi: 10.1037/rev0000090
Kluger, A. N., and DeNisi, A. (1996). The effects of feedback interventions on performance: a historical review, a meta-analysis, and a preliminary feedback intervention theory. Psychol. Bull. 119:254. doi: 10.1037/0033-2909.119.2.254
Lima, C. A. F., and Navas, J. R. P. (2012). Smart metering and systems to support a conscious use of water and electricity. Energy 45, 528–540. doi: 10.1016/j.energy.2012.02.033
Liu, A., Giurco, D., and Mukheibir, P. (2015). Motivating metrics for household water-use feedback. Resour. Conserv. Recycl. 103, 29–46. doi: 10.1016/j.resconrec.2015.05.008
Mitchell, D. L., Cubed, M., and Chesnutt, T. W. (2013). Evaluation of East Bay Municipal Utility District's Pilot of WaterSmart Home Water Reports. Report prepared for the California Water Foundation and East Bay Municipal Utility District, 1–78. Available online at: www.allianceforwaterefficiency.org/WorkArea/DownloadAsset.aspx?id=8745
Osbaldiston, R., and Schott, J. P. (2012). Environmental sustainability and behavioral science: meta-analysis of proenvironmental behavior experiments. Environ. Behav. 44, 257–299. doi: 10.1177/0013916511402673
Perlman, H. (2016). How Much Water is There on, in, and Above the Earth? Washington, DC: USGS Water Science School. U. S. Department of Interior.
Raudenbush, S. W., and Bryk, A. S. (2002). Hierarchical Linear Models: Applications and Data Analysis Methods. Thousand Oaks, CA: Sage Publications.
Reed, R., Godfrey, S., Kayaga, S., Reed, B., Rouse, J., Fisher, J., et al. (2013). Technical Notes on Drinking-Water, Sanitation and Hygiene in Emergencies. Geneva: WEDC, Loughborough University World Health Organisation.
Schultz, P. W. (1999). Changing behavior with normative feedback interventions: a field experiment on curbside recycling. Basic Appl. Soc. Psychol. 21, 25–36. doi: 10.1207/s15324834basp2101_3
Schultz, P. W., Estrada, M., Schmitt, J., Sokoloski, R., and Silva-Send, N. (2015). Using in-home displays to provide smart meter feedback about household electricity consumption: a randomized control trial comparing kilowatts, cost, and social norms. Energy 90, 351–358. doi: 10.1016/j.energy.2015.06.130
Schultz, P. W., Nolan, J., Cialdini, R., Goldstein, N., and Griskevicius, V. (2007). The constructive, destructive, and reconstructive power of social norms. Psychol. Sci. 18, 429–434. doi: 10.1111/j.1467-9280.2007.01917.x
Schultz, P. W., Nolan, J. M., Cialdini, R. B., Goldstein, N. J., and Griskevicius, V. (2018a). The constructive, destructive, and reconstructive power of social norms—Reprise. Perspect. Psychol. Sci. 13, 249–254 doi: 10.1177/1745691617693325
United Nations (2017). Water. Retrieved from: http://www.un.org/en/sections/issues-depth/water/ (accessed June 5, 2019).
Van der Werff, E., Steg, L., and Keizer, K. (2013). It is a more issue: The relationship between environmental identity, obligation-based intrinsic motivation, and pro-environmental behavior. Glob. Environ. Change 5, 1258–1265. doi: 10.1016/j.gloenvcha.2013.07.018
Van der Werff, E., Steg, L., and Keizer, K. (2014). Follow the signal: when past pro-environmental actions signal who you are. J. Environ. Psychol. 40, 273–282. doi: 10.1016/j.jenvp.2014.07.004
Keywords: conservation, efficiency, smart meters (SM), feedback, social norms' community influence
Citation: Schultz W, Javey S and Sorokina A (2019) Social Comparison as a Tool to Promote Residential Water Conservation. Front. Water 1:2. doi: 10.3389/frwa.2019.00002
Received: 16 February 2019; Accepted: 10 June 2019;
Published: 10 July 2019.
Edited by:
Ronita Bardhan, Indian Institute of Technology Bombay, IndiaReviewed by:
Sepideh Yazdekhasti, Xylem, United StatesChrista Brelsford, Oak Ridge National Laboratory (DOE), United States
Copyright © 2019 Schultz, Javey and Sorokina. This is an open-access article distributed under the terms of the Creative Commons Attribution License (CC BY). The use, distribution or reproduction in other forums is permitted, provided the original author(s) and the copyright owner(s) are credited and that the original publication in this journal is cited, in accordance with accepted academic practice. No use, distribution or reproduction is permitted which does not comply with these terms.
*Correspondence: Wesley Schultz, wschultz@csusm.edu