The Circular Economy Lifecycle Assessment and Visualization Framework: A Case Study of Wind Blade Circularity in Texas
 Rebecca Hanes
 Tapajyoti Ghosh
 Alicia Key
 Annika Eberle
- National Renewable Energy Laboratory, Golden, CO, United States
Moving the current linear economy toward circularity is expected to have environmental, economic, and social impacts. Various modeling methods, including economic input-output modeling, life cycle assessment, agent-based modeling, and system dynamics, have been used to examine circular supply chains and analyze their impacts. This work describes the newly developed Circular Economy Lifecycle Assessment and Visualization (CELAVI) framework, which is designed to model how the impacts of supply chains might change as circularity increases. We first establish the framework with a discussion of modeling capabilities that are needed to capture circularity transitions; these capabilities are based on the fact that supply chains moving toward circularity are dynamic and therefore not at steady state, may encompass multiple industrial sectors or other interdependent supply chains and occupy a large spatial area. To demonstrate the capabilities of CELAVI, we present a case study on end-of-life wind turbine blades in the U.S. state of Texas. Our findings show that depending on exact process costs and transportation distances, mechanical recycling could lead to 69% or more of end-of-life turbine blade mass being kept in circulation rather than being landfilled, with only a 7.1% increase in global warming potential over the linear supply chain. We discuss next steps for framework development.
Introduction
Interest in transitioning from our current linear economy to a circular economy (McDowall et al., 2017; Winans et al., 2017) has created the need for modeling, analysis, and decision support tools that can inform this transition. Making decisions about whether and how to keep products and materials in circulation requires an understanding of current and future demand, the state of technologies that enable circularity, and economic and environmental impacts, among many other factors (Moraga et al., 2019). A transition toward circularity, or circularity transition may lead to positive economic and environmental changes (Ellen MacArthur Foundation, 2013) but is not guaranteed to do so (Cheng et al., 2019). Moreover, positive changes that do result are unlikely to be distributed equally across economic sectors and geographic regions (Wiebe et al., 2019; Aguilar-Hernandez et al., 2021). Circularity decisions can be informed by modeling and analysis that assess the impacts of increasing circularity and project these impacts across regions and into the future. Anticipating and accounting for potential negative impacts—environmental, economic, social, and others—in the decision-making processes that drive circularity transitions will decrease the likelihood of unintended consequences and provide a more complete picture of circularity transition impacts (Corona et al., 2019; Helander et al., 2019). We posit that a circularity transition represents a fundamental, systemic, dynamic shift in supply chain and economic structure, and that adequately modeling and assessing the impacts of a circularity transition in order to inform related decisions therefore requires capabilities beyond what any single previously developed method offers (Walzberg et al., 2021).
A wide variety of modeling methodologies have to date been applied to circular economy studies. Figure 1 compares the capabilities of modeling methods that have previously been applied to the circular economy (blue ovals) to the modeling framework developed in the current work (orange rectangles) and to the expected demands of circularity transition modeling (crosshatched areas).
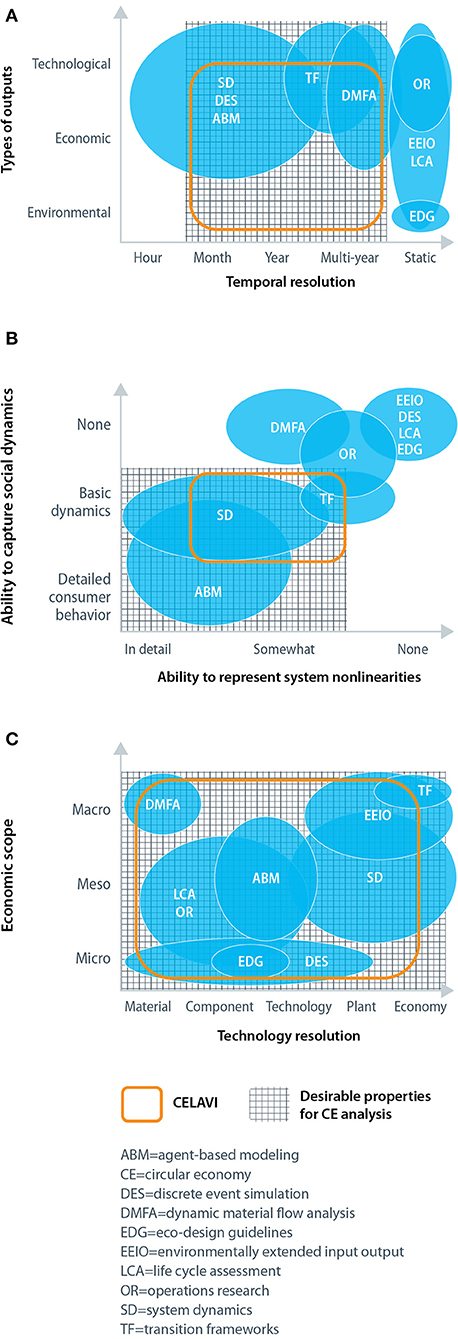
Figure 1. Summary of the scope (A,C) and capability (B) requirements for modeling circular economy transitions, building on an analysis of circularity methods in Walzberg et al. (2021). Capabilities of existing modeling methods are shown in blue ovals, while CELAVI capabilities are indicated with orange rectangles.
Assessment-oriented methods such as attributional life cycle assessment (LCA) have been used to evaluate the environmental impacts of a circular system and compare the impacts to those of an analogous linear system (Chen and Huang, 2019; Donati et al., 2020; Peña et al., 2021). Within the structure of a standard LCA, circularity transitions cannot be modeled endogenously: the system being assessed must either already have some degree of circularity, or the various technological and economic shifts involved in the circularity transition must be specified a priori. Attributional LCA must be integrated with a dynamic model, such as an agent-based model (ABM) (Micolier et al., 2019), to avoid analyzing a pre-determined circular system.
Consequential LCA, in contrast, is a method for capturing how environmental impacts change as a result of economic shifts in the life cycle (Earles and Halog, 2011). Consequential LCA models that rely on computable general equilibrium (CGE) models (Yang and Heijungs, 2018) are able to capture systemic changes in a life cycle, but are limited by a fundamental assumption of CGE models: namely, that the economy always returns to a steady-state equilibrium. A circularity transition may eventually lead to a new steady state for an economy; however, assuming that this new steady state can be reached within the time period modeled may exclude longer-term shifts and resulting impacts.
A second limitation of CGE models, used within consequential LCA or as standalone models, is that they generally represent on the order of dozens of economic sectors. This allows for extremely large-scale economic systems—multi-national or global—to be captured, but with highly aggregated representations of individual economic sectors (Scrieciu, 2007; Winning et al., 2017; Cao et al., 2019). Circularity transitions will require shifts in industrial technologies both within and between economic sectors, which in turn requires finely resolved technology models. The level of aggregation of CGE models thus limits their utility for analyzing systems during a circularity transition. Partial equilibrium (PE) models, which capture a sub-set of economic sectors in greater detail than CGE models, offer less aggregation than CGE along with a much smaller scope (Zink et al., 2016), which risks excluding externalities that are generated outside the sectors within the PE model.
Attributional LCA, consequential LCA, CGE, and PE models all offer static or limited dynamic system representations and assume steady-state or a return to steady-state following an exogenous shock. Dynamic, non-steady-state models such as system dynamics (SD) models and dynamic material flow analysis (MFA) models avoid these pitfalls but come with a limited scope that does not capture system-wide externalities. Dynamic MFA models can capture circular material flow systems in great detail for a small number of materials (Pivnenko et al., 2016), but generally do not extend to the quantification of environmental and other externalities. SD models are not restricted to material flow modeling but similarly do not extend to externality quantification (Alamerew and Brissaud, 2020; Gao et al., 2020).
In this work, we develop the Circular Economy Lifecycle Assessment and Visualization (CELAVI) framework for assessing how externalities are impacted as supply chains transition from linearity toward circularity, and for supporting stakeholder decisions around circularity transitions. To meet the demands of modeling circularity transitions, CELAVI hybridizes a discrete event simulation (DES) and life cycle assessment (LCA) model into a dynamic and flexible multiscale framework. The framework's initial focus is on renewable energy power systems and materials, but the intent is to develop a flexible and modular approach that can be used in other applications as well. CELAVI represents the technological and economic changes involved in a linear-to-circular transition along with the associated societal and environmental externalities. It captures supply chains using detailed, dynamic models of production, use, and circular pathways that are linked to background life cycle processes, which may be dynamic or static. Learning-by-doing effects are incorporated into the framework to model changes in technology costs over time. CELAVI results could inform questions such as what level of circularity could be reached with investment in new circularity technologies? How much technological learning needs to occur before circularity technologies reach cost parity with linear technologies? How does increasing circularity change the environmental impacts of renewable energy technologies? Our intended audience for CELAVI includes governing bodies, corporations, and non-governmental organizations at multiple levels that are working toward a circular economy.
In the remainder of this work, we first list and justify a set of requirements for modeling circularity transitions and the associated externalities. We present the CELAVI framework and discuss how it meets the requirements for modeling circularity transitions. We present a case study that applies the CELAVI framework to the wind turbine blade supply chain in the U.S. state of Texas. We explore how this supply chain might transition toward circularity and how the supply chain's environmental externalities change as a result of the transition. We conclude by discussing findings from the case study, limitations of the current analysis, and next steps for CELAVI development.
Materials and Methods
Circularity Transition Modeling Requirements
In Table 1, established modeling methods that have been applied to circular economy modeling are summarized and compared to a set of circularity transition modeling requirements, which are further elaborated in this section. Figure 2 illustrates a set of supply chain steps, processing technologies, and practices that could be involved in a renewable energy technology supply chain undergoing a circularity transition. Around the outside of the main circle are the steps involved in a linear supply chain, and the arrows in the center of the circle indicate how circularity technologies and practices can keep technologies and materials in use, thereby reducing materials lost as waste. A circularity transition model must be able to represent linear supply chains as well as supply chains with varying degrees and types of circularity (i.e., open-loop or closed-loop), and must capture the implementation of circularity technologies and practices over time.
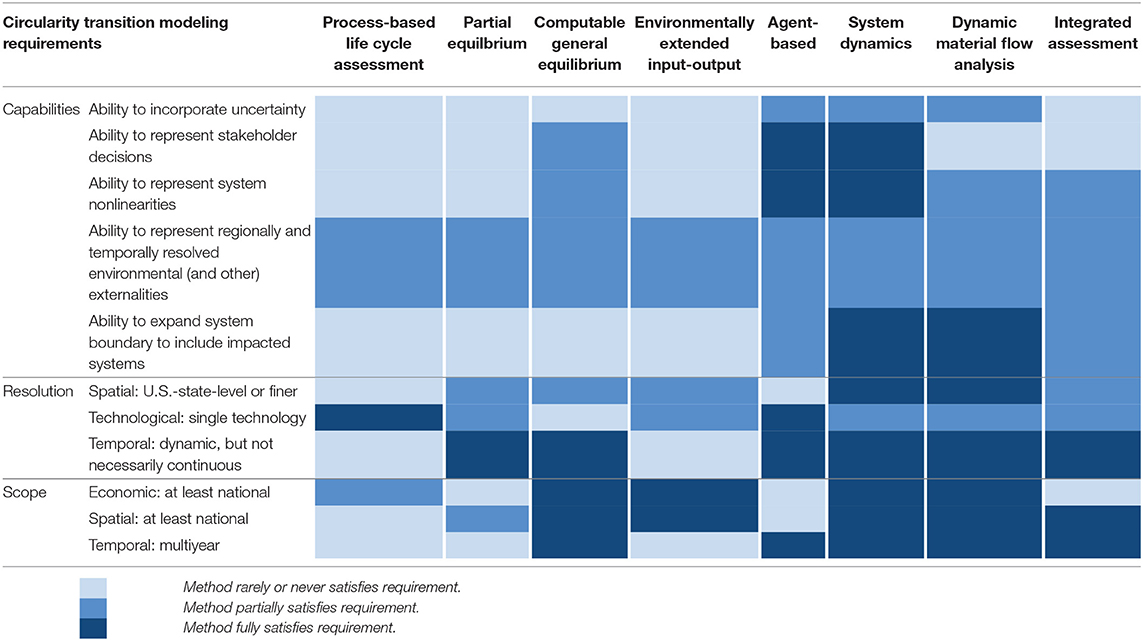
Table 1. Gap analysis of methods previously applied to circular economy modeling.
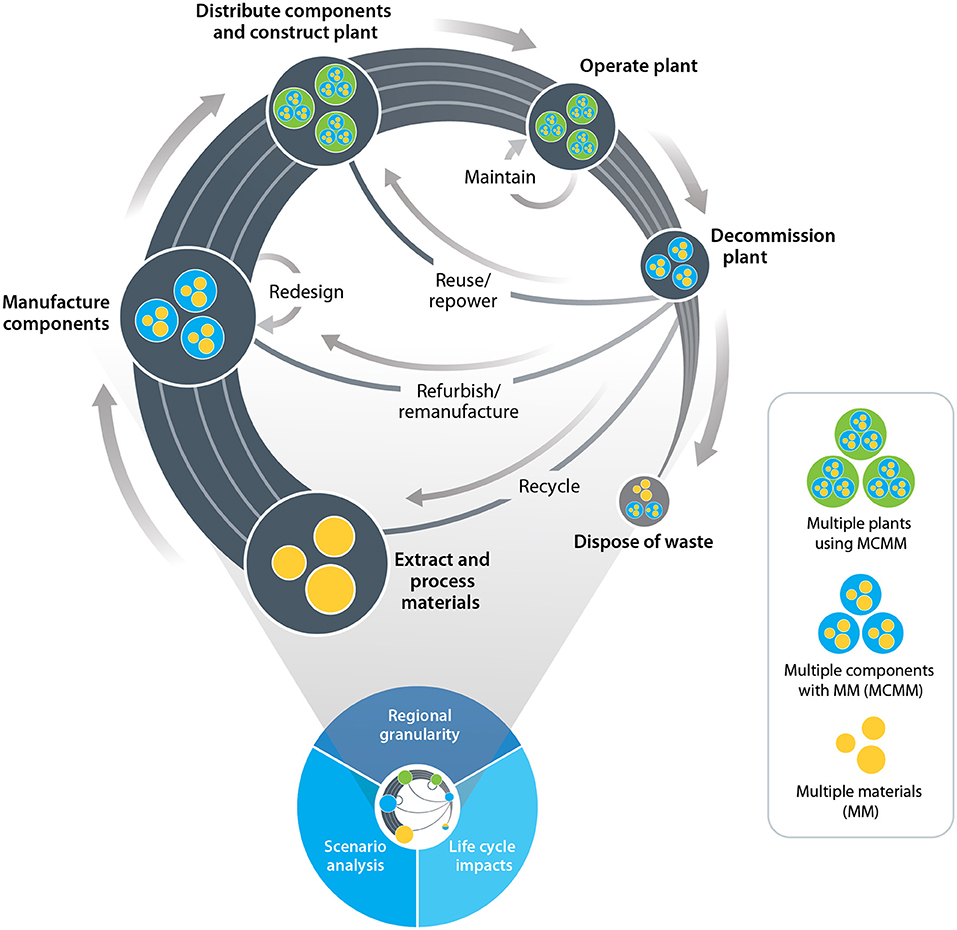
Figure 2. Circular supply chains such as the renewable energy power plant supply chain shown here involve both linear supply chain stages (around the outside of the gray circle) and additional circularity-enabling stages (arrows inside the gray circle). Modeling a circularity transition requires being able to capture fundamental changes in supply chain structure, processing costs, environmental externalities, and other characteristics over time.
Ability to Incorporate Uncertainty
Uncertainty is an inherent part of modeling circularity transitions, which necessarily requires projecting data, information, and models forward in time from the present. Circularity transition models must be able to incorporate probability distributions and different forms of uncertainty information on model parameters and assumptions, and on physical, economic, and environmental input data (McCarthy et al., 2018).
Ability to Represent Stakeholder Decisions
Circularity transitions will occur as a result of decisions made by interested stakeholders, including the owners and operators of recycling facilities; corporations seeking to manage their waste streams; government agencies at the local, state, and federal levels; and others. Modeling a circularity transition thus requires modeling the decision-making processes of these stakeholders, including the criteria used to make decisions, and linking the results of stakeholder decisions to changes in supply chain structure (Woltjer, 2018).
Ability to Represent System Nonlinearities
A circularity transition will require modeling process costs, detailed production functions (relationships between process inputs and outputs) for the technologies involved, production capacity expansion, and other inherently nonlinear supply chain aspects. Linear models such as economic input-output and process-based life cycle assessment are widely used to model steady-state systems with linear relationships between system inputs and outputs, but must be integrated with other model types to include system nonlinearities. Life cycle and economic input-output models have been integrated with more flexible models such as discrete event simulations (DES) (Charnley et al., 2019), agent-based modeling (ABM) (Tesfatsion Leigh, 2006; Wu et al., 2017), and system dynamics (SD) (Gao et al., 2020) to bring together nonlinear capabilities and the broader life cycle scope.
Ability to Represent Environmental and Other Externalities
Part of the motivation for developing a circular economy is to realize environmental, social, economic, and other benefits. A circularity transition modeling framework should be able to quantify such externalities at the largest scale and finest resolution relevant to stakeholders. This requirement depends on incorporating spatial and temporal resolution into the model as well as keeping the model scope sufficiently broad to capture externalities at the life cycle or economy scale. By quantifying these externalities and how they depend on time and on region, insight can be gained into how the benefits or disbenefits of circularity are distributed, and whether the benefits are comparable to or outweigh the disbenefits. A single model is unlikely to be able to capture both the fine resolution and broad scope required (Palatnik and Roson, 2012), which indicates that either a multi-scale or a hybridized (i.e., hard-linked or soft-linked) modeling approach may be required.
Ability to Expand in Scope
Though our discussion in this section focuses on modeling circularity transitions within one supply chain, ideally a circularity transition modeling framework would be scalable to multiple interdependent supply chains across several industrial sectors. Limiting the framework to a single supply chain would make it difficult to assess situations where a product or its components can be recycled, reused, or remanufactured outside the originating supply chain or industrial sector—for instance, automotive aluminum that is used in household furniture. We expect intersectoral exchanges of secondary materials to be part of a functioning circular economy, and thus the modeling framework should be able to scale to capture multiple supply chains and their material exchanges.
Spatial Resolution: U.S.-State-Level or Better
Supply chain circularity transitions are likely to have geographically wide-ranging yet unequally distributed effects. Industries involved in end-of-life (EOL) material collection, processing, and transportation will see an increase in activity, and the extraction and raw (virgin) material processing industries will see a decrease (Wiebe et al., 2019). Such shifts in activities will occur not only between industrial sectors, but also between geographic regions: areas with high concentrations of extractive industries will see decreased activity, and as EOL industries expand production capacity, activity will be added to regions where those industries choose to establish facilities. Capturing these activities at a spatial resolution equivalent to a U.S. state or a finer will allow insight into when these activity shifts are occurring and the impacts of such shifts.
Technological Resolution: Single Technology
A circular supply chain is likely to require a greater variety of processing technologies than the analogous linear supply chain. New (relative to the linear supply chain) technologies will be required for keeping EOL materials and products in use and for processing EOL materials into new products. A circularity transition model should therefore be able to represent individual processing technologies, the associated costs, and any changes in these technologies and costs that occur over time or in response to other factors in the supply chain. This enables stakeholders to compare circularity-enabling technologies and decide how, when, and to what extent to implement these technologies.
Temporal Resolution: Dynamic
A circularity transition can only take place over a period of time, possibly many years. During that time, stakeholders within the transitioning supply chain or system will evaluate and re-evaluate their decisions, and adjust future decisions based on observed outcomes. Modeling a circularity transition thus requires a dynamic model of the system, its characteristics (such as relative costs), and its externalities, in which decisions about circularity are modeled endogenously based on the system's characteristics and externalities rather than defined a priori. Creating “snapshots” of a linear supply chain and a hypothetical circular supply chain and comparing them is insufficient, because such a comparison provides insight into neither the decisions that must be made while circularity is developing nor the various paths a supply chain may take (e.g., implementing different EOL technologies, involving different sectors in circularity, or making different product design choices).
Though a circularity transition modeling framework should be dynamic, it need not be continuous. Methods such as SD, ABM, and discrete event simulation (DES) capture complex dynamic processes using sets of equations that are solved at discrete time steps rather than continuous functions. The temporal resolution of a dynamic, discretized model can also be set to reflect the speed at which decisions are made and systems evolve. For instance, decisions about circularity within an organization may be made on a semiannual or annual basis, which would slow a circularity transition more than a continuous model in which circularity decisions happen constantly.
Economic Scope: At Least National and Spatial Scope: At Least National
Most linear supply chains are regional, national, or global in scope, and high-volume supply chains can have wide-ranging economic impacts. Circular supply chains will by necessity involve increased connections between industries and potentially entirely new industries, thus it is likely that a transition toward circularity will increase rather than decrease the economic and spatial scope of a supply chain. A circularity transition model should be at least national in scope: a smaller scope risks excluding critical economic, environmental, and other aspects of the supply chain. While a larger (global, for instance) scope may be desirable, the ability to capture broader supply chain impacts must be balanced with data quality and aggregation issues, which may become more common as the model scope expands to be multinational or global.
Temporal Scope: Multiyear
Transitioning an established linear supply chain to circularity is likely to require developing and deploying new technologies, developing new sources of raw materials, and finding uses and markets for EOL materials. These transitions will take multiple years to decades to take effect, and a circularity transition model should therefore be not only be dynamic but also have a sufficiently large temporal scope to capture the time scale of circularity transitions.
Circular Economy Lifecycle Assessment and Visualization (CELAVI) Framework
To meet the demands of modeling circularity transitions and the resulting environmental externalities, the CELAVI framework currently consists of a discrete event simulation (DES) soft-linked with a life cycle assessment (LCA) model, both of which are implemented in the Python programming language. Figure 3 is a diagram of the CELAVI framework, showing the input datasets and in which part of the model they are used, the information flow from the DES to the LCA model, and the different types of outputs from the framework.
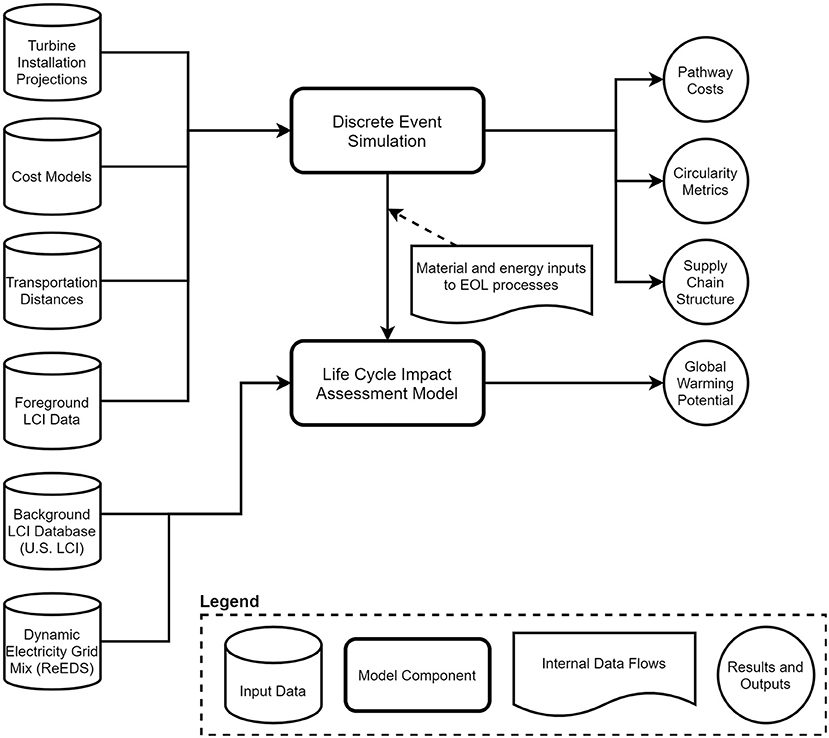
Figure 3. The CELAVI framework integrates a discrete event simulation with a life cycle assessment model to model supply chain structures as they transition toward circularity, end-of-life pathway costs, circularity metrics, and environmental externalities such as global warming potential.
Inputs to the Discrete Event Simulation
Technology installation projections quantify the required production and installation levels of renewable energy technologies over time. For the case study presented in this work, the technology installation projections quantify the number and average capacity of new wind turbines expected to be installed annually in the U.S. state of Texas for the years 2000–2050. The installation projections also include information on average turbine blade mass and foundation mass, to allow for the quantification of the materials used in these technology components.
Cost models quantify processing, transportation, maintenance, and other costs as they change with time and with other factors. Examples include landfill tipping fees, recycling costs, and shipping costs. CELAVI can incorporate cost models in a variety of forms to allow for costs that change with factors other than time, such as cumulative production for industrial learning-by-doing.
Transportation distances between supply chain locations are used to calculate costs and environmental impacts associated with material transportation.
Foreground LCI data consists of the material and energy inputs required by each process in the supply chain model per material unit (such as per metric ton or per technology component) processed. This data is combined with material flows modeled by the DES to calculate total inputs required by the supply chain over time, which is then used in the LCA model to calculate supply chain environmental impacts.
Discrete Event Simulation
The DES uses the Python package SimPy 4.0.1 (Lunsdorf and Scherfke, 2020) to construct a dynamic supply chain model at the level of individual technology components (wind turbine blades and foundations, in the case study). Events in the DES consist of transitions that move components between states, such as “in use,” “recycled,” and “landfilled.” These transition events occur independently for each technology component as the components enter the use phase, reach the end of their lifetime, and are subsequently processed through EOL steps. The time at which components enter the use phase is determined by the technology installation projection input data, which quantifies the number of new technology components required at each timestep of the DES. Component lifetimes as modeled in the DES may be fixed and deterministic, such that every component spends the same amount of time “in use,” or may incorporate uncertainty in the lifetimes using a Weibull probability distribution, which is commonly used to represent the time-to-failure of products (see Pham and Lai, 2007 for a brief overview of the Weibull distribution and its use in modeling time-to-failure). The Weibull distribution parameters must be calibrated according to historical component lifetime data or, for technologies that have not been widely deployed, according to the best estimates of subject matter experts.
When a component reaches the end of its lifetime, an EOL pathway choice model within the DES is used to determine which of several possible transitions will occur for that component. The pathway choice model calculates total pathway costs and selects the lowest-cost pathway to be implemented for the component in question. Cost is used as the decision criterion because it is one of the key barriers to implementing circularity technologies in practice, along with risk aversion within industry and a lack of policy support (Ritzén and Sandström, 2017; Kirchherr et al., 2018). At least in the early stages of circularity transitions, stakeholders are more likely to implement low-cost circularity technologies than higher cost (and therefore riskier) technologies. Future CELAVI development will enhance the pathway choice model with additional criteria, particularly pathway environmental impacts, which is discussed further in the Next Steps section.
Depending on the pathway selected, the component may transition out of the supply chain by being landfilled or otherwise disposed of, or it may transition to an EOL processing stage that converts the component into material with one or more subsequent uses. As the component and its materials transition through EOL processing stages, it can either return to the in use stage or exit the supply chain, which is interpreted as the material entering the use phase in another supply chain outside the scope of the model.
Component inventories within each supply chain stage are tracked over time within the DES to determine which, if any, circular pathways are implemented within the supply chain. These component inventories at each supply chain stage are then used to scale life cycle inventory (LCI) data and calculate material and energy inputs required by each process involved in the supply chain. This information is then passed to the LCA model, as discussed in the next section. The component inventories are also used to calculate circularity metrics that quantify the degree of circularity within the supply chain as it changes over time.
Life Cycle Assessment
Data passed from the DES model component to the LCA model consists of material and energy requirements at each DES timestep and for each active supply chain stage, including virgin material extraction, all EOL and circularity-enabling processes, final waste disposal, and transportation. This data forms a dynamic foreground LCI, which is combined with the publicly-available U.S. Life Cycle Inventory (U.S. LCI) database (US Life Cycle Inventory Database, 2012) of background processes to capture the full cradle-to-grave system associated with the supply chain under study.
We incorporated a dynamic electricity grid mix into the background LCI, rather than using the static grid mixes that are packaged with the U.S. LCI, to ensure that environmental externalities from electricity use reflect the changing U.S. electricity grid as we model supply chains forward in time. We obtained grid mix projections from the Regional Energy Deployment System (ReEDS) model, which chooses the lowest-cost grid mixes to meet national electricity demand under a variety of scenarios (Brown et al., 2020). Specifically, the grid mix used in CELAVI's LCA model follow the mid-case standard scenario of the ReEDS model (Cole et al., 2019), which uses moderate assumptions about the speed of renewable electricity deployment and the retirement of fossil generation capacity.
The U.S. LCI contains data for several hundred environmental pollutants. Environmental externalities are calculated from pollutant quantities using the Tool for the Reduction and Assessment of Chemical and Other Environmental Impacts (TRACI) 2.1 methodology (Ryberg et al., 2014). The TRACI methodology includes a variety of midpoint indicators such as global warming potential (GWP), criteria air pollutants, and fossil fuel depletion.
Outputs
The supply chain structure modeled by the DES is quantified with mass flows over time between the various supply chain stages. From these mass flows, which include material sent to landfill and virgin material that enters the supply chain, a variety of circularity metrics can be calculated. The metrics currently implemented are percent outflow circularity and percent inflow circularity (Circular Transition Indicators V1.0 - Metrics for Business, 2020). A wide variety of additional circularity metrics have been developed in the literature (Saidani et al., 2019) and could be implemented in a post-processing stage, if additional circularity metrics are of interest for a particular case study.
CELAVI outputs also include EOL pathway costs, disaggregated by individual supply chain stage (such as transportation, recycling, or other processing steps). The costs are calculated and used within the pathway choice model in the DES and provide insight into the drivers behind a supply chain transitioning toward circularity or remaining linear.
Finally, the LCA model returns the TRACI 2.1 set of midpoint environmental impact indicators. The indicators are disaggregated by DES timestep and are attributed to individual processes within the supply chain.
Case Study Scope, Data, and Key Assumptions
We demonstrate the capabilities of CELAVI with a case study of strategies to increase the circularity of materials used in the wind turbine blade and foundation supply chain. Existing strategies for increasing circularity in this supply chain include repowering, component lifetime extension through enhanced repair and maintenance, novel production technologies that lower barriers to keeping materials in use at EOL, material substitution, and EOL technologies that process turbine components into materials suitable for reuse, among others. In this case study we focus on EOL technologies and the associated options for keeping materials in circulation. Lifetime extension, novel production technologies, and material substitutions are additional strategies that will be considered in future case studies.
Technologies for processing EOL turbine blades into market-ready materials and products exist, but most such technologies remain in lab-scale or pilot-scale development and very few have been commercialized in the United States (Correia et al., 2011; Schmid et al., 2020). The current lack of commercial-scale EOL options has led to turbine blades being landfilled, incinerated (Ramirez-Tejeda et al., 2017), reused in structural applications (Bank et al., 2018; Gentry et al., 2020), and occasionally stored intact at wind power plants (Martin, 2020). Increasing material circularity in the wind turbine blade supply chain thus requires identifying technologically, economically, and environmentally viable EOL technologies that can convert wind turbine blades into materials or products that remain in use, either within the wind turbine supply chain or other supply chains. For this case study, we model the net costs of blade EOL pathways and assume the lowest net cost pathway will be the one implemented.
As of 2020, commercial recycling technologies exist for approximately 85% by mass of the materials used in wind turbines in the United States. Blade materials, particularly the glass and carbon fiber reinforced polymers that form the bulk of blade materials, are the exception (Razdan and Garrett, 2019; Vestas - Sustainability Report, 2019). Many of the wind turbine blades in use as of 2020 are made from glass fiber reinforced polymer (GFRP), whereas newer and future turbine blades are more likely to be made from carbon fiber reinforced polymer (Hao et al., 2020; Wood, 2020) or from thermoplastic composite (Murray et al., 2019, 2021). For this analysis, we focus on GFRP because it is the more widely used polymer in most current wind turbines and will therefore be the material of greatest interest for wind turbines that are retired over the next 30 years. Beyond that time frame, carbon fiber reinforced polymer and thermoplastic composites may become more prominent, but we do not examine these novel blades in detail in this case study.
Recycling technologies for GFRP exist, but most of them remain at the prepilot stage and are far from commercialization (Ierides and Reiland, 2019; Karuppannan Gopalraj and Kärki, 2020). Some reuse and remanufacturing applications exist outside the turbine supply chain, but such options are likewise in a nascent state and are insufficiently widespread to absorb a significant number of EOL blades (Gignac, 2020). In this case study, we examine how wind turbine blade materials can be kept in use following EOL with two circularity options for GFRP that exist at the commercial scale in the U.S.: mechanical recycling and cement co-processing (Coughlin et al., 2020; Gheorghiu, 2020).
Mechanical recycling and cement co-processing are synergistic in that to use GFRP recyclate in cement co-processing, the material must first go through the coarse grinding phase of the mechanical recycling process. GFRP recyclate, the product of the combined coarse and fine grinding processes of mechanical recycling, can also be sold commercially as a raw material (Coughlin et al., 2020). Because of changes in the glass fiber structural properties that occur during mechanical recycling, the recyclate cannot be used either to manufacture new turbine blades or in other applications that have strict requirements on material properties (Pickering, 2006). The EOL options for turbine blades we include in this analysis are therefore “downcycling” options, in which material is kept in circulation but material value is not maintained (Ellen MacArthur Foundation, 2013). Though maintaining or increasing material value would be preferable to downcycling (European Commission, 2015), at this time no EOL processing options exist that could maintain the value of the GFRP in wind turbine blades.
In cement co-processing, coarse-ground turbine blade material is used to replace a portion of the sand and gravel input and solid fuel (coal) used to produce clinker, which is a key component in cement (Coughlin et al., 2020). Cement co-processing has been implemented at a commercial scale in Europe (Nagle et al., 2020) and, in 2020, General Electric and Veolia announced a cement co-processing blade recycling program in the United States (Gheorghiu, 2020). It requires minimal to no adjustments to existing cement kiln technology, and has a significant capacity for absorbing blade materials (Coughlin et al., 2020) because of the consistently high demand for cement in the United States (Hatfield and Williams, 2020). Though this option converts the high-value GFRP material to a much lower value material, it also has a lower processing cost relative to other recycling technologies (Schmid et al., 2020).
To estimate how increased blade circularity affects the wind turbine supply chain and its associated environmental impacts, we assume cement produced from co-processing with blade recyclate is used to build new turbine foundations, thus displacing virgin clinker used in the turbine supply chain. On decommissioning, the lower portion of turbine foundations is left in place and the removed material is landfilled; because this is the only modeled option for foundations at EOL, we exclude EOL processing for turbine foundations from the scope of this case study. Due to a lack of information around downstream processing steps required to convert finely ground GFRP recyclate into a product for which displacement can be calculated, the downstream use of recyclate is also excluded from the scope. The overall supply chain considered in this analysis is shown in Figure 4, and the scope is summarized in Table 2.
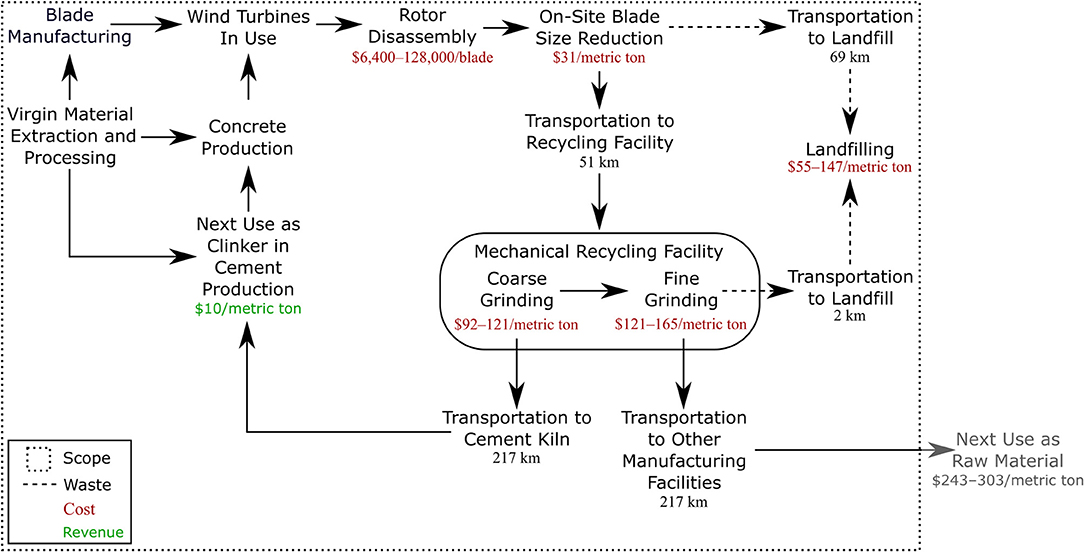
Figure 4. We consider a supply chain consisting of GFRP wind turbine blades and turbine foundations. EOL turbine blades may be either landfilled or mechanically recycled to clinker used in cement production or to a raw material sold outside the wind turbine supply chain.
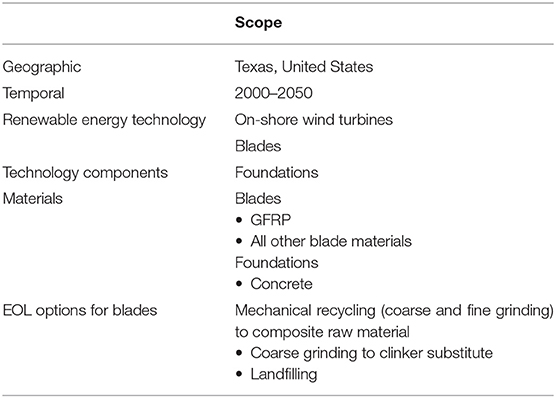
Table 2. Summary of case study scope.
We focus the geographic scope of this analysis on the U.S. state of Texas. In 2019, installations in Texas comprised 28% of total on-shore wind capacity installed in the United States (Wind Powers America Third Quarter 2020 Market Report: Public Version, 2020). Also, Texas is the site of one of two operating GFRP mechanical recycling plants in the United States. Located in Sweetwater, Texas, and owned by Global Fiberglass Solutions (Englund, 2020), this plant began operating in 2019 and can process 6,000–7,000 wind turbine blades annually (Gignac, 2020). Texas was also, in 2017, one of the top cement-producing and cement-consuming states in the United States, and it had more cement plants and cement production capacity than any other U.S. state (Curry et al., 2020). Texas therefore has a large source of EOL wind turbine blades, substantial and continuing demand for new turbines and turbine components, and the means to deal with EOL blades other than by landfilling.
For this case study, we examine wind turbines installed from 2000 to 2050 using historical wind turbine installation data for 2000–2019 available from U.S. Wind Turbine Database (Hoen et al., 2018), and wind turbine capacity expansion projections in Texas for 2020–2050 developed for the 2019 Standard Scenarios analysis of possible futures of the U.S. electricity sector (Cole et al., 2019). Capacity expansion projections are used to estimate the number of new turbines installed each year using average turbine capacities in Texas for 2013–2020 (Hoen et al., 2018), projected linearly out to 2050. For comparison, our projected capacity for a 2030 turbine is 4.75 MW, which falls between NREL's 2020 Annual Technology Baseline 2030 land-based wind turbine capacities for its conservative (4.0 MW) and moderate (5.5 MW) scenarios (2020 Annual Technology Baseline, 2020).
The materials included in this analysis are the:
1. GFRP and other materials used in wind turbine blades
2. Concrete and its component materials used in wind turbine foundations.
Because mechanical recycling can process whole blades, separation of the different blade materials is unnecessary in this case study.
Blade lifetime is modeled using random draws from the following Weibull distribution:
In Equation (1), the scale parameter λ is equal to 10 years, the shape parameter c is equal to 2.2, and the location parameter lmin is equal to 10 years (Cooperman et al., 2021). Wind turbine blades enter EOL processing at a time determined by the beginning of their use phase, which is defined in the capacity expansion input data, and by the Weibull-distributed lifetime values.
EOL processing for wind turbine blades begins with rotor teardown, the costs for which are estimated following (Eberle et al., 2019). The cost of removing a single blade is assumed to be one-third the cost of rotor teardown, and this cost is calculated on a per-metric-ton basis using blade mass, which increases over time as blade designs evolve (Cooperman et al., 2021). Following rotor teardown, blades undergo one of two options for size reduction before being transported: blades can be either cut into segments of 30 m or coarsely ground using a mobile version of the same grinding equipment used at the GFRP recycling plant (Cooperman et al., 2021). Segmenting the blades is less expensive ($28/metric ton) but incurs higher transportation costs ($0.30–0.80/metric ton-km, depending on blade segment mass). Coarse grinding on-site is more expensive ($92–121/metric ton) but lowers the transportation cost significantly ($0.08/metric ton-km; Coughlin et al., 2020; Cooperman et al., 2021). Because we assume turbine foundations are kept in place at EOL rather than being removed and replaced, we do not consider EOL options for turbine foundations.
To simplify the regional factors in our case study, we assume one representative location per scenario for all wind power plants, where wind turbine blades reach EOL, and we calculate average distances from these locations as shown in Table 3. The representative wind plant location for the moderate or default distance case is calculated as the average latitude and longitude of all wind turbines installed in Texas as of spring 2020. This results in an average transportation distance for EOL blades in Texas. The GFRP recycling facility is located in Sweetwater, Texas (Fiberglass Recycling Global Fiberglass Solutions, 2020), which is ~51 km from the representative wind power plant location and ~2 km from the municipal landfill in Sweetwater, where any recyclate losses are assumed to be taken. Turbine blades being landfilled are assumed to be taken to one of the three closest landfills to the wind power plant location; one of these landfills is the same Sweetwater landfill where recyclate losses are taken. The transportation distance from the wind power plant to the landfill is calculated as the average distance to these three closest landfills, which is 69 km. The GFRP recyclate sent for cement co-processing is assumed to be taken to the closest cement facility to the recycling facility, which is the Grupo Cementos de Chihuahua cement plant in Odessa, Texas, which is 217 km from the recycling facility and 204 km from the wind power plant location (Portland Cement Association, 2015). The facility locations and default distances used in the analysis are given in Table 3; default distances are also shown in Figure 4.

Table 3. Summary of facility locations and distances used in this analysis.
To explore the impacts of transportation costs on EOL pathway choice, we selected two additional representative wind power plant locations: one that corresponds to the installed wind turbine nearest the GFRP recycling plant in Sweetwater which results in a minimum transportation distance estimate, and one that corresponds to the furthest wind turbine from Sweetwater but within Texas, which results in a maximum transportation distance estimate. The distances from these additional wind power plant locations to the recycling plant and cement plant are given in Table 4. Because landfills are well-distributed across Texas (Texas Commission on Environmental Quality, 2019), the same landfill transportation distance is used throughout the analysis. No additional locations are explored for either the recycling plant or the cement plant.
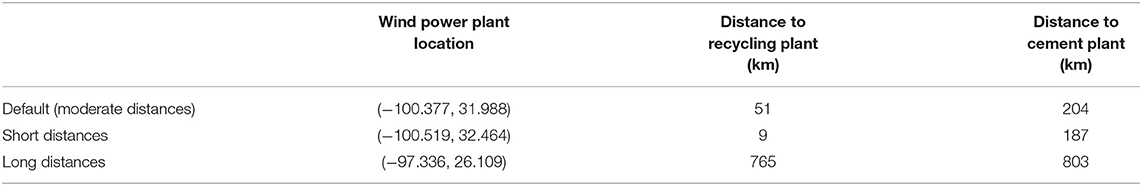
Table 4. Default, short, and long transportation distances used to explore the impacts of transportation costs on EOL pathway choices.
Once the blade material leaves the wind power plant, it travels either to the cement plant for coprocessing or to the recycling facility to be ground into raw material. Costs per metric ton for coarse grinding (the same coarse grinding cost is used for facility grinding and for on-site grinding), fine grinding, and revenue from raw material are obtained from Coughlin et al. (2020). Blade material sold from clinker is assumed to sell for the same price as the material it would displace (Cotrell et al., 2014). Because the uncertainty in these values is relatively high, we explore sensitivity of the supply chain circularity transition to three scenarios of technology cost assumptions: high costs and low revenues (High Costs, or HC), moderate costs and revenues (Moderate Costs, or MC), and low costs and high revenues (Low Costs, or LC). Within these scenarios, high costs and revenues refer to the maximum of the ranges given in Coughlin et al. (2020), moderate costs and revenues refer to the midpoint of the ranges, and low costs and revenues refer to the minimum of the ranges. The two grinding costs are then adjusted further to account for industrial learning, as discussed below. The process costs at the start of the model run, before industrial learning begins, and revenues (which do not change with industrial learning) are listed in Table 5.
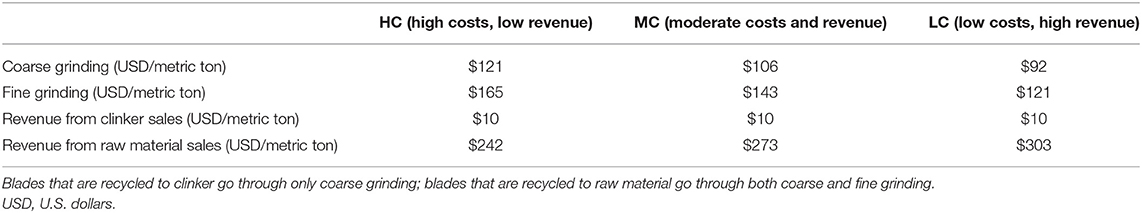
Table 5. Grinding costs and recycling revenues, rounded to the nearest dollar per metric ton, under three technology cost scenarios (Coughlin et al., 2020).
Grinding costs are reduced over time based on the cumulative blade mass processed using an industrial learning model (Klenow, 1998). Previous studies looking at cost reductions over time through industrial learning have found learning rates of ~20% (Anzanello and Fogliatto, 2011), although the exact rate varies significantly by industry (Tsuchiya and Kobayashi, 2004; Weber and Snowden-Swan, 2019). Because no technology-specific information on past costs is available, we choose a conservative 5% learning rate, which corresponds to a decrease in processing costs of 5% every time cumulative production (in this case, the cumulative blade mass processed) doubles. The newness of the GFRP mechanical recycling technology means cumulative production doubling happens very quickly once blade recycling begins, potentially leading to substantial cost decreases even with a conservative learning rate assumption. Industrial learning cost reductions are seen for both the recycling to clinker and recycling to raw material pathways when either is implemented, because of the coarse grinding process that is used in both pathways.
Blades that are not recycled, and materials that are lost from the grinding processes, are landfilled. Landfill tipping fees in this case study are based on a 2019 analysis of landfill tipping fees in the South-Central region of the United States, which includes Texas (Kantner and Staley, 2020). We created a tipping fee model based on the reported annual fee increase of 3.4% and fees for 2016–2019:
In Equation (2), t is the model year. This tipping fee model yields a fee of $43.69 per metric ton in 2019, which is just under the reported fee of $45.11 per metric ton for the South-Central region, which consists of the U.S. states of Arkansas, Louisiana, Oklahoma, and Texas. We do not consider additional or irregular increases in tipping fees such as those that might result from policy changes being implemented, landfills reaching capacity and closing, or additional fees being imposed on turbine blades to discourage landfilling. Landfill tipping fees do not benefit from industrial learning and so do not decrease over time or with additional landfilling.
One hundred year global warming potential (GWP) is calculated over time for the EOL supply chain and its life cycle using the TRACI 2.1 methodology (Ryberg et al., 2014). The processes modeled within the foreground LCI are epoxy production, glass fiber production, wind turbine blade production, cement and concrete production, coarse and fine grinding (of wind turbine blades), and landfilling. Supplementary Table 1 lists the U.S. LCI processes linked directly to the supply chain inputs within the foreground LCI.
To quantify the electricity used by the coarse grinding and fine grinding processes, we use experimental electricity use values from Shuaib and Mativenga (2016). However, it is important to note that the size of the equipment used in the cited experiment is likely much smaller than the equipment used in the Global Fiberglass Solutions plant, and so the electricity consumption per metric ton of blade material processed may be lower than determined by the cited experiment (Shuaib and Mativenga, 2016).
A diagram of the epoxy, glass fiber, and wind turbine blade manufacturing processes is shown in Figure 5. Data for these foreground processes was obtained from the Greenhouse gases, Regulated Emissions, and Energy use in Technologies Vehicle-Cycle model (GREET Vehicle-Cycle Model, 2019). Figure 6 shows a similar diagram for cement and concrete production, which was modeled as one combined process with data taken from the analogous processes in the U.S. LCI. When GFRP is recycled to clinker for cement co-processing, it replaces a portion of the coal and sand and gravel inputs to the cement production (Nagle et al., 2020). This results in lower process-level CO2 emissions for cement production and a small reduction in life cycle impacts due to decreased use of coal (Coughlin et al., 2020).
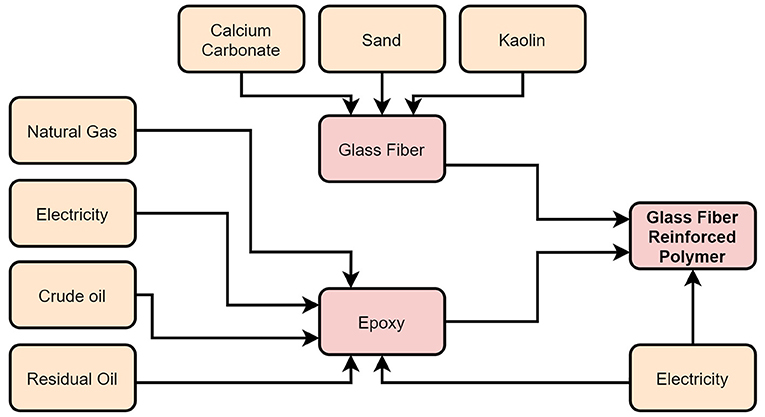
Figure 5. Diagram of the foreground LCI processes for epoxy, glass fiber, and glass fiber reinforced polymer manufacturing. Process data was obtained from (GREET Vehicle-Cycle Model, 2019). Material and energy inputs in the beige boxes are connected to the background LCI database for calculation of complete cradle-to-grave environmental impacts.
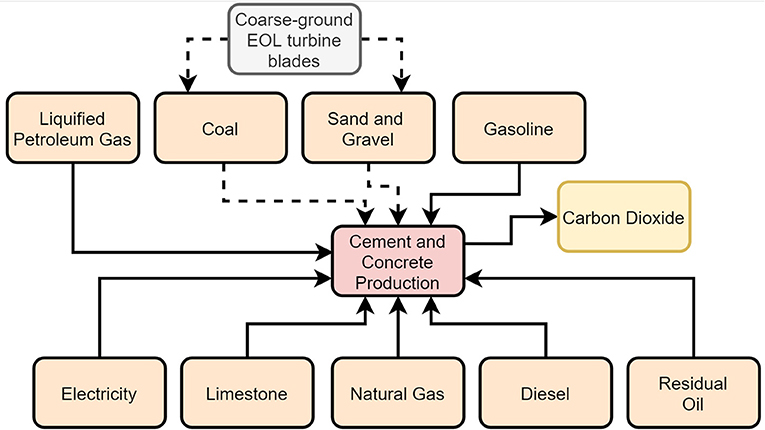
Figure 6. Diagram of the foreground LCI process for cement and concrete production. Separate sets of process data for cement production and concrete production were combined into one process, to allow for the dynamic re-calculation of the coal and sand and gravel process inputs as they are displaced by EOL turbine blades. This displacement only occurred when the recycle to clinker pathway was implemented within the supply chain. Material and energy inputs in the beige boxes are connected to the background LCI database for calculation of complete cradle-to-grave environmental impacts.
Results
Within the technology cost assumption scenarios, we explore three sets of transportation distances and two options for on-site blade size reduction for a total of 18 scenarios listed in Supplementary Table 2. In this section, we present detailed results for the three technology cost scenarios with on-site blade grinding and short transportation distances. Additional results may be found in the Supplementary Material.
Figure 7 summarizes pathway costs and use over time for the three cost scenarios with on-site blade grinding and short transportation distances. Recycling to clinker is implemented in the HC scenario, and recycling to raw material is implemented in the other two scenarios. Because recycling to raw material involves material losses (Coughlin et al., 2020), some blade material (30% of blade mass processed) is still landfilled when this type of recycling is implemented. No information is available on material losses in the recycling to clinker pathway, and a 0% loss rate is assumed.
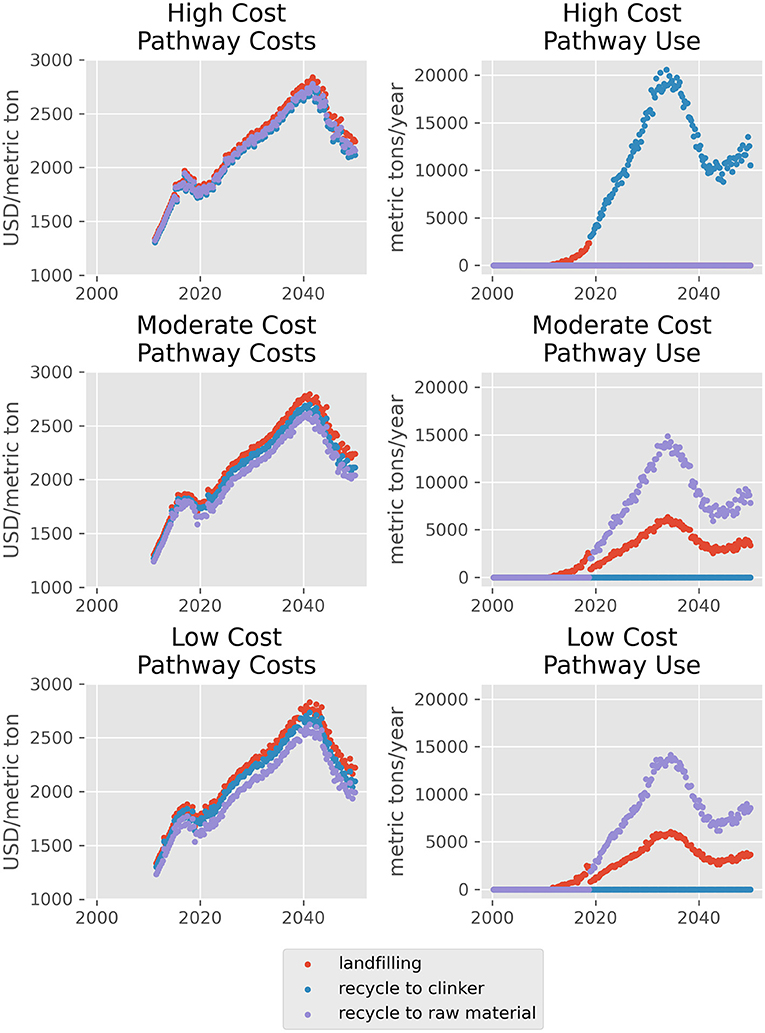
Figure 7. Summary of pathway costs (left, USD/metric ton) and pathway use (right, metric ton/year) across the three EOL technology cost assumptions. Results shown here are for on-site blade grinding and short transportation distances.
In all three scenarios in Figure 7, the EOL blade mass being processed peaks around 2035 before declining and then rising again. This pattern arises from the rate at which wind turbines are installed in Texas, which increases sharply from 2010 to 2020 before leveling off and decreasing.
The cost trajectories in Figure 7 increase overall until 2040 and then decline. This pattern is due to the way blade removal costs are calculated: by dividing one-third of the rotor teardown cost by blade mass. Around 2040, the rate at which blade mass increases over time itself increases, causing blade removal costs per metric ton to decrease (although removal costs per blade continue to increase). Because blade removal costs are a large fraction of total pathway costs, this decline is reflected in the overall cost trajectory.
Cumulative GWP for EOL processes and activities is shown for the same three scenarios (HC, MC, and LC, with on-site blade grinding and short transportation distances) in Figure 8, alongside inflow and outflow circularity metrics (Circular Transition Indicators V1.0 - Metrics for Business, 2020). Figure 8 also shows cumulative GWP, with impacts included from both end-of-life processes and manufacturing.
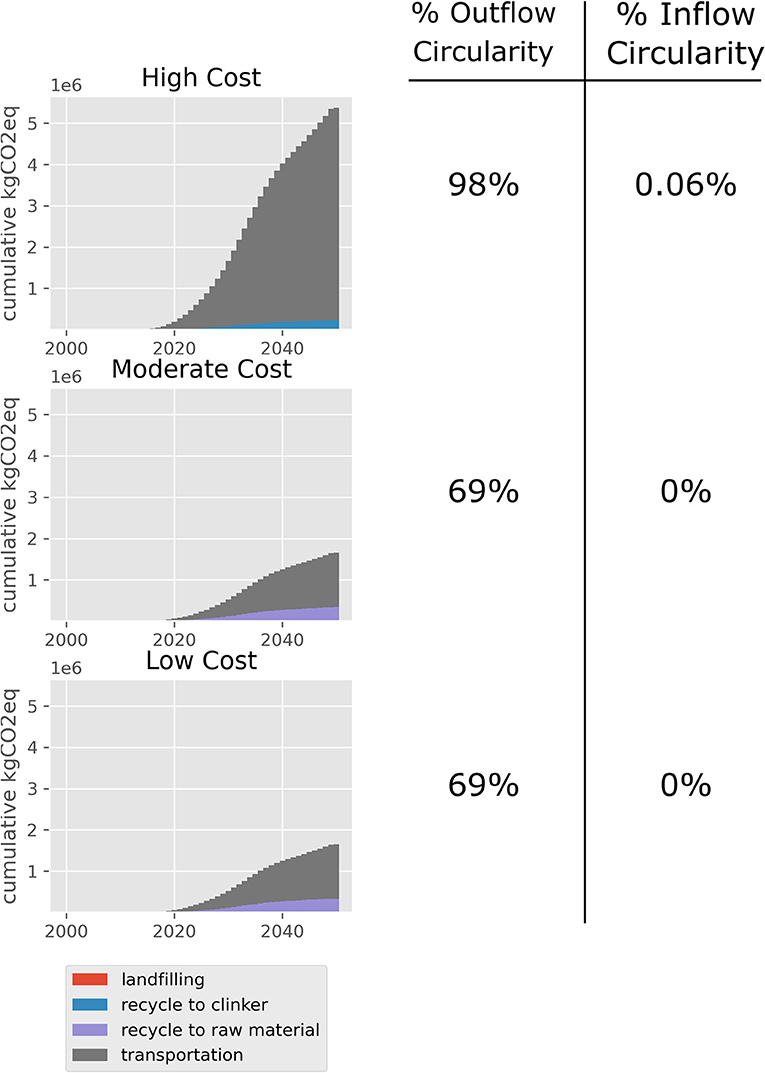
Figure 8. Cumulative global warming potential (GWP) for end-of-life processes and related activities, with cumulative circularity metrics for inflow and outflow materials shown at right. GWP from landfilling (red bars) are too small relative to the other contributions to be visible.
The outflow circularity metric in Figure 8 quantifies the EOL blade material kept in circulation (i.e., out of landfill) as a percentage of the total amount of EOL blade material; a fully linear system, in which all material leaves circulation at EOL, would have an outflow circularity of zero. The outflow and inflow circularity metrics in Figure 8 are calculated from the total amount of materials over the entire model run. For example, the 98% outflow can be interpreted as 98% of all EOL blade materials being kept in circulation from 2000 to 2050. The inflow circularity metric quantifies the EOL blade material used to manufacture new wind turbines as a percentage of the total amount of raw materials used in EOL wind turbine blades and foundations, and similarly, a fully linear system that consumes solely virgin raw materials would have an inflow circularity of zero.
Both recycling to clinker and recycling to raw material result in a nonzero outflow circularity. Because recycling to clinker is assumed to involve no material losses, it leads to a higher outflow circularity than recycling to raw material, in which 30% of EOL blade material processed is sent to landfill. Recycling to raw material does not produce a material that can be reused in new wind turbines, leading to an inflow circularity of zero. Recycling blades to clinker displaces a small amount of raw material used in turbine foundations and thus results in a nonzero but still very small (<1%) inflow circularity.
Figures 8, 9 emphasize that although the EOL pathway implemented affects EOL impacts, the overall effect on impacts including the manufacturing stage remains small regardless of EOL pathway. Under the HC scenario—with the highest EOL impacts of the three scenarios in Figure 8—EOL activities add only 7.1% additional GWP onto the impacts of manufacturing. The contributions of EOL activities were less in the other scenarios, with 2.5% additional GWP under both the MC and LC scenarios.
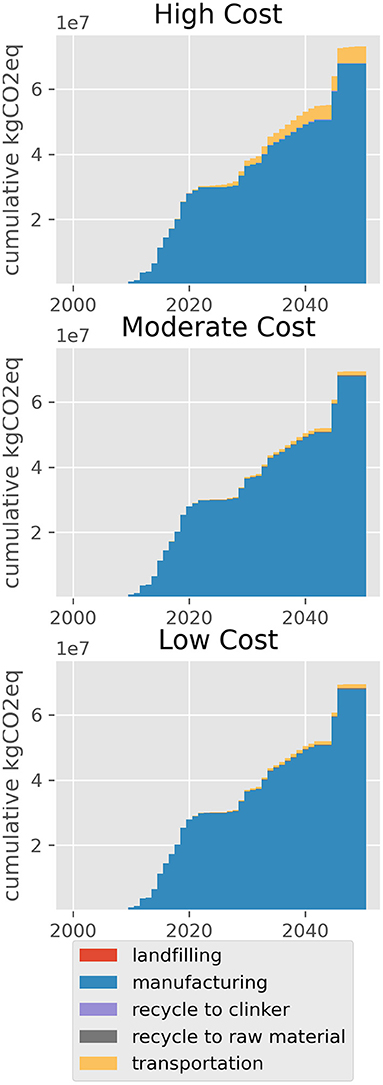
Figure 9. Cumulative GWP for end-of-life processes as well as manufacturing. This figure is included to emphasize the minor contributions to overall GWP made by the end-of-life processes and activities.
The circularity metrics shown in Figure 8 are calculated from cumulative blade masses. Figure 10 shows the circularity metrics calculated for every year of the model run, based on how EOL blades are processed within each year. The HC scenario (top row of graphs in Figure 10) involved recycling to clinker, which results in a change from 0% outflow circularity to 100% and a change from 0% inflow circularity to 0.06% when recycling to clinker is implemented. The other two scenarios involve recycling to raw material, which does not affect the inflow circularity but increases the outflow circularity to 70%, which reflects the 30% material losses incurred during the fine grinding process.
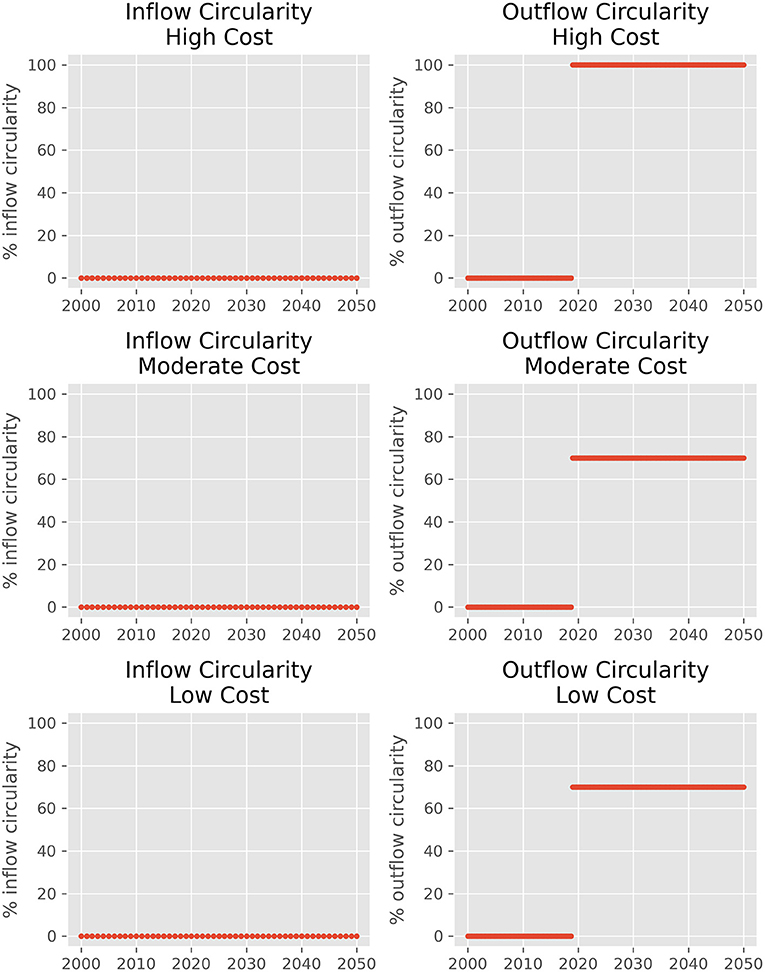
Figure 10. Inflow and outflow circularity metrics for the three technology costs scenarios, with on-site blade grinding and moderate transportation distances. The inflow circularity is non-zero under the HC scenario but is still <1%.
Discussion
All model scenarios follow approximately the same path toward circularity. End-of-life processing costs change (increase) over time, causing pathway costs to increase at different rates. The landfilling pathway cost increases more quickly than the recycling pathways due to the influence of increasing landfill tipping fees. Eventually, critical points are reached at which one or both recycling pathways, which rely less heavily or not at all on landfilling, become less expensive than landfilling entire blades. At that point, EOL blades begin to be recycled instead of landfilled. This leads to reductions in the recycling process cost through learning-by-doing; however, these cost reductions are overwhelmed by the much greater costs of removing the blades, doing on-site size reduction, and transporting materials between supply chain facilities.
Blade recycling is implemented in all but three scenarios, generally as soon as the GFRP recycling plant comes online in 2019, but in one case not until 2022. The model scenarios combining the HC cost assumptions (high recycling process costs and low revenue) with moderate or long transportation distances do not allow the supply chain to transition toward circularity. Both recycling pathways are implemented under different scenarios, with the HC cost assumptions (high recycling costs, low revenues) favoring recycling to clinker over recycling to raw material, and recycling to raw material being the preferred pathway elsewhere. The prevalence of the recycling to raw material pathway is due to the substantially larger revenue stream available from that pathway than from recycling to clinker ($242–303 revenue per metric ton for raw material vs. $10 revenue per metric ton for clinker). There is no possibility of displacing clinker used in cement for turbine foundations when the recycling to clinker pathway is not implemented, and so global warming potential (GWP) changes that include this displacement could be calculated only under three scenarios.
GWP is significantly higher under the HC scenario, in which recycling to clinker is implemented, than it is under the other two scenarios in which recycling to raw material is implemented. This is due to the longer distances involved in recycling to clinker: the cement plant in Odessa is further from each wind power plant location considered than the GFRP recycling facility, and ground blades must be transported there and back again to be reused in turbine foundations. The recycling to raw material process, considered by itself, is more energy intensive than the recycling to clinker process, because of the increased electricity needed to finely grind the blade material. Additionally, implementing either of the coarse or fine grinding steps within the supply chain increases GWP relative to a supply chain that segments and landfills blades, due once again to increased electricity demand. While overall the GWP attributed to the grinding steps was much less than that of other supply chain steps, there exists a trade-off that between circularity and environmental impacts for this supply chain.
The low impacts of the recycling processes, compared to transportation, are due partly to the types of recycling processes considered. Both recycling to clinker and recycling to raw material involve a grinding process, which uses electricity and does not require any other significant material or energy inputs. Recycling and other processes with more intensive material and energy input requirements (e.g., pyrolysis or chemical recycling) would further increase the impacts from EOL blade processing (Karuppannan Gopalraj and Kärki, 2020).
Limitations of the Analysis
A limitation of this analysis is the decision process used to determine what happens to EOL blades. As each blade reaches its EOL, it is processed according to the lowest-cost pathway; once a pathway becomes preferred, all EOL blades are processed according to that pathway. Moreover, the industrial learning-by-doing cost models fractionally reduce the pathway cost each time a blade is processed, such that a pathway that becomes the lowest-cost pathway tends to remain the lowest-cost pathway. The exception is the landfilling pathway, which increases in cost over time from increases in tipping fees and does not benefit from industrial learning. This produces the mostly static circularity metrics seen in Figure 10. With the inclusion of additional spatial data in CELAVI (discussed further in the next section), the circularity metrics would change more dynamically over time as different EOL decisions are made for different power plant locations.
Next Steps
The CELAVI modeling framework remains under development, with two key areas still to be incorporated or improved upon: spatial information and decision models. For the case study presented here, all wind turbines were assumed to originate from one of several representative wind plant locations in Texas. As a result, the transportation distances and costs were the same for every blade in a given scenario. Moreover, exact routes were not calculated between supply chain locations. Future CELAVI development will include a routing model that combines latitude and longitude data for supply chain locations with local road data to find the minimum-distance transportation route between supply chain locations (Zhan, 1997) and calculate precise transportation distances and costs. The inclusion of precise supply chain locations will also allow for the calculation of spatially explicit environmental impacts and changes in economic activity, which could inform where additional circularity-enabling technology capacity might be needed by a supply chain transitioning toward circularity.
Future CELAVI development will also include a more complex stakeholder decision model, which controls how circularity-enabling technologies and pathways are chosen over linear alternatives. Processing costs and potential revenue streams certainly factor into decisions about implementing and using circularity-enabling technologies, but they are unlikely to be the sole determinant, particular as such technologies become more widely deployed. Environmental impacts and logistical constraints (other than those reflected in transportation, storage, and other costs) are two additional sets of criteria that will be factored into circularity decisions. Logistical constraints may also include incentives or obstacles created by regional governmental policies, such as a ban on landfilling certain types of waste.
Conclusions
In this work, we discussed requirements for modeling circularity transitions and their associated externalities and described the first version of the Circular Economy Lifecycle Assessment and Visualization (CELAVI) framework. We applied CELAVI to analyze options for keeping wind turbine blades and their materials out of landfills, and we explored the results from this case study. We found that based on current recycling technology and landfilling costs, and trends in those costs over time, mechanical recycling of turbine blades to a raw material for use in other sectors is a feasible option and can keep more than 50% of turbine blade material out of landfills at end of life. To process the blades at EOL and deliver the recycled raw material or clinker to the next user, the recycling pathways required additional transportation and electricity consumption over what was required by the linear turbine blade supply chain. These additional impacts resulted in a 2.5–7.1% increase in GWP over the impacts already incurred by wind turbine manufacturing and upstream processes, with much of the additional GWP being due to transportation required for the recycling pathways.
Data Availability Statement
The raw data and all Python code supporting the conclusions of this article will be made available for download by the authors, without undue reservation.
Author Contributions
RH contributed to methodology, software, writing, reviewing and editing of the manuscript, and visualization. TG contributed to methodology, software, writing, and reviewing and editing of the manuscript. AK contributed to methodology and software. AE contributed to conceptualization, methodology, visualization, reviewing and editing of the manuscript, supervision, and funding acquisition. All authors contributed to the article and approved the submitted version.
Funding
All funding for this research was obtained from the National Renewable Energy Laboratory's Laboratory Directed Research and Development program.
Conflict of Interest
The authors declare that the research was conducted in the absence of any commercial or financial relationships that could be construed as a potential conflict of interest.
Acknowledgments
The authors wish to thank Alberta Carpenter, Garvin Heath, and Patrick Lamers for their input on CELAVI conceptualization and methodology; Emily Newes, Dan Bilello, Eric Lantz, and Brian Smith for their feedback on this manuscript; Madeline Schroeder and Liz Ware, who assisted with figure development; and Mike Meshek, who contributed technical editing and manuscript formatting.
Supplementary Material
The Supplementary Material for this article can be found online at: https://www.frontiersin.org/articles/10.3389/frsus.2021.671979/full#supplementary-material
Supplementary Table 1. Linkages between the supply chain inputs, which form the foreground LCI, and the background LCI processes within the U.S. LCI.
Supplementary Table 2. Combinations of technology cost assumptions, transportation distances, and on-site blade size reduction options explored in this case study.
Supplementary Table 3. Summary of circularity outcomes for the eighteen scenarios.
Supplementary Figure 1. Pathway cost sensitivity to blade size reduction option and transportation distances under the HC assumptions. Under on-site blade grinding (left column), recycling to clinker becomes the preferred pathway after 2019, whereas under on-site blade segmentation (right column), landfilling remains the preferred pathway throughout the model run.
Supplementary Figure 2. Pathway use sensitivity to blade size reduction option and transportation distances under the HC assumptions. Although both size reduction and distance impact pathway costs, the preferred (least-cost) pathway is determined by the size reduction option for these scenarios.
References
2020 Annual Technology Baseline (2020). 2020 Annual Technology Baseline. Golden, CO: National Renewable Energy Laboratory (NREL). Available online at: https://atb.nrel.gov/
Aguilar-Hernandez, G. A., Dias Rodrigues, J. F., and Tukker, A. (2021). Macroeconomic, social and environmental impacts of a circular economy up to 2050: a meta-analysis of prospective studies. J. Clean. Prod. 278:123421. doi: 10.1016/j.jclepro.2020.123421
Alamerew, Y. A., and Brissaud, D. (2020). Modelling reverse supply chain through system dynamics for realizing the transition towards the circular economy: a case study on electric vehicle batteries. J. Clean. Prod. 254:120025. doi: 10.1016/j.jclepro.2020.120025
Anzanello, M. J., and Fogliatto, F. S. (2011). Learning curve models and applications: literature review and research directions. Int. J. Indus. Ergon. 41, 573–583. doi: 10.1016/j.ergon.2011.05.001
Bank, L. C., Arias, F. R., Yazdanbakhsh, A., Gentry, T. R., Al-Haddad, T., J.-,Chen, F., et al. (2018). Concepts for reusing composite materials from decommissioned wind turbine blades in affordable housing. Recycling 3:3. doi: 10.3390/recycling3010003
Brown, M., Cole, W., Eurek, K., Becker, J., Bielen, D., Chernyakhovskiy, I., et al (2020). Regional Energy Deployment System (ReEDS) Model Documentation: Version 2019. NREL/TP-6A20-74111. Golden, CO: National Renewable Energy Laboratory. Available online at: https://www.nrel.gov/docs/fy20osti/74111.pdf
Cao, Z., Liu, G., Zhong, S., Dai, H., and Pauliuk, S. (2019). Integrating dynamic material flow analysis and computable general equilibrium models for both mass and monetary balances in prospective modeling: a case for the chinese building sector. Environ. Sci. Technol. 53, 224–233. doi: 10.1021/acs.est.8b03633
Charnley, F., Tiwari, D., Hutabarat, W., Moreno, M., Okorie, O., and Tiwari, A. (2019). Simulation to enable a data-driven circular economy. Sustainability 11:3379. doi: 10.3390/su11123379
Chen, Z., and Huang, L. (2019). “Application review of LCA (Life Cycle Assessment) in circular economy: from the perspective of PSS (Product Service System),” in Procedia CIRP, 11th CIRP Conference on Industrial Product-Service Systems (Zhuhai; Hong Kong). doi: 10.1016/j.procir.2019.04.141
Cheng, H., Dong, S., Li, F., Yang, Y., Li, Y., and Li, Z. (2019). A circular economy system for breaking the development dilemma of 'ecological fragility-economic poverty' vicious circle: a CEEPS-SD analysis. J. Clean. Prod. 212, 381–392. doi: 10.1016/j.jclepro.2018.12.014
Circular Transition Indicators V1.0 - Metrics for Business by Business. (2020). World Business Council for Sustainable Development. Available online at: https://www.wbcsd.org/contentwbc/download/8240/127985/1 (accessed December, 2020).
Cole, W., Gates, N., Mai, T., Greer, D., and Das, P. (2019). 2019 Standard Scenarios Report: A U.S. Electricity Sector Outlook. NREL/TP-6A20-74110. National Renewable Energy Laboratory. Available online at: https://www.nrel.gov/docs/fy20osti/74110.pdf. doi: 10.2172/1580330
Cooperman, A., Eberle, A., and Lantz, E. (2021). Wind turbine blade material in the United States: quantities, costs, and end-of-life options. Resour. Conserva. Recycl. 168:105439. doi: 10.1016/j.resconrec.2021.105439
Corona, B., Shen, L., Reike, D., Rosales Carreón, J., and Worrell, E. (2019). Towards sustainable development through the circular economy-a review and critical assessment on current circularity metrics. Resour. Conserv. Recycl. 151:104498. doi: 10.1016/j.resconrec.2019.104498
Correia, J. R., Almeida, N. M., and Figueira, J. R. (2011). Recycling of FRP composites: reusing fine GFRP waste in concrete mixtures. J. Clean. Prod. 19, 1745–1753. doi: 10.1016/j.jclepro.2011.05.018
Cotrell, J., Stehly, T., Johnson, J., Roberts, J. O., Parker, Z., Scott, G., et al (2014). Analysis of Transportation and Logistics Challenges Affecting the Deployment of Larger Wind Turbines: Summary of Results. NREL/TP-5000-61063. Golden, CO: National Renewable Energy Laboratory. Available online at: https://www.nrel.gov/docs/fy14osti/61063.pdf
Coughlin, D., Stevenson, P., and Zimmerman, L. B. (2020). Wind Turbine Blade Recycling: Preliminary Assessment. Palo Alto, CA: Electric Power Research Institute. Available online at: https://www.epri.com/research/products/000000003002017711
Curry, K. C., van Oss, H. G., and Pisut, C. K. (2020). 2017 Minerals Yearbook: Cement [Advance Release]. United States Geological Survey. Available online at: https://prd-wret.s3.us-west-2.amazonaws.com/assets/palladium/production/atoms/files/myb1-2017-cemen.pdf
Donati, F., Aguilar-Hernandez, G. A., Sigüenza-Sánchez, C. P., de Koning, A. J, Rodrigues, F. D., et al. (2020). Modeling the circular economy in environmentally extended input-output tables: methods, software and case study. Resour. Conserv. Recycl. 152:104508. doi: 10.1016/j.resconrec.2019.104508
Earles, J. M., and Halog, A. (2011). Consequential life cycle assessment: a review. Int. J. Life Cycle Assess. 16, 445–453. doi: 10.1007/s11367-011-0275-9
Eberle, A., Roberts, J. O., Key, A., Bhaskar, P., and Dykes, K. L. (2019). NREL's Balance-of-System Cost Model for Land-Based Wind. NREL/TP-6A20-72201. Golden, CO: National Renewable Energy Laboratory (NREL).
Ellen MacArthur Foundation (2013). Towards the Circular Economy: Economic and Business Rationale for an Accelerated Transition. Ellen MacArthur Foundation. Available online at: https://www.ellenmacarthurfoundation.org/assets/downloads/publications/Ellen-MacArthur-Foundation-Towards-the-Circular-Economy-vol.1.pdf
Englund, K. (2020). Discussion of Global Fiberglass Solution's Texas and Iowa Pilot Plants With Karl Englund. Chief Technology Officer Phone Conversation.
European Commission (2015). Closing the Loop - An EU Action Plan for the Circular Economy. European Commission. Available online at: http://eur-lex.europa.eu/legal-content/EN/~TXT/?uri=CELEX:52015DC0614
Fiberglass Recycling Global Fiberglass Solutions (2020). Fiberglass Recycling Global Fiberglass Solutionsand 2020. GFS. Available online at: https://www.globalfiberglassinc.com (accessed November, 2020).
Gao, C., Gao, C., Song, K., and Fang, K. (2020). Pathways towards regional circular economy evaluated using material flow analysis and system dynamics. Resour. Conserv. Recycl. 154:104527. doi: 10.1016/j.resconrec.2019.104527
Gentry, T. R., Al-Haddad, T., Bank, L. C., Arias, F. R., Nagle, A., and Leahy, P. (2020). Structural analysis of a roof extracted from a wind turbine blade. J. Archit. Eng. 26:04020040. doi: 10.1061/(ASCE)AE.1943-5568.0000440
Gheorghiu, I. (2020). GE Announces First US Wind Turbine Blade Recycling Program with Veolia. Utility Dive. Available online at: https://www.utilitydive.com/news/ge-announces-first-us-wind-turbine-blade-recycling-program-with-veolia/591869/ (accessed December, 2020).
Gignac, J. (2020). Wind Turbine Blades Don't Have To End Up In Landfills. Union of Concerned Scientists (blog). Available online at: https://blog.ucsusa.org/james-gignac/wind-turbine-blades-recycling (accessed October 30, 2020).
GREET Vehicle-Cycle Model (2019). GREET Vehicle-Cycle Model. Argonne, IL, USA: Argonne National Laboratory. Available online at: https://greet.es.anl.gov/
Hao, S. A., Kuah, T. H., Rudd, C. D., Wong, K. H. N., Lai, N. Y. G., Mao, J., et al. (2020). A circular economy approach to green energy: wind turbine, waste, and material recovery. Sci. Tot. Environ. 702:135054. doi: 10.1016/j.scitotenv.2019.135054
Hatfield, A. K., and Williams, C. C. (2020). Mineral Industry Surveys: Cement in July 2020. Available online at: https://prd-wret.s3.us-west-2.amazonaws.com/assets/palladium/production/atoms/files/mis-202007-cemen.pdf (accessed November, 2020).
Helander, H. A., Petit-Boix, Leipold, S., and Bringezu, S. (2019). How to monitor environmental pressures of a circular economy: an assessment of indicators. J. Indus. Ecol. 23, 1278–1291. doi: 10.1111/jiec.12924
Hoen, B. D., Diffendorfer, J. E., Rand, J. T., Kramer, L. A., Garrity, C. P., and Hunt, H. E. (2018). United States Wind Turbine Database (Ver. 3.2, October 14, 2020). Geological Survey, U. S., American Wind Energy Association; Lawrence Berkeley National Laboratory data release.
Ierides, M., and Reiland, J. (2019). Wind Turbine Blade Circularity: Technologies and Practices around the Value Chain. Bax and Company. Available online at: https://baxcompany.com/wp-content/uploads/2019/06/wind-turbine-circularity.pdf
Kantner, D. L., and Staley, B. F. (2020). Analysis of MSW Landfill Tipping Fees - April 2019. Environmental Research and Education Foundation. Retrieved from: erefdn.org.
Karuppannan Gopalraj, S., and Kärki, T. (2020). A review on the recycling of waste carbon fibre/glass fibre-reinforced composites: fibre recovery, properties and life-cycle analysis. SN Appl. Sci. 2:433. doi: 10.1007/s42452-020-2195-4
Kirchherr, J., Piscicelli, L., Bour, R., Kostense-Smit, E., Muller, J., Huibrechtse-Truijens, A., et al. (2018). Barriers to the circular economy: evidence from the European Union (EU). Ecol. Econ. 150:264–272. doi: 10.1016/j.ecolecon.2018.04.028
Klenow, P. J. (1998). Learning curves and the cyclical behavior of manufacturing industries. Rev. Econ. Dyn. 1, 531–550. doi: 10.1006/redy.1998.0014
Lunsdorf, O., and Scherfke, S. (2020). SimPy 4.0.1 (Version 4.0.1). Python. Available online at: https://simpy.readthedocs.io/en/4.0.1/ (accessed April, 2021).
Martin, C. (2020). Wind Turbine Blades Can't Be Recycled, So They're Piling Up in Landfills. Bloomberg.Com. Available online at: https://www.bloomberg.com/news/features/2020-02-05/wind-turbine-blades-can-t-be-recycled-so-they-re-piling-up-in-landfills (accessed February 5, 2020).
McCarthy, A., Dellink, R., and Bibas, R. (2018). “The macroeconomics of the circular economy transition: a critical review of modelling approaches,” in OECD Environment Working Papers. OECD Publishing. doi: 10.1787/af983f9a-en
McDowall, W., Geng, Y., Huang, B., Barteková, E., Bleischwitz, R., Türkeli, S., et al. (2017). Circular economy policies in China and Europe. J. Indus. Ecol. 21, 651–661. doi: 10.1111/jiec.12597
Micolier, A., Loubet, P., Taillandier, F., and Sonnemann, G. (2019). To what extent can agent-based modelling enhance a life cycle assessment? Answers based on a literature review. J. Clean. Prod. 239:118123. doi: 10.1016/j.jclepro.2019.118123
Moraga, G., Huysveld, S., Mathieux, F., Blengini, G. A., Alaerts, L., Van Acker, K., et al. (2019). Circular economy indicators: what do they measure? Resour. Conserv. Recycl. 146, 452–461. doi: 10.1016/j.resconrec.2019.03.045
Murray, R. E., Beach, R., Barnes, D., Snowberg, D., Berry, D., Rooney, S., et al. (2021). Structural validation of a thermoplastic composite wind turbine blade with comparison to a thermoset composite blade. Renew. Energy 164, 1100–1107. doi: 10.1016/j.renene.2020.10.040
Murray, R. E., Jenne, S., Snowberg, D., Berry, D., and Cousins, D. (2019). Techno-economic analysis of a megawatt-scale thermoplastic resin wind turbine blade. Renew. Energy 131, 111–119. doi: 10.1016/j.renene.2018.07.032
Nagle, A. J., Delaney, E. L., Bank, L. C., and Leahy, P. G. (2020). A comparative life cycle assessment between landfilling and co-processing of waste from decommissioned irish wind turbine blades. J. Clean. Prod. 277:123321. doi: 10.1016/j.jclepro.2020.123321
Palatnik, R. R., and Roson, R. (2012). Climate change and agriculture in computable general equilibrium models: alternative modeling strategies and data needs. Clim. Change 112, 1085–1100. doi: 10.1007/s10584-011-0356-6
Peña, C., Civit, B., Gallego-Schmid, A., Druckman, A. A. C.-, Pires, Weidema, B., Mieras, E., et al. (2021). Using life cycle assessment to achieve a circular economy. Int. J. Life Cycle Assess. 26, 215–220. doi: 10.1007/s11367-020-01856-z
Pham, H., and Lai, C.-D. (2007). On recent generalizations of the weibull distribution. IEEE Trans. Reliabil. 56, 454–458. doi: 10.1109/TR.2007.903352
Pickering, S. J. (2006). Recycling technologies for thermoset composite materials-current status. Compos. Part A 37, 1206–1215. doi: 10.1016/j.compositesa.2005.05.030
Pivnenko, K., Laner, D., and Astrup, T. F. (2016). Material cycles and chemicals: dynamic material flow analysis of contaminants in paper recycling. Environ. Sci. Technol. 50, 12302–12311. doi: 10.1021/acs.est.6b01791
Portland Cement Association (2015). Texas Cement Industry. Factsheet. Washington, DC: Portland Cement Association. Available online at: https://www.cement.org/docs/default-source/default-document-library/tex-factsheet_15-d2.pdf?sfvrsnandsfvrsn
Ramirez-Tejeda, K., Turcotte, D. A., and Pike, S. (2017). Unsustainable wind turbine blade disposal practices in the United States: a case for policy intervention and technological innovation. New Solut. 26, 581–598. doi: 10.1177/1048291116676098
Razdan, P., and Garrett, P. (2019). Life Cycle Assessment of Electricity Production from an Onshore V136-4.2MW Wind Plant. Vestas Wind Systems A/S. Available online at: https://www.vestas.com/~/media/vestas/about/sustainability/pdfs/lca%20of%20electricity%20production%20from%20an%20onshore%20v13642mw%20wind%20plantfinal.pdf (accessed October, 2020).
Ritzén, S., and Sandström, G. Ö. (2017). “Barriers to the circular economy - integration of perspectives and domains,” in Procedia CIRP, 9th CIRP IPSS Conference: Circular Perspectives on PSS (Copenhagen), 7–12. doi: 10.1016/j.procir.2017.03.005
Ryberg, M. M., Vieira, D. M., Zgola, M., Bare, J., and Rosenbaum, R. K. (2014). Updated US and Canadian normalization factors for TRACI 2.1. Clean Technol. Environ. Policy 16, 329–339. doi: 10.1007/s10098-013-0629-z
Saidani, M., Yannou, B., Leroy, Y., Cluzel, F., and Kendall, A. (2019). A taxonomy of circular economy indicators. J. Clean. Prod. 207, 542–559. doi: 10.1016/j.jclepro.2018.10.014
Schmid, M., Gonzalez Ramon, N., Dierckx, A., and Wegman, T. (2020). Accelerating Wind Turbine Blade Circularity. Wind Europe. Available online at: https://windeurope.org/wp-content/uploads/files/about-wind/reports/WindEurope-Accelerating-wind-turbine-blade-circularity.pdf (accessed November, 2020).
Scrieciu, S. S. (2007). The inherent dangers of using computable general equilibrium models as a single integrated modelling framework for sustainability impact assessment. A critical note on Böhringer and Löschel (2006). Ecol. Econ. 60, 678–684. doi: 10.1016/j.ecolecon.2006.09.012
Shuaib, N. A., and Mativenga, P. T. (2016). “Effect of process parameters on mechanical recycling of glass fibre thermoset composites,” in Procedia CIRP, The 23rd CIRP Conference on Life Cycle Engineering (Berlin), 134–139. doi: 10.1016/j.procir.2016.03.206
Tesfatsion Leigh (2006). “Chapter 16: Agent-based computational economics: a constructive approach to economic theory,” in Handbook of Computational Economics, eds L. Tesfatsion and K. L. Judd (Amsterdam: Elsevier), 831–880. doi: 10.1016/S1574-0021(05)02016-2
Texas Commission on Environmental Quality (2019). MSWFacility Viewer. GIS Dataset. Available online at: https://tceq.maps.arcgis.com/apps/webappviewer/index.html?id=33ac0b935f434cee927affd480307b14 (accessed November, 2020).
Tsuchiya, H., and Kobayashi, O. (2004). Mass production cost of PEM Fuel cell by learning curve. Int. J. Hydrog. Energy Fuel Cells 29, 985–990. doi: 10.1016/j.ijhydene,0.2003.10.011
US Life Cycle Inventory Database (2012). US Life Cycle Inventory Database. Golden, CO: National Renewable Energy Laboratory. Available online at: https://www.lcacommons.gov/nrel/search
Walzberg, J., Lonca, G., Hanes, R. J., Eberle, A. L., Carpenter, A., and Heath, G. A. (2021). Do we need a new sustainability assessment method for the circular economy? a critical literature review. Front. Sustain. 1:47. doi: 10.3389/frsus.2020.620047
Weber, R. S., and Snowden-Swan, L. J. (2019). The economics of numbering up a chemical process enterprise. J. Adv. Manufact. Process. 1:e10011. doi: 10.1002/amp2.10011
Wiebe, K. S., Harsdorff, M., Montt, G., Simas, M. S., and Wood, R. (2019). Global circular economy scenario in a multiregional input-output framework. Environ. Sci. Technol. 53, 6362–6373. doi: 10.1021/acs.est.9b01208
Winans, K., Kendall, A., and Deng, H. (2017). The history and current applications of the circular economy concept. Renew. Sustain. Energy Rev. 68, 825–833. doi: 10.1016/j.rser.2016.09.123
Wind Powers America Third Quarter 2020 Market Report: Public Version (2020). Wind Powers America Third Quarter 2020 Market Report: Public Version 2020. American Wind Energy Association. Available online at: https://www.awea.org/resources/publications-and-reports/market-reports/2020-u-s-wind-industry-market-reports-(1)/q32020_public
Winning, M., Calzadilla, A., Bleischwitz, R., and Nechifor, V. (2017). Towards a circular economy: insights based on the development of the global ENGAGE-materials model and evidence for the iron and steel industry. Int. Econ. Econ. Policy 14, 383–407. doi: 10.1007/s10368-017-0385-3
Woltjer, G. (2018). Scenario Analysis for a Circular Economy. European Commission. Available online at: https://circular-impacts.eu/content/scenario-analysis-circular-economy
Wood, K. (2020). Wind Turbine Blades: Glass vs. Carbon Fiber. Composites World. Available online at: https://www.compositesworld.com/articles/wind-turbine-blades-glass-vs-carbon-fiber (accessed March 31 2020).
Wu, S. R., Li, X., Apul, D., Breeze, V., Tang, Y., Fan, Y., et al. (2017). Agent-based modeling of temporal and spatial dynamics in life cycle sustainability assessment. J. Indus. Ecol. 21, 1507–1521. doi: 10.1111/jiec.12666
Yang, Y., and Heijungs, R. (2018). On the use of different models for consequential life cycle assessment. Int. J. Life Cycle Assess. 23, 751–758. doi: 10.1007/s11367-017-1337-4
Zhan, F. B. (1997). Three fastest shortest path algorithms on real road networks: data structures and procedures. J. Geogr. Inform. Decis. Anal. 1, 70–82.
Keywords: circular economy, discrete event simulation, life cycle assessment, material flow modeling, multiscale modeling
Citation: Hanes R, Ghosh T, Key A and Eberle A (2021) The Circular Economy Lifecycle Assessment and Visualization Framework: A Case Study of Wind Blade Circularity in Texas. Front. Sustain. 2:671979. doi: 10.3389/frsus.2021.671979
Received: 24 February 2021; Accepted: 17 May 2021;
Published: 21 June 2021.
Edited by:
Manuele Margni, Polytechnique Montréal, CanadaReviewed by:
Maria Milousi, University of Western Macedonia, GreeceGeorge Tsalidis, Institute for Sustainable Process Technology (ISPT), Netherlands
Copyright © 2021 Hanes, Ghosh, Key and Eberle. This is an open-access article distributed under the terms of the Creative Commons Attribution License (CC BY). The use, distribution or reproduction in other forums is permitted, provided the original author(s) and the copyright owner(s) are credited and that the original publication in this journal is cited, in accordance with accepted academic practice. No use, distribution or reproduction is permitted which does not comply with these terms.
*Correspondence: Annika Eberle, annika.eberle@nrel.gov