Multi-Frequency Radar Micro-Doppler Based Classification of Micro-Drone Payload Weight
 Dilan Dhulashia
 Nial Peters
 Colin Horne
  Matthew Ritchie
- Department of Electronic and Electrical Engineering, University College London, London, United Kingdom
The use of drones for recreational, commercial and military purposes has seen a rapid increase in recent years. The ability of counter-drone detection systems to sense whether a drone is carrying a payload is of strategic importance as this can help determine the potential threat level posed by a detected drone. This paper presents the use of micro-Doppler signatures collected using radar systems operating at three different frequency bands for the classification of carried payload of two different micro-drones performing two different motions. Use of a KNN classifier with six features extracted from micro-Doppler signatures enabled mean payload classification accuracies of 80.95, 72.50 and 86.05%, for data collected at S-band, C-band and W-band, respectively, when the drone type and motion type are unknown. The impact on classification performance of different amounts of situational information is also evaluated in this paper.
1 Introduction
Over the past decade there has been a substantial increase in the number of micro-drones, i.e., Unmanned Aerial Vehicles (UAVs), available on both the commercial and consumer markets. This increase can be attributed to their continually improving capabilities, ease of use, and low cost, making them attractive to businesses and hobbyists alike. There have been countless positive applications of micro-drone technology, e.g., agricultural and environmental surveying, disaster response and search and rescue. However, micro-drones have become infamous for their misuse, in performing anti-social, and often criminal activities, such as illegal filming of private/sensitive locations or dangerous flying through restricted airspace creating a collision hazard to other aircraft. Of particular interest in this work is the ability for micro-drones to be utilized as vehicles for transporting payloads of dangerous substances e.g. explosives, chemical/biological weapons and illicit drugs. This capability is of concern to security agencies worldwide (Forbes, 2019), with calls being made to limit commercial drone payload capacities in order to limit the risk posed (BBC, 2016).
Current conventional radar based air surveillance systems often perform poorly when tasked with detecting and tracking micro-drones, due to their considerably smaller Radar Cross Section (RCS) when compared with standard aircraft, thus establishing the need for a dedicated system with adequate sensitivity for detection of these small RCS targets (Rahman and Robertson, 2018). Additionally, birds present an issue with drone detection systems due to their comparable RCS, altitude and speed of flight, all of which make discrimination between these two targets challenging using RCS information alone (Rahman and Robertson, 2018). In order to reduce the false alarm rate and thus mature radar based drone detection technology, there is a widening body of research into methods for discriminating between birds and micro-drones. The micro-Doppler signatures of drones have been identified as one method for discriminating micro-drones from other targets and general clutter (Tahmoush, 2014; Ritchie et al., 2016; Samiur and Robertson, 2019; Beasley et al., 2020). Micro-Doppler signatures are produced by periodic micro-motions of a target or object, such as flapping of a bird’s wings, the gait of a human walk or rotation of a micro-drone’s propellers (Chen, 2019). Micro-Doppler is the respective Doppler shift induced by these target micro-motions which appear as side bands around the target’s bulk Doppler. Further details on the mechanisms that produce micro-Doppler have been extensively documented for a range of radar targets in Miceli (2014) and Chen (2019). There are several publications detailing micro-Doppler signatures of drones, where comparisons are made with bird micro-Doppler e.g., Tahmoush (2014), Ritchie et al. (2016), Rahman and Robertson (2018), and Beasley et al. (2020). This work has been taken further in Molchanov et al. (2014), Kim et al. (2017), Samiur and Robertson (2019), and Rahman and Robertson (2020), where drone micro-Doppler signatures are fed into classifiers in order to discriminate between both different classes of drones and between drones and birds. For a more comprehensive review of the current literature on drone detection and classification using machine learning, please refer to a recent paper published on the topic by Taha and Shoufan (2019).
There have been a number of works published on multi-frequency micro-Doppler based classification of targets, with gesture recognition accounting for a large portion. Such works look to compare the suitability of particular frequency bands in the role of micro-Doppler signature generation for classification. A recent paper by Gurbuz et al. (2021), investigated the use of three frequencies S-bands, namely 77 GHz, 24 and 10 GHz, for use in sign language recognition. It was reported that, in nearly all cases, using the 77 GHz radar data resulted in the highest classification accuracy, where the lowest classification accuracy was reported to result from using the 10 GHz radar data.
A comparatively more limited body of literature is published on the topic of micro-Doppler based classification of unloaded and loaded drones. A single data-set collected by University College London’s (UCL) multistatic S-Band radar system, NETRAD (Doughty, 2008), has been used in a number of publications (Fioranelli et al., 2015; Ritchie et al., 2017; Patel et al., 2019; Pallotta et al., 2020), to test the accuracy of a variety of payload classification algorithms. In this data-set, a DJI Phantom 2 was loaded with a variety of payloads between 0 and 600 g and made to either hover or fly towards the central radar node. Fioranelli et al. (2015) and Ritchie et al. (2017) report high classification accuracies using a feature extraction based approach. In the hovering scenario, accuracies of 96–97% were achieved using centroid based micro-Doppler features. In contrast, for payload classification of the drone in flight, a maximum classification accuracy of 95% was achieved when using singular value decomposition (SVD) derived features. A similar feature based approach was used on the same data-set in a more recent publication by Pallotta et al. (2020), differing mainly through the use of spectral kurtosis (Dwyer, 1983) to extract features from the spectrograms. The algorithm produced by Pallotta et al. (2020) achieved classification accuracies for the hovering drone of 92.61%, marginally lower than the result reported by Ritchie et al. (2017). In the case of the moving drone, their classifier achieved an accuracy of 70.83%, considerably lower than the 95% accuracy reported in the work by Ritchie et al. (2017). The UCL data-set is again used by Patel et al. (2019); however, a different approach is used to tackle the classification problem. In Fioranelli et al. (2015), Ritchie et al. (2017), and Pallotta et al. (2020) work, a single spectrogram time-frequency representation was used, whereas in the work by Patel et al. (2019), two additional transforms are used, namely the cepstrogram and the cadence velocity diagram (CVD). Instead of selecting individual features to feed a classifier, a Convolutional Neural Network (CNN), AlexNet, is provided with the three time-frequency representation images. In both the hovering and moving drone scenarios, the AlexNet based image classifier had an overall accuracy of around 95–96%, comparable to the results reported by Fioranelli et al. (2015) and Ritchie et al. (2017).
Rahman et al. (2020) from The University of St Andrews have since released a substantial piece of work in which a 24 GHz Frequency Modulated Continuous Wave (FMCW) radar and 96 GHz Continuous Wave (CW) radar were simultaneously used to sample the micro-Doppler signatures of two large drones (DJI S900 hexacopter and a Joyance JT5L-404 crop spraying quadcopter) with a variety of payloads up to a maximum of 5 kg. Rahman et al. (2020) concluded through visual inspection of the spectrograms derived from the FMCW radar data that there were no consistent unique signatures that could solely be attributed to a drone carrying a payload. However, more success was had in the case of the CW radar data, though a conclusion was still reached that observed features could not be used as the sole basis of a classification algorithm. Nevertheless, an attempt was made to classify between unloaded and loaded drones using two machine learning approaches, namely feature extraction and a CNN. However, both approaches were found to have limited success.
The work presented in this paper looks to expand on previous work by comparing the effectiveness of radar data captured at three different frequency bands to be used for determining the payload weight which different drones are carrying. Radar systems operating at C-band, S-band and W-band (mm-wave) are used to measure two different types of small quadcopter type drones carrying three different payload weights and performing two different movement styles each. A series of investigations with increasing complexity are then carried out using the micro-Doppler signatures obtained from the radar measurements to be able to classify the payload type. The rest of this paper is organized as follows. Section 2 provides an overview of the experimental setup and the equipment used, including information about the radar systems and drones. Section 3 presents the theory and the methodology of the signal processing and the classification procedures used. Section 4 reports the results obtained and provides some analysis from these. Discussion on the observations are then summarized in Section 5, before conclusion are finally presented in Section 6.
2 Experimental Setup
In this section, the two radar platforms used in this research to capture radar data, the C-band and S-band ARESTOR RF sensor system and the W-band Texas Instruments radar system, are described. Details of the drone models flown as targets and the experimental setup employed to gather the radar data are then provided.
2.1 C-Band and S-Band RF Sensor
The UCL developed ARESTOR RF sensor platform is used to collect S-band and C-band radar data from the UAV under test. ARESTOR is a highly flexible custom-built RF sensor system, based on the Xilinx RF System on a Chip (RFSoC) Xilinx (2021b), which integrates multiple RF sampling rate analogue to digital converters and digital to analogue converters with a large field-programmable gate array (FPGA) fabric and multiple ARM processing cores.
ARESTOR is an eight channel transmit/eight channel receive RF sensor capable of direct sampling of RF signals up to S-band frequencies. The system consists of a Xilinx ZCU111 RFSoC evaluation board Xilinx (2021a), shown in Figure 1, plus FPGA images and software infrastructure which allows the customization of the ZCU111 such that it implements a range of radar and RF sensor components, including FMCW radar channels, passive radar channels and wideband electronic surveillance channels.
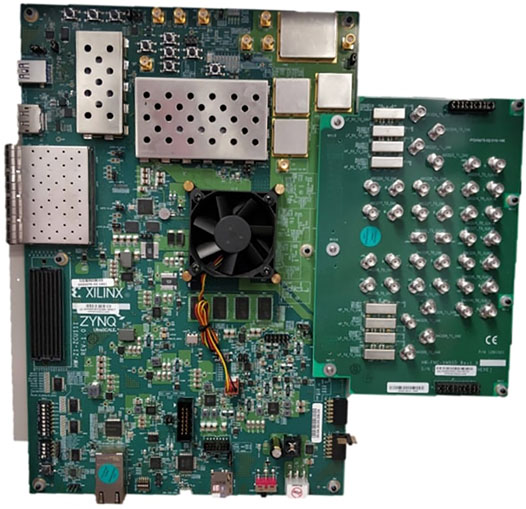
FIGURE 1. Xilinx ZCU111 RFSoC evaluation board with attached RF interface card.
Synchronization between multiple evaluation boards allows the construction of systems with multiple Tx/Rx coherent channels beyond the eight provided by a single board, and, with the addition of our in-house GPSDO solution, allows for multiple, spatially separated, ARESTOR subsystems to be synchronized for coherent multistatic operation.
For a more detailed overview of the ARESTOR RF sensor platform, see Peters et al. (2021).
In this study, the sensor is configured for dual-frequency FMCW radar operation, with one channel operating within the native frequency range of the RFSoC device for the S-band capture, and for C-band by extending the frequency range using a prototype RF front end which extends the upper limits of the frequency coverage to approximately 12 GHz.
The S-band channel uses a pair of 18 dBi dish antennas, and the C-band channel uses a pair of ultra-wideband tapered slot antennas, each providing 12 dBi of gain.
Radar operating parameters employed in the data captures are shown in Table 1.
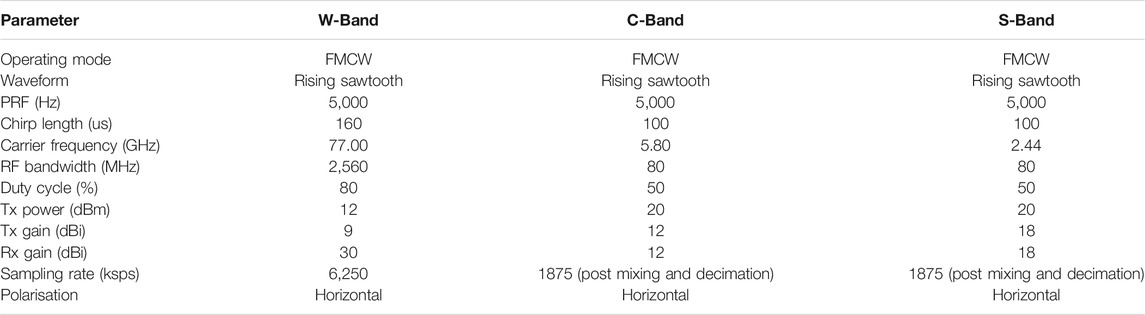
TABLE 1. Operating parameters of radars and waveforms used.
2.2 W-Band Radar
A Texas Instruments W-band radar was used to collect the W-band data during the drone captures. This system is comprised of an AWR1642BOOST radar evaluation board and a Texas Instruments DCA1000EVM capture card together being controlled from a PC using the Texas Instruments mmWave Studio application. The main radar operating parameters used and the parameters used for the chirped waveform design are shown in the corresponding columns within Table 1. A picture of the system, including the radar board and the capture card is shown in Figure 2.
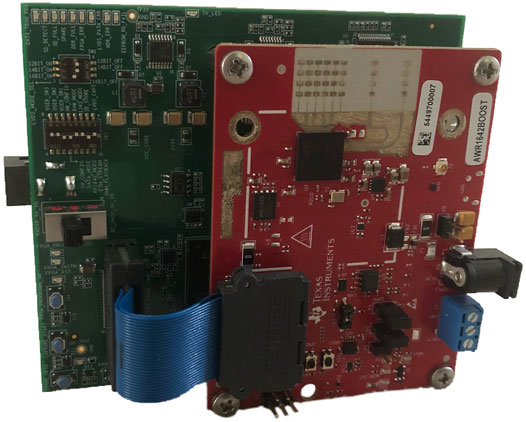
FIGURE 2. Texas Instruments W-band radar system including AWR1642BOOST radar evaluation board and DCA1000EVM capture card.
This radar is relatively simple to use out of the box, requiring no bespoke design from the user end beyond waveform design. While the radar includes two transmit channels and four receive channels, only a single transmit channel was used with the four receive channels in the collection of the data used in this study. The system can be used in either a vertical or a horizontal polarization by physical manipulation of the antenna orientations. The transmit and receive antennas included on the system and used are formed of etched patch designs. In the horizontal polarization used, each receive antenna is comprised of a series of connected patches in a horizontal alignment. The use of four receive antennas which are vertically stacked allows collection of four data streams which can be combined prior to Doppler-time processing in order to achieve an improved SNR with minimal distortion within resultant Doppler signatures. This is due to the relatively small angle differences between each receive antenna and a target. The transmit channel of the radar provides a total gain of 9 dBi, while each receive channel provides a gain of 30 dBi. A similar version to this system has been proposed and used within Gusland et al. (2021), where an initiative has been formed in order to collect and share radar data within the radar community.
2.3 Drone Types
Two different quadcopter style drones were used in the captures performed for this research. These are the DJI Phantom 2 and the DJI Spark. Both drones have a target user base of hobbyists and are two of the most common types of low cost quadcopter style drones which are typically used for recreational purposes.
The DJI Spark is the smaller of the two drones used, with main body dimensions of 143 × 143 × 55 mm, a diagonal length (excluding blades) of 175 mm, blade length of 110 mm and a mass (including blades and battery) of 300 g. It has a maximum velocity of 14 ms−1 and control communications are at a frequency of 2.400–2.483 GHz or 5.725–5.825 GHz. This drone will be referred to as the “small drone” in the following sections of this paper. An image of the drone can be seen in Figure 3A. The payload masses used with this drone are: 0, 50 and 100 g. As proportions of the mass of the drone, these payloads equate to: 0, 16.67 and 33.33%, respectively.
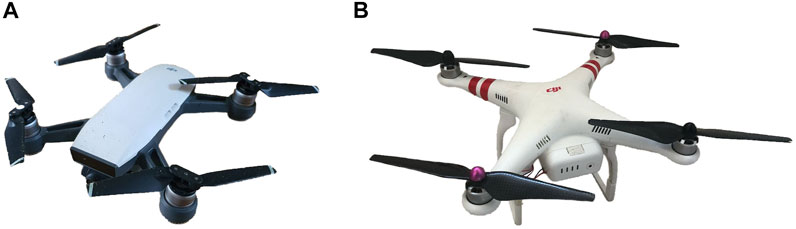
FIGURE 3. The two drones used within tests in this research: (A) DJI Spark, smaller drone (B) DJI Phantom 2, larger drone.
The DJI Phantom 2 is the larger of the two drones used, with dimensions of 300 × 300 × 190 mm, a diagonal length (excluding blades) of 425 mm, blade length of 240 mm and a mass (including blades and battery) of 1,250 g. It has a maximum velocity of 15 ms−1 and control communications are at a frequency of 2.400 GHz. Unlike the Spark, the Phantom includes two lower rails beneath the main body of the drone which act as landing gear, providing it with a distinctive difference in shape from the small drone. This drone will be referred to as the “big drone” in the following sections of this paper. An image of the drone can be seen in Figure 3B. The payload masses used with this drone are: 0, 250 and 500 g. As proportions of the mass of the drone, these payloads equate to: 0, 20 and 40%, respectively.
It should be noted that the communications signal used for controlling the smaller drone is always within the same frequency range as either the C-band or S-band radar systems. Likewise, the communications signal used for controlling the big drone is always within the same frequency range as the S-band radar system. No interference from either of the drone communications signals were observed within the data collected.
2.4 Data Captures
The drone captures were carried out on the same day in a flat-terrain outdoor setting over short grass with minimal other electromagnetic (EM) or non-drone target interference. A diagram depicting the approximate positions of the drone relative to the antennas of the monostatic radars and the approximate distances over which the drone was allowed to fly can be seen in Figure 4.
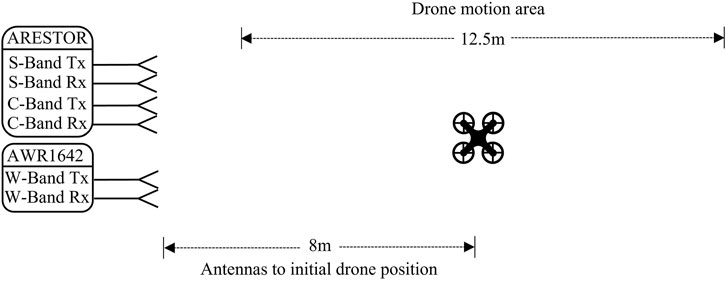
FIGURE 4. Depiction of layout for experimental setup used and distances over which drone flights were carried out.
Two captures, each of 1 min duration, were carried out for each drone, motion and payload combination, meaning a total of 24 captures per frequency band (two drone types, two motions and three different payloads, each recorded twice). Radar data was captured simultaneously at the three different frequency bands during each capture. A final set of captures were carried out to record a static target with no drone present in the environment at S-band using the same operating parameters as the S-band parameters used for the drone data collection, shown in Table 1.
3 Signal Processing and Classification
In this section, the signal processing methodology used to facilitate the generation of Doppler-time spectrograms is presented. The extracted features and machine learning model used for classification are described, and details of the classification investigations for which results will be reported are given.
3.1 Signal Processing
An overview of the signal processing performed on the captured data sets is shown in the block diagram provided in Figure 5, in which data structures are contained within blue blocks and operational stages are contained within red blocks.
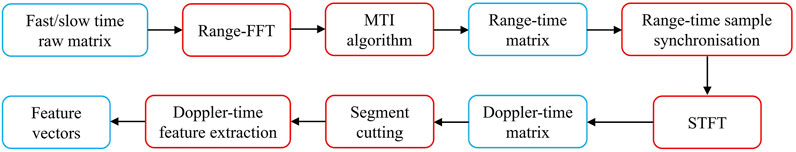
FIGURE 5. Block diagram showing stages involved in data processing from collected raw data to features used for classification. Data structures are contained within blue blocks and operational stages are contained within red blocks.
For each frequency band, the data obtained within a capture is initially organized into samples recorded for each returned chirp, commonly referred to by fast and slow time samples. A range fast Fourier transform (FFT) is performed on the samples within each chirp to obtain the range-time data. A moving target indication (MTI) algorithm is used on this range-time data to remove returns from static targets within the vicinity and to enable a greater concentration onto the response from the drone. This stage is desirable as returns from static targets can produce a prominent component at the 0 Hz Doppler frequency within the spectrograms which are used for classification. A strong component at this Doppler frequency has the potential to dominate over intricate micro-Doppler components resulting from reflections from the drone within the spectrogram and would cause the features used for classification to be based upon the return from the stationary objects instead of the drone. A range-time sample synchronization process is then used in order to remove capture initiation offsets between data collected from the three frequency bands to ensure features within the generated spectrograms will arise from the same observed physical phenomena. Following this, the range bins in which the drone target is determined to be located in at any given time are collected and formed into a single dimensional time spanning vector, RΣ. A short time Fourier transform (STFT) can be performed across these bins to generate a Doppler-time spectrogram containing the Doppler signature of the drone. The value of the STFT at frequency bin k at time slice m is then given by Eq. 1, where L is the number of samples in a window length, x [i] is the ith sample within RΣ, and hi is the ith sample within the weighting window used for tapering the short time samples.
The parameters used to perform the STFT on the range-time data for all the datasets used in this research are shown in Table 2.
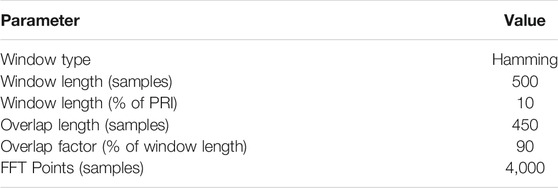
TABLE 2. Short time Fourier transform parameters used to generate Doppler-time spectrograms.
The resultant Doppler-time spectrogram for the drone motion throughout the capture is then cut into a series of one second long segments.
3.2 Feature Extraction
Feature extraction is carried out on each of the Doppler-time segments and the obtained values for each of the features are recorded into feature vectors along with a class label of the weight of the payload. It should be noted here that a Doppler-time segment (and the use of the word “segment”) refers to a single, one second long spectrogram slice containing values in decibels. The use of one second long spectrogram samples has been shown to be an effective length for drone micro-Doppler classification in Ritchie et al. (2017). This short sample length ensures that feature values are based on micro-movements intrinsic to the drone instead of events such as: variations in flight path, the amount the drone moves within the 1 min capture, or other unrelated phenomena occurring within the scene during the capture period. If a one second long spectrogram slice is represented as matrix Dcomplex, then the Doppler-time segment upon which feature extraction is carried out is given by DdB:
A comprehensive list of the features which are extracted from Doppler-time segments and used for classification are presented in Table 3. The features extracted from the Doppler-time segments are based on statistical values and empirical characteristics obtained from the segments. These provide measures of the power distributions and variations within spectrogram samples. The feature set is comprised of some features which have previously been used in Dhulashia et al. (2021) for the purpose of human activity micro-Doppler signature classification, simple statistical measures of the segment, and an application specific feature well suited to finding the mean bulk Doppler frequency for drone targets.
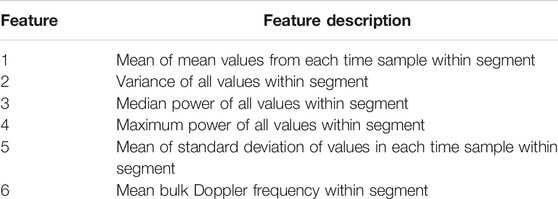
TABLE 3. Descriptions of features extracted from Doppler-time segments which comprise feature vectors used for classification.
The feature vectors are stored within categorized tables based on the drone type and movement type. All of the feature vectors for each of the four combinations (two drone types and two movement types) formed from these categories from all payload captures are stored for each of the frequencies examined in the work. The feature vector collections for each frequency can then be used to train a classifier upon choice of movement type and/or drone type.
3.3 K-Nearest Neighbors Classifier
The classifier model used in this research is the K-Nearest Neighbor (KNN) algorithm. This model is trained by mapping the training data into a six-dimensional feature space based on the extracted feature values for each data segment. Test samples are similarly mapped into the feature space. The class types of the “k” nearest training data points to the test data point within the feature space are known and a vote is made amongst these to find the majority class type. The test data point is then classified as being a member belonging to this class type. In all classification tests included in this research, the number of neighbors over which voting is carried out (i.e., k value) is three. The KNN method for classification is suitable as it is non-parametric and therefore makes no assumptions regarding the probabilistic distribution of the data, as well as being well suited to problems where the data sets consist of smaller amounts of data. The choice to use three nearest neighbors for class label voting is to reduce computation times while minimizing the impact on classification of erroneous or low quality individual training data samples as well as potential overfitting.
3.4 Classification Methodology
In a fully deployable radar system, for usage outside of the experimental research context, a hierarchical classification procedure would typically be used. The initial stage of such a classification methodology would perform target detection and recognition. Here, a distinction would be made regarding the type of target which is being observed. This would enable the system to determine whether the observed target is a drone or some other similar RCS target of non-interest, for example, a bird. Such target determination methods are presented in Ritchie et al. (2016) and Rahman and Robertson (2018). If the system determines that the target is a drone, a second classification stage would then be employed in order to classify the payload status of the drone. In the context of the work presented in this paper, a single classification stage is used. It is assumed that the target is present and that the target is already known to be a drone.
Since the classification methodology employed in this work did not use a hierarchical classification scheme, the data samples from the static target captures allows for the inclusion of a class of type, “No Drone,” within the training set data when constructing classifiers used for the investigations within this research. The purpose of this is to ensure that if a provided test sample is of sufficiently low quality, for example, if the drone was not observed, the classifier will be able to determine this as being the case instead of forcefully attempting to classify the sample into one of the three payload based classes pertaining to the drone being present.
The research presented in the results section of this paper is broken down into four classification investigations based on supervised learning problems of differing complexities. The first classification investigation aims to classify the payload carried by a drone, given that the drone type and drone motion is known. This classification is found using data from each frequency band separately. This is achieved by creating classifier training data sets using one second spectrogram segments obtained from the captures for all three payloads but only for a particular drone, motion, and frequency band combination. 80 samples per payload mass are used to construct these training data sets, as well as an additional 40 samples of type “No Drone,” which correspond to samples taken when no drone was flying, resulting in a total training set size of 280 samples. Unseen test samples corresponding to the same drone and motion combination but of varying payload are then provided to the classifier for classification. A total of 2,000 test samples are used in each classification test in a Monte-Carlo fashion. Within a single classification test type, the classifier model will be retrained with a new selection of randomly chosen training data several times in order to allow the number of Monte-Carlo tests to be reached. The same format of Monte-Carlo tests along with the same number of repetitions are also used in investigations two, three and four. Figure 6 shows the feature table banks from which data is randomly selected depending on the classification test type and how data is provided to the classifier. It should be noted that the algorithm used for randomized file selection ensures test data remains unseen by the classifier during training and that only samples corresponding to the test type being carried out are used.
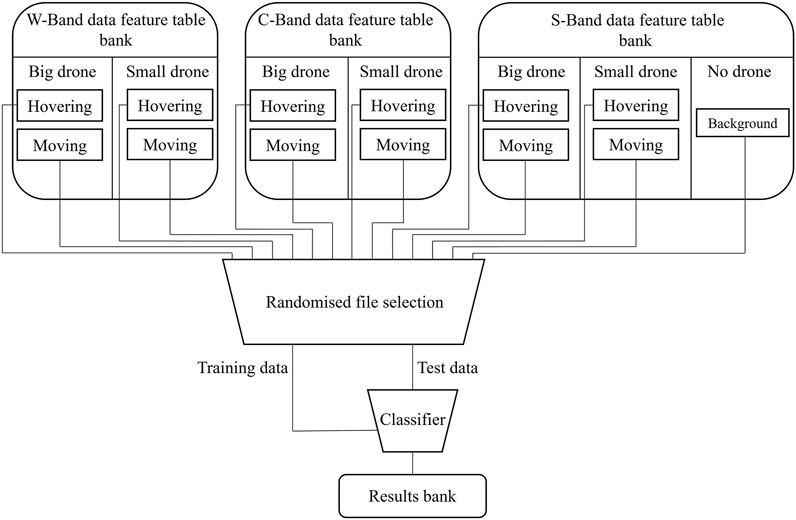
FIGURE 6. Diagram depicting stages involved in selection of feature vectors from banks to results storage.
The second classification investigation aims to classify the payload being carried by a known drone type but with unknown motion. As such, training and test sets are both created using a mixture of data from both “Hovering” and “Moving” motion types for each of the frequency bands being investigated, as well as the training set including “No Drone” samples. Similarly to the first investigation, 80 samples per motion type per drone type are included in each training set, along with 40 samples of type “No Drone,” meaning training sets have a total size of 520 samples.
The third classification investigation looks to classify the payload being carried by an unknown drone type but with known motion. This is performed for a given frequency band by creating classifier training sets comprised of samples for all payloads from both the big and small drone but for only a single motion type, as well as 40 type “No Drone” samples. The total training set size is then 520 samples, and the classification tests are repeated for each of the two motion types.
The fourth classification investigation is concerned with the classification of the payload given that both the drone and motion types are unknown. While the numerical value of the payload weights is different for both drones, the use of the payload labels: “Empty,” “Light” and “Heavy,” ensures that the problem remains a four class problem (also including the ‘No Drone class). The training set for this investigation for a given frequency band consists of 80 samples from each of the payload, drone type and motion type combinations, as well as the 40 samples from the “No Drone” class, making the total training set contain 1,000 samples.
In all four investigations, it is ensured that the test sets are balanced such that an equal number of samples from each of the true payload classes are provided, as well as equal numbers from each motion type and/or drone type, in the cases where either (or both) of these variables are considered unknown.
4 Results
This section first presents examples of Doppler-time spectrograms obtained from captures using two different payload weights at each of the three frequency bands before presenting the results from the different classification tests in the order introduced in the preceding section.
A series of example Doppler-time spectrograms corresponding to 1 min of radar data are shown in Figure 7. The spectrograms show the differences between data collected at the three different frequency bands being used to generate a Doppler signature corresponding to the same capture. Spectrograms are also shown for two different payloads: No payload and heavy payload (500 g). All the example spectrograms are generated from data collected using the big drone and the “Moving” motion type.
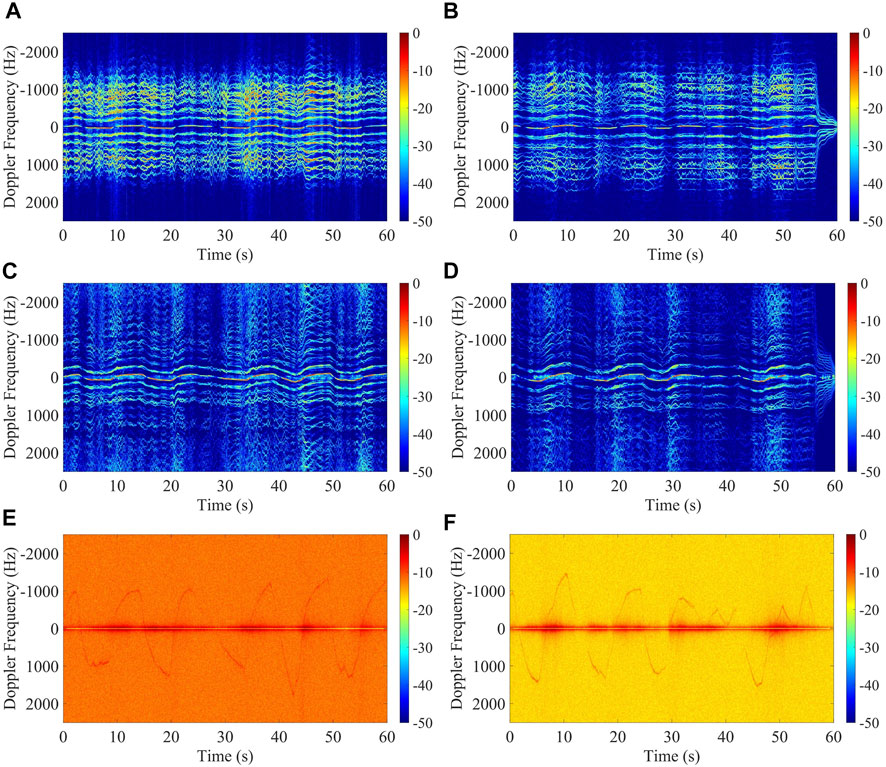
FIGURE 7. Example Doppler signatures from recordings of large drone moving: (A) S-band, 0 g payload (B) S-band, 500 g payload (C) C-band, 0 g payload (D) C-band, 500 g payload (E) W-band, 0 g payload (F) W-band, 500 g payload.
The initial classification investigation aimed to classify the weight of the carried payload by the drone given that the training set data was formed only from samples corresponding to the same drone and motion type as test samples being used, along with samples from a static target. Figure 8 shows the results from this classification investigation for both drone and motion types at each of the three frequency bands.
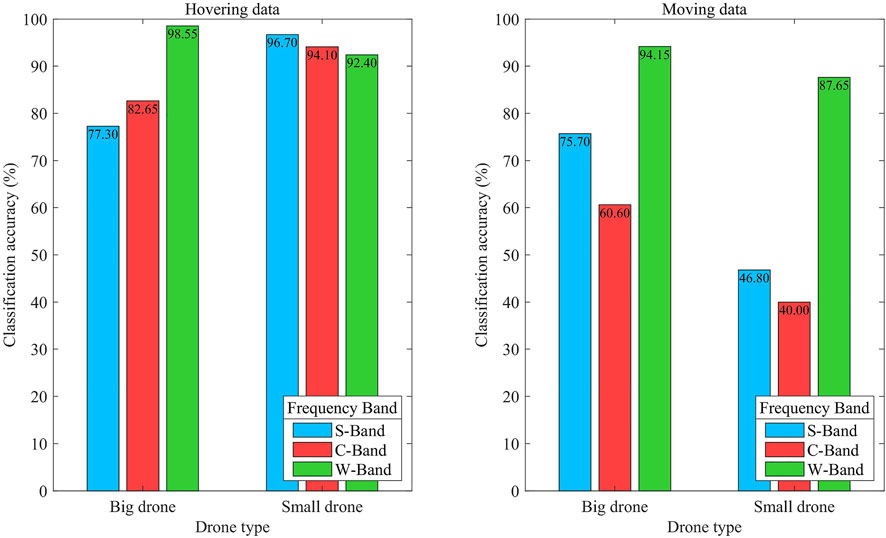
FIGURE 8. Payload classification accuracy from data collected at each frequency band for a known drone and motion type.
It can be seen from Figure 8 that when the motion type is “Hovering,” higher payload classification accuracies were achieved using S-band and C-band when the small drone was used, whereas a higher classification accuracy was achieved using W-band when the big drone was used. When the big drone is used, the performance ranking of the three frequency bands, from best to worst is: W-band, C-band, S-band. When the small drone is used, the ranking is reversed: S-band, C-band, W-band. This shows that despite the smaller payload weight to body weight ratio, when the smaller drone is used, the payload classification problem is still easier for the small drone when the motion type is “Hovering” and either S-band or C-band are being used.
When the motion type is “Moving,” it is seen that the performance ranking of the three frequency bands, from best to worst is: W-band, S-band, C-band. This is the same ranking order for both drone types; however, higher classification accuracies are observed for the big drone compared to small across all frequency bands. The classification accuracies for samples from the big drone were higher than that from samples from the small drone by the following amounts: S-band = +28.90%, C-band = +20.60%, W-band = +6.50%, showing that the smallest performance spread due to different drone types was seen when using W-band. When the motion type is “Moving,” payload classification accuracy for both drones at all frequencies is lower than for the “Hovering” motion type, showing that classification of payload weight using signatures from the drone hovering is more accurate than classification using signatures from moving drones.
By taking into account the graphs for both motion types in Figure 8, it can be seen that W-band data leads to the best classification accuracy in three out of the four cases and S-band data has the best payload classification accuracy for the remaining case. C-band ranks second best when the motion type is “Hovering,” for both drone types. S-band ranks second best for both drones when the motion type is “Moving.”
Out of the four cases for which data is shown in Figure 8, the largest performance spread between any two frequency bands occurs in the case of small drone and a motion type of “Moving,” between W-band and C-band, where the classification accuracy difference is 47.65%. Across the four cases included in the first investigation, the best overall payload classification accuracy is achieved at W-band when using the big drone in a “Hovering” motion, while the worst overall payload classification accuracy is achieved at C-band when using the small drone in a “Moving” motion.
Figure 9 shows the results from the second classification investigation, in which training sets are constructed using samples from a specific drone type but for both moving and hovering motions, as well as static non-drone target samples.
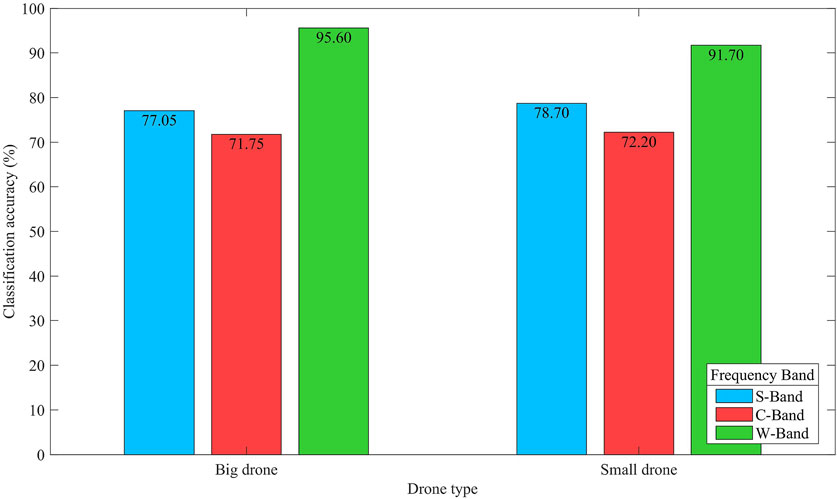
FIGURE 9. Payload classification accuracy from data collected at each frequency band for unknown motion but known drone type.
From Figure 9 it can be seen that the ranking order of the frequency bands from best to worst payload classification accuracy is the same for both drone types: W-band, S-band, C-band. The payload classification accuracy is seen to be higher for the small drone compared to the big drone for S-band and C-band, though this difference is very small (<2%). The opposite is seen for results obtained using the W-band data. The classification accuracy spread across the three frequency bands for the big drone is 23.85%, while for the small drone this spread is 19.50%, meaning less variation in performance across frequency bands is seen when using the smaller drone compared to the bigger drone.
Figure 10 shows the results from the third classification investigation where payload classification accuracies are found using mixed drone data but known movements (the left hand set of bars correspond to the hovering movement and the central set of bars correspond to the moving drone movement), as well as for the fourth classification investigation where mixed drone data and mixed movement data is used (shown in the set of bars on the right side of the graph).
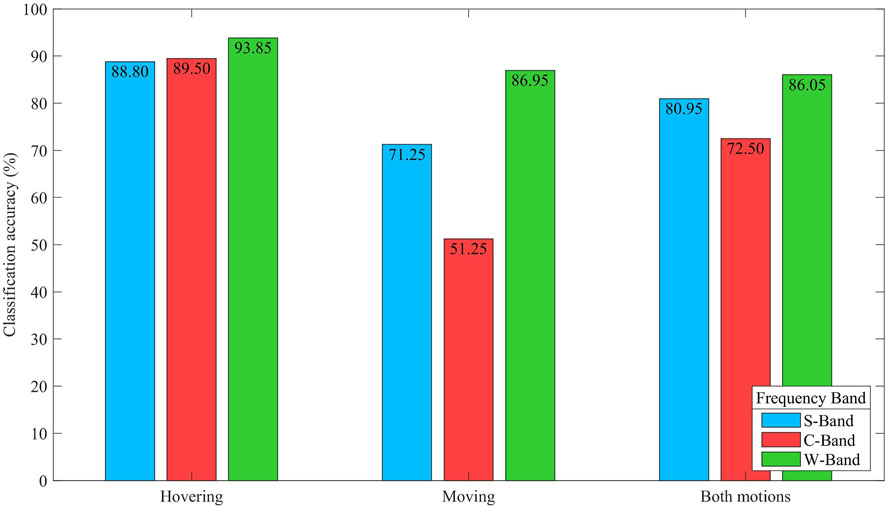
FIGURE 10. Payload classification accuracy from data collected at each frequency band for unknown drone type.
From the first two sets of bars (bars for “Hovering” and “Moving”) in Figure 10, it can be determined that when the drone type is unknown, the highest payload classification accuracy is achieved for motion type “Hovering” for all three frequency bands. The smallest variation in performance across S-bands also occurs for hovering data, where all three frequency bands performed within 4.35% of each other. While the performance differences are small for hovering data, the frequency band ranking from best to worst is seen to be: W-band, C-band, S-band. In the case where the data type is from the drones performing the “Moving” motion, the frequency band performance ranking is: W-band, S-band, C-band. The performance differences seen between the “Hovering” and “Moving” signatures for each band are: S-band = −17.55%, C-band = −38.25% and W-band = −6.90%, showing the smallest variation in performance across different motion types to be achieved by W-band.
When the signatures used in an investigation are of unknown motion and unknown drone (corresponding to the set of bars on the right hand side of Figure 10), the payload classification accuracy of the frequency bands from best to worst is: W-band, S-band, C-band. It is also seen that S-band and C-band perform better in this investigation than when moving only data is used, but worse than when hovering only data (i.e., the results from investigation three), while W-band shows a minor performance reduction compared to the case where the motion type is known to be “Moving” (<1%).
Figure 11 includes three confusion matrices pertaining to each of the three frequency bands. Each confusion matrix is constructed by recording the total number of classification attempt outcomes for each investigation carried out within the research presented. The values in the confusion matrices shown the proportional breakdown of outcome class predictions given a particular true payload class.
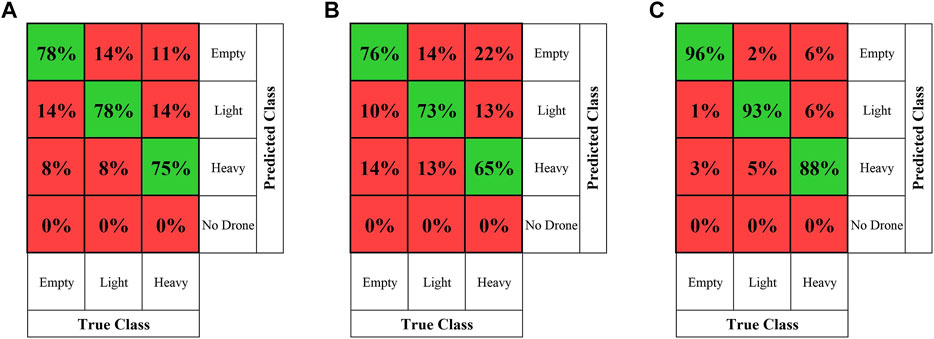
FIGURE 11. Confusion matrices from all classification attempts using samples generated from data obtained at each frequency band: (A) S-band (B) C-band (C) W-band.
It can be seen from the confusion matrices that the highest proportion of correct classifications for each payload type occurred when using W-band data, followed by S-band data, and the worst performance is seen from C-band data. When using C-band data, the highest misclassification situation occurs when the correct payload is “Heavy” but the “Empty” class is predicted.
The second highest misclassification situation when using C-band data occurs jointly when the true payload is “Light” but the “Empty” class is predicted, and when the true payload is “Empty” but the “Heavy” class is predicted. Three misclassification scenarios occur with the same rate as these two variations when using S-band. For all three frequency bands, no instances were observed where a situation was classed as having no drone present. For all three frequency bands, the most likely true payload to be misclassified is the “Heavy” payload. Similarly, for all three frequency bands, the most likely true payload to be correctly classified is the ‘Empty’ payload, though the true class of “Light” payload has an equal misclassification rate as this in the case of S-band.
All classification tests reported in this section of were repeated using a set of eight conventional SVD features, previously used for micro-Doppler classification in Fioranelli et al. (2017) and Dhulashia et al. (2021). The four investigations reported include a total of 27 different reported classification accuracy results. A comparison of the classification accuracy achieved in each of the tests using the SVD features with that achieved using the features proposed in this work can be seen in Figure 12.
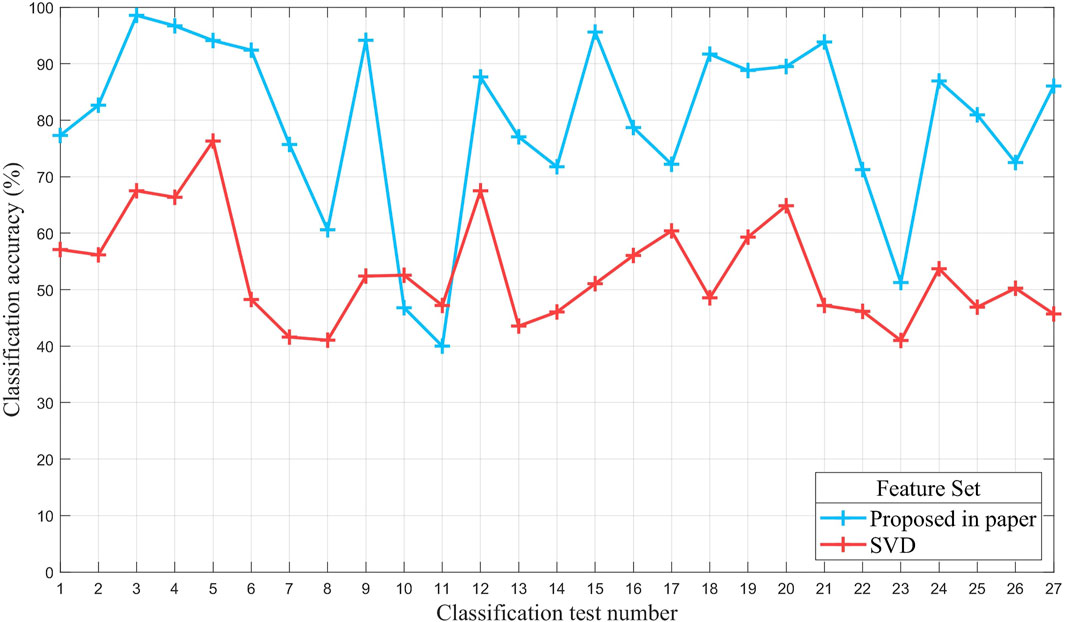
FIGURE 12. Comparison of classification accuracy achieved in each test using feature set proposed in this paper and using SVD feature set.
As shown in Figure 12, the feature set reported in this paper outperformed the SVD feature set in 25 out of the 27 classification tests, with classification accuracies being an average of 26.67% higher when using the feature set proposed in this paper.
5 Discussion
The results shown within this paper provide evidence that it is possible to classify the payload of different quadcopter micro-drone platforms. The tests included used payloads varying from 0% up to 40% of the drone body weight and achieved a peak classification success of 98.55%. From the results shown in Figures 8, 10, it can be seen that higher payload classification accuracies were achieved when using signatures from the “Hovering” scenarios, compared to those from when the drone is performing the “Moving” motion. This may be due to a greater number of degrees of freedom in the drone movement for the “Moving” motion, causing greater variations within the signatures for this motion type. Examples of these include more deviations in: Flight path, drone altitude and drone tilt.
It can be determined that the best payload classification accuracy can be achieved using signatures obtained at W-band frequencies. However, the W-band radar system is significantly range limited compared to the C-band and S-band systems, and suffers from rapid SNR reduction as the range to the target increases. For the W-band data, the lack of observable Helicopter Rotation Modulation (HERM) lines within Doppler signatures means that the features extracted were dominated by the bulk Doppler contribution which appears to be sufficiently different in each payload example to allow high classification success rates despite the lack of HERM lines. This may be due to the changed reflectivity of the target from the added metallic weights creating the payload. As such, this conclusion is limited to the short range examples tested in this research and the W-band system is likely to have a significant drop off in classification success rate with increases in range, unless highly directive antennas coupled with significant power amplification is built into the radar system.
In the ideal case, a single system capable of simultaneous measurements of all three frequency bands would be used along with transmission and reception hardware to ensure no difference in gain values. Such a system would allow for a comparison of the classifiability of micro-Doppler signatures for the three frequency bands while ensuring no other operating variables have any bearing on the results. The measured SNR of the S-band and C-band signals collected in this work were seen to be similar, thus legitimizing a comparison of data obtained using different hardware architectures.
In comparing the C-band and S-band results, the S-band was found to generally outperform the C-band measurements, particularly for the “Moving” and combined movement cases. Therefore, the recommendation based on the findings of this work would be to utilize the S-band frequencies for the task of micro-drone payload classification, due to this frequency band’s long range capabilities and high classification success rates. While the superior classification accuracy of the W band is likely due to the greater magnitude of Doppler frequencies spanned by the bulk Doppler signature, the S-band and C-band signature classification results from a greater contribution of the HERM lines observed within the spectrograms. The bulk Doppler contribution will be lower for these bands since this component of the signature spans only a small proportion of the overall Doppler frequency span. The S-band is shown to result in a higher overall classification accuracy than the C-band. Two factors are thought to contribute to this. The first of these results from the differences in the distribution of the HERM lines within the signatures from the two bands. In the S-band spectrograms, it can be observed that the HERM lines are unambiguously captured, while in the C-band spectrograms HERM lines may extend beyond the Doppler frequency range and result in overlap. Varying the payload on the drone results in changes in the rate at which the motor rotates which induces changes in the distribution of the HERM lines. For a higher payload and a higher rate of motor rotation this would appear only as the spreading of HERM line spacing in the S-band spectrograms. Conversely, this change would result in some increase in HERM line spacing and others becoming closer in the C-band spectrograms, due to the overlap wrapping effect. The S-band and C-band performance differences are also partially likely due to the higher SNR of the HERM lines within the S-band spectrograms compared to the C-band spectrograms. Since the features used for classification are based on measuring the distribution of energy within the signature, a more sensitive distinction between signatures of different payload classes is achievable for higher variations between the energy distributions in the spectrograms from different payload classes. The stronger HERM lines observed in the S-band spectrograms would result in higher variations between the energy distributions within segments from different payload classes, thereby resulting in a higher overall classification accuracy compared to the use of C-band spectrograms, which exhibit less energy distribution variations across segments from different payloads due to the lower SNR HERM line contributions. The disadvantage of S-band is that a system operating at this frequency band requires a larger antenna due to the longer wavelengths involved. This may present additional logistical challenges if deployment is required on a lightweight or small platform. Another potential reason for the higher classification success rates achieved when using S-band could be that the features being extracted have a greater propensity towards characteristics more readily observed within the S-band spectrograms compared to the C-band spectrograms.
6 Conclusion
This paper has presented results of using micro-Doppler features extracted from radar data obtained at three frequency bands to classify between three different payloads carried by two types of quadcopter micro-drones performing two different motions. It has been shown that the features and classification methodology used in this work can successfully determine the payload being carried by a drone in problems chosen to have varying complexities and situational knowledge. The reported results show that W-band is the preferable choice of radar frequency band to use for micro-drone payload classification. Out of the three frequency bands investigated, S-band is the second most preferable and C-band is the least preferable. It has also been shown that micro-Doppler signatures collected from hovering drones lead to more accurate payload classification than signatures from moving drones.
Further work will aim at collecting additional data in different conditions to validate these preliminary results, including the use of additional models of micro-drones and selecting different locations in which to perform tests.
The results shown within this paper are all based on data captured using horizontal polarization (H-pol) geometries. Future work may look to investigate the benefit of a multiple polarized sensing system when looking to classify a drone payload. H-pol was selected to maximize the micro-Doppler signatures but vertical polarization (V-pol) may also give information on flight dynamics, particularly when the drone is moving at higher velocities and travelling at a significantly tilted orientation.
In all four of the classification investigations presented in this work, classification decisions were made solely on the data from a selected frequency band at any given decision instance. If a multi-frequency system were to be used with a voting system to make classification decisions, it is likely that the payload classification accuracy would be greatly increased. This could be achieved by using the data collected from all three frequency bands and applying separate classifiers, before voting on the outcomes to obtain a joint decision. It is expected that this fused decision would provide an improved overall success rate.
Data Availability Statement
The raw data supporting the conclusion of this article will be made available by the authors, without undue reservation.
Author Contributions
NP and CH developed and operated the ARESTOR platform in order to capture the S-band and C-band data, wrote the description of the ARESTOR platform and provided inputs on data analysis. DD operated the W-band radar and completed the data analysis and wrote the results and discussion. PB provided the literature review and analysis of the drone data. MR flew the drone, provided inputs on the analysis and wrote the discussion and conclusion.
Funding
Funding for this research was provided by: Defence and Security Accelerator (DASA), Defence Science and Technology Laboratory (DSTL), Engineering and Physical Sciences Research Council (EPSRC) grant: EP/R513143/1 and Thales UK.
Conflict of Interest
The authors declare that the research was conducted in the absence of any commercial or financial relationships that could be construed as a potential conflict of interest.
Publisher’s Note
All claims expressed in this article are solely those of the authors and do not necessarily represent those of their affiliated organizations, or those of the publisher, the editors and the reviewers. Any product that may be evaluated in this article, or claim that may be made by its manufacturer, is not guaranteed or endorsed by the publisher.
Acknowledgments
The authors would like to thank Sarah and David Tutt for kindly allowing use of their land, on which the experiments performed as part of this work were carried out. The authors would also like to thank Thales UK for their support of this research.
References
BBC (2016). Warning over Drones Use by Terrorists. Available at: https://www.bbc.co.uk/news/technology-35280402. [Accessed January 12, 2019].
Beasley, P., Ritchie, M., Griffiths, H., Miceli, W., Inggs, M., Lewis, S., et al. (2020). “Multistatic Radar Measurements of Uavs at X-Band and L-Band,” in 2020 IEEE Radar Conference (RadarConf20), 1–6. doi:10.1109/RadarConf2043947.2020.9266444
Dhulashia, D., Ritchie, M., Vishwakarma, S., and Chetty, K. (2021). “Human Micro-doppler Signature Classification in the Presence of a Selection of Jamming Signals,” in 2021 IEEE Radar Conference (RadarConf21), 1–6. doi:10.1109/RadarConf2147009.2021.9455278
Doughty, S. (2008). Development and Performance Evaluation of a Multistatic Radar System. Ph.D. thesis. London: University College London.
Dwyer, R. (1983). “Detection of Non-gaussian Signals by Frequency Domain Kurtosis Estimation,” in ICASSP ’83. IEEE International Conference on Acoustics, Speech, and Signal Processing, 607–610. doi:10.1109/ICASSP.1983.11722648
Fioranelli, F., Ritchie, M., Griffiths, H., and Borrion, H. (2015). Classification of Loaded/unloaded Micro‐drones Using Multistatic Radar. Electron. Lett. 51, 1813–1815. doi:10.1049/el.2015.3038
Fioranelli, F., Ritchie, M., Gürbüz, S. Z., and Griffiths, H. (2017). Feature Diversity for Optimized Human Micro-doppler Classification Using Multistatic Radar. IEEE Trans. Aerosp. Electron. Syst. 53, 640–654. doi:10.1109/TAES.2017.2651678
Forbes (2019). Warning over Terrorist Attacks Using Drones Given by Eu Security Chief. Available at: https://www.forbes.com/sites/zakdoffman/2019/08/04/europes-security-chief-issues-dire-warning-on-terrorist-threat-from-drones/?sh=10ee551d7ae4. [Accessed January 12, 2019] [Dataset].
Gurbuz, S. Z., Mahbubur Rahman, M., Kurtoglu, E., Malaia, E., Gurbuz, A. C., Griffin, D. J., et al. (2021). Multi-frequency Rf Sensor Fusion for Word-Level Fluent Asl Recognition. IEEE Sensors J. 1, 1. doi:10.1109/JSEN.2021.3078339
Gusland, D., Christiansen, J. M., Torvik, B., Fioranelli, F., Gurbuz, S. Z., and Ritchie, M. (2021). “Open Radar Initiative: Large Scale Dataset for Benchmarking of Micro-doppler Recognition Algorithms,” in 2021 IEEE Radar Conference (RadarConf21), 1–6. doi:10.1109/RadarConf2147009.2021.9455239
Kim, B. K., Kang, H.-S., and Park, S.-O. (2017). Drone Classification Using Convolutional Neural Networks with Merged Doppler Images. IEEE Geosci. Remote Sensing Lett. 14, 38–42. doi:10.1109/lgrs.2016.2624820
Molchanov, P., Harmanny, R. I. A., de Wit, J. J. M., Egiazarian, K., and Astola, J. (2014). Classification of Small Uavs and Birds by Micro-doppler Signatures. Int. J. Microw. Wireless Technol. 6, 435–444. doi:10.1017/s1759078714000282
Pallotta, L., Clemente, C., Raddi, A., and Giunta, G. (2020). “A Feature-Based Approach for Loaded/unloaded Drones Classification Exploiting Micro-doppler Signatures,” in 2020 IEEE Radar Conference (RadarConf20), 1–6. doi:10.1109/radarconf2043947.2020.9266458
Patel, J. S., Al‐Ameri, C., Fioranelli, F., and Anderson, D. (2019). Multi‐time Frequency Analysis and Classification of a Micro‐drone Carrying Payloads Using Multistatic Radar. J. Eng. 2019, 7047–7051. doi:10.1049/joe.2019.0551
Peters, N., Horne, C., and Ritchie, M. (2021). “Arestor: A Multi-Role Rf Sensor Based on the Xilinx Rfsoc,” in 2021 EuRad conference, London.
Rahman, S., and Robertson, D. A. (2020). Classification of Drones and Birds Using Convolutional Neural Networks Applied to Radar micro‐Doppler Spectrogram Images. IET radar, sonar & navigation 14, 653–661. doi:10.1049/iet-rsn.2019.0493
Rahman, S., Robertson, D. A., and Govoni, M. A. (2020). Radar Signatures of Drones Equipped with Heavy Payloads and Dynamic Payloads Generating Inertial Forces. IEEE Access 8, 220542–220556. doi:10.1109/ACCESS.2020.3042798
Rahman, S., and Robertson, D. A. (2019). “Millimeter-wave Radar Micro-doppler Feature Extraction of Consumer Drones and Birds for Target Discrimination,” in Radar Sensor Technology XXIII. Editors K. Ranney, and A. Doerry. United States: SPIE. Proceedings of SPIE. doi:10.1117/12.2518846
Rahman, S., and Robertson, D. A. (2018). Radar Micro-doppler Signatures of Drones and Birds at K-Band and W-Band. Sci. Rep. 8, 1–11. doi:10.1038/s41598-018-35880-9
Ritchie, M., Fioranelli, F., Borrion, H., and Griffiths, H. (20172017). Multistatic micro‐Doppler Radar Feature Extraction for Classification of Unloaded/loaded Micro‐drones. IET Radar, Sonar & Navigation 11 (1), 116–124. doi:10.1049/iet-rsn.2016.0063
Ritchie, M., Fioranelli, F., Griffiths, H., and Torvik, B. (2016). “Monostatic and Bistatic Radar Measurements of Birds and Micro-drone,” in 2016 IEEE Radar Conference (RadarConf), 1–5. doi:10.1109/RADAR.2016.7485181
Taha, B., and Shoufan, A. (2019). Machine Learning-Based Drone Detection and Classification: State-Of-The-Art in Research. IEEE Access 7, 138669–138682. doi:10.1109/access.2019.2942944
Tahmoush, D. (2014). “Detection of Small Uav Helicopters Using Micro-doppler,” in Proceedings of SPIE - The International Society for Optical Engineering, Baltimore, MD (SPIE), 907717–9077176. doi:10.1117/12.2054329
W. J. Miceli (Editor) (2014). Radar Micro-doppler Signatures: Processing And Applications. Radar, Sonar & Navigation. London: Institution of Engineering and Technology.
Xilinx (2021a). Zcu111 Evaluation Kit. Available at: https://www.xilinx.com/products/boards-and-kits/zcu111.html. [Accessed September 1, 2021].
Xilinx (2021b). Zynq Ultrascale+ Rfsoc. Available at: https://www.xilinx.com/products/silicon-devices/soc/rfsoc.html. [Accessed September 1, 2021].
Keywords: micro-drone, multi-frequency radar, micro-Doppler, payload classification, counter-UAV, Doppler signatures, multi-functional radar
Citation: Dhulashia D, Peters N, Horne C, Beasley P and Ritchie M (2021) Multi-Frequency Radar Micro-Doppler Based Classification of Micro-Drone Payload Weight. Front. Sig. Proc. 1:781777. doi: 10.3389/frsip.2021.781777
Received: 23 September 2021; Accepted: 29 November 2021;
Published: 22 December 2021.
Edited by:
Luca Pallotta, Roma Tre University, ItalyReviewed by:
Tao Shan, Beijing Institute of Technology, ChinaChristos Ilioudis, University of Strathclyde, United Kingdom
Copyright © 2021 Dhulashia, Peters, Horne, Beasley and Ritchie. This is an open-access article distributed under the terms of the Creative Commons Attribution License (CC BY). The use, distribution or reproduction in other forums is permitted, provided the original author(s) and the copyright owner(s) are credited and that the original publication in this journal is cited, in accordance with accepted academic practice. No use, distribution or reproduction is permitted which does not comply with these terms.
*Correspondence: Dilan Dhulashia, dilan.dhulashia.15@ucl.ac.uk