Towards reliable retrievals of cloud droplet number for non-precipitating planetary boundary layer clouds and their susceptibility to aerosol
 Romanos Foskinis1,2
  Athanasios Nenes3,4* Alexandros Papayannis1,3*
  Paraskevi Georgakaki3
  Konstantinos Eleftheriadis2 Stergios Vratolis2
  Maria I. Gini2 Mika Komppula5
  Ville Vakkari5,6 Panos Kokkalis7
- 1Laser Remote Sensing Unit (LRSU), Physics Department, National Technical University of Athens, Zografou, Greece
- 2ERL, Institute of Nuclear and Radiological Sciences and Technology, Energy and Safety, National Centre of Scientific Research “Demokritos”, Ag. Paraskevi, Greece
- 3Laboratory of Atmospheric Processes and Their Impacts, School of Architecture, Civil and Environmental Engineering, École Polytechnique Fédérale de Lausanne, Lausanne, Switzerland
- 4Center for Studies of Air Quality and Climate Change, Institute of Chemical Engineering Sciences, Foundation for Research and Technology Hellas, Patras, Greece
- 5Finnish Meteorological Institute, Kuopio, Finland
- 6Atmospheric Chemistry Research Group, Chemical Resource Beneficiation, North-West University, Potchefstroom, South Africa
- 7Department of Physics, Kuwait University, Safat, Kuwait
Remote sensing has been a key resource for developing extensive and detailed datasets for studying and constraining aerosol-cloud-climate interactions. However, aerosol-cloud collocation challenges, algorithm limitations, as well as difficulties in unraveling dynamic from aerosol-related effects on cloud microphysics, have long challenged precise retrievals of cloud droplet number concentrations. By combining a series of remote sensing techniques and in situ measurements at ground level, we developed a semi-automated approach that can address several retrieval issues for a robust estimation of cloud droplet number for non-precipitating Planetary Boundary Layer (PBL) clouds. The approach is based on satellite retrievals of the PBL cloud droplet number (Ndsat) using the geostationary meteorological satellite data of the Optimal Cloud Analysis (OCA) product, which is obtained by the Spinning Enhanced Visible and InfraRed Imager (SEVIRI) of the European Organization for the Exploitation of Meteorological Satellites (EUMETSAT). The parameters of the retrieval are optimized through closure with droplet number obtained from a combination of ground-based remote sensing data and in situ observations at ground level. More specifically, the remote sensing data are used to retrieve cloud-scale vertical velocity, and the in situ aerosol measurements at ground level were used constrain as input to a state-of-the-art droplet activation parameterization to predict the respective Cloud Condensation Nuclei (CCN) spectra, cloud maximum supersaturation and droplet number concentration (Nd), accounting for the effects of vertical velocity distribution and lateral entrainment. Closure studies between collocated Nd and Ndsat are then used to evaluate exising droplet spectral width parameters used for the retrieval of droplet number, and determine the optimal values for retrieval. This methodology, used to study aerosol-cloud interactions for non-precipitating clouds formed over the Athens Metropolitan Area (AMA), Greece from March to May 2020, shows that droplet closure can be achieved to within 30%, comparable to the level of closure obtained in many in situ studies. Given this, the ease of applying this approach with satellite data obtained from SEVIRI with high temporal (15 min) and spatial resolution (3.6 km × 4.6 km), opens the possibility of continuous and reliable Ndsat, giving rise to high value datasets for aerosol-cloud-climate interaction studies.
1 Introduction
Aerosol-cloud interactions constitute one of the most uncertain drivers of anthropogenic climate change (Seinfeld et al., 2016; IPCC, 2021). Central to these interactions are the variations in cloud condensation nuclei (CCN; the subset of aerosol particles which droplets in ambient clouds form upon) concentrations from anthropogenic activities, as they modulate the Nd in clouds and the cloud optical depth, thus, affect the atmospheric radiation budget and climate. CCN activate into cloud droplets in supersaturated air generated within cloudy updrafts, and the supersaturation level required for each particle to act as a CCN is well described by Köhler theory (Köhler, 1936), modified to account for the effects of organic compounds and multiple hygroscopic species (e.g., Petters and Kreidenweis, 2007). Supersaturation in clouds is mostly generated by expansion cooling in updrafts driven by turbulence, convection, or gravity waves (Quaas et al., 2020).
Initial studies by Twomey and Warner (1967) showed that elevated concentrations of CCN in clouds increases Nd, reduces their size and thus enhances the amount of solar radiation reflected back to space. This effect, which tends to cool climate, is known as the “aerosol indirect effect” (Twomey, 1991) or “cloud albedo effect” (IPCC, 2021) on climate. Later studies showed that this Nd increment exists, but varies considerably depending on the supersaturation level that develops in clouds–which in turn depends on the vertical velocity (w), and amount of aerosol/CCN present (Ghan et al., 1998; Feingold et al., 2001; Reutter et al., 2009). It is now generally accepted that droplet formation can range from “aerosol-limited”, when supersaturation is high and Nd is very sensitive to aerosol changes, to “velocity-limited”, when the supersaturation is so low that Nd is insensitive to aerosol changes (Reutter et al., 2009). However, more recent studies showed that when approaching “velocity limited” conditions, Nd tends to come near an asymptotic upper limit, the so-called limiting droplet number (Ndlim), which primarily depends on the intensity of turbulence (Bougiatioti et al., 2020; Kacarab et al., 2020; Georgakaki et al., 2021).
Changes in Nd, apart from modifying the average size of cloud particles, also affect the shape of the droplet size spectrum and the resulting cloud radiative properties. The first generation of global climate models (GCM) with explicit consideration of Nd initially assumed that all droplets have the same diameter (i.e., monodisperse droplet population) which can directly be linked to the effective radius and cloud optical depth. Liu and Daum (2002) showed that this assumption leads to important biases in the calculations of optical depth and cloud radiative forcing, as monodisperse droplets scatter differently than a distribution with the same Nd and liquid water content (LWC). Known as “dispersion effect”, this bias can be mitigated through the use of the effective radius factor (β) so that when it is combined with the average droplet radius and cloud LWC gives the correct cloud optical depth. Several formulations have been proposed in the literature to represent the relationship between β and cloud microphysical quantities resolved in models—Nd and LWC. Expressions proposed by Martin et al. (1994), Liu and Daum (2002), Peng and Lohmann (2003) and Rotstayn and Liu (2003) were based on observations, while more recent formulations are derived from the adiabatic parcel theory (Liu et al., 2014; Chen et al., 2016; Chen et al., 2018). All together, these expressions show a positive correlation between β and Nd for aerosol- and velocity-limited regimes.
Despite decades of research, the imprint of aerosol effects on cloud albedo and climate still remains highly uncertain (Seinfeld et al., 2016; Quaas et al., 2020; IPCC, 2021), owing to the highly-buffered, nonlinear and multiscale nature of clouds and their interactions with dynamics, radiation and aerosol (Stevens and Feingold, 2009). Therefore, there is a pressing need to have extensive global datasets of Nd aerosol concentration, and cloud-scale dynamics (w especially) to understand their relative importance (e.g., Rosenfeld et al., 2016). Recently, Quaas et al. (2020) showed that satellite remote sensing is the only approach that offers the potential of obtaining global datasets with frequent coverage; current retrieval algorithms, however, carry many uncertainties and require constraints that can only be addressed with in situ and/or ground-based remote sensing observations. Particularly important is constraining w, which is seldomly evaluated in models (Sullivan et al., 2016). Furthermore, w can change along with aerosol and affect the response of clouds, as demonstrated recently by Bougiatioti et al. (2020) and Kacarab et al. (2020) for very different cloud systems, showing that a co-variability of aerosol concentration with w magnifies the inherent response of droplets to aerosol variations by up to 5 times.
It has long been known that w exhibits significant spatio-temporal variability even at the scale of single clouds. This presents a challenge about which velocity to use to link aerosol with Nd. Morales and Nenes (2010) proposed using a “characteristic” velocity, computed from the probability distribution function (PDF) of w in the airmass or cloud of interest, to provide a PDF-averaged Nd, which in turn is used to represent cloud-scale Nd. The characteristic velocity approach can be automated and easily applied to data either from in situ probes or ground-based remote sensing systems (Doppler lidars/radars). The calculation of Nd by using this characteristic velocity and in situ ground level data has been shown to agree with in situ measurements at cloud base level of cumulus and stratocumulus clouds in numerous studies to date (Meskhidze, 2005; Fountoukis and Nenes, 2007; Kacarab et al., 2020).
A more empirical approach to determine cloud base updrafts, based on cloud base height, has been proposed by Rosenfeld et al. (2016), using ground-based Doppler lidar measurements along with satellite data from the Visible Infrared Imaging Radiometer Suite (VIIRS). Their approach gave closure to within ± 25–30%, when applied to PBL convective clouds, non-obscured by upper layer clouds or including semitransparent cirrus. Although skillful, Rosenfeld et al. (2016) point out that this methodology cannot be applied globally, because distribution of CCN and cloud base updrafts are lacking.
In this study we improve an existing remote sensing approach for the retrieval of Nd in non-precipitating Planetary Boundary Layer clouds (PBLC), by considering the spectral dispersion of cloud droplets through β. The retrieval is evaluated using published dispersal relationships by comparing the Nd obtained from a combination of in situ observations, ground-based remote sensing data and parcel theory. The same data are then used to determine an optimal dispersal- Nd relationship that minimizes the closure error between retrieved and the estimated in situ Nd. During the optimization process, the cloud-scale w distributions, CCN spectra, and cloud maximum supersaturation, along with the Nd, are obtained. We apply this methodology to a highly variable semi-urban environment and discuss future directions and perspectives.
2 Methodology
Our methodology is based on the concurrent use of remote sensing, model data and expressions for β, applied to non-precipitating PBLCs in well-mixed PBLs and associated cloud-base vertical velocities. The remote sensing retrievals of Ndsat are compared against estimations of in situ Nd obtained from the application of the Nenes and Seinfeld (2003) activation parameterization, with extensions introduced by Fountoukis and Nenes (2005), Barahona et al. (2010) and Morales Betancourt and Nenes (2014). As input data to the droplet parameterization, we use the vertical velocity variation inside the PBL provided by the HALO wind lidar (see Session 2.3.3), as well as the aerosol size distribution and chemical composition at ground level, based on a Scanning Mobility Particle Sizer (SMPS) and a Time-of-Flight Aerosol Chemical Speciation Monitor (ToF-ACSM), respectively.
The approach used to estimate in situ Nd makes the important assumption that calculations of activated Nd using observations of vertical velocity, aerosol and chemical composition are representative of non-precipitating PBLCs. Numerous studies to date have shown that this approach, when carefully applied, can provide estimates of in-cloud droplet number for non-precipitating boundary layer clouds within a constrained uncertainty. For example, Conant et al. (2004) performed a droplet closure study, using a dataset of 21 cumulus clouds by the Center for Interdisciplinary Remotely-Piloted Aircraft Studies (CIRPAS) Twin Otter aircraft during NASA’s Cirrus Regional Study of Tropical Anvils and Cirrus Layers–Florida Area Cirrus Experiment (CRYSTAL-FACE), and evaluated the performance of the Nenes and Seinfeld (2003) parameterization against in situ observations. They found that the measured droplet concentration close to cloud base was within 15% of the predicted Nd. Meskhidze (2005), evaluated the revised parameterization of Fountoukis and Nenes (2005), against data from cumuliform clouds collected during NASA’s Cirrus Regional Study of Tropical Anvils and Cirrus Layers–Florida Area Cirrus Experiment (CRYSTAL-FACE, Key West, Florida, July 2002). On average, the predicted Nd was within 20% of observations at the base of cumuliform clouds, and within 30% of observations at different altitudes throughout the stratiform clouds; at the same time the observational uncertainty of Nd was estimated to be 30%. Fountoukis and Nenes (2007) evaluated the parameterization of Nenes and Seinfeld (2003) and Fountoukis and Nenes (2005) with data from 27 cumuliform and stratiform clouds sampled during the 2004 International Consortium for Atmospheric Research on Transport and Transformation (ICARTT) experiment. Droplet closure was achieved to within 20% of the measurements. Morales et al. (2011) also showed that considering lateral entrainment effects diagnosed from the diabaticity (diagnosed from the liquid water vertical profile) provides Nd to within 31% for non-precipitating convective clouds. Georgakaki et al. (2021), using a combination of wind lidar data and in situ aerosol measurements, predicted Nd for orographic clouds in the Swiss Alps during the RACLETS campaign that agreed with in situ observations to within 25%. We therefore apply this methodology to estimate droplet number in the clouds considered here, assuming an inherent method uncertainty of 30%.
The satellite retrievals of Ndsat of the PBLCs were performed using the algorithm of Bennartz (2007), which uses the principal cloud parameters (e.g., cloud effective radius (reff) and the cloud optical thickness (τ), along with a constant value of β. The explicit expression of β, which is related to Ndsat, can be obtained by modifying the Bennartz (2007) algorithm and solving this form numerically. Then, we examine the closure of the satellite retrieval algorithm by using the β-Nd relationships, called “β-expressions”, found in literature (M94—Martin et al., 1994; RL 03—Rotstayn and Liu, 2003; PL03—Peng and Lohmann, 2003; Z06—Zhao et al., 2006; GCMs—Rotstayn and Liu 2009; F12—Freud and Rosenfeld, 2012). Additionally, we propose a new β-expression which minimizes the closure error between Nd—Ndsat.
We obtained the parameters reff, τ and the cloud top pressure (Pct) from the Optimal Cloud Analysis (OCA) product (EUMETSAT, 2015) which is based on geostationary meteorological Meteosat Second Generation (MSG) satellite data. Moreover, we obtained the atmospheric pressure-temperature profiles from the fifth-generation European Center for Medium-range Weather Forecasts (ECMWF) reanalysis model data (ERA5) (Hersbach et al., 2018), in order to calculate the cloud top temperature (Tct) and the cloud top height (Hct) based on the cloud-top pressure Pct.
A detailed description of the proposed data analysis procedure is provided in Supplementary Figure S1.
2.1 Experimental site
Our observations took place at the Athens Metropolitan Area (AMA) in the Attica peninsula in Greece. The AMA is surrounded by four mountains: Egaleo (468 m), and Parnitha (1,413 m) to the northwest, Penteli (1,109 m) to the north and Hymettus (1,026 m) to the east, with a major opening to the sea on the south-western part (Saronikos Gulf). The AMA hosts a densely populated urban area of about 3.8 million inhabitants within about 2,928.7 km2. The study region, characterized by a complex topography as shown in Supplementary Figure S3, is located at the National Center for Scientific Research-Demokritos (NCSRD) station (37.995o N, 23.816o E, at 270 m above sea level-asl.) within the AMA on the foothills of mount Hymettus (Vratolis et al., 2020), about 8 km to the north of the Athens city center. NCSRD is a member of the World Meteorological Organisation (WMO) Global Atmospheric Watch (GAW) network, the Aerosol, Clouds and Trace Gases Research Infrastructure (ACTRIS) and the PANhellenic infrastructure for Atmospheric Composition and climatE chAnge (PANACEA).
The selected experimental site offers a great variety of aerosol types and meteorological conditions (Kostenidou et al., 2015; Vasilatou et al., 2017). The prevailing north winds transport continental polluted air masses to the AMA, mixed with local emissions along the Balkans-Aegean Sea axis (Diapouli et al., 2014; Vratolis et al., 2019). South winds are usually associated with the transport of marine aerosols, and, occasionally, with mineral dust from the Saharan desert (Diapouli et al., 2017; Soupiona et al., 2020), while under stagnant atmospheric conditions, locally-emitted anthropogenic aerosols dominate aerosol concentrations in the PBL (Kalogridis et al., 2018).
2.2 Case studies
We focus on the period between March and May 2020, where 5-day of data with PBLC formation are analyzed: 18, 28 March, and 01, 02, and 07 of April. These cases are summarized in Table 1.
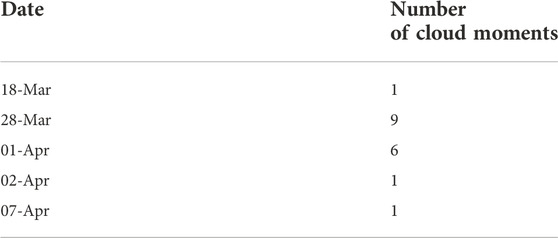
TABLE 1. Presence of clouds for 5 days:18, 28 March, and 01, 02, and 07 of April 2020.
2.3 Instrumentation
2.3.1 Scanning Mobility Particle Sizer
The SMPS consists of an electrostatic classifier (TSI Inc. Model 3,080), a cylindrical differential mobility analyzer column (TSI Inc., model 3,081) and a condensation particle counter (TSI Inc. model 3,772). The SMPS provided the aerosol size distributions with a temporal resolution of 5 min and was operated at an aerosol flow rate of 1 L per minute (lpm) and a sheath flow rate of 5 lpm, with the ability to measure the particle sizes from 10 to 550 nm. Sample and sheath flows were dried to a relative humidity (RH) lower than 40 % using Nafion driers before their introduction to the SMPS. Data acquisition and analysis were performed using the non-commercial TROPOS-SMPS data evaluation software (Wiedensohler et al., 2012), assuming that the particles are spherical so that their mobility and geometric diameters are equal. To achieve the highest measurement accuracy, the technical recommendations and quality control procedures proposed by Wiedensohler et al. (2012) were followed. The instrument was also calibrated against a reference SMPS system at the World Calibration Centre for Aerosol Physics (WCCAP) in 2018 (Bousiotis et al., 2021), exhibiting a counting accuracy within 10% for the size range 30–550 nm against a reference system under controlled laboratory conditions (Wiedensohler et al., 2012). The SMPS is also calibrated at the NCSRD station using polystyrene spheres with a size of 200 nm (Vratolis et al., 2020). The 5-min data were aggregated into time bins of 15 min, to be used as input to the droplet activation parameterization. The information about the accuracy of the aerosol particle size distribution can be found in the Supplement (c.f. Supplementary Figure S4), where the daily plot of the distributions is presented.
2.3.2 Time-of-flight-aerosol chemical speciation monitor
The ToF-ACSM provided by Aerodyne Inc. (Ng et al., 2011; Fröhlich et al., 2013) measures the non-refractory submicron aerosol mass and chemical composition (ammonium, sulfate, nitrate, chloride, and organics) in real-time (here, with 60 min time resolution), with a measurement uncertainty on the order of 30% (Budisulistiorini et al., 2014). The aerodynamic particle focusing lens is combined with particle flash vaporization in high vacuum and a hard electron impact ionization. The detection of the resulting ions is done by time-of-flight mass spectrometry. At ambient atmospheric conditions, the lens system focuses on the detection of submicron aerosols of ∼40–1,000 nm vacuum aerodynamic diameters. A collection efficiency factor CE = 0.5 (Zografou et al., 2022) was used to account for the fraction of the non-refractory particles that bounce off the vaporizer and are not detected. During the measurement period, the ambient air was drawn into the ToF-ACSM through a PM2.5 aerosol inlet. The inlet aerosol flow was dried to a RH lower than 40% by a Nafion dryer. More detailed information about the daily chemical composition can be found in the Supplement (c.f. Supplementary Figure S5).
2.3.3 Wind lidar system (HALO)
A pulsed Doppler scanning lidar system (StreamLine Wind Pro model, HALO Photonics) emitting at 1.565 μm was deployed at the NCSRD site by the Finnish Meteorological Institute (FMI). The system was operated in the stare vertical azimuth display mode. The laser backscattered signals mainly come from the laser-matter interactions from the micron-sized aerosols, which act as tracers of the wind flow over the sampled area. These time-resolved signals are then collected by a receiving telescope, digitized and processed to obtain the vertical profiles of the radial wind along the laser beam direction (Henderson et al., 2005) by measuring the Doppler frequency shift of the backscattered pulses compared to the emitted ones (Newsom and Krishnamurthy, 2020). The range resolution of the measurements is 30 m, the temporal resolution is 20 s for the stare mode, while the maximum measurement range is 2–3 km depending on the atmospheric aerosol load. The useful lidar signals are those which present a signal-to-noise-ratio (SNR) greater than 1.003. The corresponding uncertainty of the retrieved wind velocity range is 0.1–0.5 m s−1 for stare mode (Newsom and Krishnamurthy, 2020). From non-precipitating PBLC a rainfall filter was applied, by excluding possible rainy moments where the fall velocity was >4 m s−1. Typical PBL heights over the AMA (around 12:00 UTC) are of the order of 1,617 ± 324 m asl (Kokkalis et al., 2020). Therefore, as the retrieved vertical velocity data were confined within a height of 1,020 ± 60 m asl. the aerosols were always inside the PBL during daytime, and the updrafts were sampled at this height.
The vertical velocity data were then sampled in segments within a 4-h time moving window, and the positive updrafts were fit to a half-Gaussian PDF with a zero mean and standard deviation σw as follows:
The value of σw was determined every 15 min, for which the characteristic vertical velocity w* was obtained and used for calculating the droplet number concentration by the parameterization, as explained in section 2.4.3.
Additionally, we examined how the sampling time with a 1-, 2- and 4-h window affects the calculated value of σw; in all cases the value of σw was found not to change the Nd value more than the inherent uncertainty of 30% for the in situ Nd estimation. Based on this, we chose the 4-h segments to ensure sufficient sampling of the PDF (about 400 updraft velocities per PDF).
2.4 Modelling and data preprocessing
2.4.1 ECMWF reanalysis (ERA5)
We use the ECMWF Reanalysis fifth Generation (ERA5) hourly temperature and specific humidity data on 37 pressure levels (1,000 hPa to 1 hPa) at a resolution of 0.25 × 0.25 (Hersbach et al., 2018). For this study, we estimate the T- and q-profiles at the site using a weighted average of the surrounding grid-points. Moreover, a linear interpolation for every pressure level was applied on each variable to produce a 15-min timeseries that is compatible with the satellite timeseries. To link Pct with the Hct and Tct, used subsequently for cloud detection and inversion, we apply the hypsometric equation to the grid level quantities of T and q to express their vertical profiles.
2.4.2 Hygroscopicity and CCN concentration
The particle hygroscopicity parameter (κ) (Petters and Kreidenweis, 2007) characterizes the ability of particles to absorb water vapor during the formation of cloud droplets, and is required for calculating CCN concentrations. The value of κ is estimated from ACSM measurements as follows: the ion concentrations of ammonium, sulfate, nitrate, chloride, and organics are converted to inorganic salt mixtures using the simplified ion-pairing scheme of Q-AMS model (Gysel et al., 2007), and the mole number of NH4NO3, NH4HSO4 (NH4)2SO4, H2SO4 and organic aerosols, respectively. The value of κ is calculated using the volume fraction-averaged hygroscopicity of each organic and inorganic salt in the aerosol (Petters and Kreidenweis, 2007), with κ being 0.68 for NH4NO3, 0.56 for NH4HSO4, 0.53 for (NH4)2SO4, (Petters and Kreidenweis, 2007), 0.97 for H2SO4 (Biskos et al., 2009) and 0.1 for organic aerosol (Duplissy et al., 2011). Aerosol types often have characteristic values of κ; for example, low values between 0.1–0.2 are associated with organic-rich aerosol (such as biogenic or biomass burning aerosol), ∼0.35 with continental aerosol–which is often a ∼50/50 mixture of organic species and inorganic salts with a hygroscopicity close to that of (NH4)2SO4 (∼0.6) (Petters and Kreidenweis, 2007). The κ timeseries is calculated on an hourly basis. We also examined the importance of constraining the uncertainty of organic κ; which equals δκorg = ± 0.064 (Duplissy et al., 2011), and we found that the propagated error into the overall κ gives a total uncertainty of ± 0.035.
The CCN at a water vapor supersaturation level s is determined by integrating the particle size distribution from the smallest activated particle with a “critical dry diameter”, Dcr, up to the largest particle size measured by the SMPS, i.e.,
2.4.3 Droplet activation parameterization
The physically-based aerosol activation parameterization (Nenes and Seinfeld, 2003), with extensions introduced by Fountoukis and Nenes (2005), Barahona et al. (2010) and Morales Betancourt and Nenes (2014) is used to calculate the droplet number that would form in PBLCs, from knowledge of the wind vertical velocity and the aerosol characteristics. The parameterization solves the equations that describe droplet formation in an ascending air parcel containing aerosols and water vapor, specifically at the point where supersaturation becomes maximum, smax; Nd is then equal to the number of CCN with critical supersaturation less than smax (Nenes et al., 2001). The parameterization uses as inputs the pressure and the temperature, the aerosol size distribution data from the SMPS, the hygroscopicity parameter κ derived from the ACSM data and the updraft velocities from HALO. Given that aerosol measurements are carried out at ground level, we convert the concentrations to cloud top conditions using the ideal gas law.
As the droplet number depends strongly on the vertical velocity, which in turn varies considerably in the PBL over time, we compute the Nd that characterizes PBLCs–being a weighted average over the PDF of vertical velocities, by using the characteristic velocity, w* according to the approach of Morales and Nenes (2010). This approach is valid for boundary layers that are not influenced by deep convection, hence are on average characterized by a mean velocity of a few cm s−1 (the typical speed of boundary layer ascent/descent over a diurnal cycle). The PDF-averaging approach with a Gaussian PDF and the usage of the w*, has been shown to successfully predict cloud-scale values of Nd in field studies for cumulus and stratocumulus clouds (e.g., Conant et al., 2004; Meskhidze, 2005; Fountoukis and Nenes, 2007; Kacarab et al., 2020; Georgakaki et al., 2021).
Another significant parameter taken into account was the role of the lateral entrainment, meaning the mixing of dry air in the ascending cloudy air parcel. Entrainment effects can be significant for cumulus and convective clouds (much less for stratocumulus), affecting the vertical distribution of liquid water and number of droplets (Morales et al., 2011). Given that the clouds studied here are cumuliform, we consider the modest impact of entrainment effects on droplet number using the approach of Barahona and Nenes (2007) and Morales et al. (2011); this entails using an adiabatic activation parameterization, and reducing the vertical velocity that causes activation by a factor, called “entrainment parameter”, that depends on the entrainment rate (which in effect captures the reduction in maximum supersaturation from mixing of dry air, compared to adiabatic droplet formation). Barahona and Nenes (2007) and Morales et al. (2011), concluded that the best approach for the entrainment parameter is based on the adiabaticity (i.e., deviation of the vertical water profile from the adiabatic value). Morales et al. (2011) calculated the entrainment parameter for a number of clouds sampled during the CRYSTAL-FACE (Key West, Florida, July 2002) and CSTRIPE (Monterey, California, July 2003) missions–which on average gave a parameter value of 0.68 (see data in Table 2 of Morales et al., 2011). Assuming this mixing parameter is applied uniformly to the vertical velocity distribution, we therefore consider the effects of lateral entrainment in the cumuliform cloud sampled by multiplying the characteristic velocity for adiabatic activation w* by 0.68.
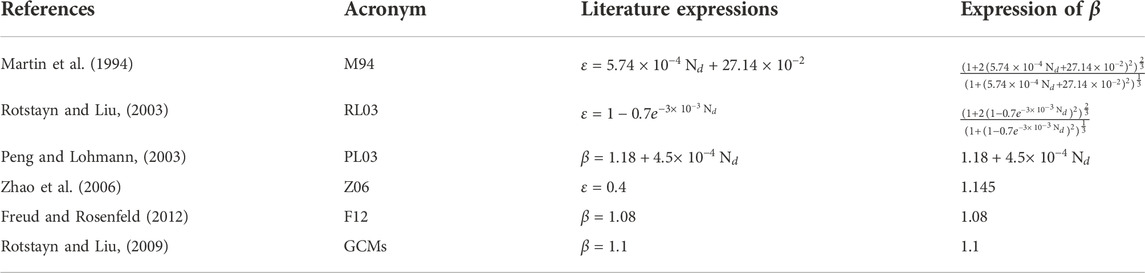
TABLE 2. β-expressions based on literature according to: 1) Martin et al. (1994)—M94, b) Rotstayn and Liu (2003)—PL03, c) Peng and Lohmann, (2003)—PL03, Zhao et al. (2006)—Z06, d) Freud and Rosenfeld (2012)—F12 and e) GCMs studies–Rotstayn and Liu (2009), respectively.
According to Morales and Nenes (2010), the calculation of w* (for diabatic activation) is obtained by multiplying σw with a parameter λ that depends on the type of aerosol found in the cloudy updraft. For continental aerosol with a concentration range between 1,000–10000 cm−3, λ equals to 0.67 (see Figure 2A of Morales and Nenes (2010)) with an uncertainty 0.02, which we apply to our calculations. Given the above considerations, the characteristic vertical velocity w* used for calculating droplet formation (and used to estimate in situ Nd) is given by
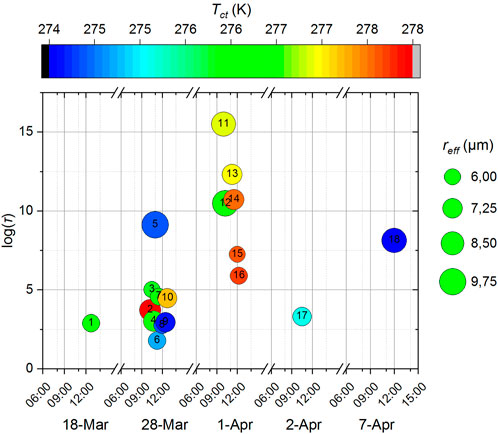
FIGURE 2. The τ, reff provided by OCA against with Tct, which is calculated via the ERA5 T-Profile, for the clouds studied; the labeling refers to the serial number of each cloud (c.f. Supplementary Figure S1).
Another important parameter to consider is the “limiting droplet number”, Ndlim, at cloud top, which helps to estimate the degree to which clouds are susceptible to changes in aerosol content. Ndlim is obtained from the relationship given by Georgakaki et al. (2021):
where Ndlim is expressed in cm−3, and σw in m s−1.
Figure 1A presents the timeseries of total aerosol concentration (Naer) integrated over the SMPS size distributions, and σw, with the symbols colored by κ, for the period 18 March to 07 April 2020, while Figure 1B presents the corresponding Nd values with the symbols colored by Nd/Ndlim.
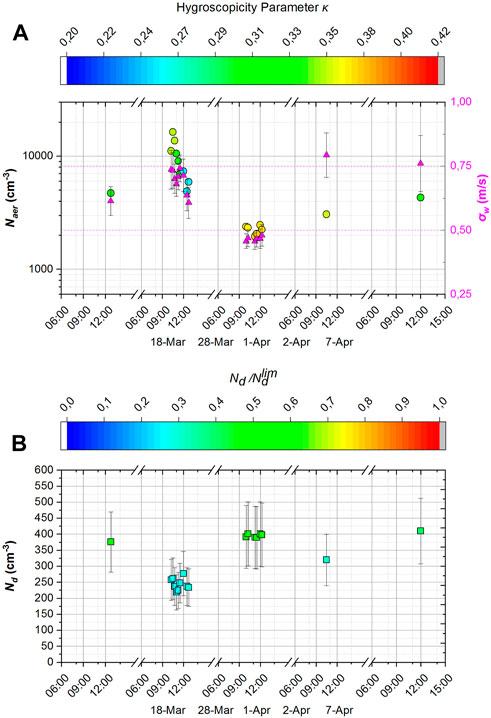
FIGURE 1. (A) Timeseries of Naer versus κ and σw values, for the period 18 March to 07 2 April0,230. (B) The corresponding in situ derived Nd values colored by the ratio Nd/Ndlim as derived by the parameterization.
The periods of weaker turbulence (low σw, Figure1A) forces Nd to persistently approach Ndlim (e.g., Figure1B, 01 April 2020). As a result, the droplet formation is strongly velocity limited, and tends to be insensitive to aerosol variations. The opposite is seen when Nd/Ndlim < 0.5, as droplet formation becomes aerosol limited and less sensitive to σw variations.
2.4.4 Effective radius factor β
The use of β, which is defined as the ratio of the reff to the volume mean radius of cloud droplets, was introduced to mitigate the bias known as “dispersion effect”, related to the width of the cloud droplet size spectrum, and combined with the average droplet radius, to give the correct cloud optical depth. According to Liu and Daum (2002), β is related to the relative dispersion of the droplet spectrum (ε) as:
Ιn the literature there are several studies attempting to quantify ε. Martin et al. (1994), using aircraft observations of the microphysical characteristics of warm marine stratocumulus clouds from the eastern Pacific, South Atlantic, subtropical regions of the North Atlantic, and the sea areas around the British Isles, proposed an expression of
Freud and Rosenfeld (2012), using measurements of cloud droplet size distribution in various locations, found an average value of β equal to 1.08, as indicated by the line of best fit between
2.4.5 Satellite remote sensing—Optimal Cloud Analysis product and droplet number
The OCA product determined from EUMETSAT (EUMETSAT, 2015) provides τ, reff and Pct accompanied with their errors δτ, δreff and δPct with a spatial resolution of 3.6 km × 4.6 km for the study region, as derived from SEVIRI onboard the geostationary meteorological satellite (METEOSAT) with a temporal resolution of 15 min.
The OCA algorithm uses a synergy of data to calculate the cloud parameters; however, there are always assumptions which have consequent limitations affecting the accuracy of reff and τ. According to the description of the OCA algorithm (EUMETSAT, 2015), the algorithm utilizes the land surface reflection, along with other model parameters derived from the Numerical Weather Prediction sources.
In Figure 2 we summarize the τ, Tct, and reff which were used as input to the satellite algorithm (c.f. Eq. 6) to retrieve the Ndsat data. Additionally, we exclude from the dataset cases that involve high or multi-layer clouds, and isolate the PBL clouds by excluding clouds with Pct lower than 800 hPa. Moreover, we applied a parallax correction, according to Koenig (2020), for each detected cloud based on Hct in order to calculate the true geolocation of each cloud and then, we isolated the clouds that are collocated over our measuring site. This step helps to correct the displacement that is created due to the satellite angle of view, along with Hct.
According to Zhu et al. (2018), who further developed the Bennartz (2007) algorithm, Ndsat, can be determined as:
in which
Moreover, we calculated the propagation error δNdsat of Nd by using the Chain rule to the Eq. 4, which corresponds to the diffusional error due to each variable to the Ndsat retrieval, as follows:
in which the terms
We note here that
For expressions where β depends on Ndsat, β(Ndsat), the retrieval Eq. 4 can be modified as follows:
where Ndsat is determined from the numerical solution of Eq. 6 using the β(Ndsat) expressions in Table 2. We discard the less reliable retrievals when the droplet uncertainty is significant, which correspond to the solutions of Eq. 6 having δNdsat > 600 cm−3, δNdsat/Ndsat > 0.5, Ndsat > 2000 cm−3, or Ndsat<100 cm−3.
Finally, we performed closure studies between the accepted solutions of Ndsat using each literature based β-expression, against estimations of in situ derived Nd from the parameterization (section 2.4.3). By using the M94, RL03, PL03, Z06, GCMs, and F12 expressions (Table 2), the corresponding averaged mean normalized bias (MNB) between Ndsat and estimations of in situ Nd is equal to -17.37% ± 32.66%, 51.34% ± 69.25%, 23.51% ± 56.09%, -21.25% ± 24.91%, -28.80% ± 22.52%, and -31.99% ± 21.51%, respectively (c.f. Figure 4B and Table 3).
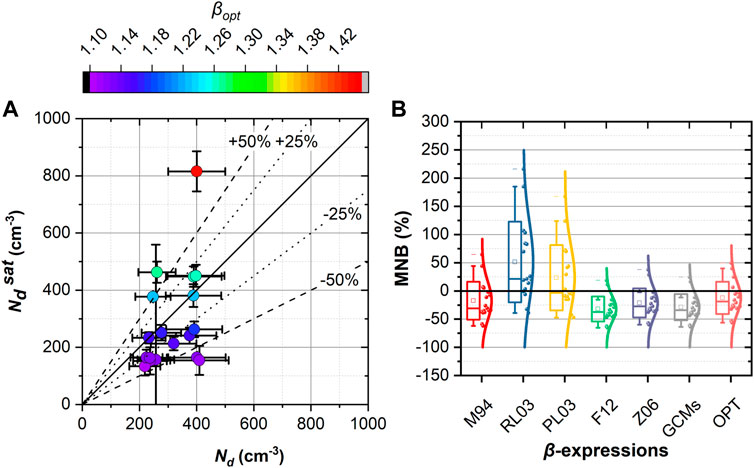
FIGURE 4. (A) Droplet number closure between Nd and Ndsat using the OPT compared to Nd in respect of βopt on the colorscale; (B) The MNB of the closure of Ndsat _ Nd by using each β-expression: (I) M94, ii) RL03, iii) PL03, iv) F12, v) Z06, vi) GCMs, and vii) OPT, respectively.
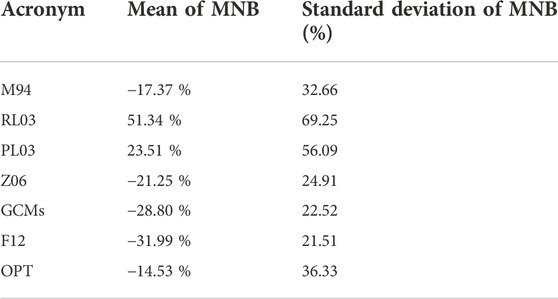
TABLE 3. Statistics of the performance of the closure study of Ndsat _ Nd for each β-expression used: OPT, RL03, M94, Z06, PL03, GCMs, and F12.
Therefore, in the case of using a constant value of β, such as Z06, GCMs, and F12, the Ndsat values tend to be underestimated, since the estimated mean bias is of the order of 28%, while the standard deviation is reduced by 23% on average. On the other hand, by using the PL03 expression, the Ndsat is overestimated, although comparable with those values derived when expressions of constant value of β are used (Z06, GCMs, and F12), with increased standard deviation values. In case of using the M94 explicit relation, Ndsat is underestimated, but the mean bias is reduced by almost a factor of two, but with an increase in the standard deviation. Usage of the RL03 relation provides Ndsat values that are considerable overestimated along with their standard deviation (c.f. Supplementary Figure S12), while the MNBs presented in box plots can be found in Figure 4B.
Concluding, that the use of a constant value of β (or ε equivalently) or a linear relation between β and Ndsat improves the closure error, we determined optimal parameters for a linear relationship between β and Ndsat which minimizes the error with respect to the estimated in situ Nd (section 3).
3 Results and discussion
We determined the β values from Eq. 7, using each derived values of Νd and the corresponding values c(cw), τ, reff as follows:
We then fit the β and Nd data to a linear relationship, βopt = a + b Nd, to determine the “optimal β-expression” (OPT). According to Bevington et al. (1993) we used a weighted linear interpolation method, which considers both δβ (calculated by using the Chain rule on Eq. 7) and δNd (δΝd = 0.25Νd from Morales and Nenes (2010)) of each β and Nd datum, to determine the OPT.
The coefficients of OPT, a and b were estimated to be equal to 1.0421 ± 0.1979, and 4.8717 10–4 ± 6.1084 10–4, respectively (Figure 3), while the average δβopt was estimated to be equal to 0.28 for the whole dataset. Additionally, we calculated the p-value and R-value of the fit and found equal to 0.089 and 0.412, respectively, while the fitting confidence R2 was found equal to ∼0.17.
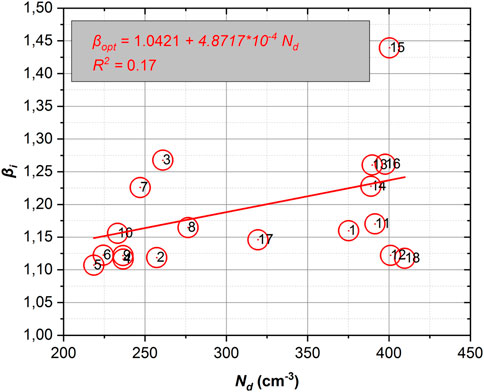
FIGURE 3. The linear interpolations over the β-Nd data for the diabatic derived Nd; the labeling refers to the serial number of each cloud (c.f. Supplementary Figure S1).
Then, we applied the OPT expression into Eq. 6, to calculate the solutions of Ndsat, while we disregarded the solutions where δβopt > 1, δβopt/βopt > 0.5, βopt > 2, and βopt < 1.
Finally, we validated the accepted solutions in respect of the Nd. The results of this closure is presented in Figure 4A.
Additionally, we present the MNB boxplots, using the literature based β-expressions (M94, RL03, PL03, Z06, RL09, and F12), versus our proposed expression (OPT) in Figure 4B.
Based on the results presented in Figure 4B and Table 3, we see that the proposed β-expression OPT exhibits the lowest mean MNB value (14.53%) with a standard deviation 36.33%. The performance of each β-expression can be ranked by their MNB values, as follows: OPT (−14.53%), M94 (−17.37%), Z06 (−21.25%), PL03 (23.51), GCMs (−28.80%), F12 (−31.99%), and RL03 (51.34%) (see also Table 3) along with the resulting standard deviation values (expressed as length of the box in the vertical axis) of MNB (c.f. Figure 4B).
It is important to note here, that the OPT expression coefficients are quite close to those proposed by Peng and Lohmann (2003), although the latter provide a degree of closure with twice the bias and standard deviation compared to the OPT expression. This suggests that the Peng and Lohmann (2003) and OPT parameters is appropriate for cloud types such as those sampled in our study, and, that the methodology adopted here to estimate in situ Nd is realistic.
4 Conclusion
The study presented here expands an established droplet number retrieval algorithm for non-precipitating PBLCs (Bennartz (2007) to explicitly account for the spectral dispersion of droplets and its dependence on droplet number in terms of β. The revised algorithm uses the cloud microphysical variables τ and reff, as derived from SEVIRI onboard the geostationary meteorological satellite (METEOSAT) with a temporal resolution of 15 min and with a spatial resolution 3.6 km × 4.6 km, along with an improved calculation of the total condensation rate (Zhu et al., 2018) with respect to cloud top height which can be obtained by using the ERA5 atmospheric pressure-temperature profiles (Hersbach et al., 2018). We found that the optimal retrieval of Ndsat is most sensitive to biases of the β values, rather than biases in τ and reff, pointing to the need for an optimal β-expression for the most accurate Ndsat retrievals.
We then calculated the retrieved Ndsat values by using the literature-based β-expressions and we evaluated them against the in situ Nd estimations obtained by the droplet activation parameterization of the Nenes and Seinfeld (2003). We found that droplet number is captured to within ± 29% and ± 61%; based on these results we see that by using a constant value of β, or a linear relation between ε or β to Ndsat, such as PL03, Z06, GCMs, and F12, the Ndsat is captured to within ± 35%. Additionally, we proposed a new β-Nd expression, based on the in situ Nd estimations, that optimizes the closure between Ndsat and Nd within ± 33%. Furthermore, the new β-expression we obtained through the optimal fit between Ndsat and Nd is remarkably similar to the PL03 relationship. Given that, the PL03 relationship derived from observation data suggests that our method to estimate Nd is realistic. The use of either RL03 or our optimized relationship, captures droplet number to within 30%, which is comparable to the closure levels obtained from in situ observations.
Although more work needs to be done to evaluate the extent to which our approach can be applied elsewhere in the globe, the results presented here are both encouraging and may suggest ways to develop high-value products for climate models that can take advantage of the rich ground-based aerosol datasets available to the community.
Data availability statement
The raw data supporting the conclusion of this article will be made available by the authors, without undue reservation.
Author contributions
Conceptualization, RF, AN, and AP; methodology, RF, AN, and PG; data analysis, RF, AN, MK, SV, VV, and PK; model simulations, RF, AN; investigation RF, AN, and PG; writing—original draft preparation, RF, AN, AP, and PG; review and editing, RF, AN, AP, PG, KE, MK, and MG; visualization, RF; supervision, RF, AN, and AP; All authors have read and agreed to the published version of the manuscript.
Funding
This research was funded jointly by the PANhellenic infrastructure for Atmospheric Composition and climatE change (PANACEA) research project (MIS 5021516), implemented under the Action Reinforcement of the Research and Innovation Infrastructure, and the Operational Program Competitiveness, Entrepreneurship, and Innovation (NSRF 2014–2020), co-financed by Greece and the European Union (European Regional Development Fund). Additional funding was received from the European Research Council, CoG-2016 project PyroTRACH (726165) funded by H2020-EU.1.1.—Excellent Science, and from the European Union Horizon 2020 project FORCeS under grant agreement No 821205. Open access funding provided by École Polytechnique Fédérale de Lausanne.
Acknowledgments
The authors also acknowledge the NOAA Air Resources Laboratory (ARL) for the provision of the HYSPLIT transport model; the Finnish Meteorological Institute (FMI) for providing the HALO lidar; the NCSRD for hosting the HALO lidar. ERA5 data were generated using Copernicus Climate Change Service Information and Cloud Optimal Analysis (OCA) products were provided from EUMETSAT. Neither the European Commission nor the ECMWF are responsible for any use that maybe made of the Copernicus information or data in this publication (https://cds.climate.copernicus.eu/cdsapp#!/dataset/reanalysis-era5-pressure-levels?tab = form; last access: 13 July 2021). Part of this work was financed by the Basic Research Program, NTUA (PEVE) under contract PEVE0011/2021.
Conflict of interest
The authors declare that the research was conducted in the absence of any commercial or financial relationships that could be construed as a potential conflict of interest.
Publisher’s note
All claims expressed in this article are solely those of the authors and do not necessarily represent those of their affiliated organizations, or those of the publisher, the editors and the reviewers. Any product that may be evaluated in this article, or claim that may be made by its manufacturer, is not guaranteed or endorsed by the publisher.
Supplementary material
The Supplementary Material for this article can be found online at: https://www.frontiersin.org/articles/10.3389/frsen.2022.958207/full#supplementary-material
References
Barahona, D., and Nenes, A. (2007). Parameterization of cloud droplet formation in large-scale models: Including effects of entrainment. J. Geophys. Res. 112, D16206. doi:10.1029/2007JD008473
Barahona, D., West, R. E. L., Stier, P., Romakkaniemi, S., Kokkola, H., and Nenes, A. (2010). Comprehensively accounting for the effect of giant CCN in cloud activation parameterizations. Atmos. Chem. Phys. 10, 2467–2473. doi:10.5194/acp-10-2467-2010
Bennartz, R. (2007). Global assessment of marine boundary layer cloud droplet number concentration from satellite. J. Geophys. Res. 112, D02201. doi:10.1029/2006JD007547
Bevington, P. R., Robinson, D. K., Blair, J. M., Mallinckrodt, A. J., and McKay, S. (1993). Data reduction and error analysis for the physical sciences. Comput. Phys. 7 (4), 415. doi:10.1063/1.4823194
Biskos, G., Buseck, P. R., and Martin, S. T. (2009). Hygroscopic growth of nucleation-mode acidic sulfate particles. J. Aerosol Sci. 40, 338–347. doi:10.1016/j.jaerosci.2008.12.003
Bougiatioti, A., Nenes, A., Lin, J. J., Brock, C. A., De Gouw, J. A., Liao, J., et al. (2020). Drivers of cloud droplet number variability in the summertime in the southeastern United States. Atmos. Chem. Phys. 20, 12163–12176. doi:10.5194/acp-20-12163-2020
Bousiotis, D., Brean, J., Pope, F. D., Dall’Osto, M., Querol, X., Alastuey, A., et al. (2021). The effect of meteorological conditions and atmospheric composition in the occurrence and development of new particle formation (NPF) events in Europe. Atmos. Chem. Phys. 21, 3345–3370. doi:10.5194/acp-21-3345-2021
Brenguier, J.-L., Pawlowska, H., Schüller, L., Preusker, R., Fischer, J., and Fouquart, Y. (2000). Radiative properties of boundary layer clouds: Droplet effective radius versus number concentration. J. Atmos. Sci. 57, 803–821. doi:10.1175/1520-0469(2000)057<0803:rpoblc>2.0.co;2
Budisulistiorini, S. H., Canagaratna, M. R., Croteau, P. L., Baumann, K., Edgerton, E. S., Kollman, M. S., et al. (2014). Intercomparison of an aerosol chemical speciation monitor (ACSM) with ambient fine aerosol measurements in downtown Atlanta, Georgia. Atmos. Meas. Tech. 7, 1929–1941. doi:10.5194/amt-7-1929-2014
Chen, J., Liu, Y., Zhang, M., and Peng, Y. (2016). New understanding and quantification of the regime dependence of aerosol-cloud interaction for studying aerosol indirect effects. Geophys. Res. Lett. 43, 1780–1787. doi:10.1002/2016GL067683
Chen, J., Liu, Y., Zhang, M., and Peng, Y. (2018). Height dependency of aerosol-cloud interaction regimes. J. Geophys. Res. Atmos. 123, 491–506. doi:10.1002/2017JD027431
Conant, W. C., VanReken, T. M., Rissman, T. A., Varutbangkul, V., Jonsson, H. H., Nenes, A., et al. (2004). Aerosol-cloud drop concentration closure in warm cumulus. J. Geophys. Res. 109. doi:10.1029/2003JD004324
Diapouli, E., Popovicheva, O., Kistler, M., Vratolis, S., Persiantseva, N., Timofeev, M., et al. (2014). Physicochemical characterization of aged biomass burning aerosol after long-range transport to Greece from large scale wildfires in Russia and surrounding regions, Summer 2010. Atmos. Environ. 96, 393–404. doi:10.1016/j.atmosenv.2014.07.055
Diapouli, E., Manousakas, M. I., Vratolis, S., Vasilatou, V., Pateraki, S., Bairachtari, K. A., et al. (2017). AIRUSE-LIFE +: Estimation of natural source contributions to urban ambient air PM10 and PM2.5 concentrations in southern Europe - implications to compliance with limit values. Atmos. Chem. Phys. 17, 3673–3685. doi:10.5194/acp-17-3673-2017
Duplissy, J., DeCarlo, P. F., Dommen, J., Alfarra, M. R., Metzger, A., Barmpadimos, I., et al. (2011). Relating hygroscopicity and composition of organic aerosol particulate matter. Atmos. Chem. Phys. 11, 1155–1165. doi:10.5194/acp-11-1155-2011
EUMETSAT (2015). Optimal cloud analysis product guide. Available at: www.eumetsat.int (Accessed January 1, 2022).
Feingold, G., Remer, L. A., Ramaprasad, J., and Kaufman, Y. J. (2001). Analysis of smoke impact on clouds in Brazilian biomass burning regions: An extension of Twomey’s approach. J. Geophys. Res. 106, 22907–22922. doi:10.1029/2001JD000732
Fountoukis, C., and Nenes, A. (2005). Continued development of a cloud droplet formation parameterization for global climate models. J. Geophys. Res. 110, D11212. doi:10.1029/2004JD005591
Fountoukis, C., and Nenes, A. (2007). ISORROPIA II: a computationally efficient thermodynamic equilibrium model for K+–Ca2+–Mg2+–NH4+–Na+–SO42–NO3–Cl−H2O aerosols. Atmos. Chem. Phys. 7, 4639–4659. doi:10.5194/acp-7-4639-2007
Freud, E., and Rosenfeld, D. (2012). Linear relation between convective cloud drop number concentration and depth for rain initiation. J. Geophys. Res. 117, 3–13. doi:10.1029/2011JD016457
Fröhlich, R., Cubison, M. J., Slowik, J. G., Bukowiecki, N., Prévôt, A. S. H., Baltensperger, U., et al. (2013). The ToF-ACSM: a portable aerosol chemical speciation monitor with TOFMS detection. Atmos. Meas. Tech. 6, 3225–3241. doi:10.5194/amt-6-3225-2013
Georgakaki, P., Bougiatioti, A., Wieder, J., Mignani, C., Ramelli, F., Kanji, Z. A., et al. (2021). On the drivers of droplet variability in alpine mixed-phase clouds. Atmos. Chem. Phys. 21, 10993–11012. doi:10.5194/acp-21-10993-2021
Ghan, S. J., Guzman, G., and Abdul-Razzak, H. (1998). Competition between sea salt and sulfate particles as cloud condensation nuclei. J. Atmos. Sci. 55, 3340–3347. doi:10.1175/1520-0469(1998)055<3340:cbssas>2.0.co;2
Gysel, M., Crosier, J., Topping, D. O., Whitehead, J. D., Bower, K. N., Cubison, M. J., et al. (2007). Closure study between chemical composition and hygroscopic growth of aerosol particles during TORCH2. Atmos. Chem. Phys. 7, 6131–6144. doi:10.5194/acp-7-6131-2007
Henderson, S. W., Gatt, P., Rees, D., and Huffaker, R. M. (2005). “Wind lidar,” in Laser remote sensing. Editors T. Fujii, and T. Fukuchi (Boca Raton, FL: CRC Press, Taylor and Francis Group), 469–722.
Hersbach, H., Bell, B., Berrisford, P., Biavati, G., Horányi, A., Sabater Muñoz, J., et al. (2018). ERA5 hourly data on pressure levels from 1979 to present. Copernicus Climate Change Service (C3S) Climate Data Store (CDS). (Accessed on January 01, 2021).
IPCC (2021). Climate change 2021: The physical science basis, the working group I contribution to the sixth assessment report | UNEP - UN environment Programme. Available at: https://www.unep.org/resources/report/climate-change-2021-physical-science-basis-working-group-i-contribution-sixth (Accessed January 10, 2022).
Kacarab, M., Thornhill, K. L., Dobracki, A., Howell, S. G., O’Brien, J. R., Freitag, S., et al. (2020). Biomass burning aerosol as a modulator of the droplet number in the southeast Atlantic region. Atmos. Chem. Phys. 20, 3029–3040. doi:10.5194/acp-20-3029-2020
Kalogridis, A.-C., Vratolis, S., Liakakou, E., Gerasopoulos, E., Mihalopoulos, N., and Eleftheriadis, K. (2018). Assessment of wood burning versus fossil fuel contribution to wintertime black carbon and carbon monoxide concentrations in Athens, Greece. Atmos. Chem. Phys. 18, 10219–10236. doi:10.5194/acp-18-10219-2018
Koenig, M. (2020). Description of the parallax correction functionality. Available at: https://cwg.eumetsat.int/parallax-corrections/(Accessed January 1, 2022).
Köhler, H. (1936). The nucleus in and the growth of hygroscopic droplets. Trans. Faraday Soc. 32, 1152–1161. doi:10.1039/TF9363201152
Kokkalis, P., Alexiou, D., Papayannis, A., Rocadenbosch, F., Soupiona, O., Raptis, P-L., et al. (2020). Application and testing of the Extended-Kalman-Filtering technique for determining the planetary boundary-layer height over athens, Greece. Bound.-Layer Meteorol. 176, 125–147. doi:10.1007/s10546-020-00514-z
Kostenidou, E., Florou, K., Kaltsonoudis, C., Tsiflikiotou, M., Vratolis, S., Eleftheriadis, K., et al. (2015). Sources and chemical characterization of organic aerosol during the summer in the eastern Mediterranean. Atmos. Chem. Phys. 15, 11355–11371. doi:10.5194/acp-15-11355-2015
Liu, Y., and Daum, P. H. (2002). Indirect warming effect from dispersion forcing. Nature 419 (6907), 580–581. doi:10.1038/419580a
Liu, Y., Daum, P. H., and Lu, C. (2014). Comment on “Cloud droplet spectral width relationship to CCN spectra and vertical velocity” by Hudson et al. J. Geophys. Res. Atmos. 119, 1874–1877. doi:10.1002/2012JD019207
Martin, G. M., Johnson, D. W., and Spice, A. (1994). The measurement and parameterization of effective radius of droplets in warm stratocumulus clouds. J. Atmos. Sci. 51, 1823–1842. doi:10.1175/1520-0469(1994)051<1823:tmapoe>2.0.co;2
Meskhidze, N. (2005). Dust and pollution: A recipe for enhanced ocean fertilization? J. Geophys. Res. 110, D03301. doi:10.1029/2004JD005082
Morales Betancourt, R., and Nenes, A. (2014). Droplet activation parameterization: the population splitting concept revisited. Geosci. Model Dev. Discuss. 7, 2903–2932. doi:10.5194/gmdd-7-2903-2014
Morales, R., and Nenes, A. (2010). Characteristic updrafts for computing distribution-averaged cloud droplet number and stratocumulus cloud properties. J. Geophys. Res. 115, D18220. doi:10.1029/2009JD013233
Morales, R., Nenes, A., Jonsson, H., Flagan, R. C., and Seinfeld, J. H. (2011). Evaluation of an entraining droplet activation parameterization using in situ cloud data. J. Geophys. Res. 116, D15205. doi:10.1029/2010JD015324
Nenes, A., and Seinfeld, J. H. (2003). Parameterization of cloud droplet formation in global climate models. J. Geophys. Res. 108, 4415. doi:10.1029/2002JD002911
Nenes, A., Ghan, S., Abdul-Razzak, H., Chuang, P. Y., and Seinfeld, J. H. (2001). Kinetic limitations on cloud droplet formation and impact on cloud albedo. Tellus B Chem. Phys. Meteorol. 53, 133–149. doi:10.3402/tellusb.v53i2.16569
Newsom, R., and Krishnamurthy, R. (2020). Doppler lidar (DL) instrument handbook. U.S. Department of Energy, Office of Science, DOE/SC-ARM-TR-101. Available at: https://www.arm.gov/publications/tech_reports/handbooks/dl_handbook.pdf (Accessed November 16, 2022).
Ng, N. L., Herndon, S. C., Trimborn, A., Canagaratna, M. R., Croteau, P. L., Onasch, T. B., et al. (2011). An aerosol chemical speciation monitor (ACSM) for routine monitoring of the composition and mass concentrations of ambient aerosol. Aerosol Sci. Technol. 45, 780–794. doi:10.1080/02786826.2011.560211
Peng, Y., and Lohmann, U. (2003). Sensitivity study of the spectral dispersion of the cloud droplet size distribution on the indirect aerosol effect. Geophys. Res. Lett. 30. doi:10.1029/2003gl017192
Petters, M. D., and Kreidenweis, S. M. (2007). A single parameter representation of hygroscopic growth and cloud condensation nucleus activity. Atmos. Chem. Phys. 7, 1961–1971. doi:10.5194/acp-7-1961-2007
Quaas, J., Arola, A., Cairns, B., Christensen, M., Deneke, H., Ekman, A. M. L., et al. (2020). Constraining the Twomey effect from satellite observations: Issues and perspectives. Atmos. Chem. Phys. 20, 15079–15099. doi:10.5194/acp-20-15079-2020
Reutter, P., Su, H., Trentmann, J., Simmel, M., Rose, D., Gunthe, S. S., et al. (2009). Aerosol- and updraft-limited regimes of cloud droplet formation: influence of particle number, size and hygroscopicity on the activation of cloud condensation nuclei (CCN). Atmos. Chem. Phys. 9, 7067–7080. doi:10.5194/acp-9-7067-2009
Rosenfeld, D., Zheng, Y., Hashimshoni, E., Pöhlker, M. L., Jefferson, A., Pöhlker, C., et al. (2016). Satellite retrieval of cloud condensation nuclei concentrations by using clouds as CCN chambers. Proc. Natl. Acad. Sci. U. S. A. 113, 5828–5834. doi:10.1073/pnas.1514044113
Rotstayn, L. D., and Liu, Y. (2003). Sensitivity of the first indirect aerosol effect to an increase of cloud droplet spectral dispersion with droplet number concentration. J. Clim. 16, 3476–3481. doi:10.1175/1520-0442(2003)016<3476:sotfia>2.0.co;2
Rotstayn, L. D., and Liu, Y. (2009). Cloud droplet spectral dispersion and the indirect aerosol effect: Comparison of two treatments in a GCM. Geophys. Res. Lett. 36, L10801. doi:10.1029/2009GL038216
Seinfeld, J. H., Bretherton, C., Carslaw, K. S., Coe, H., DeMott, P. J., Dunlea, E. J., et al. (2016). Improving our fundamental understanding of the role of aerosol-cloud interactions in the climate system. Proc. Natl. Acad. Sci. U. S. A. 113, 5781–5790. doi:10.1073/pnas.1514043113
Soupiona, O., Papayannis, A., Kokkalis, P., Foskinis, R., Sánchez Hernández, G., Ortiz-Amezcua, P., et al. (2020). EARLINET observations of Saharan dust intrusions over the northern mediterranean region (2014–2017): Properties and impact on radiative forcing. Atmos. Chem. Phys. 20, 15147–15166. doi:10.5194/acp-20-15147-2020
Stevens, B., and Feingold, G. (2009). Untangling aerosol effects on clouds and precipitation in a buffered system. Nature. 461, 607–613. doi:10.1038/nature08281
Sullivan, S. C., Lee, D., Oreopoulos, L., and Nenes, A. (2016). Role of updraft velocity in temporal variability of global cloud hydrometeor number. Proc. Natl. Acad. Sci. U. S. A. 113, 5791–5796. doi:10.1073/pnas.1514039113
Twomey, S., and Warner, J. (1967). Comparison of measurements of cloud droplets and cloud nuclei. J. Atmos. Sci. 24, 702–703. doi:10.1175/1520-0469(1967)024<0702:comocd>2.0.co;2
Twomey, S. (1991). Aerosols, clouds and radiation. Atmos. Environ. Part A. General Top. 25, 2435–2442. doi:10.1016/0960-1686(91)90159-5
van de Hulst, H. C. (1958). Light scattering by small particles. By H. C. van de Hulst. New york (john wiley and sons), london (chapman and Hall), 1957. Pp. xiii, 470; 103 figs 46 tables. 96s. Q. J. R. Meteorological Soc. 84, 198–199. doi:10.1002/qj.49708436025
Vasilatou, V., Diapouli, E., Abatzoglou, D., Bakeas, E. B., Scoullos, M., and Eleftheriadis, K. (2017). Characterization of PM2.5 chemical composition at the Demokritos suburban station, in Athens Greece. The influence of Saharan dust. Environ. Sci. Pollut. Res. 24, 11836–11846. doi:10.1007/s11356-017-8684-3
Vratolis, S., Gini, M. I., Bezantakos, S., Stavroulas, I., Kalivitis, N., Kostenidou, E., et al. (2019). Particle number size distribution statistics at City-Centre Urban Background, urban background, and remote stations in Greece during summer. Atmos. Environ. 213, 711–726. doi:10.1016/j.atmosenv.2019.05.064
Vratolis, S., Fetfatzis, P., Argyrouli, A., Soupiona, O., Mylonaki, M., Maroufidis, J., et al. (2020). Comparison and complementary use of in situ and remote sensing aerosol measurements in the Athens Metropolitan Area. Atmos. Environ. 228, 117439. doi:10.1016/j.atmosenv.2020.117439
Wiedensohler, A., Birmili, W., Nowak, A., Sonntag, A., Weinhold, K., Merkel, M., et al. (2012). Mobility particle size spectrometers: Harmonization of technical standards and data structure to facilitate high quality long-term observations of atmospheric particle number size distributions. Atmos. Meas. Tech. 5, 657–685. doi:10.5194/amt-5-657-2012
Zhao, C., Tie, X., Brasseur, G., Noone, K. J., Nakajima, T., Zhang, Q., et al. (2006). Aircraft measurements of cloud droplet spectral dispersion and implications for indirect aerosol radiative forcing. Geophys. Res. Lett. 33, L16809. doi:10.1029/2006GL026653
Zhu, Y., Rosenfeld, D., and Li, Z. (2018). Under what conditions can we trust retrieved cloud drop concentrations in broken marine stratocumulus? JGR. Atmos. 123, 8754–8767. doi:10.1029/2017JD028083
Keywords: aerosols, clouds, droplet number, lidar, PBL, satellite remote sensing
Citation: Foskinis R, Nenes A, Papayannis A, Georgakaki P, Eleftheriadis K, Vratolis S, Gini MI, Komppula M, Vakkari V and Kokkalis P (2022) Towards reliable retrievals of cloud droplet number for non-precipitating planetary boundary layer clouds and their susceptibility to aerosol. Front. Remote Sens. 3:958207. doi: 10.3389/frsen.2022.958207
Received: 31 May 2022; Accepted: 16 November 2022;
Published: 08 December 2022.
Edited by:
Lan Gao, University of Oklahoma, United StatesReviewed by:
Haochi Che, Tel Aviv University, IsraelJames Hudson, Desert Research Institute (DRI), United States
Copyright © 2022 Foskinis, Nenes, Papayannis, Georgakaki, Eleftheriadis, Vratolis, Gini, Komppula, Vakkari and Kokkalis. This is an open-access article distributed under the terms of the Creative Commons Attribution License (CC BY). The use, distribution or reproduction in other forums is permitted, provided the original author(s) and the copyright owner(s) are credited and that the original publication in this journal is cited, in accordance with accepted academic practice. No use, distribution or reproduction is permitted which does not comply with these terms.
*Correspondence: Alexandros Papayannis, apdlidar@mail.ntua.gr; Athanasios Nenes, athanasios.nenes@epfl.ch