 Eftychia Bellou
 Valentina Escott-Price
- 1UK Dementia Research Institute, School of Medicine, Cardiff University, Cardiff, United Kingdom
- 2Division of Neuroscience and Mental Health, School of Medicine, Cardiff University, Cardiff, United Kingdom
Introduction: In the last decade researchers have attempted to investigate the shared genetic architecture of longevity and age-related diseases and assess whether the increased longevity in certain people is due to protective alleles in the risk genes for a particular condition or whether there are specific “longevity” genes increasing the lifespan independently of age-related conditions' risk genes. The aim of this study was to investigate the shared genetic component between longevity and two age-related conditions.
Methods: We performed a cross-trait meta-analysis of publicly available genome-wide data for Alzheimer's disease, coronary artery disease and longevity using a subset-based approach provided by the R package ASSET.
Results: Despite the lack of strong genetic correlation between longevity and the two diseases, we identified 38 genome-wide significant lead SNPs across 22 independent genomic loci. Of them 6 were found to be potentially shared among the three traits mapping to genes including DAB2IP, DNM2, FCHO1, CLPTM1, and SNRPD2. We also identified 19 novel genome-wide associations for the individual traits in this study. Functional annotations and biological pathway enrichment analyses suggested that pleiotropic variants are involved in clathrin-mediated endocytosis and plasma lipoprotein and neurotransmitter clearance processes.
Discussion: In summary, we have been able to advance in the knowledge of the genetic overlap existing among longevity and the two most common age-related disorders.
1. Introduction
The average human life expectancy has increased in the last decades, but this has not been accompanied by a similar increase in health span. Aging is the driving factor of various age-related diseases (ARDs), including Alzheimer's disease (AD) and cardiovascular disorders, causing a significant burden on social and economic level. Despite the well-known importance of age in our understanding of diverse diseases, the molecular mechanisms by which aging exerts these effects are still mostly unknown (1).
It has been suggested that aging and ARDs are part of a continuum with the two extremes being (a) individuals who suffered one or more ARDs at the age of 60 or 70 years and show signs of accelerating aging, and (b) centenarians who avoided ARDs or postponed their onset. Whether an individual will manifest an ARD and follow a trajectory of accelerated or decelerating aging depends on factors such as the genetic background of the individual, their lifestyle, and various environmental conditions (2). This concept fits well with the idea of hormesis in aging in which lifelong low-intensity exogenous factors/stressors stimulate maintenance and repair mechanisms with beneficial effects for health, whereas the increase of the intensity can overcome the capability of the organism to adapt and end up with detrimental effects such ARDs (3, 4).
Meanwhile, studies in older-aged cohorts and specifically in centenarians have shown that the latter do not achieve exceptional longevity due to the absence of variants that predispose them to the risk of mortality-leading diseases, but rather it seems that are enriched with protective genes related to a reduced risk of e.g., cardiovascular diseases and metabolic disorders (5). The genetic buffering mechanism has been introduced in which many longevity genes, which are enriched in centenarians, have the ability to buffer against the harmful effects of deleterious genotypes via gene-gene interactions (6, 7). In the last decade there were attempts to study the shared genetic architecture of longevity and ARDs to assess the latter hypothesis and whether the increased longevity in certain people is due to protective alleles in the risk genes for a particular condition or whether there are specific “longevity” genes increasing the lifespan independently of age-related conditions' risk genes. Sebastiani and co-authors (8) showed that 130 genes associated with the human lifespan were enriched for several groups of genes linked to both AD and Coronary Artery Disease (CAD) including TOMM40/APOE and CDKN2A. On the contrary, in study by Beekman et al. (9) the authors compared the cumulative effect of risk alleles for cardiovascular disease, type 2 diabetes, and cancer between individuals aged 85 years and older and the middle-aged general population and found that longevity is not compromised by this cumulative effect. This could be due to an increased prevalence of protective alleles for the diseases under study that could lead to the delay of disease onset or to the decrease of the severity. Tesi et al. (10) explored the genetic architecture between AD and longevity by studying the effect of 38 AD-associated genetics variants on longevity, and they showed that 74% of the AD risk alleles are associated with lower odds of becoming a centenarian. Finally, in a recent study by Martin and Fraser (11) the authors suggested that part of the pathogenesis of the ARDs might be partly regulated by loci that control gene expression over age. They managed to identify genetic variants in the human brain that control messenger RNA (mRNA), DNA methylation and microRNA (miRNA) levels in an age-dependent manner.
In this study we aimed to utilize a pleiotropic meta-analytic approach to comprehensively parse variance from AD, CAD, and longevity focused genome-wide association studies (GWASs) that might pinpoint differential biological mechanisms and aid in understanding the effect of these age-related diseases' variants on longevity. These diseases were chosen as they are most prevalent (and therefore best studied) diseases (12, 13) representing neurodegenerative and cardiovascular conditions in the population, and age is their strongest factor related to their development and mortality. Moreover, growing literature indicates that cardiovascular disease risk factors, including high blood pressure, high low-density lipoprotein cholesterol, diabetes and obesity are associated with increased risk of AD, and its precursor, cognitive decline (14). Finally, the current study could shed some light into the validity of the cardiovascular dementia hypothesis (15) in which aortic stiffness, a key indicator of cardiovascular diseases, may result in brain damage as well as heart failure due to the relation of proximal aorta with both the heart and brain perfusion. Thus, the understanding of a potential vascular etiology in AD could have an important role in developing effective preventive strategies.
2. Material and methods
2.1. Samples and summary statistics data
For the current analysis, we used publicly available GWAS summary statistics for the three traits. For AD we used the stage one meta-analysis data (N = 63,926) from Kunkle et al. (16), for CAD the data from the CARDIoGRAMplusC4D 1,000 Genomes-based GWAS (N = 184,305) by Nikpay et al. (17), and finally, for longevity we used the meta-analysis data corresponding to the 90th survival percentile (N = 36,745) by Deelen et al. (18). Detailed information about study designs, quality-control and meta-analytic procedures were reported by the authors to each publication, respectively. All three datasets were harmonized to the same allele using as a reference the 1,000 Genomes Project Phase 3 data (19). Multi-allelic and ambiguous genetic variants were removed from the datasets along with variants with minor allele frequency (MAF) < 0.01 as in 1,000 genomes. Moreover, as the mean imputation information was available for CAD, thus we additionally removed variants with imputation quality score INFO < 0.75 in that dataset. It should be noted that the summary statistics data used for the analyses are not taken from the largest, most recent GWASs; rather, we used smaller GWASs that do not include the UK Biobank. We, however verified our findings against the more recent studies that have been published for AD (20–22), longevity (23) and CAD (24).
2.2. Estimation of the genetic correlation among the traits
The genetic correlation (rg) describes the genetic similarity of two traits by capturing the extent to which genetic factors influence their covariance. The genetic correlation is expected to reflect the existence of pleiotropy; however, these two concepts do not have the same meaning (25). For example, an estimation of rg close to zero does not necessarily imply that the two phenotypes do not share risk loci. Thus, to capture the latter scenario we estimated both the whole-genome and the local correlation between the three traits.
2.2.1. Whole-genome correlations
Cross-trait LD score regression (LDSC) (26) (https://github.com/bulik/ldsc) was used to test the genetic overlap among each pair of traits using the HapMap3 (27) variants as proposed by the developers. The key assumption behind this method is that the variants with a high LD score - a measure of the extend of the linkage disequilibrium (LD) between a variant and its neighbor variants - are more likely to tag a causal single nucleotide polymorphism (SNP) and have a higher χ2 statistics than SNPs in a low-LD region (28). The analysis was performed using the pre-computed European SNP LD scores (https://data.broadinstitute.org/alkesgroup/LDSCORE/eur_w_ld_chr.tar.bz2) and the major histocompatibility region (MHC) was excluded as recommended.
2.2.2. Local correlations
The LAVA (Local Analysis of [co]Variant association) (29) (https://github.com/josefin-werme/LAVA) was performed to identify the pairwise local genetic correlations among the three phenotypes. Since the LDSC only considers the average rg across the entire genome, LAVA approach can detect scenarios where the signal is confined to specific regions or in opposing directions at different loci (25). The LAVA analysis used the genetic covariance intercept from the LDSC analyses to adjust for potential sample overlap and the local rg was tested within the 2,495 genome-wide loci as constructed and described by Werme et al. (29). Initially, a univariate analysis for each trait at each locus was performed to ensure that sufficient local heritability was present to perform bivariate local rg analysis. Then for each trait pair, the bivariate analysis was performed only for loci in which both phenotypes exhibited univariate signal at p < 0.05/2,495 resulting in 16 bivariate tests conducted in total. Bivariate analyses results were considered significant when p < 0.05/16. To account for potential samples overlap, LAVA requires the covariance intercept from LDSC analysis. Furthermore, partial correlation analysis was performed with LAVA to examine any conditional genetic relationships in more detail for the LD blocks with significant local rg.
2.3. Association analysis based on subsets
We applied a subset-based meta-analysis (30) using the R package ASSET to identify pleiotropic SNPs. The approach is specifically designed for detecting association signals across multiple phenotypes accounting for subset-specific and bidirectional effects of individual variants. ASSET searches across all possible subsets of the input GWAS traits to identify the strongest association signal in both positive and negative directions and returns a p-value (multiple-testing corrected) for the overall evidence of association of a variant across phenotypes along with the best subset of phenotypes that contributed to the overall association. The method also allows to account for potential sample overlap (30).
We combined the GWAS summary statistics from AD, longevity and CAD by using ASSET function “h.traits” with default parameters to perform a two-sided search to obtain pleiotropic variants that may be associated with different phenotypes in different directions of the association. Only SNPs that were present for all three traits were retained as inputs to the meta-analysis, resulting in 5,987,749 SNPs. As above, inter-study correlations from LDSC were used to account for sample overlap. After subset-based meta-analysis, SNPs were considered statistically significant when (1) their ASSET-derived overall p-value was lower than 5e-08, (2) both p-values for the positively and negatively associated subsets of traits were lower than 0.05, and (3) the p-values from the initial GWASs input studies reached at least nominal significance (p < 0.05).
2.3.1. Consolidation of independent loci and functional annotation
Independent loci in the ASSET-derived results were identified via LD-clumping using SNP2GENE pipeline from the online platform FUMA (https://fuma.ctglab.nl) (31) on the basis of the European 1,000 Genomes Project phase 3 reference panel (19). Initially, independent significant SNPs with p-value < 5e-08 and independent from each other at (r2 < 0.6) were identified. Then, candidate SNPs, defined as all known SNPs of with p-value < 0.05 and r2 ≥ 0.6 with one of the independent significant SNPs, were identified for further annotations. Finally, based on the candidate SNPs independent lead SNPs were defined as the SNPs with the strongest association at a given locus and with r2 < 0.1 from each other. Genomic risk loci that were 250 kb or closer to each other were merged into one locus.
Functional consequences of the candidate SNPs in each risk loci were obtained by performing ANNOVAR (32) using Ensembl genes as described by FUMA's developers (31). In summary, these SNPs were first matched based on chromosome, base pair position and reference allele to a database containing functional annotations including the ANNOVAR categories (32), combined annotation dependent depletion (CADD) scores (33) and Regulome DB (RDB) scores (34). The ANNOVAR categories were used to identify the function of the SNP, and to locate its position within the genome (positional mapping). CADD scores are a measurement used to determine how deleterious genetic variation at the SNP is to protein structure and function. Higher scores are indicative of a more deleterious variant, with scores of >12.37 providing evidence of pathogenicity (33). A Regulome DB score is a categorical measurement based on data from expression quantitative trait loci (eQTLs) as well as chromatin marks. The RDB score ranges from 1a to 7 with lower scores given to the variants with the greatest evidence for having regulatory function.
2.3.2. Gene mapping and identification of novel individual-trait associations
The functionally annotated SNPS were mapped in genomic risk loci using two approaches: (a) positional mapping in which SNPs are physically located within protein-coding genes (10 kb windows are used) and (b) eQTL mapping in which all independent significant SNPs and their proxies were mapped to genes based on a significant eQTL association, by using information from four data repositories; GTEx v8 (35) tissues (Blood, Blood vessel, Brain, Heart), PsyENCODE (http://resource.psychencode.org) (36), DICE (https://dice-database.org) (37) and BRAINEAC (http://www.braineac.org/) (38). By default, a false discovery rate (FDR) of 0.05 was applied to define significant eQTL associations, and SNPs were mapped to genes up to 1 Mb apart. MHC region was excluded from annotations.
Finally, to identify individual trait novel associations, we investigated whether the pleiotropic SNPs identified by ASSET were associated at genome-wide level with any of the input traits (and more) using GWAS Catalog (https://www.ebi.ac.uk/gwas/).
2.3.3. Gene-based and gene-set analysis using MAGMA
Both gene analysis and gene-set analysis were performed using MAGMA (39) by the FUMA pipeline as described in (31). In summary, for the SNP-wise gene-based analysis, SNPs were mapped to protein-coding genes (gene window: 0 kb) and the gene-based p-value was estimated. For the gene set analysis under the competitive model, the gene set p-value was computed using the gene-based p-value for 4,728 curated gene sets (including canonical pathways) and 6,166 GO terms obtained from MsigDB v5.2 (40). Results were Bonferroni multiple testing corrected.
2.3.4. Enrichment analysis of the mapped genes in pre-defined pathways
To obtain insight into putative biological mechanisms of the mapped genes (based on functional and eQTL mapping), we used the GENE2FUNC process implemented on the online platform FUMA to annotate these genes in biological context. We conducted enrichment analysis of the genes against gene sets from biological pathways and functional categories obtained from MsigDB (40) and WikiPathways (41).
3. Results
3.1. Genetic correlations
Consistent with previous studies (18, 42, 43), LDSC returned negative genome-wide genetic correlations among the three traits: AD-longevity rg = −0.18 (p = 0.16), AD-CAD rg = −0.11 (p = 0.11), CAD-longevity rg = −0.39 (p = 9.82e-09), with the genetic correlation between CAD and longevity being the only significant one.
LAVA analysis revealed only one significant local rg between all traits at chr19:45,040,933–45,893,307. This region contains the well-known APOE gene with which all three traits present a strong association. As expected, the correlation of AD and CAD traits with longevity was found to be negative (AD-longevity local rg = −0.79 and p = 3.49e-55, CAD-longevity local rg = −0.71 and p = 1.34e-11), whereas the rg between AD and CAD in the region was found to be positive (rg = 0.54, p = 1.18e-12). Notably, only 1 out of 15 loci with significant univariate local heritability for at least two phenotypes had a bivariate significant p-value, suggesting that strong local heritability can occur in the absence of any local rg.
To further test the relationship at chromosome 19 region, we performed conditional analysis using partial correlation to determine whether any component of the rg between longevity and AD remained once accounting for CAD and vice versa. Conditioning on CAD, the partial correlation between longevity and AD remained high (partial rg = −0.69, p = 5.87e-04 vs. bivariate rg = −0.79). Similarly conditioning on AD, a sizeable portion of the original association between longevity and CAD remained high (partial rg = −0.55, p = 3.62e-04 vs. bivariate rg = −0.71). These results indicate that the local rg between each pair of traits is not driven by the third trait and thus, the local genetic signals for both AD and CAD confer a greater chance of not reaching the 90th survival percentile.
3.2. Association analysis based on subsets
3.2.1. Identification of independent loci and functional annotations
Despite the lack of strong genetic correlation between longevity and the two age-related diseases, we performed the two-sided ASSET cross-trait analysis with the intention to boost the power to detect loci shared by at least two of the three phenotypes. When doing so, the meta-analysis revealed 10,662 SNPs with nominally significant p-values (p < 0.05) for both the positively and negatively associated subsets and the initial GWAS input studies. After LD-clumping 38 lead SNPs across 22 independent genomic loci (see Figure 1, Supplementary Figure S1, and Supplementary Tables S1–S3) were identified. The three top lead SNPs were rs34095326 in the intronic region of TOMM40 (pASSET = 0), rs2891168, a non-protein-coding RNA at chromosome 9 (pASSET = 1.40e-98, CDKN2B-AS1) and rs118039278 in the intronic region of LPA (pASSET = 4.38e-37) (Supplementary Tables S3, S4). Both rs2891168 and rs118039278 were identified as pleiotropic for longevity and CAD, whereas rs34095326 was shared between AD and longevity.
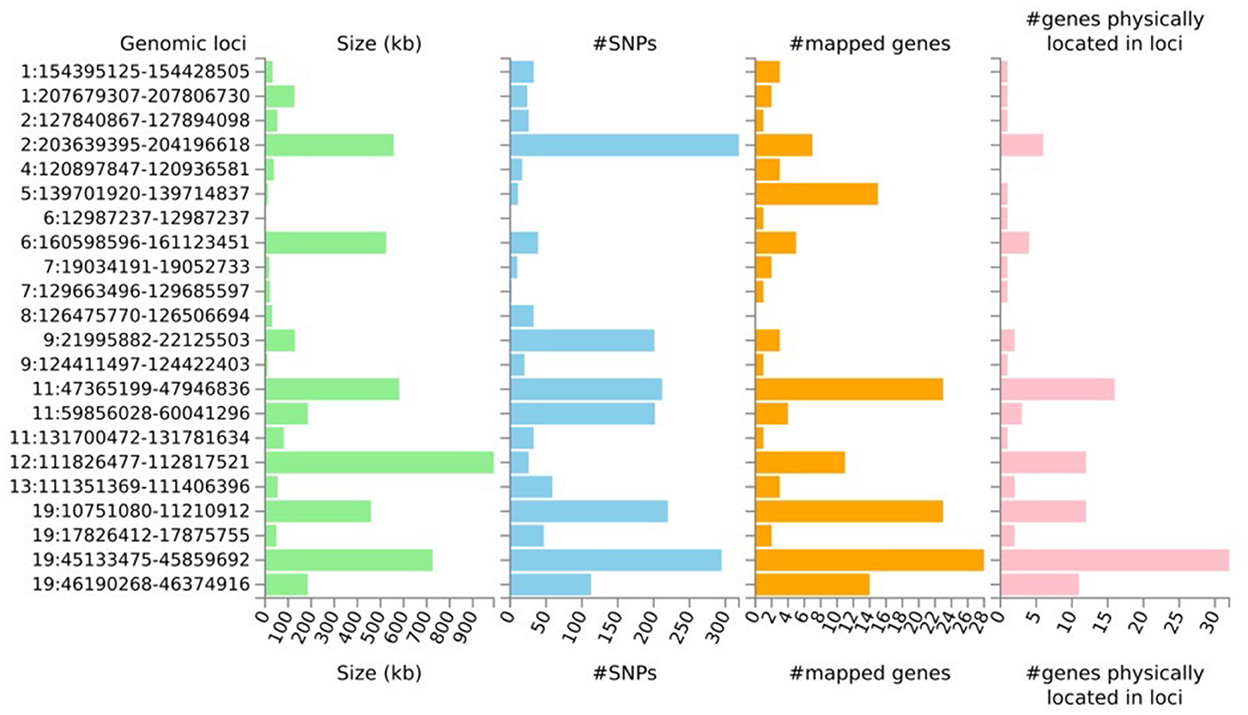
Figure 1. Summary results per genomic locus identified from the subset-based meta-analysis (ASSET) after LD clumping. The histograms display the size of genomic loci, the number of both candidate SNPs and mapped genes, and the number of genes physically located within the locus.
Four of the 22 genomic risk loci (or 6/38 independent lead SNPs) were flagged as pleiotropic for the all the three traits; two SNPs were included in the clusters Longevity|AD, CAD and surprisingly, four in the cluster CAD|AD, Longevity (Supplementary Table S3). More specifically, the two SNPs located in chromosome 19 (82 Kb and 34 Mb away from the APOE gene, respectively) were positively associated with longevity and negatively associated with AD and CAD: rs117261169-T ORcluster = 1.39, Pcluster = 1.20e-04 vs. ORcluster = 0.78, Pcluster = 8.85e-09, and rs2043332-A ORcluster = 1.05, Pcluster = 2.39e-02 vs. ORcluster = 0.95, Pcluster = 2.48e-08, respectively. In other words, both alleles are protective of developing AD and CAD leading to higher chances of reaching the 90th percentile of aging. Interestingly, the G allele of rs10774624 (locus 17, RP3-473L9.4), rs1964272 (locus 22, SNRPD2), rs10818576 (locus 13, DAB2IP), and rs9630903 (locus 20, FCHO1) has the same direction of association for AD and longevity and opposite for CAD despite the negative genetic correlation between AD and longevity (Supplementary Tables S3, S4).
In the pair-wise analysis between AD and longevity, 18 independent lead SNPs from 7 risk loci showed a pleiotropic opposite effect with most of them being in the APOE/TOMM40 region (locus 21), verifying the local genetic correlation that was reported in the previous section (Supplementary Table S3). The rest of the SNPs were positionally mapped to CR1 (rs2093761, locus 2), BIN1 (rs6733839, locus 3), HBEGF (rs11168036, locus 6), SPI1 (rs67472071, locus 14), AP001257.1 (rs583296, locus 15), and NTM (rs9787911, locus 16).
Pair-wise analysis of longevity and CAD found 11 lead SNPs from 10 genomic loci with opposite direction of effect. SNPs including rs118039278 and rs9457927 (locus 8), rs2107595 (locus 9), rs11556924 (locus 10), rs2980853 (locus 11), rs2891168 (locus 12), and rs56289821 (locus 19) have also been reported to have pleiotropic effects on other cardiovascular diseases and their risk factors such as myocardial infraction, systolic blood pressure, hypertension, cholesterol levels and triglycerides (Supplementary Table S5). Finally, two SNPs showed opposite, pleiotropic effects between CAD and AD; both the rs116426890-T (locus 4) and rs62118504-G (locus 21) were found to increase the risk of CAD (OR = 1.13, P = 2.95e-13 and OR = 1.03, P = 2.26e-03, respectively) and decrease the risk of AD (OR = 0.95, P = 3.46e-02 and OR = 0.89, P = 1.06e-11, respectively).
Functional annotation conducted in FUMA indicated that, across the independent genomic loci found by ASSET analysis, there was a significant overrepresentation of SNPs found in introns (48%), ncRNA intronic regions (16%), UTR3 (2%), downstream (2%), upstream and in UTR5 regions (0.7%) (Figure 2). In intergenic regions the number of SNPs (26%) were significantly underrepresented. Moreover, 110/1,943 (5.66%) of the candidate SNPs had a Regulome DB Score < 3, indicating that variation at these SNPs is likely to affect gene expression (Supplementary Table S4). Finally, 65/1,943 (3.35%) and 3.79% had a CADD score of >12.37 indicating that variation at these SNPs is deleterious (Supplementary Table S4).
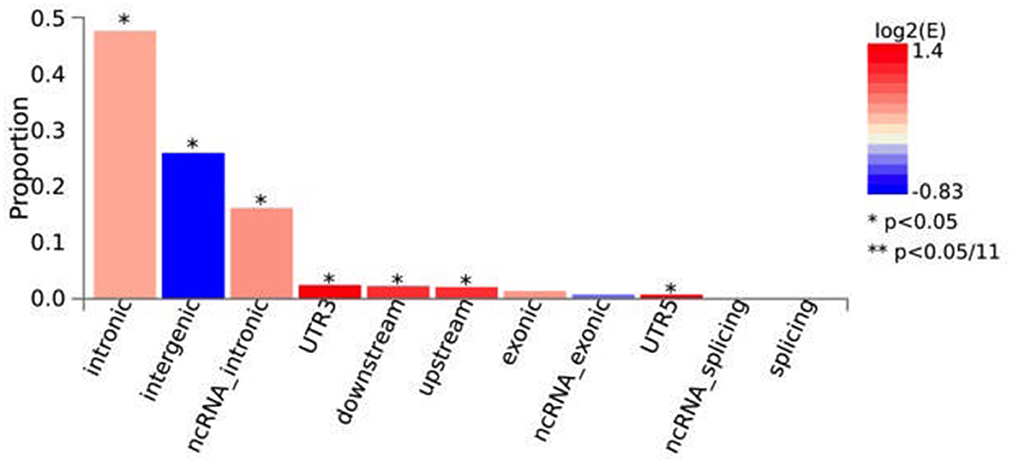
Figure 2. Functional consequences of ASSET candidate SNPs on genes. The histograms display the proportion of SNPs (all SNPs in LD with independent significant SNPs) which have corresponding functional annotation assigned by ANNOVAR. Bars are colored by log2 (enrichment) relative to all SNPs in the selected reference panel. Enrichment is computed as (proportion of SNPs with an annotation)/(proportion of SNPs with an annotation relative to all available SNPs in the reference panel). Proportion is the fraction of candidate SNPs with the corresponding annotation. Fisher's exact test (two side) is performed for each annotation. *p < 0.05; **p < 0.05/11.
3.2.2. Identification of novel associations
We assessed whether our meta-analysis identified loci have been discovered in more recent and larger GWASs that have been published for AD (20–22), longevity (23) and CAD (24). Of the 22 shared risk loci identified, 11 have already been reported as risk factors for the diseases contributing to the association, according to GWAS Catalog, whereas the rest could potentially be novel loci for at least one of the traits (Supplementary Table S8). Our subset-based meta-analysis indicated locus 4 (lead SNP rs116426890, pASSET = 3.40e-13, ABI2), locus 13 (lead SNP rs10818576, pASSET = 3.49e-09, DAB2IP), locus 16 (lead SNP rs9787911, pASSET = 9.95e-09, NTM), locus 20 (lead SNP rs9630903, pASSET = 2.43e-08, FCHO1) and locus 22 (lead SNP rs1964272, pASSET = 6.62e-10, SNRPD2) to be potentially novel for AD with only rs116426890 reaching a nominal significance of p = 1.52e-06 in the Bellenguez et al. study (22). Moreover, the lead SNP rs11168036 from locus 6 that was not significant in the input GWAS and was suggested to be shared with longevity in our study, was now found to be associated with AD (pstage_1+2 = 7e−09) in a transethnic study (44). Regarding CAD, from the 15 loci that were found to be shared with at least one of the other traits in this study, nine SNPs (rs11723436, rs2980853, rs9583531, rs117261169, rs1964272, rs10818576, rs2043332, rs9630903) were not GWAS significantly associated with the disease input GWAS; however, eight of them including rs62118504 (EXOC3L2 gene), rs1964272 (SNRPD2 gene), rs11723436 (RP11-170N16.1 gene), rs10818576 (DAB2IP gene), rs2980853 (RP11-136O12.2 gene), rs2043332 (DNM2 gene), rs9630903 mapped to FCHO1 and rs9583531 mapped to ING1, were found to be significant in a later and larger CAD GWAS study by van der Harst et al. (24), again proving the utility of ASSET in discovering novel risk loci. Finally, 36 SNPs from 21 loci reported by ASSET were associated with longevity with only rs34095326 (locus 21) being significant in the original GWAS. Four risk loci were found to be significant in a larger GWAS by Timmers et al. (23) and another two SNPs were nominally significant including rs11556924 (p = 3.3e-07, locus 10) and rs2980853 (p = 3.5e-05, locus 11).
3.2.3. MAGMA gene-based and gene-set analysis
A gene-based analysis was conducted using MAGMA which can increase the power to detect significant associations as the signal across many SNPs (all within a gene) is combined (39). Input SNPs were mapped to 1,117 protein-coding genes and only 200 genes survived the Bonferroni correction significance threshold of 4.476e-5 (P = 0.05/1,117) (as seen in Supplementary Table S9). The competitive gene-set analysis uses 63 significant GO biological processes, REACTOME and curated gene-sets (detailed results in Supplementary Table S10). Among these gene sets, there were six gene sets involved in the immunity, including the negative regulation of adaptive immune response (P = 1.31e-04) and the negative regulation of leukocyte mediated immunity (P = 1.32e-04) and 6 involved in oncogenic processes such as the roversi glioma copy number up (P = 6.34e-11) and the oncogene induced senescence (P = 9.76e-07).
3.2.4. Enrichment analysis of the mapped genes in pre-defined pathways
Using both positional and eQTL mapping in FUMA, we mapped our SNPs into 151 genes as seen on Supplementary Tables S6, S7. Then we performed overrepresentation analysis of the mapped (physically and eQTL positioned) genes in Reactome DB and GO pre-defined pathways created by the FUMA developers (as seen in Supplementary Table S11) and GENE2FUNC tool. The analysis highlighted two interesting biological processes significantly enriched in the shared genes between the three traits specifically those involve/related to endocytosis. These include the clathrin coated endocytic vesicle (PFDR = 0.02) and the clathrin coated endocytic vesicle membrane (PFDR = 0.03) which have been implicated in the pathology of AD (45, 46) and atherosclerosis (47). Among Reactome pre-defined pathways, seven were found to be statistically enriched including the neurotransmitter clearance (PFDR = 0.02), the plasma lipoprotein clearance (PFDR = 0.03) and the plasma lipoprotein assembly remodeling and clearance (PFDR = 0.04).
4. Discussion
Through the current cross-trait meta-analysis of two age-related diseases, AD and CAD, and longevity, we have been able to advance in the knowledge of the genetic overlap between the three phenotypes and show that one of the genetic mechanisms for extreme longevity involves the avoidance of certain risk alleles that predispose to common diseases. Specifically, our meta-analysis identified 38 genetic variants from 22 risk loci shared among subsets of the diseases under study, many of which represent new individual-trait genetic risk loci.
Two of the five pleiotropic loci identified by Fortney et al. (48) using data from centenarian cohorts for age-related traits, TOMM40/APOE (shared by longevity and AD) and CDKN2B-AS1 (shared by longevity and CAD), were also returned by our subset-based meta-analysis (the SNPs mapped in these genes in both studies were in LD).
We also found six independent lead SNPs from six loci to be pleiotropic for the all the three traits. Three SNPs, rs9630903-G, rs117261169-T, and rs1964272-G are spanning chromosome 19 and were mapped to FCHO1, CLPTM1, and SNRPD2, respectively. The SNP rs9630903-G was found to be associated with a reduced risk of CAD in a larger van der Harst et al. (24) study, verifying our association using a smaller CAD GWAS. The rs9630903 was found to potentially affect the expression of both FCHO1 and MAP1S genes by eQTL mapping (Supplementary Table S7). FCHO1 is involved in endocytosis via clathrin coated endocytic vesicle pathways (49) binds APP and its missense mutation NM_001161357.1:c.557G > A (rs147599881) approached significance in the cerebrospinal fluid (CSF) biomarker data in a recent analysis of AD-affected cousin pairs selected from high-risk pedigrees (50). CLPTM1 resides in the same region as APOC1 and CEACAM19 in close proximity with APOE which is also flagged as a pleiotropic gene associated with the three phenotypes. CLPTM1 plays a role in the regulation of GABA receptor trafficking from the ER to the plasma membrane, suggesting that CLPTM1 could regulate inhibitory neurotransmission (51). Two recent transcriptome-wide studies (TWASs) (52, 53) reported CLPTM1 to be significantly associated with AD in CD14+ monocyte expression data from the Cardiogenics transcriptomics study and in the hippocampal, the putamens and the nucleus putamens tissues, respectively. Moreover, a genome-wide scan for SNPs involved in exceptional longevity identified rs405509, (r2 = 0.62 with rs117261169), which is a temporal expression eQTL (teQTL) with the gene CLPTM1 (P = 4.8e-03; longevity increasing allele increases expression over age). Furthermore, rs117261169-T has been found to be associated with self-reported high cholesterol (β = −0.03, P = 8.61e-17), a known cardiovascular mediator, and self-reported AD/dementia in mothers (in the UK Biobank) (β = −0.01, p = 5.05e-06), further solidifying its potential role as a pleiotropic SNP. The rs1964272 SNP, which was found to be associated with CAD (β = 0.03, P = 1.31e-08) in a later study by van der Harst et al. (24), was physically mapped 443kb downstream of SNRPD2 and to both SNRPD2 and DNWD by eQTL mapping. SNRPD2 has been implicated in the pathogenesis of both MCI and AD, with decreased expression level (54) and also, AD was affected by the gene expression of SNRPD2 in the hippocampus and putamen (53) proving that the gene is likely to be pleiotropic.
The other three SNPs returned as pleiotropic for all three phenotypes in our analysis were rs10818576 (DAB2IP), rs10774624 (RP3–473L9.4), and rs2043332 (DNM2). The SNP rs10818576 is intronic to DAB2IP, shows no significant with the expression of any gene based on the eQTL mapping and its G allele was reported as decreasing the risk of developed of CAD (24). DAB2IP acts as a negative regulator of vascular endothelial growth factor signaling and angiogenesis (55), a tumor suppressor (56) and was found to be associated with AD by a hippocampal TWAS study (57). Pleiotropic SNP rs10774624 and locus 17 in general, are shared by phenotypes such as CAD (24), rheumatoid arthritis (58), systolic blood pressure (59), parental longevity (60) and various hematological traits (61). It was mapped to ALDH2 by eQTL mapping approach in GTEx Whole Blood, brain nucleus accumbens basal ganglia and artery aorta tissues whose inactivating mutation has been linked to chronic excessive ethanol intake as potential contributors to Alzheimer's disease progression (58). Finally, DNM2 intronic SNP rs2043332 has been linked to CAD (C allele: β = 0.04, P = 2.63e-09) (24) verifying ASSET's ability to discover novel trait associations. DNM2, as shown by the enrichment analysis in biological and functional categories, is involved in endocytosis (via the clathrin coated endocytic vesicle pathway) which is closely linked to the development of both Aβ and tau pathologies (62). A study in Japanese population suggested that DNM2 via its rs892086 is a susceptibility gene for AD in non-APOE-ε4 carriers (63).
Interestingly, rs10818576-G, rs10774624-G, and rs1964272-G were associated with higher odds of developing CAD and lower odds of getting AD and surviving past 90 years old, whereas rs9630903-G was found to be protective of CAD but increasing the odds of developing AD and living longer. These directions of effects seem unexpected, however a previous study (10) reported ten similar variants whose unexpected direction of effect was replicated for only two of the SNPs. The authors suggested that these effects could be the result of interactions among variants, known as epistasis. Similar directions of effect have been reported in a study by Dato et al. (64) in which a SNP in IP6K3 increased both lifespan and the risk of late-onset AD, while SNPs in IPMK and UCP4 genes were associated with a lower risk of both late-onset AD and shorter lifespan. Thus, it is possible that SNP-SNP interactions may have different effects on AD and longevity depending on the genetic architecture of these traits and their associated underlying pathways. An alternative explanation could be that these SNPs have an age-dependent effect on traits; for example, hypertension at midlife increases the risk of AD, but after the age of 85 high blood is protective of AD (65).
The subset-based analysis also revealed variants that have pairwise, opposite shared effects. Eighteen lead SNPs across seven risk loci have potentially pleiotropic affects in both AD and longevity. SPI1 (rs67472071, locus 14) is involved in the regulation of many genes, including the aging-related gene WRN (66). Various non-synonymous WRN coding region SNPs have been associated with age-related pathologies in different ethnic populations. For example, Kulminski and Culminskaya (67) reported that subjects with one A allele at the WRN SNP 1133A were associated with an earlier onset of cardiovascular diseases and cancer (and thus decreased longevity) when compared with individuals homozygous for a serine residue (S/S) at this SNP. HBEGF was found to be genome-wide significant risk gene for AD in a trans-ethnic study (44), is involved in Aβ clearance (68) and it has been reported to play a role in the increase of neurogenesis in the adult rat brain. Although neurogenesis persists in the aged brain, its rate declines with age in both rats and humans. Decreased hippocampal neurogenesis may be involved in age-related cognitive deficits because of its proposed role in learning and memory function (69). In addition, SNP rs11168036 (locus 6) was found to be associated with the expression of the PCDHA genes (Supplementary Table S7). The 5q31.3 region, which includes the genes PCDHA1-PCDHA10, influences the expression of the WRD55 and ARL4A genes in the brain tissue (70). ARL4A have previously been associated with maternal longevity in an epigenome-wide association study of age and age-related phenotypes (71) indicating a possible link between the 5q31.3 deletion and longevity. Finally, rs9787911 has been found to be nominally associated with AD in the Japanese population (72). The mapped gene NTM at 11q25 encodes a protein that may promote neurite outgrowth and adhesion via a hemophilic mechanism (73) and a linkage at 11q25 for AD has been discovered by two studies (74, 75).
Among the variants that found by ASSET to be shared between CAD and longevity, ING1 (rs9583531, locus 18) encodes a tumor suppressor protein that can induce cell growth arrest and apoptosis, is responsible for implementation of senescence and the reduced expression and rearrangement of this gene have been detected in various cancers (76). Recent evidence suggests that cellular senescence plays a regulatory role in the aging process (77). Furthermore, another of the pleiotropic genes, IL6R (rs4845619, locus 1), found to be associated with CAD in a later GWAS (24). It is involved in the pathophysiology of several age-related diseases such as osteoporosis (78) and reduced IL6 signaling lowers the risk of multiple cardiovascular disorders and is associated with increased longevity (79).
Finally, two SNPs showed pleiotropic effects among AD and CAD, namely rs116426890-T (locus 4) and rs62118504-G (locus 21). Locus 4 shows pleiotropic effects on various cardiovascular traits and apolipoprotein B levels as seen in Supplementary Table S5. SNP rs116426890 is intronic to ABI2 and is linked to the expression of CARF, ICA1L, FAM117B, and NBEAL1 (Supplementary Table S7) which are associated with both white matter hyperintensities and fractional anisotropy, predictors of cerebral small vessel disease which is involved in strokes and vascular dementia (80). Regarding ABI2, it is part of the same family as ABI3 which is associated with AD (81). ABI2's protein has been found to be dysregulated in the entorhinal cortex at different stages of neurofibrillary tangle pathology compared with middle-aged individual and contributes to the regulation of actin assembly at the tips of neuron projections (82). SNP rs62118504-G, which is associated with AD based on the input AD GWAS, mapped to EXOC3L2/MARK4 genes. The whole locus 21 is pleiotropic for various cardiovascular risk factors making it a strong candidate for being a CAD-associated loci as indicated by our cross-phenotype meta-analysis.
We acknowledge the limitations of our study. One limitation is the possibility of survival bias. Individuals predisposed to developing an age-related disease may not have survived to old age, which may have underestimated any association with these diseases. Moreover, the diagnosis of probable AD excludes a prior history of cerebrovascular disease, leading a reduced risk of overlap between the two diseases. It is also plausible that individuals reaching an age over 90 yeas carry a different genetic background to the general population consisting of protective SNPs that predispose for extreme longevity, which are not captured by our study. Furthermore, the input GWASs were of different sample sizes and power. Although the effects of such differences on the results are not fully understood, ASSET is known to be the best available approach to handling non-uniform distribution of sample sizes. The limitations of the ASSET approach include that its two-sided model can show a low accuracy due to the extensive search for subsets in both directions and thus, could lead to the identification of more false positive results when the significant associations are all in the same direction. However, in this study due to the negative genetic correlation among all phenotypes involved in the analysis, we expect associations to exist in opposite directions (as seen) which improves the power to identify the correct subset of traits. Moreover, the CARDioGRAMplusC4D contains some non-European participants but no heterogeneity among the studies was observed at any of the genome-wide significant variants apart from 9p21 locus. Finally, the only tissues which we used for mapping SNPs to genes, were those relevant to AD and CAD by showing a significant eQTL association, which may limit the number of mapped genes.
In summary, performing an association analysis by subsets across AD, longevity, and CAD we discovered novel (potentially) pleiotropic loci, and identify loci which were reported for individual-trait risk in later and larger GWAS studies. The latter suggests that increasing GWAS sample sizes is likely to identify more pleiotropic loci which are risk genes for more than one disease. Further work will be required to fully explore the role of aging in age-related diseases.
Data availability statement
The datasets presented in this study can be found in online repositories. The names of the repositories can be found in the Supplementary material.
Ethics statement
Ethical review and approval was not required as the datasets are openly accessible. The patients/participants provided their written informed consent to participate in those studies.
Author contributions
EB: conceptualization, methodology, software, formal analysis, resources, writing - original draft, and visualization. VE-P: conceptualization, investigation, writing - review & editing, supervision, project administration, and funding acquisition. All authors contributed to the article and approved the submitted version.
Funding
This work was supported by the Dementia Research Institute [UKDRI supported by the Medical Research Council (UKDRI-3003), Alzheimer's Research UK, and Alzheimer's Society], Dementia Platforms UK (MRC: MR/L023784/2), MRC Center for Neuropsychiatric Genetics and Genomics (MR/L010305/1) and Eisai Pharmaceutical company. EB was supported by Eisai Ltd and UK DRI.
Conflict of interest
VE-P has collaborated with Eisai through their Eisai-DRI collaborative grant funding. EB was supported by Eisai Ltd and UK DRI.
Publisher's note
All claims expressed in this article are solely those of the authors and do not necessarily represent those of their affiliated organizations, or those of the publisher, the editors and the reviewers. Any product that may be evaluated in this article, or claim that may be made by its manufacturer, is not guaranteed or endorsed by the publisher.
Supplementary material
The Supplementary Material for this article can be found online at: https://www.frontiersin.org/articles/10.3389/fpsyt.2022.1102347/full#supplementary-material
References
1. Niccoli T, Partridge L. Ageing as a risk factor for disease. Curr Biol. (2012) 22:R741–52. doi: 10.1016/j.cub.2012.07.024
2. Franceschi C, Garagnani P, Morsiani C, Conte M, Santoro A, Grignolio A, et al. The continuum of aging and age-related diseases: common mechanisms but different rates. Front Med. (2018) 5:61. doi: 10.3389/fmed.2018.00061
4. Mattson MP. Awareness of hormesis will enhance future research in basic and applied neuroscience. Crit Rev Toxicol. (2008) 38:633–9. doi: 10.1080/10408440802026406
5. Atzmon G, Rincon M, Schechter CB, Shuldiner AR, Lipton RB, Bergman A, et al. Lipoprotein genotype and conserved pathway for exceptional longevity in humans. PLoS Biol. (2006) 4:e113. doi: 10.1371/journal.pbio.0040113
6. Bergman A, Atzmon G, Ye K, MacCarthy T, Barzilai N. Buffering mechanisms in aging: a systems approach toward uncovering the genetic component of aging. PLoS Comput Biol. (2007) 3:e170. doi: 10.1371/journal.pcbi.0030170
7. Huffman DM, Deelen J, Ye K, Bergman A, Slagboom EP, Barzilai N, et al. Distinguishing between longevity and buffered-deleterious genotypes for exceptional human longevity: the case of the MTP gene. J Gerontol A Biol Sci Med Sci. (2012) 67:1153–60. doi: 10.1093/gerona/gls103
8. Sebastiani P, Solovieff N, Dewan AT, Walsh KM, Puca A, Hartley SW, et al. Genetic signatures of exceptional longevity in humans. PLoS ONE. (2012) 7:e29848. doi: 10.1371/journal.pone.0029848
9. Beekman M, Nederstigt C, Suchiman HE, Kremer D, van der Breggen R, Lakenberg N, et al. Genome-wide association study (GWAS)-identified disease risk alleles do not compromise human longevity. Proc Natl Acad Sci U S A. (2010) 107:18046–9. doi: 10.1073/pnas.1003540107
10. Tesi N, Hulsman M, van der Lee SJ, Jansen IE, Stringa N, van Schoor NM, et al. The effect of Alzheimer's disease-associated genetic variants on longevity. Front Genet. (2021) 12:748781. doi: 10.3389/fgene.2021.748781
11. Martin T, Fraser HB. Genetic control of age-related gene expression and complex traits in the human brain. BioRxiv. (2017) 1:5195. doi: 10.1101/125195
12. Benjamin EJ, Blaha MJ, Chiuve SE, Cushman M, Das SR, Deo R, et al. Heart disease and stroke statistics-2017 update: a report from the American heart association. Circulation. (2017) 135:e146–603. doi: 10.1161/CIR.0000000000000485
13. Jaul E, Barron J. Age-related diseases and clinical and public health implications for the 85 years old and over population. Front Public Health. (2017) 5:335. doi: 10.3389/fpubh.2017.00335
14. Stampfer MJ. Cardiovascular disease and Alzheimer's disease: common links. J Intern Med. (2006) 260:211–23. doi: 10.1111/j.1365-2796.2006.01687.x
15. de Roos A, van der Grond J, Mitchell G, Westenberg J. Magnetic resonance imaging of cardiovascular function and the brain: is dementia a cardiovascular-driven disease? Circulation. (2017) 135:2178–95. doi: 10.1161/CIRCULATIONAHA.116.021978
16. Kunkle BW, Grenier-Boley B, Sims R, Bis JC, Damotte V, Naj AC, et al. Genetic meta-analysis of diagnosed Alzheimer's disease identifies new risk loci and implicates Aβ, tau, immunity and lipid processing. Nat Genet. (2019) 51:414–30. doi: 10.1038/s41588-019-0358-2
17. Nikpay M, Goel A, Won HH, Hall LM, Willenborg C, Kanoni S, et al. A comprehensive 1,000 genomes-based genome-wide association meta-analysis of coronary artery disease. Nat Genet. (2015) 47:1121–30. doi: 10.1038/ng.3396
18. Deelen J, Evans DS, Arking DE, Tesi N, Nygaard M, Liu X, et al. A meta-analysis of genome-wide association studies identifies multiple longevity genes. Nat Commun. (2019) 10:3669. doi: 10.1038/s41467-019-11558-2
19. Auton A, Brooks LD, Durbin RM, Garrison EP, Kang HM, Korbel JO, et al. A global reference for human genetic variation. Nature. (2015) 526:68–74. doi: 10.1038/nature15393
20. Marioni RE, Harris SE, Zhang Q, McRae AF, Hagenaars SP, Hill WD, et al. GWAS on family history of Alzheimer's disease. Transl Psychiatry. (2018) 8:99. doi: 10.1038/s41398-018-0150-6
21. Jansen IE, Savage JE, Watanabe K, Bryois J, Williams DM, Steinberg S, et al. Genome-wide meta-analysis identifies new loci and functional pathways influencing Alzheimer's disease risk. Nat Genet. (2019) 51:404–13. doi: 10.1038/s41588-018-0311-9
22. Bellenguez C, Küçükali F, Jansen IE, Kleineidam L, Moreno-Grau S, Amin N, et al. New insights into the genetic etiology of Alzheimer's disease and related dementias. Nat Genet. (2022) 54:412–36. doi: 10.1038/s41588-022-01024-z
23. Timmers PRHJ, Wilson JF, Joshi PK, Deelen J. Multivariate genomic scan implicates novel loci and haem metabolism in human ageing. Nat Commun. (2020) 11:3570. doi: 10.1038/s41467-020-17312-3
24. van der Harst P, Verweij N. Identification of 64 novel genetic loci provides an expanded view on the genetic architecture of coronary artery disease. Circ Res. (2018) 122:433–43. doi: 10.1161/CIRCRESAHA.117.312086
25. Bellou E, Stevenson-Hoare J, Escott-Price V. Polygenic risk and pleiotropy in neurodegenerative diseases. Neurobiol Dis. (2020) 142:104953. doi: 10.1016/j.nbd.2020.104953
26. Bulik-Sullivan B, Finucane HK, Anttila V, Gusev A, Day FR, Loh PR, et al. An atlas of genetic correlations across human diseases and traits. Nat Genet. (2015) 47:1236–41. doi: 10.1038/ng.3406
27. Altshuler DM, Gibbs RA, Peltonen L, Dermitzakis E, Schaffner SF Yu F, et al. Integrating common and rare genetic variation in diverse human populations. Nature. (2010) 467:52–8. doi: 10.1038/nature09298
28. Bulik-Sullivan BK, Loh PR, Finucane HK, Ripke S, Yang J, Patterson N, et al. LD Score regression distinguishes confounding from polygenicity in genome-wide association studies. Nat Genet. (2015) 47:291–5. doi: 10.1038/ng.3211
29. Werme J, van der Sluis S, Posthuma D, de Leeuw CA. An integrated framework for local genetic correlation analysis. Nat Genet. (2022) 54:274–82. doi: 10.1038/s41588-022-01017-y
30. Bhattacharjee S, Rajaraman P, Jacobs KB, Wheeler WA, Melin BS, Hartge P, et al. A subset-based approach improves power and interpretation for the combined analysis of genetic association studies of heterogeneous traits. Am J Hum Genet. (2012) 90:821–35. doi: 10.1016/j.ajhg.2012.03.015
31. Watanabe K, Taskesen E, van Bochoven A, Posthuma D. Functional mapping and annotation of genetic associations with FUMA. Nat Commun. (2017) 8:1826. doi: 10.1038/s41467-017-01261-5
32. Wang K, Li M, Hakonarson H, ANNOVAR. functional annotation of genetic variants from high-throughput sequencing data. Nucleic Acids Res. (2010) 38:e164. doi: 10.1093/nar/gkq603
33. Kircher M, Witten DM, Jain P, O'Roak BJ, Cooper GM, Shendure J, et al. general framework for estimating the relative pathogenicity of human genetic variants. Nat Genet. (2014) 46:310–5. doi: 10.1038/ng.2892
34. Boyle AP, Hong EL, Hariharan M, Cheng Y, Schaub MA, Kasowski M, et al. Annotation of functional variation in personal genomes using RegulomeDB. Genome Res. (2012) 22:1790–7. doi: 10.1101/gr.137323.112
35. Consortium G. The GTEx Consortium atlas of genetic regulatory effects across human tissues. Science. (2020) 369:1318–30.
36. Wang D, Liu S, Warrell J, Won H, Shi X, Navarro FCP, et al. Comprehensive functional genomic resource and integrative model for the human brain. Science. (2018) 362:8464. doi: 10.1126/science.aat8464
37. Schmiedel BJ, Singh D, Madrigal A, Valdovino-Gonzalez AG, White BM, Zapardiel-Gonzalo J, et al. Impact of genetic polymorphisms on human immune cell gene expression. Cell. (2018) 175:1701–15. doi: 10.1016/j.cell.2018.10.022
38. Ramasamy A, Trabzuni D, Guelfi S, Varghese V, Smith C, Walker R, et al. Genetic variability in the regulation of gene expression in ten regions of the human brain. Nat Neurosci. (2014) 17:1418–28. doi: 10.1038/nn.3801
39. de Leeuw CA, Mooij JM, Heskes T, Posthuma D, MAGMA. generalized gene-set analysis of GWAS data. PLoS Comput Biol. (2015) 11:e1004219. doi: 10.1371/journal.pcbi.1004219
40. Liberzon A, Subramanian A, Pinchback R, Thorvaldsdóttir H, Tamayo P., Mesirov JP. Molecular signatures database (MSigDB) 30. Bioinformatics. (2011) 27:1739–40. doi: 10.1093/bioinformatics/btr260
41. Kutmon M, Riutta A, Nunes N, Hanspers K, Willighagen EL, Bohler A, et al. WikiPathways: capturing the full diversity of pathway knowledge. Nucleic Acids Res. (2016) 44:D488–94. doi: 10.1093/nar/gkv1024
42. Hu D, Li Y, Zhang D, Ding J, Song Z, Min J, et al. Genetic trade-offs between complex diseases and longevity. Aging Cell. (2022) 21:e13654. doi: 10.1111/acel.13654
43. Grace C, Clarke R, Goel A, Farrall M, Watkins H, Hopewell JC. Lack of genetic support for shared aetiology of coronary artery disease and late-onset Alzheimer's disease. Sci Rep. (2018) 8:7102. doi: 10.1038/s41598-018-25460-2
44. Jun GR, Chung J, Mez J, Barber R, Beecham GW, Bennett DA, et al. Transethnic genome-wide scan identifies novel Alzheimer's disease loci. Alzheimers Dement. (2017) 13:727–38. doi: 10.1016/j.jalz.2016.12.012
45. Wu F, Yao PJ. Clathrin-mediated endocytosis and Alzheimer's disease: an update. Ageing Res Rev. (2009) 8:147–9. doi: 10.1016/j.arr.2009.03.002
46. Alsaqati M, Thomas RS, Kidd EJ. Proteins involved in endocytosis are upregulated by ageing in the normal human brain: implications for the development of Alzheimer's disease. J Gerontol A Biol Sci Med Sci. (2018) 73:289–98. doi: 10.1093/gerona/glx135
47. Cui K, Dong Y, Wang B, Cowan DB, Chan SL, Shyy J, et al. Endocytic adaptors in cardiovascular disease. Front Cell Dev Biol. (2020) 8:624159. doi: 10.3389/fcell.2020.624159
48. Fortney K, Dobriban E, Garagnani P, Pirazzini C, Monti D, Mari D, et al. Genome-wide scan informed by age-related disease identifies loci for exceptional human longevity. PLoS Genet. (2015) 11:e1005728. doi: 10.1371/journal.pgen.1005728
49. Łyszkiewicz M, Zietara N, Frey L, Pannicke U, Stern M, Liu Y, et al. Human FCHO1 deficiency reveals role for clathrin-mediated endocytosis in development and function of T cells. Nat Commun. (2020) 11:1031. doi: 10.1038/s41467-020-14809-9
50. Teerlink CC, Miller JB, Vance EL, Staley LA, Stevens J, Tavana JP, et al. Analysis of high-risk pedigrees identifies 11 candidate variants for Alzheimer's disease. Alzheimers Dement. (2022) 18:307–17. doi: 10.1002/alz.12397
51. Ge Y, Kang Y, Cassidy RM, Moon KM, Lewis R, Wong ROL, et al. Clptm1 limits forward trafficking of GABA. Neuron. (2018) 97:596–610. doi: 10.1016/j.neuron.2017.12.038
52. Harwood JC, Leonenko G, Sims R, Escott-Price V, Williams J, Holmans P. Defining functional variants associated with Alzheimer's disease in the induced immune response. Brain Commun. (2021) 3:fcab083. doi: 10.1093/braincomms/fcab083
53. Liu N, Xu J, Liu H, Zhang S, Li M, Zhou Y, et al. Hippocampal transcriptome-wide association study and neurobiological pathway analysis for Alzheimer's disease. PLoS Genet. (2021) 17:e1009363. doi: 10.1371/journal.pgen.1009363
54. Tao Y, Han Y, Yu L, Wang Q, Leng SX, Zhang H. The predicted key molecules, functions, and pathways that bridge mild cognitive impairment (MCI) and Alzheimer's disease (AD). Front Neurol. (2020) 11:233. doi: 10.3389/fneur.2020.00233
55. Zhou HJ, Chen X, Huang Q, Liu R, Zhang H, Wang Y, et al. AIP1 mediates vascular endothelial cell growth factor receptor-3-dependent angiogenic and lymphangiogenic responses. Arterioscler Thromb Vasc Biol. (2014) 34:603–15. doi: 10.1161/ATVBAHA.113.303053
56. Yu L, Shang ZF, Abdisalaam S, Lee KJ, Gupta A, Hsieh JT, et al. Tumor suppressor protein DAB2IP participates in chromosomal stability maintenance through activating spindle assembly checkpoint and stabilizing kinetochore-microtubule attachments. Nucleic Acids Res. (2016) 44:8842–54. doi: 10.1093/nar/gkw746
57. Dharshini SAP, Taguchi YH, Gromiha MM. Investigating the energy crisis in Alzheimer disease using transcriptome study. Sci Rep. (2019) 9:18509. doi: 10.1038/s41598-019-54782-y
58. Okada Y, Wu D, Trynka G, Raj T, Terao C, Ikari K, et al. Genetics of rheumatoid arthritis contributes to biology and drug discovery. Nature. (2014) 506:376–81. doi: 10.1038/nature12873
59. Giri A, Hellwege JN, Keaton JM, Park J, Qiu C, Warren HR, et al. Trans-ethnic association study of blood pressure determinants in over 750,000 individuals. Nat Genet. (2019) 51:51–62. doi: 10.1038/s41588-018-0303-9
60. Pilling LC, Kuo CL, Sicinski K, Tamosauskaite J, Kuchel GA, Harries LW, et al. Human longevity: 25 genetic loci associated in 389,166 UK biobank participants. Aging (Albany NY). (2017) 9:2504–20. doi: 10.18632/aging.101334
61. Astle WJ, Elding H, Jiang T, Allen D, Ruklisa D, Mann AL, et al. The allelic landscape of human blood cell trait variation and links to common complex disease. Cell. (2016) 167:1415–29. doi: 10.1016/j.cell.2016.10.042
62. Ando K, Houben S, Homa M, de Fisenne MA, Potier MC, Erneux C, et al. Alzheimer's disease: tau pathology and dysfunction of endocytosis. Front Mol Neurosci. (2020) 13:583755. doi: 10.3389/fnmol.2020.583755
63. Aidaralieva NJ, Kamino K, Kimura R, Yamamoto M, Morihara T, Kazui H, et al. Dynamin 2 gene is a novel susceptibility gene for late-onset Alzheimer disease in non-APOE-epsilon4 carriers. J Hum Genet. (2008) 53:296–302. doi: 10.1007/s10038-008-0251-9
64. Dato S, Crocco P, De Rango F, Iannone F, Maletta R, Bruni AC, et al. IP6K3 and IPMK variations in LOAD and longevity: evidence for a multifaceted signaling network at the crossroad between neurodegeneration and survival. Mech Ageing Dev. (2021) 195:111439. doi: 10.1016/j.mad.2021.111439
65. McGrath ER, Beiser AS, DeCarli C, Plourde KL, Vasan RS, Greenberg SM, et al. Blood pressure from mid- to late life and risk of incident dementia. Neurology. (2017) 89:2447–54. doi: 10.1212/WNL.0000000000004741
66. Lebel M, Monnat RJ. Werner syndrome (WRN) gene variants and their association with altered function and age-associated diseases. Ageing Res Rev. (2018) 41:82–97. doi: 10.1016/j.arr.2017.11.003
67. Kulminski AM, Culminskaya I. Genomics of human health and aging. Age. (2013) 35:455–69. doi: 10.1007/s11357-011-9362-x
68. Ashok A, Rai NK, Raza W, Pandey R, Bandyopadhyay S. Chronic cerebral hypoperfusion-induced impairment of Aβ clearance requires HB-EGF-dependent sequential activation of HIF1α and MMP9. Neurobiol Dis. (2016) 95:179–93. doi: 10.1016/j.nbd.2016.07.013
69. Jin K, Sun Y, Xie L, Batteur S, Mao XO, Smelick C, et al. Neurogenesis and aging: FGF-2 and HB-EGF restore neurogenesis in hippocampus and subventricular zone of aged mice. Aging Cell. (2003) 2:175–83. doi: 10.1046/j.1474-9728.2003.00046.x
70. Nygaard M, Debrabant B, Tan Q, Deelen J, Andersen-Ranberg K, de Craen AJ, et al. Copy number variation associates with mortality in long-lived individuals: a genome-wide assessment. Aging Cell. (2016) 15:49–55. doi: 10.1111/acel.12407
71. Bell JT, Tsai PC, Yang TP, Pidsley R, Nisbet J, Glass D, et al. Epigenome-wide scans identify differentially methylated regions for age and age-related phenotypes in a healthy ageing population. PLoS Genet. (2012) 8:e1002629. doi: 10.1371/journal.pgen.1002629
72. Shigemizu D, Mitsumori R, Akiyama S, Miyashita A, Morizono T, Higaki S, et al. Ethnic and trans-ethnic genome-wide association studies identify new loci influencing Japanese Alzheimer's disease risk. Transl Psychiatry. (2021) 11:151. doi: 10.1038/s41398-021-01272-3
73. Sellar GC, Watt KP, Rabiasz GJ, Stronach EA Li L, Miller EP, et al. OPCML at 11q25 is epigenetically inactivated and has tumor-suppressor function in epithelial ovarian cancer. Nat Genet. (2003) 34:337–43. doi: 10.1038/ng1183
74. Liu F, Arias-Vásquez A, Sleegers K, Aulchenko YS, Kayser M, Sanchez-Juan P, et al. A genomewide screen for late-onset Alzheimer disease in a genetically isolated Dutch population. Am J Hum Genet. (2007) 81:17–31. doi: 10.1086/518720
75. Baye TM, Perry RT, Wiener HW, Chen Z, Harrell LE, Go RC. Candidate gene discovery procedure after follow-up confirmatory analyses of candidate regions of interests for Alzheimer's disease in the NIMH sibling dataset. Dis Markers. (2008) 24:293–309. doi: 10.1155/2008/736409
76. Abad M, Moreno A, Palacios A, Narita M, Blanco F, Moreno-Bueno G, et al. The tumor suppressor ING1 contributes to epigenetic control of cellular senescence. Aging Cell. (2011) 10:158–71. doi: 10.1111/j.1474-9726.2010.00651.x
77. Borghesan M, Hoogaars WMH, Varela-Eirin M, Talma N, Demaria M. A senescence-centric view of aging: implications for longevity and disease. Trends Cell Biol. (2020) 30:777–91. doi: 10.1016/j.tcb.2020.07.002
78. Maggio M, Guralnik JM, Longo DL, Ferrucci L. Interleukin-6 in aging and chronic disease: a magnificent pathway. J Gerontol A Biol Sci Med Sci. (2006) 61:575–84. doi: 10.1093/gerona/61.6.575
79. Rosa M, Chignon A, Li Z, Boulanger MC, Arsenault BJ, Bossé Y, et al. A Mendelian randomization study of IL6 signaling in cardiovascular diseases, immune-related disorders, and longevity. NPJ Genom Med. (2019) 4:23. doi: 10.1038/s41525-019-0097-4
80. Persyn E, Hanscombe KB, Howson JMM, Lewis CM, Traylor M, Markus HS. Genome-wide association study of MRI markers of cerebral small vessel disease in 42,310 participants. Nat Commun. (2020) 11:2175. doi: 10.1038/s41467-020-15932-3
81. Ibanez KR, McFarland KN, Phillips J, Allen M, Lessard CB, Zobel L, et al. Deletion of Abi3/Gngt2 influences age-progressive amyloid β and tau pathologies in distinctive ways. Alzheimers Res Ther. (2022) 14:104. doi: 10.1186/s13195-022-01044-1
Keywords: pleiotropy, Alzheimer's disease, coronary artery disease, longevity, subset-based analysis (ASSET)
Citation: Bellou E and Escott-Price V (2023) Are Alzheimer's and coronary artery diseases genetically related to longevity? Front. Psychiatry 13:1102347. doi: 10.3389/fpsyt.2022.1102347
Received: 18 November 2022; Accepted: 12 December 2022;
Published: 06 January 2023.
Edited by:
Min Xu, Kunming Institute of Zoology, Chinese Academy of Sciences (CAS), ChinaReviewed by:
Yan Xia, Broad Institute, United StatesValerio Napolioni, University of Camerino, Italy
Copyright © 2023 Bellou and Escott-Price. This is an open-access article distributed under the terms of the Creative Commons Attribution License (CC BY). The use, distribution or reproduction in other forums is permitted, provided the original author(s) and the copyright owner(s) are credited and that the original publication in this journal is cited, in accordance with accepted academic practice. No use, distribution or reproduction is permitted which does not comply with these terms.
*Correspondence: Valentina Escott-Price,  escottpricev@cardiff.ac.uk