 Teresa J. Clark
 Jorg Schwender
- 1Biology Department, Brookhaven National Laboratory, Upton, NY, United States
- 2Department of Energy Center for Advanced Bioenergy and Bioproducts Innovation, Upton, NY, United States
Upregulation of triacylglycerols (TAGs) in vegetative plant tissues such as leaves has the potential to drastically increase the energy density and biomass yield of bioenergy crops. In this context, constraint-based analysis has the promise to improve metabolic engineering strategies. Here we present a core metabolism model for the C4 biomass crop Sorghum bicolor (iTJC1414) along with a minimal model for photosynthetic CO2 assimilation, sucrose and TAG biosynthesis in C3 plants. Extending iTJC1414 to a four-cell diel model we simulate C4 photosynthesis in mature leaves with the principal photo-assimilatory product being replaced by TAG produced at different levels. Independent of specific pathways and per unit carbon assimilated, energy content and biosynthetic demands in reducing equivalents are about 1.3 to 1.4 times higher for TAG than for sucrose. For plant generic pathways, ATP- and NADPH-demands per CO2 assimilated are higher by 1.3- and 1.5-fold, respectively. If the photosynthetic supply in ATP and NADPH in iTJC1414 is adjusted to be balanced for sucrose as the sole photo-assimilatory product, overproduction of TAG is predicted to cause a substantial surplus in photosynthetic ATP. This means that if TAG synthesis was the sole photo-assimilatory process, there could be an energy imbalance that might impede the process. Adjusting iTJC1414 to a photo-assimilatory rate that approximates field conditions, we predict possible daily rates of TAG accumulation, dependent on varying ratios of carbon partitioning between exported assimilates and accumulated oil droplets (TAG, oleosin) and in dependence of activation of futile cycles of TAG synthesis and degradation. We find that, based on the capacity of leaves for photosynthetic synthesis of exported assimilates, mature leaves should be able to reach a 20% level of TAG per dry weight within one month if only 5% of the photosynthetic net assimilation can be allocated into oil droplets. From this we conclude that high TAG levels should be achievable if TAG synthesis is induced only during a final phase of the plant life cycle.
Introduction
Plant oils are valuable crop products because of their energy density and potential biofuel use. While plants accumulate oils mostly as triacylglycerol (TAG) in specialized organs, there is increasing interest in developing bioenergy crops that accumulate TAG in the vegetative parts of the plant (Durrett et al., 2008; Shih et al., 2016; Xu and Shanklin, 2016; Lee et al., 2017). While oilseeds can accumulate between 20 and 50% TAG by weight (Ohlrogge and Chapman, 2011; Wan et al., 2017), seeds typically make up only a fraction of the plant biomass produced during a growing cycle. It has been estimated that if the bulk of above ground harvested plant biomass would contain TAG at 10% (w/dw), yields per acre could be substantially higher than achievable for any seed oil crop (Ohlrogge and Chapman, 2011). Also, as a by-product, vegetative TAG would be particularly beneficial in high yielding bioenergy grasses that are already harvested for other compounds (Carpita and McCann, 2008; Weijde et al., 2013). Sugarcane, for example, has been engineered to accumulate on average 4.3% (w/dw) TAG in its stems and up to 8% (w/dw) TAG in its leaves (Parajuli et al., 2020) and a techno-economic analysis determined that processing sugarcane containing 5% TAG per total dry weight for biodiesel in addition to converting its native sugars into ethanol would be economically advantageous, and 20% TAG could nearly double the potential profits compared to normal sugarcane (Huang et al., 2016).
However, vegetative tissues like leaves tend to have low intrinsic capacity to produce and store TAG at high levels (Chapman et al., 2013; Xu and Shanklin, 2016). It is therefore to be expected that efforts to engineer accumulation of TAG in vegetative tissues requires complex reprogramming of metabolism. To date, the most successful studies on engineering plants to accumulate TAG in vegetative tissues have used combinatorial gene expression approaches and many of the applied designs can be related to the “push-pull-protect” paradigm (Vanhercke et al., 2014, 2019b). Here the general strategy implies that substantial TAG accumulation requires the manipulation of multiple gene targets to (1) divert a portion of carbon fixed by primary photosynthesis into fatty acid synthesis (“push”), (2) increase the capacity to assemble de novo synthesized fatty acids into TAG (“pull”), and (3) suppress leaf intrinsic lipid degradation processes (“protect”) that frequently appear to counteract TAG accumulation (Chapman et al., 2013; Xu and Shanklin, 2016; Vanhercke et al., 2019b). In a recent survey of more than 20 studies aimed at maximizing TAG accumulation in vegetative plant tissues (Vanhercke et al., 2019b), the median of the reported TAG levels is 3.6% (w/dw), with the highest levels reaching close to 30% (w/dw) in leaves of Nicotiana tabacum and Nicotiana benthamiana. As for possible limitations to the accumulation of TAG in vegetative tissue, the high biosynthetic cost of lipid synthesis comes to mind. TAG is a highly reduced form of carbon with more than twofold the energy density of protein or carbohydrate (Ohlrogge and Chapman, 2011). Considering TAG as an alternative carbon sink to sucrose, the principal product of leaf photosynthesis, it is of interest to know how much additional metabolic cost is incurred if TAG is synthesized as the alternative photo-assimilatory product and at which level of TAG accumulation the overall carbon and energy balance of a plant can be expected to be substantially affected. Several studies aimed at engineering vegetative TAG accumulation reported yield penalty effects (Kim et al., 2015; Vanhercke et al., 2017; Chu et al., 2020; Mitchell et al., 2020; Parajuli et al., 2020) which might be attributed to the high biosynthetic cost of TAG, or to energy losses caused by futile cycles of lipid synthesis and degradation. However, there also have been reports of overall increased photosynthetic capacity and plant growth in TAG over-accumulating Arabidopsis thaliana and Lolium perenne (Winichayakul et al., 2013; Beechey-Gradwell et al., 2020; Cooney et al., 2021). It appears that we currently lack a good understanding of the effects of TAG over-accumulation on metabolism, physiology, and the overall plant life cycle. Studies on vegetative TAG engineering generally report TAG levels in tissues as metabolic end points, without assessing in vivo metabolic rates or defining a theoretical yield as a benchmark. It therefore would be useful to explore the theoretical capacity of a green vegetative tissue to accumulate TAG based on the capacity to photo-assimilate CO2. Assuming that the metabolic network can be manipulated as to divert intermediates of the Calvin–Benson–Bassham (CBB) cycle away from synthesis of sucrose and other photo-assimilates toward TAG synthesis, the achievable TAG accumulation rate will depend on how much of the fixed carbon can be re-allocated and on the cost in energy cofactors for TAG synthesis.
Toward that end, here we present a genome-referenced core metabolic model (iTJC1414) of Sorghum bicolor, a high biomass yielding C4 crop species, with detailed manual curation of NADP-malic enzyme (NADP-ME) type C4 photosynthesis, lipid metabolism and other parts of central metabolism. To investigate the metabolic potential to photo-assimilate CO2 into carbohydrate or TAG, we constructed a two-cell leaf model representing C4 metabolism (iTJC1414x2) that was further expanded into a diel model that simulates cycles of day and night leaf metabolism (iTJC1414x4). To assess the potential for TAG biosynthesis, we compared the chemical balances and biochemical pathways for assimilation of CO2 into sucrose and TAG, respectively. We analyzed the costs and the supply/demand balance between photosynthetic supply and biosynthetic demands of energy cofactors (ATP and NADPH). Using iTJC1414x4, we simulated partitioning between the phloem-exported photo-assimilates and accumulated oil droplets and predicted their potential daily net productions. A series of scenarios was used to predict how fast TAG could accumulate in a mature leaf, dependent on the fraction of assimilated carbon assumed to be diverted into TAG accumulation. We further assessed the effect of metabolic futile cycles of TAG or fatty acid biosynthesis and degradation in draining cellular energy reserves and limiting TAG accumulation. Overall, our findings reveal that based on the typical photosynthetic potential of a sorghum leaf, TAG could accumulate much faster than the typical duration of the life cycle. If only 5% of the primary carbon fixation is diverted into TAG synthesis without superimposed futile cycles, a 20% yield target (TAG weight per leaf dry weight) could be reached within only 18 simulated day/night cycles. Our quantitative assessments give a perspective on past efforts at metabolic engineering of TAG accumulation in photosynthetic plant tissues as well as might serve as a guide for future efforts in this direction.
Materials and Methods
Reconstruction of Sorghum bicolor Metabolic Model
In the following we describe the reconstruction of an S. bicolor four-cell metabolic model (iTJC1414x4) with the capacity to simulate C4 photosynthesis as well as to integrate a day phase with a night phase during which storage compounds accumulated during the day are consumed. We based the metabolic reaction network on iEB2140x2 (Bogart and Myers, 2016), a two-cell high confidence representation of Zea mays core metabolism with 635 reactions of which 469 are associated to a total of 2,140 maize genes. To relate the model to S. bicolor, we derived genome wide synteny/orthology associations between maize and sorghum. Predicted protein sequences for amino acid sequences and chromosomal order of 63,480 Z. mays protein encoding genes (B73 v3, Schnable et al., 2009) and of 34,129 S. bicolor protein encoding genes (S. bicolor cultivar BTx623, genome assembly v3.1.1, McCormick et al., 2018) were obtained from Phytozome genomic resource.1 Z. mays protein sequences were used as queries to identify orthologs in S. bicolor using the SynOrths tool (version 1.0, Cheng et al., 2012). In short, this tool identifies likely pairs of ortholog genes in two related species based on similarities in protein sequences with additional support from homologous flanking genes. For Z. mays genes for which SynOrths did not predict orthologs, protein BLAST (version 2.8.1, Altschul et al., 1997) was used to align amino acid sequences and top hits were assumed to be orthologs if they had at least 90% alignment and 70% identity. Since maize is tetraploid (Swigonova et al., 2004) while S. bicolor is diploid (Price et al., 2005), we expect quite frequently two or more maize genes to map to the same sorghum locus. Indeed, out of over 24,000 S. bicolor genes for which orthology relations were identified, in more than 60% of cases, an S. bicolor gene was orthologous to more than one Z. mays gene (Supplementary Figure 1A).
The Z. mays modeling file (iEB2140x2) was obtained from Bogart and Myers (2016) and transferred to S. bicolor in a spreadsheet format (COBRA toolbox, Microsoft Excel 2016). The model was extended from a two-cell model (x2) connecting a bundle-sheath cell (BSC) and a mesophyll cell (MC) to a diel model (x4). Per sub-model, reactions were expanded or validated using the Kyoto Encyclopedia of Genes and Genomes,2 Plant Metabolic Pathway Databases,3 and Phytozome v12.1. The network reactions were revised according to literature, as presented in Supplementary Table 1. Briefly, we moved the reactions for de novo fatty acid biosynthesis (through C18) from the cytosol to the plastid. Acetyl-coenzyme A (CoA) in the plastid can be diverted directly from the CBB cycle by the C3→C2 pathway, involving conversion of 3-phosphoglycerate (3-PGA) via 2-PGA, phosphoenolpyruvate and pyruvate to acetyl-CoA (Joyard et al., 2010). TAG was not represented in the initial maize model, so we added its synthesis from phosphatidylcholine (PC) and/or diacylglycerol (DAG), as well as its breakdown into glycerol and free fatty acids. The lipid classes were originally represented by generic molecules (Bogart and Myers, 2016). To simulate metabolic effects resulting from differences in fatty acid chain lengths, we took an approach similar to that taken by Simons et al. (2014) and defined four majorly abundant fatty acid species (C16:0, C18:1, C18:2, and C18:3) to be associated with cytosolic PC, DAG, and TAG molecular species without assigning stereospecific positioning (e.g., sn-1 and sn-2). We added reactions to synthesize these lipid classes, expanded how PC-bound fatty acids are desaturated by cytosol/endoplasmic reticulum-localized desaturase enzymes, and added a PC-dependent acyl editing cycle (Li-Beisson et al., 2013). Next, to allow for testing the effects of futile cycles of lipid synthesis and degradation, we added peroxisomal β-oxidation to recycle cytosolic free fatty acids as well as CoA ligation reactions (Long-Chain Acyl-CoA Synthetase, EC 6.2.1.3) to reuse free fatty acids to synthesize TAG.
For numerical simulations the model was converted to Systems Biology Markup Language (SBML) using a Python4 script derived from Hay et al. (2014). Linear programming analyses were performed using the constraint-based reconstruction and analysis (COBRA) toolbox version 3.1 (Heirendt et al., 2019) and GLPK solver5 within the MATLAB R2018b environment (The MathWorks, Natick, MA, United States). Mathematical flux ratio constraints were imposed using the COBRA function “addCOBRAConstraints.” The S. bicolor iTJC1414 single-cell model is provided in Supplementary File 1. The full leaf diel iTJC1414x4 model with simulation codes are provided in Supplementary File 2.
Model Constraints for the NADP-Malic Enzyme Subtype of C4 Photosynthesis
Several numerical constraints were added to the model for model simulations to be consistent with the NADP-ME subtype of C4 photosynthesis (Supplementary Table 2). In plants with the NADP-ME subtype, the malate/pyruvate transfer is the main mechanism to shuttle CO2 from MCs to BSCs, while a secondary aspartate/malate shuttle mechanism has been reported to be of significance as well in NADP-ME C4 plants like sorghum (Yin and Struik, 2018). These transport flows through plasmodesmata are generally thought to be driven by strong concentration gradients between the cell types (Wang et al., 2014a; Arrivault et al., 2017), which means that malate, for example, can be assumed to be always moving from MCs to BSCs and never in the opposite direction. Accordingly, among the plasmodesmata transport reactions available in iTJC1414x4, we allowed transport of malate and aspartate from MCs toward BSCs as well as pyruvate and alanine in the opposite direction (Figure 1 and Supplementary Table 2). NADP-ME type species tend to contain little capacity for photoreduction of 3-PGA in the BSCs (Hatch, 1987), which suggests the operation of a 3-PGA/triose phosphate shuttle between BSCs and MCs so that part of the 3-PGA reduction can take place in the MCs. Accordingly, we allowed 3-PGA and glyceraldehyde 3-phosphate to move between the cell types. Due to the presence of various isoforms of ME in the model, cytosolic isoforms and the plastidic NADH-dependent isoform were inactivated so that only the BSC plastidic NADP-ME will be active in decarboxylation of malate in the C4 cycle. Phosphoenolpyruvate carboxykinase is another decarboxylating enzyme in C4 metabolism known to be of relevance in species of the NADP-ME subtype. However, the reaction was inactivated in our model because phosphoenolpyruvate carboxykinase activity was reported to be missing in sorghum (Gutierrez et al., 1974; Walker et al., 1997; Döring et al., 2016). Some CO2 liberated by decarboxylation of malate is expected to leak from BSCs to the MCs due to the concentration gradient between the two cells (von Caemmerer and Furbank, 2003; de Oliveira Dal’Molin et al., 2010; Wang et al., 2014b). Jenkins et al. (1989) estimated this leakage to comprise 13.4% of the inorganic CO2 liberated by C4 acid decarboxylation in the BSCs. Since essentially all the CO2 fixed in BSCs passes through ribulose bisphosphate carboxylase/oxygenase (RubisCO), we applied the 13% leakage estimate on the rate of RubisCO carboxylation. As well, from the expected CO2 and O2 availabilities in BSCs, RubisCO carboxylase activity is expected to be 29.2-fold greater than its oxygenase activity in NADP-ME-type C4 plants (Jenkins et al., 1989). Consequently, the CO2 leakage and photorespiration reactions were constrained to match these literature estimates (Supplementary Table 2).
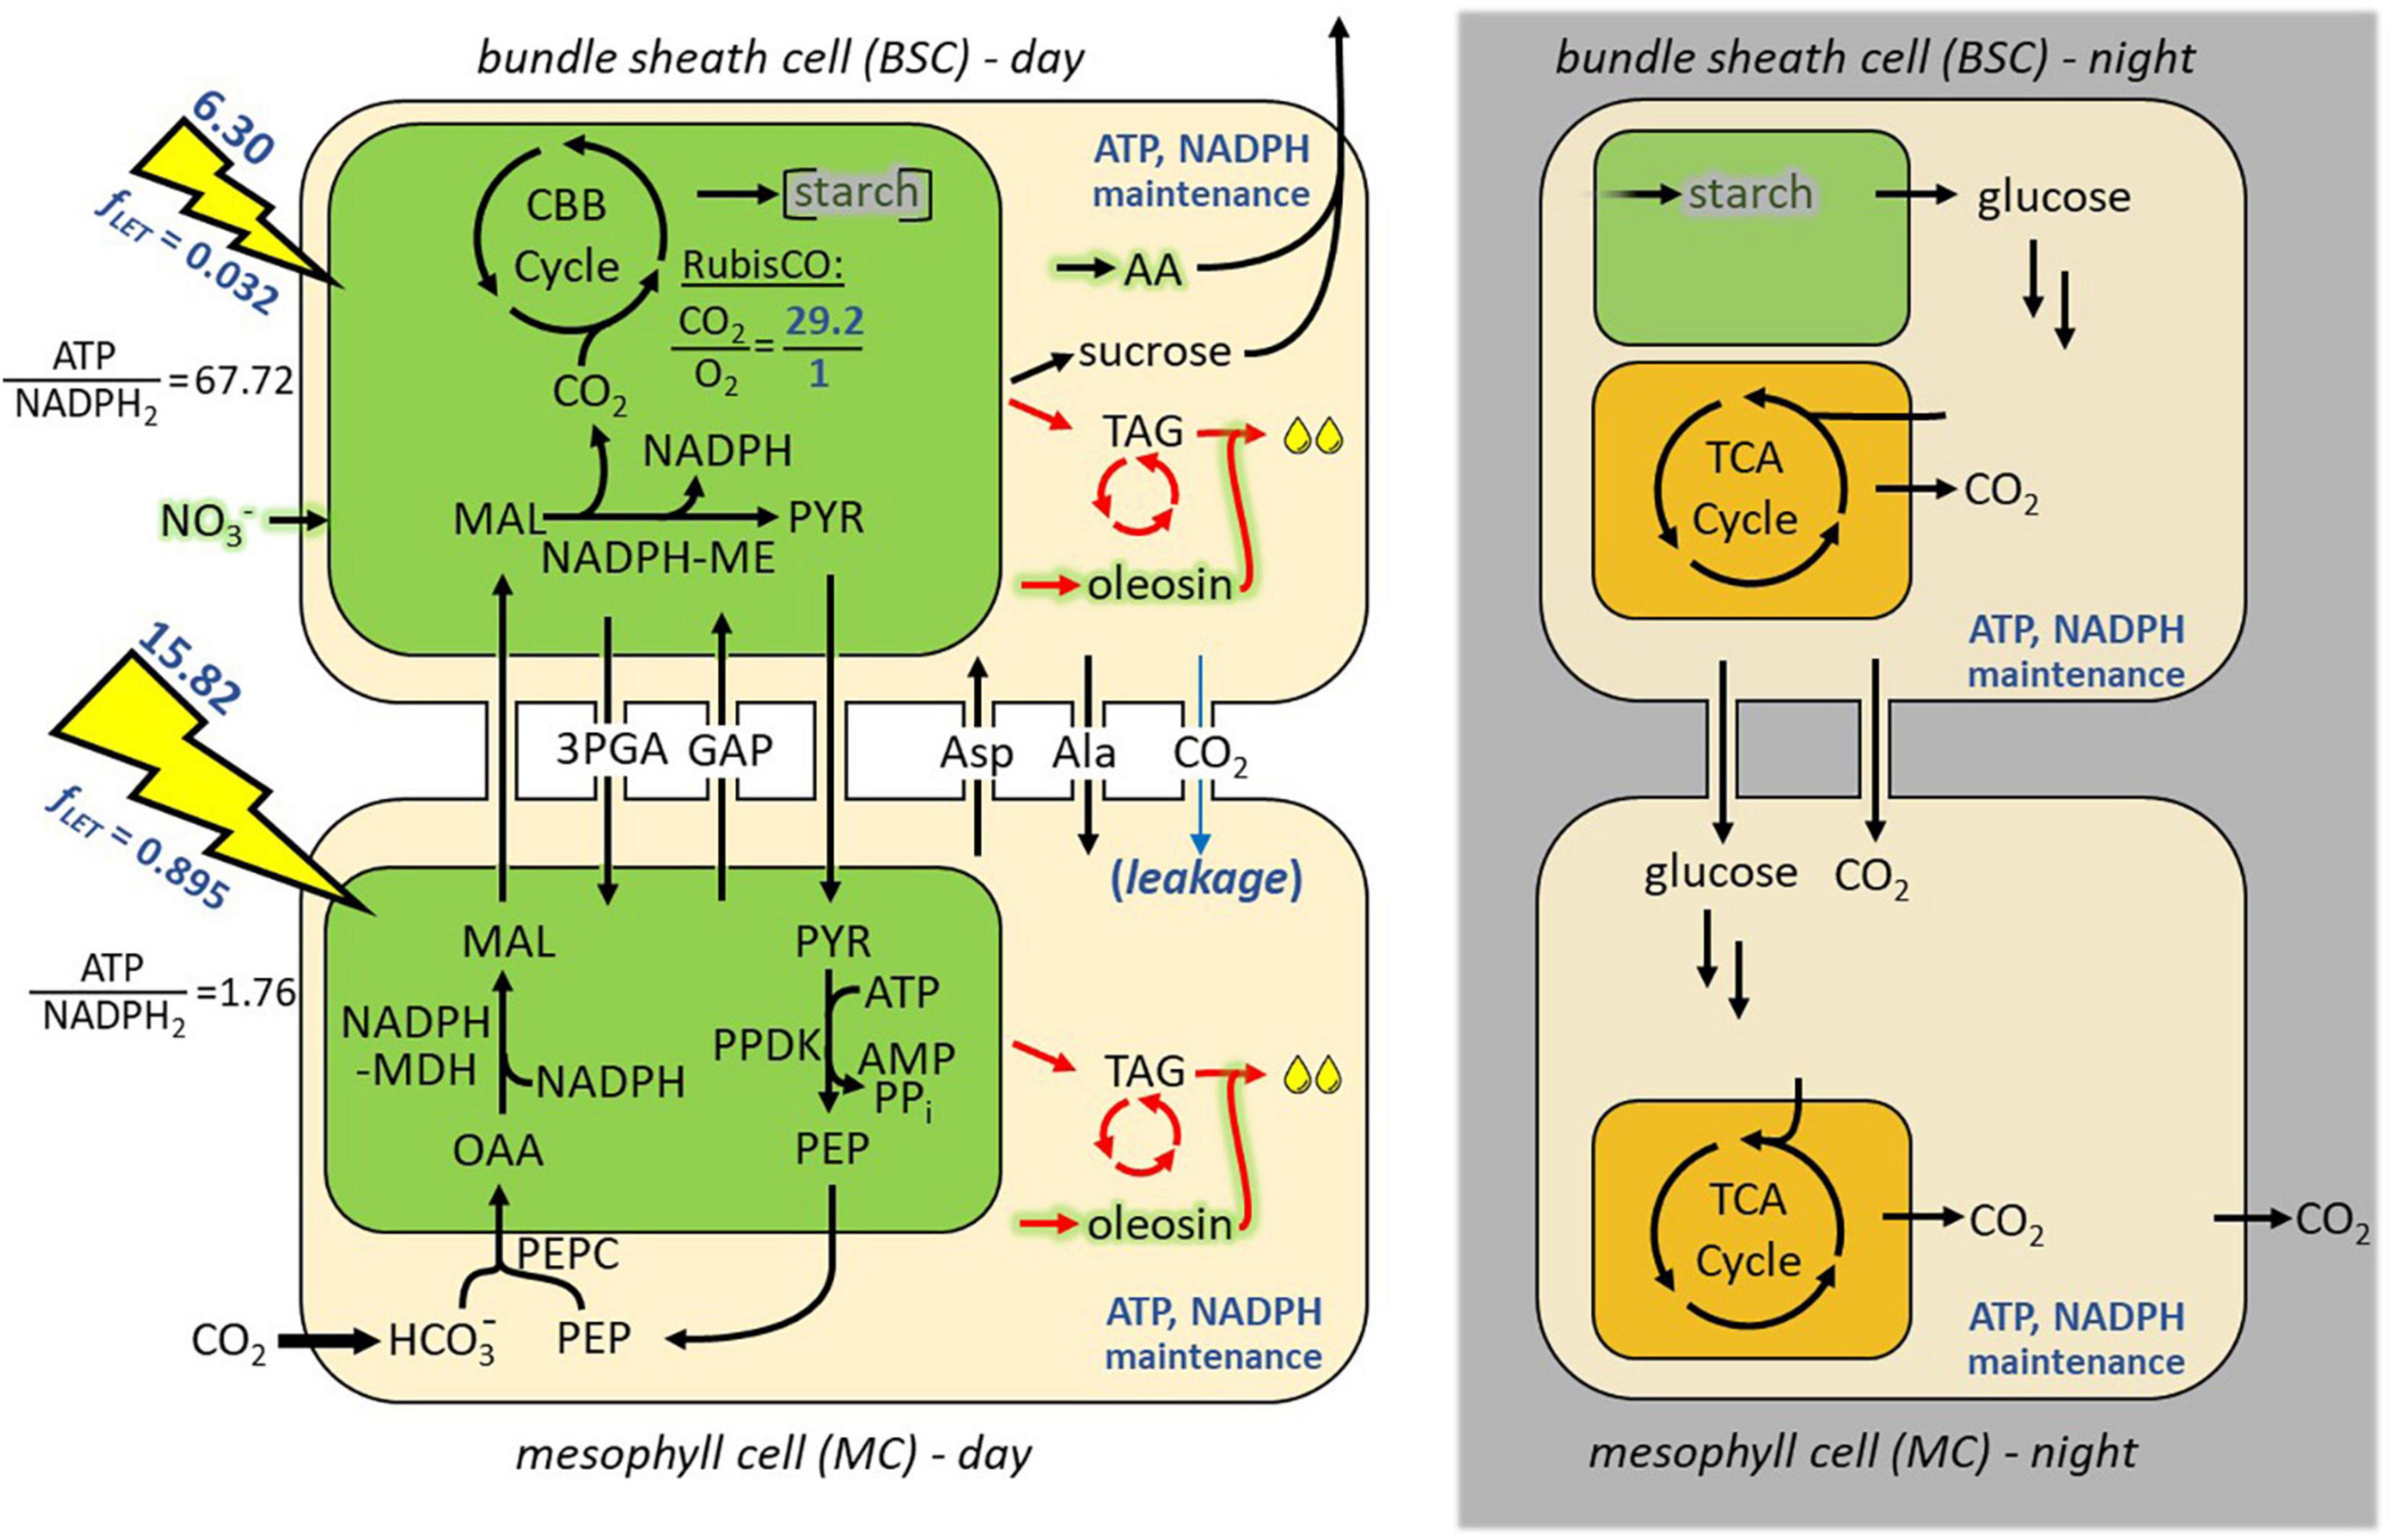
Figure 1. Diel model of NADP-ME subtype C4 photosynthesis in mesophyll and bundle sheath cells (iTJC1414x4). Shown are the major metabolic processes in mesophyll (bottom row) and bundle sheath (top row) cells that are predicted to take place during photo-assimilation. Chloroplastic and mitochondrial compartments are shown in green and orange, respectively. Model constraints that pertain to the mature leaf reference state described in the text (i.e., distribution of photosynthetic energy, maintenance respiratory processes, RubisCO oxygenation, and CO2 leakage) are indicated in blue (see also Supplementary Table 2). For both cell types, fixed proportions of ATP and NADPH supply by light reactions are indicated (see main text). Carbon reallocation to TAG and lipid futile cycle pathways is are indicated in red (see main text). Diel cycling was simulated with light being only accessible for the day sub-models (left column), which provides starch for use by the night sub-models (right column). On the night side of the model catabolic and respiratory activity is caused by fixed ATP and NADPH maintenance costs. Nitrate assimilation is indicated in green shading. 3PGA, 3-phosphoglycerate; AA, amino acids; AcCoA, acetyl coenzyme A; Ala, alanine; Asp, aspartate; CBB cycle, Calvin–Benson–Bassham cycle; fLET, fraction of absorbed light that drives linear electron transport; GAP, D-glyceraldehyde 3-phosphate; MAL, malate; ME, malic enzyme; MDH, malate dehydrogenase; NO3–, nitrate; OAA, oxaloacetate; PEP, phosphoenolpyruvate; PEPC, phosphoenolpyruvate carboxylase; PPDK, pyruvate phosphate dikinase; PYR, pyruvate; RubisCO, ribulose 1,5-bis-phosphate carboxylase/oxygenase; TAG, triacylglycerol; TCA, tricarboxylic acid.
Modeling of Diel Metabolism
CO2 assimilation by C4 photosynthesis and allocation of reduced carbon was modeled by considering the interactions of day and night metabolism in a diel Flux Balance Analysis (FBA) model similar to other reported diel plant models (Cheung et al., 2014; de Oliveira Dal’Molin et al., 2018; Shaw and Cheung, 2018). In essence, the S. bicolor C4 core metabolism model with interconnected MC and BSC sub-models (iTJC1414x2) was duplicated into representations of day and night. In the resulting diel model with four cellular sub-models (iTJC1414x4), the BSC day and night cells share a common pool that represents transitory starch (Figure 1), while MCs are assumed to not store starch. This is according to literature findings that starch is observed mainly in the BS chloroplasts of C4 species like Z. mays and sorghum (Lunn and Furbank, 1997). Light is only available as an energy source for the day sub-models which contribute to the starch pool while the night models rely on starch degradation to fuel dark metabolism and respiration (Supplementary Table 2). In general, flux states were obtained based on the principle of light-limiting conditions. Given a fixed biosynthetic rate of a photosynthetic product, total light uptake fluxes were minimized. Alternatively, given fixed light uptake fluxes, the biosynthetic rate of a photosynthetic product was maximized. To simulate C4 photosynthesis, only the MC is allowed to exchange CO2 with the external environment and RubisCO is only active in the BSC (Supplementary Table 2). Net CO2 uptake (VnetCO2) is defined as the difference between daily uptake of CO2 (VCO2uptake) and CO2 loss at night (VCO2export):
By linking the four sub-models (BSC-day, MC-day, BSC-night, and MC-night) through the shared starch pool, a single linear optimization procedure predicts fluxes that are in steady-state over the integrated day-night cycle.
Simulating Carbon Allocation
Model analyses in this study assume cells are mature, thus no longer growing, and TAG and sucrose are the primary net carbon sinks. Although we modeled non-growing cells in this study, we also updated the iTJC1414x4 biomass composition constraints using published S. bicolor carbohydrate, lignin, amino acid, and lipid ratios (Supplementary Table 3) and confirmed that the model was functional if maximizing total biomass was used as the objective function. The fatty acid composition of TAG was defined as reported for wild-type sorghum leaves (Vanhercke et al., 2019a). Transgenic studies aimed at increasing TAG accumulation in vegetative tissues have regularly reported TAG compositions that are distinctly different from the wild-type (Xu and Shanklin, 2016; Vanhercke et al., 2019b). As described in section “Results,” changes in TAG fatty acid composition that have been observed in sorghum high-oil lines (Vanhercke et al., 2019a) do not majorly affect biosynthetic energy demands and were therefore not considered here. Similarly, we did not consider here the possibility that increased leaf TAG levels may in part be attributable to re-balancing fatty acids between membrane lipids and TAG. For example, in a recent study on high oil accumulating tobacco lines (Zhou et al., 2020) there was a dramatic decrease in levels of chloroplastic galactolipids in the transgenic line which likely benefited TAG production. Our model does not consider the potentially involved lipid trafficking mechanisms between chloroplast and cytosol/endoplasmic reticulum. To our knowledge these mechanisms are not yet fully elucidated. We verified that sucrose and precursors for TAG biosynthesis can be generated by canonical pathways. In short, the primary CO2 fixation product in the CBB-cycle in the chloroplast, 3-PGA, can be directly transformed into pyruvate by a series of glycolytic reactions, which can then be transformed into acetyl-CoA by the plastid-localized pyruvate dehydrogenase complex (PDHp) (Bassham and Calvin, 1960; Li-Beisson et al., 2013). Alternatively, PGA can be reduced to triose phosphates (Bassham and Calvin, 1960), which are then transformed into transitory starch or sucrose for export (Raines, 2003).
For modeling carbon allocation scenarios, we consider here that the primary products of photo-assimilation are exported via phloem to other organs or that, due to an envisioned transgenic intervention to engineer TAG accumulation, a part of the assimilated carbon is diverted into oil droplets and stored in the leaf. Apart from changes in leaf TAG levels, the carbon allocation scenarios simulated here do not consider changes in leaf levels of other biomass constituents such as sugars, starch, or amino acids. While for a mature leaf, sucrose can be understood as the predominant exported photo-assimilate, it can be considered that amino acids are exported as well, which is supported by studies of phloem sap composition in various plants (Wilkinson and Douglas, 2003). We therefore defined photo-assimilate based on the composition of sucrose and amino acids found in phloem sap of barley leaves (Winter et al., 1992). The combined assimilate export is comprised of sucrose and 17 amino acids (Supplementary Table 4) with a sucrose to amino acid ratio of 94:6 (by weight). Also, while TAG can be considered to be the predominant product of the envisioned metabolic engineering effort, oleosin proteins are major components of oil droplets that are stored as intracellular particles (Ohlrogge and Chapman, 2011). Oleosins were estimated to comprise 1–5% of the oil droplet weight in maize embryos while the remainder is mostly TAG (Ting et al., 1996). Consequently, in carbon allocation simulations we define the deposition of oil droplets as biosynthesis of TAG and oleosin at a 95:5 ratio (by weight) (Supplementary Table 5). Here, the oleosin has an amino acid composition that matches Sesamum indicum oleosin-L (Tai et al., 2002; Supplementary Table 5). This protein was over-expressed in sorghum leaves in the study of Vanhercke et al. (2019a).
Note that nitrate reduction and ammonia assimilation into amino acids take place in the simulated assimilate export as well as in oleosin synthesis. Nevertheless, since nitrogen plays only a minor role, we will keep here the term “carbon allocation” for the model simulations of assimilate export, and TAG and oleosin deposition. For simulations on TAG accumulation, the objective function used was to maximize the TAG and oleosin accumulation in MC and BSC during the day. This allows TAG and oleosin biosynthesis to take place in day metabolism for both cell types. This procedure appears to be justified because when WRI1, DGAT, and oleosin were expressed under a constitutive promoter in sorghum, oil droplets were found to accumulate in both cell types (Vanhercke et al., 2019a). For simulations of carbon allocation scenarios, different carbon allocation ratios were enforced based on the equation
where Poil is the percentage of net CO2 uptake transformed into TAG and oleosin, and VAex is the assimilate export flux to the phloem, with the average photo-assimilate being 12.77162 mol carbon per mol. For any chosen carbon allocation ratio Poil > 0%, the model can be optimized by maximization of the total oil droplet accumulation rate. Because steady-state day-night cycling is integrated into the model, the simulations predict fluxes in units of mol/m2/day, including the total accumulation rate of TAG.
Given a daily oil droplet accumulation rate (VoilDroplet), one can determine the time period needed (t) in days for a full-grown leaf to accumulate a desired amount of TAG per dry weight:
where CTAG is the desired TAG content in the leaf expressed as percent dry weight, L is the initial dry weight per leaf area which was set to 60 g/m2, as reported for sorghum (Zhao et al., 2005). MTAG is the molecular weight of TAG (866.811 g/mol) based on the molecule species composition as defined in the model biosynthesis reactions. Note that the reaction equation for the daily oil droplet accumulation rate (VoilDroplet) is defined so that 1 mol TAG is produced (866.81 g) along with 45.55 g oleosin, so that oleosin is 5% of the total in weight (Supplementary Table 5).
Testing Futile Lipid Cycles
We used our model to explicitly test two types of futile cycles that will be referred to as TAG cycling and FA cycling. TAG cycling is defined as the ratio of fluxes toward TAG synthesis and TAG storage in oil droplets (detailed equations in Supplementary Table 6):
Succinctly, the TAG cycling ratio indicates to what extent TAG is over-produced for the predicted rate of TAG storage. The excess TAG must be hydrolyzed into glycerol and free fatty acids. As will be seen from the model simulations (see section “Results”), under limited energy input (light) and with increasing TAG cycling there will be reduced flux into TAG storage. Like TAG cycling, FA cycling is the ratio of fluxes toward fatty acid synthesis compared to that which is used for TAG storage in oil droplets (detailed equations in Supplementary Table 6):
By defining FA cycling in this way, the over-produced portion of fatty acids cannot be utilized and is therefore subjected to degradation (β-oxidation). Products and energy cofactors generated by the degradation process are recycled.
Defining Photosynthetic Energy Cofactor Production
The default configuration of iTJC1414x4 allows photon flux to freely distribute between the BSC and MC and between the linear and cyclic components of photosynthetic electron transport. To model the light absorption more realistically, we generated sorghum-specific light flux distribution settings from a model for cell-type specific electron transport in C4 photosynthesis (Yin and Struik, 2018), which integrates multiple photosynthesis-related biophysical and biochemical characteristics (see Supplementary File 3). One predicted parameter, aBS,M, defines the ratio at which total received light absorptance is partitioned between the BSC and MC (Yin and Struik, 2018). This ratio was applied to iTJC1414x4 as a linear dependency between the two light uptake fluxes:
The model by Yin and Struik (2018) also predicts the fraction of the absorbed light that drives linear electron transport (LET) for each of the two cell types. Here we designate these as fLET,M and fLET,BS for the MC and BSC, respectively. To add the fLET parameters as numerical constraints to iTJC1414x4 we derived the following equation (for details see Supplementary File 3):
with vPSI and vPSII being the rates of the reactions representing photosystem I and II in iTJC1414x4, respectively (“PhotosystemImodchloroplast,” “PhotosystemIImodchloroplast”). Applying the energy budget parameters aBS,M, fLET,BS and fLET,M to iTJC1414x4 by Equations 6, 7 will cause the photosynthetic supply of ATP and NADPH to be at fixed proportions in the BSC and MC and at a fixed overall ATP/NADPH supply ratio. If the photosynthetic supply is fixed and the biosynthetic output has a fixed composition, there can be an imbalance between supply and metabolic demands of ATP and NADPH. Such an imbalance causes one of the two energy cofactors to be overproduced, i.e., it will either accumulate or dissipate in a process that is not related to biosynthesis. In the context of iTJC1414x4, no accumulation of metabolites can materialize since FBA is a steady-state modeling approach. Instead, we characterize imbalanced scenarios in iTJC1414x4 by detecting net hydrolysis of ATP that does not drive biosynthesis and by detecting mitochondrial oxidative phosphorylation that leads to more ATP production at the expense of oxidation of photosynthetically generated reducing equivalents. Specifically, ATP surplus is quantified by maximizing an ATP-consuming dummy reaction in a secondary optimization (Supplementary Figure 2). The size of the flux through complex IV of the mitochondrial electron transport chain (“ComplexIVmodmitochondrion”) reveals the amount of photosynthetically produced reducing equivalents that are transferred back to oxygen. Both ATP surplus and NADPH surplus are quantified by a Flux Variability procedure as indicated in Supplementary Figure 2. The ATP surplus and NADPH surplus quantified this way reveals misalignment between photosynthetic supply of ATP and NADPH and biosynthetic demands. Tests showed that if the energy budget parameters are not applied, no ATP or NADPH surplus is detected. Furthermore, as detailed in Supplementary File 3, if sucrose is the biosynthetic product, values for aBS,M, fLET,BS and fLET,M can be derived from the Yin and Struik model and applied to iTJC1414x4, leading to a balanced energy budget, i.e., no ATP or NADPH surplus is detected.
Constraining Photosynthetic Rates Based on Leaf Physiology
To set the photosynthetic assimilation rate in iTJC1414x4, we searched literature to define physiologically realistic values for daily photosynthetic rates of CO2 fixation for a sun-lit sorghum leaf under non-stressed field conditions. While direct measurements of total CO2 uptake have been reported for bioenergy grasses such as miscanthus and switchgrass (Dohleman et al., 2009), we could not find such data for sorghum. Reviewing literature for photosynthetic performance data specifically on S. bicolor, we found measurements of maximal photosynthetic CO2 fixation rates at mid-day. We therefore first derived an approximation to convert maximal photosynthetic CO2 fixation rates at mid-day to daily rates. Dohleman et al. (2009) measured leaf CO2 uptake rates for miscanthus and switchgrass for upper canopy sunlit leaves every 2 h on multiple days during the growing season. By plotting these uptake rates against time of day, the authors proposed a geometric method for estimating the daily photosynthesis rate. Here, we estimate the time course plot can be approximated with a parabolic function that peaks at mid-day and can be integrated to determine the daily rate. Accordingly, we defined the integral of daily CO2 fixation as 2/3 × (maximal photosynthetic CO2 fixation) × daylength (Supplementary Figure 3) and used this relation to estimate daily CO2 uptake rates for sorghum leaves based on mid-day photosynthetic rates. Around mid-day, under non-stressed conditions and at highest photosynthetic photon flux density, CO2 uptake rates measured for 22 S. bicolor genotypes ranged from 23.5 to 44.8 μmol CO2/m2/s, with an average of 38.2 μmol CO2/m2/s (Peng et al., 1991). In another study, under similar conditions, a range of 43.3–56.9 μmol CO2/m2/s was measured for 26 sorghum genotypes (Balota et al., 2008). Based on the two studies, we chose 40 μmol CO2/m2/s as a conservative estimate for the maximal photosynthetic rate. Using the parabola approximation with a daylength of 14 h, the CO2 uptake from the environment into the leaf during the daylight period is 1.344 mol CO2/m2/day.
In addition to the photosynthetic rates, it is important to consider energetic losses associated with cellular maintenance activities. This refers, for example, to energetic expenditures for maintenance of membrane gradients or continuous turnover of biopolymers. In plant FBA models such energetic costs are often classified as unspecified ATP as well as NADPH consumption (Sweetlove et al., 2013). To mimic energetic burdens of cellular maintenance, each cellular sub-model of iTJC1414x4 includes a generic reaction to hydrolyze ATP (“GenericATPasemod”) and one to oxidize NADPH (“GenericNADPOxidasemod”). Based on the setup of other diel models of C3 and crassulacean acid metabolism (CAM) leaf metabolism (Cheung et al., 2014; Shaw and Cheung, 2018), we assumed here the maintenance costs to be the same in the light and dark phases, and we adopted a 3:1 ratio between ATP and NADPH drain fluxes (Cheung et al., 2013). To estimate dark respiration during the daytime we used a light response curve of sorghum leaves shown in Figure 4 of Wang et al. (2019). From this figure we determined the maximal photosynthetic rate for adaxial illuminated leaves was 38 μmol CO2/m2/s, which is close to the maximal photosynthetic rate of 40 μmol CO2/m2/s we considered here. The light response curve shows a linear increase in photosynthetic response up to a light intensity of about 500 μmol photon/m2/s with a slope of 0.064 mol CO2/mol photon and the dark respiration intersect of the linear was determined to be at −2.6 μmol CO2/m2/s. In another study evaluating five sorghum genotypes under field-grown conditions, respiration rates of dark-adapted leaves were on average 1.4 μmol CO2/m2/s (Li et al., 2021). We therefore consider the dark respiration intersect of 2.6 μmol CO2/m2/s to represent a rather conservative estimate. Assuming this value is constant over the 14 h daytime, the daily CO2 export rate is 0.131 mol CO2/m2/day. The model was adjusted to this dark respiration rate using the generic maintenance reactions (“GenericATPasemod,” “GenericNADPOxidasemod”), as detailed in Supplementary Figure 4.
Aggregation of Network Fluxes for Quantitative Visualization
To give a summarizing overview of the flux solution space in iTJC1414x4, we defined a set of network projections that map selected groups of iTJC1414x4 reactions onto a lumped reaction network as described before (Schwender and Hay, 2012). In short, a bilevel optimization as in Flux Variability Analysis is applied. However, the objective in the secondary optimizations is not to minimize/maximize a single reaction but a linear combination of reactions so that in effect the minimum and maximum bounds for the total flux between lumped metabolite pools is revealed. For example, to aggregate all conversions between oxaloacetate and malate by all malate dehydrogenase enzyme isoforms in the BSC-day sub-model, and taking into consideration the directionality of each isoform, the objective function is to maximize/minimize the following sum: “bsDayMALATEDEHYDROGENASENADPRXNchloroplast – bsDayMalateDHPeroxisome – bsDayMalateDH – bsDayMALATEDEHRXNmitochondrion.” All used summation terms of this type are listed in Supplementary Table 7.
Energy Demands for Various Potential Products of Photosynthetic CO2 Assimilation
Independent of specific metabolic pathways, any oxygenic photosynthetic process converting CO2 and water into a carbon-reduced product and oxygen can be defined by its chemical and redox balance. Accordingly, we derived a general calculation scheme to derive the chemical balance of formation and the average oxidation state of carbon and applied it to various carbon-reduced compounds (Supplementary File 3). In addition to the chemical balances, we derived the overall balances of formation from CO2 and water by plant specific biochemical pathways. For this purpose, we defined a minimal stoichiometric model representing canonical pathways of the CBB cycle of C3 photosynthesis, the photorespiratory cycle, and sucrose, fatty acid, and TAG synthesis. This one-compartment model can only exchange sucrose, TAG, CO2, oxygen, and water with the environment. Using the software tool METATOOL (Schuster et al., 1999, 2000), the mass balances of all possible conversions of external metabolites into sucrose or TAG can be determined as Elemental Flux Modes (see Supplementary File 3 for details and Supplementary File 4 for METATOOL input files). Reaction coupling with dummy species “PSATP” and “PSH2” reveals the biosynthetic demands in ATP and reducing equivalents.
Results
Diel Model of NADP-Malic Enzyme C4 Metabolism in Sorghum bicolor
The sorghum model iTJC1414x4 is comprised of four sub-models representing leaf MC and BSCs under day and night conditions (Figure 1). Each of the sub-models has over 1,000 reactions, 750 metabolites, and 7 intracellular compartments (Table 1). The day and night parts of the model are connected by a transitory starch pool. The fraction of assimilated carbon that is converted into (transitory) starch is consumed at the same rate in the dark model by biosynthetic or respiratory processes (Figure 1). Note that the simulated flux distributions are to be understood as integrals over the entire day. iTJC1414x4 was constructed using the Z. mays metabolic reconstruction of leaf C4 metabolism iEB2140x2 (Bogart and Myers, 2016) as a template. We added 380 reactions and modified over 100 reactions per sub-model, thereby correcting mostly for subcellular localization or cofactor specificity of fatty acid biosynthetic reactions. Effort at manual curation was particularly focused at lipid metabolism, which was done mostly in reference to plant-specific reactions as outlined in Li-Beisson et al. (2013). In short, chloroplast localized fatty acid biosynthesis was defined to produce palmitic acid (C16:0, a 16-carbon fatty acid with zero double bonds), stearic acid (C18:0) and oleic acid (C18:1), which are exported to the cytosol as free fatty acids (Li-Beisson et al., 2013). Cytosol/endoplasmic reticulum-localized lipid metabolism was set up as a sub-network specifying the biosynthesis of PC, DAG, and TAG with distinct molecular species that are composed of five acyl chain types, which are palmitate, stearate, oleate, and the polyunsaturated linoleic acid (C18:2) and linolenic acid (C18:3). The linoleate and linolenate species derive by desaturation reactions of acyl chains bound to PC (Li-Beisson et al., 2013). Degradation of TAG and fatty acids is given by TAG lipase reactions, by core activities of β-oxidation of the modeled fatty acid species (Li-Beisson et al., 2013) and by functions of the glyoxylate cycle (Graham, 2008). Besides lipid components, the model is able to synthesize protein, cellulose, hemicellulose, soluble sugars, and lignin (Supplementary Table 3).
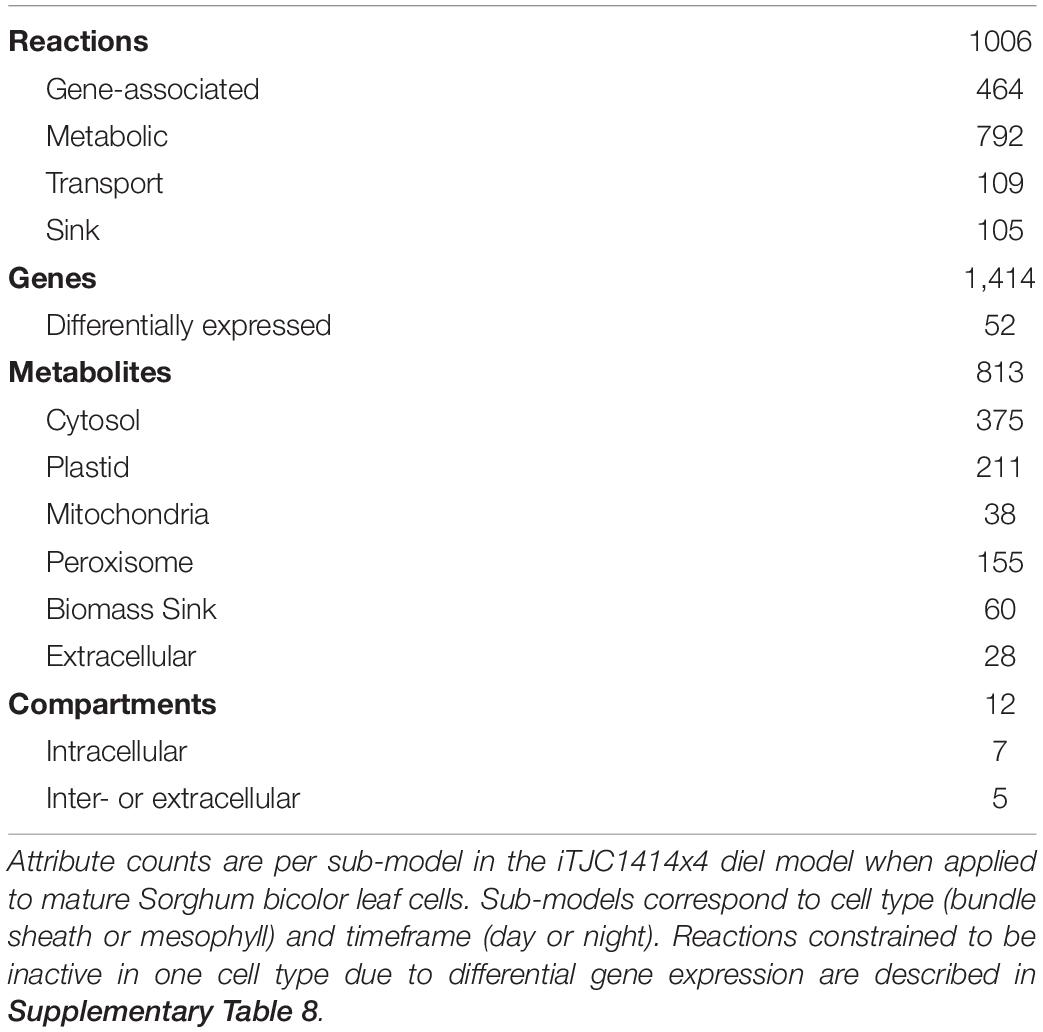
Table 1. Basic statistics of iTJC141414x4 sub-models.
Of the 2,133 Z. mays genes associated with reactions in the iEB2140 single-cell model, 85% of the genes had an S. bicolor ortholog and 92% of the reactions had S. bicolor orthologs for most of the associated maize genes (Supplementary Figures 1B,C). Together, these support the core iEB2140x2 model being transferable from maize to sorghum. To integrate information on cell type specific metabolism, we analyzed differential gene expression data for S. bicolor MCs and BSCs, that was generated by Döring et al. (2016) using Illumina sequencing and SuperSage analysis. Of the 1,414 sorghum genes associated with reactions in iTJC1414x4 (Table 1), 52 were found to be differentially expressed if either sequencing method was used. To be consistent with this data, we constrained nine MC and three BSC reactions to be inactive because all of their associated genes were found to be strongly preferentially expressed in the opposing cell (Supplementary Table 8).
On a per Carbon Basis, Triacylglycerol Is About 30% More Energy Dense Than Sucrose
Prior to using iTJC1414x4 to model TAG biosynthesis, we assessed energy content and biosynthetic costs of photo-assimilation independent from specific biochemical pathways. For a process of oxygenic photosynthesis that converts CO2 and water into a reduced product, the physicochemical limits are given by the chemical balance. Table 2 provides a list of reduced theoretical products, including organic acids, carbohydrates, lipids, and fossil fuel derived reduced carbon compounds, sorted by carbon reduction states and physicochemical demands in reducing equivalents. Five of the TAG molecular species listed are representative of the major fatty acids that are commonly accumulated in TAGs in crop plants, in particular palmitate, stearate, oleate, linoleate, and linolenate (Table 2). The amounts of required reducing equivalents and energy contents listed in Table 2 are derived from the elemental composition of each listed compound (for details see Supplementary File 3). Therefore, by averaging the listed TAG species, the properties of any molecular species composed of the mentioned five major fatty acids can be derived. On a per weight basis, the TAG species are on average 2.39-times more energy dense than sucrose (ratio ranging from 2.37 to 2.44; Table 2). However, since this study aims at analyzing partitioning of photo-assimilate into different reduced carbon compounds, it is important to also consider the molar quantity of assimilated CO2 (i.e., carbon) as a basis for comparing energy content and biosynthetic demands. If considered on a per carbon basis, sorghum wild-type leaf TAG only has 1.29-fold higher energy content than sucrose, while high-oil leaf TAG is 1.31-fold higher and different TAG molecular species are on average 1.3-fold higher in energy content than sucrose (ranging from 1.27 to 1.34; Table 2). As expected, because the biosynthetic process can be understood as the transfer of reducing equivalents onto carbon, the differences in per carbon energy content and per carbon reducing equivalents demands are similar.
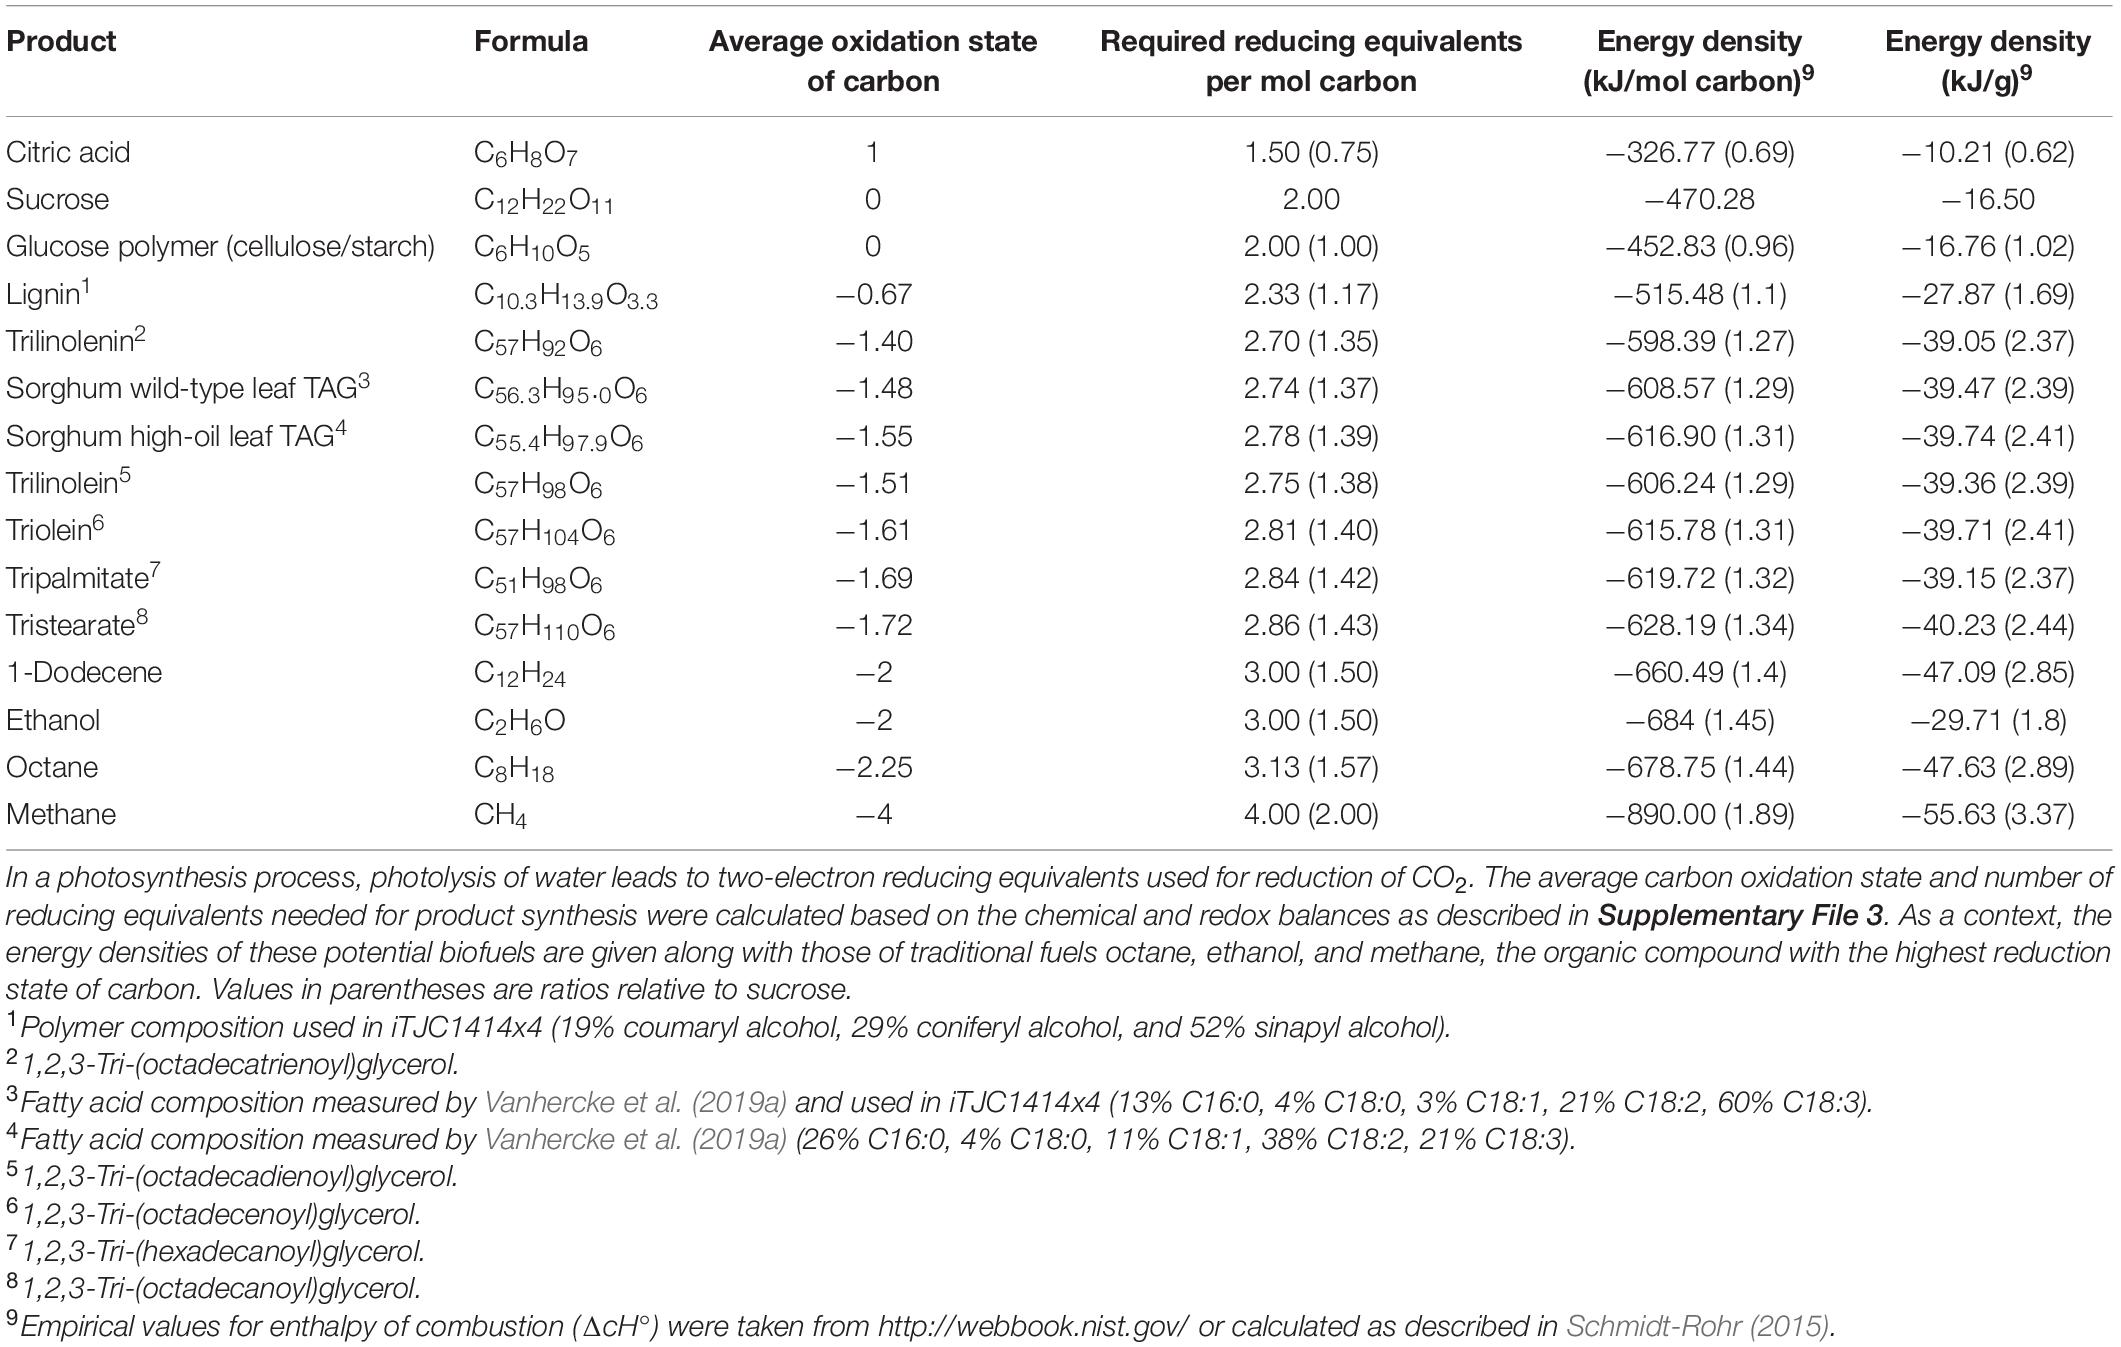
Table 2. Energetic demands in reducing equivalents and energy density for theoretical products of photosynthesis.
In addition, per CO2 incorporated, sorghum wild-type TAG synthesis requires 1.37-fold the amount of reducing equivalents as sucrose (values for other TAG compositions range from 1.35 to 1.43; Table 2). Since the demands for reducing equivalents listed in Table 2 derive from chemical balances, they represent a chemical minimum of energetic investments. As detailed in Supplementary File 3, the overall biosynthetic demands in reducing equivalents will raise above this minimum if metabolic pathways contain steps where electrons are transferred from pathway intermediates back to oxygen. For synthesis of TAG with sorghum fatty acid composition, the chemical minimum demand is 2.74 reducing equivalents per carbon (Table 2), while biosynthetic pathways demand 2.98 reducing equivalents. As detailed in Supplementary File 3, the difference is accounted for by the transfer of electrons to oxygen at the fatty acid desaturase steps. Relative to the total biosynthetic demands, 8.1% of reducing equivalents are transferred back to oxygen.
Imbalance in Photosynthetic ATP and NADPH Supply and Demand
To analyze possible photo-assimilatory pathways for sucrose and TAG synthesis, we first used the single-cell model iTJC1414 to simulate three scenarios of sucrose or TAG formation under limiting light conditions (Supplementary File 1). Table 3 shows the simulations in the case of C3 photosynthesis without photorespiration being active (see Supplementary Table 9 for consideration of photorespiration). In each case the overall demands in CO2 and H2O as well as O2 production are shown in Table 3 and are as expected by the chemical balances (see Supplementary File 3). For each scenario, the optimal flux solution space was further characterized by Flux Variability Analysis with subsequent classification of flux bounds into flux variability types as described before (Hay and Schwender, 2011). For optimal sucrose production, 48 reactions must be active (Table 3, scenario 1, “essential reactions”), while, in between alternative optimal flux states, 25 reactions can have zero or non-zero flux values (“non-essential reactions”). For TAG synthesis, a much larger number of reactions are non-essential than are essential (Table 3, scenario 2). While this might not be unexpected due to the complexity of the TAG biosynthetic network, inspection of the 618 non-essential reactions in scenario 2 revealed that the optimum TAG solution space allows many reactions to be active that should not be required for photo-assimilatory TAG synthesis (Supplementary Table 10). For example, invertase (“RXN1461”) was active in what appears to constitute a cycle of synthesis and degradation of sucrose. The Oxidative Pentose Phosphate Pathway (OPPP) can be active (e.g., “GLU6PDEHYDROGRXNChloroplast”) although in the photoautotrophic context, activity of OPPP and CBB cycle constitute a futile cycle with net ATP consumption (Sharkey and Weise, 2016). Altogether, the optimum solution space seems to feature numerous alternative solutions with ATP consuming futile cycles across the network that dissipate an apparent over-supply in ATP. To confirm this suspicion, we showed that this ATP consuming activity can be aggregated by maximizing a generic ATP consuming reaction, which we added to the network (“ATPsurplus”). If fixed to its maximal possible value under optimality, subsequent Flux Variability Analysis resulted in a much smaller solution space in terms of number of active reactions and futile cycles were no longer detectable (Table 3, scenario 3). In addition to the observations made in Table 3, simulations that include photorespiratory activity led to essentially the same conclusions on the occurrence of ATP surplus for TAG synthesis (Supplementary Table 9). The explanation for an over-supply (“surplus”) in ATP is found in the rigidity of the photosynthetic light-driven production of ATP and NADPH. As we will explore in more detail below, the lowest possible ratio at which ATP and NADPH can be supplied by the photosynthetic apparatus is at ATP/NADPH = 1.5. If the overall metabolic demands ratio for a particular biosynthetic product is below 1.5, stoichiometrically feasible optimal flux solutions will require the dissipation of surplus ATP. This model finding has the equivalence of an ATP/NADPH imbalance in the real process. The photosynthetic apparatus can be considered to deliver ATP and NADPH at fixed proportions, which should precisely match the proportions of the metabolic demands (Kramer and Evans, 2011). Chloroplasts are said to have limited capacity to adapt to variation in the relative demands in ATP and NADPH and a misalignment can stall the overall process (Kramer and Evans, 2011).
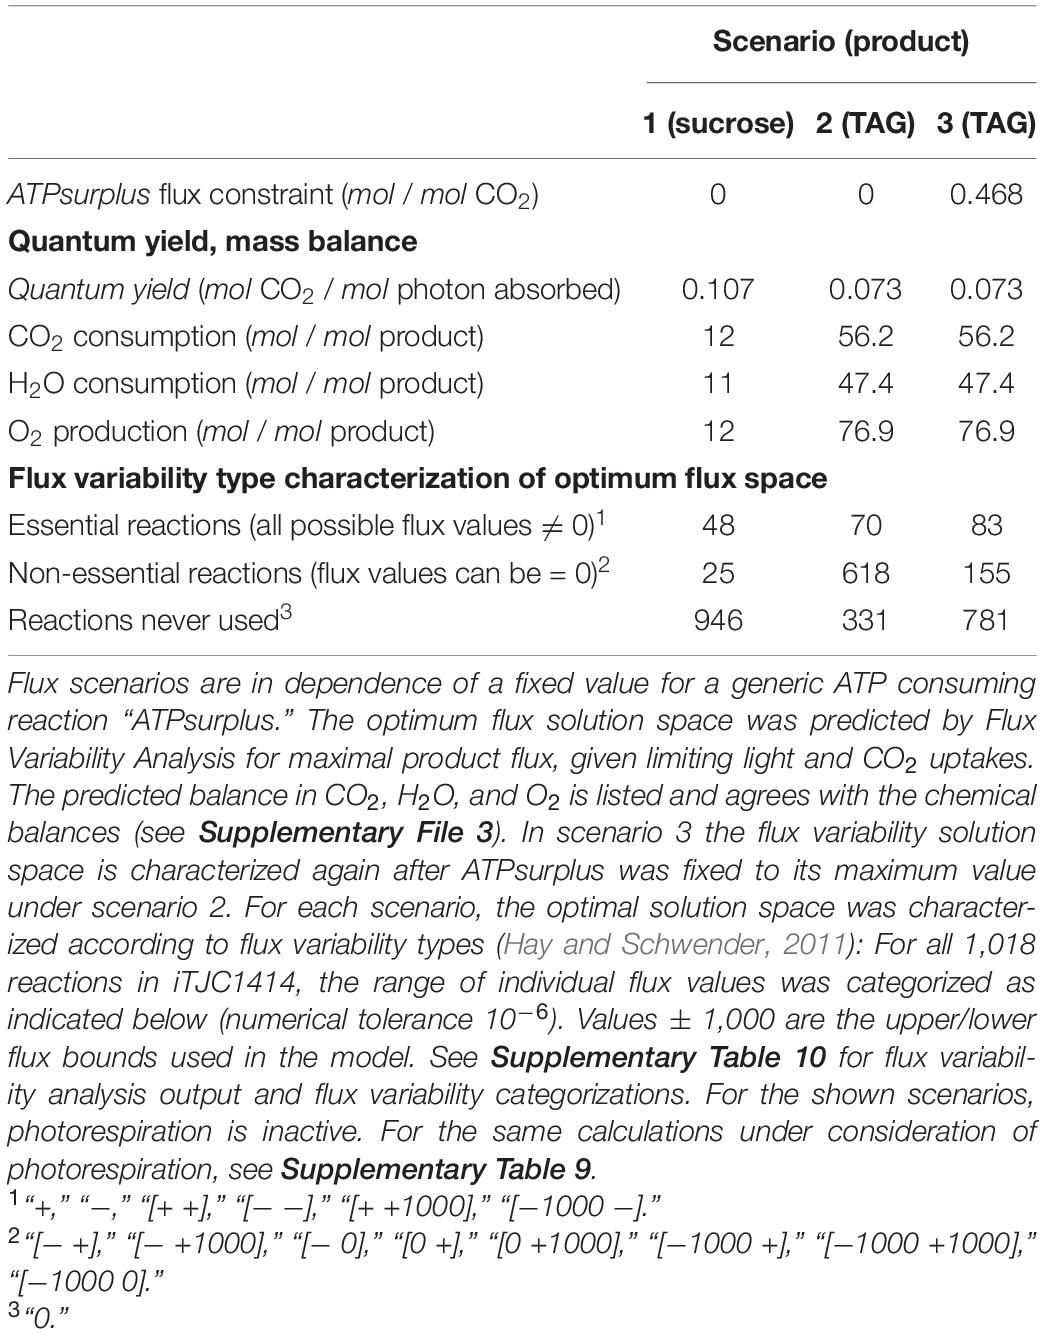
Table 3. Photo-assimilation of CO2 into sucrose or TAG using the single-cell model iTJC1414.
Pathways for Photo-Assimilation of CO2 Into Sucrose and Triacylglycerol
To further explain the results on an ATP/NADPH imbalance, we assessed the metabolic demand independent of supply (Figure 2A). We defined a minimal stoichiometric model for CO2 assimilation, consisting of 44 reactions representing plant canonical pathways of the CBB cycle of C3 photosynthesis (Sharkey and Weise, 2012), the photorespiratory cycle (Peterhansel et al., 2010), sucrose synthesis (Stitt et al., 1987), the generation of acetyl-CoA directly from 3-PGA (Joyard et al., 2010), and a net equation for chloroplast fatty acid synthesis. To obtain the latter, the net balance from acetyl-CoA and energy cofactors was derived according to generic plant pathways (Li-Beisson et al., 2013) by assembling the stoichiometries of 47 reaction steps. Moreover, the minimal model is a subset of iTJC1414 (see Supplementary File 3 for details). Applying Elementary Flux Modes analysis to the minimal model, the net balance for the conversion of CO2 and water to oxygen and sucrose or TAG can be obtained along with the energy cofactor requirements. Distinct flux modes were obtained for sucrose and TAG production; in each case one with the photorespiratory pathway being active and one without (Supplementary File 3). Figure 2A summarizes the resulting scenarios for sucrose and TAG synthesis if photorespiration is not active. Flux rates and energy cofactor demands are shown relative to the net assimilation of one mol of CO2. It is noticeable that, relative to sucrose production, CBB cycle fluxes are expected to be substantially higher if TAG is the product (Figure 2A). This is because, at the PDHp step, one-third of the carbon that is processed from 3-PGA toward fatty acid biosynthesis is released as CO2 and then re-fixed by RubisCO. Per CO2 assimilated into TAG, ATP-, and NADPH-demands are higher by 1.3- and 1.49-fold, respectively (Figure 2A). Similar increases are observed if photorespiration is active (see Supplementary File 3).
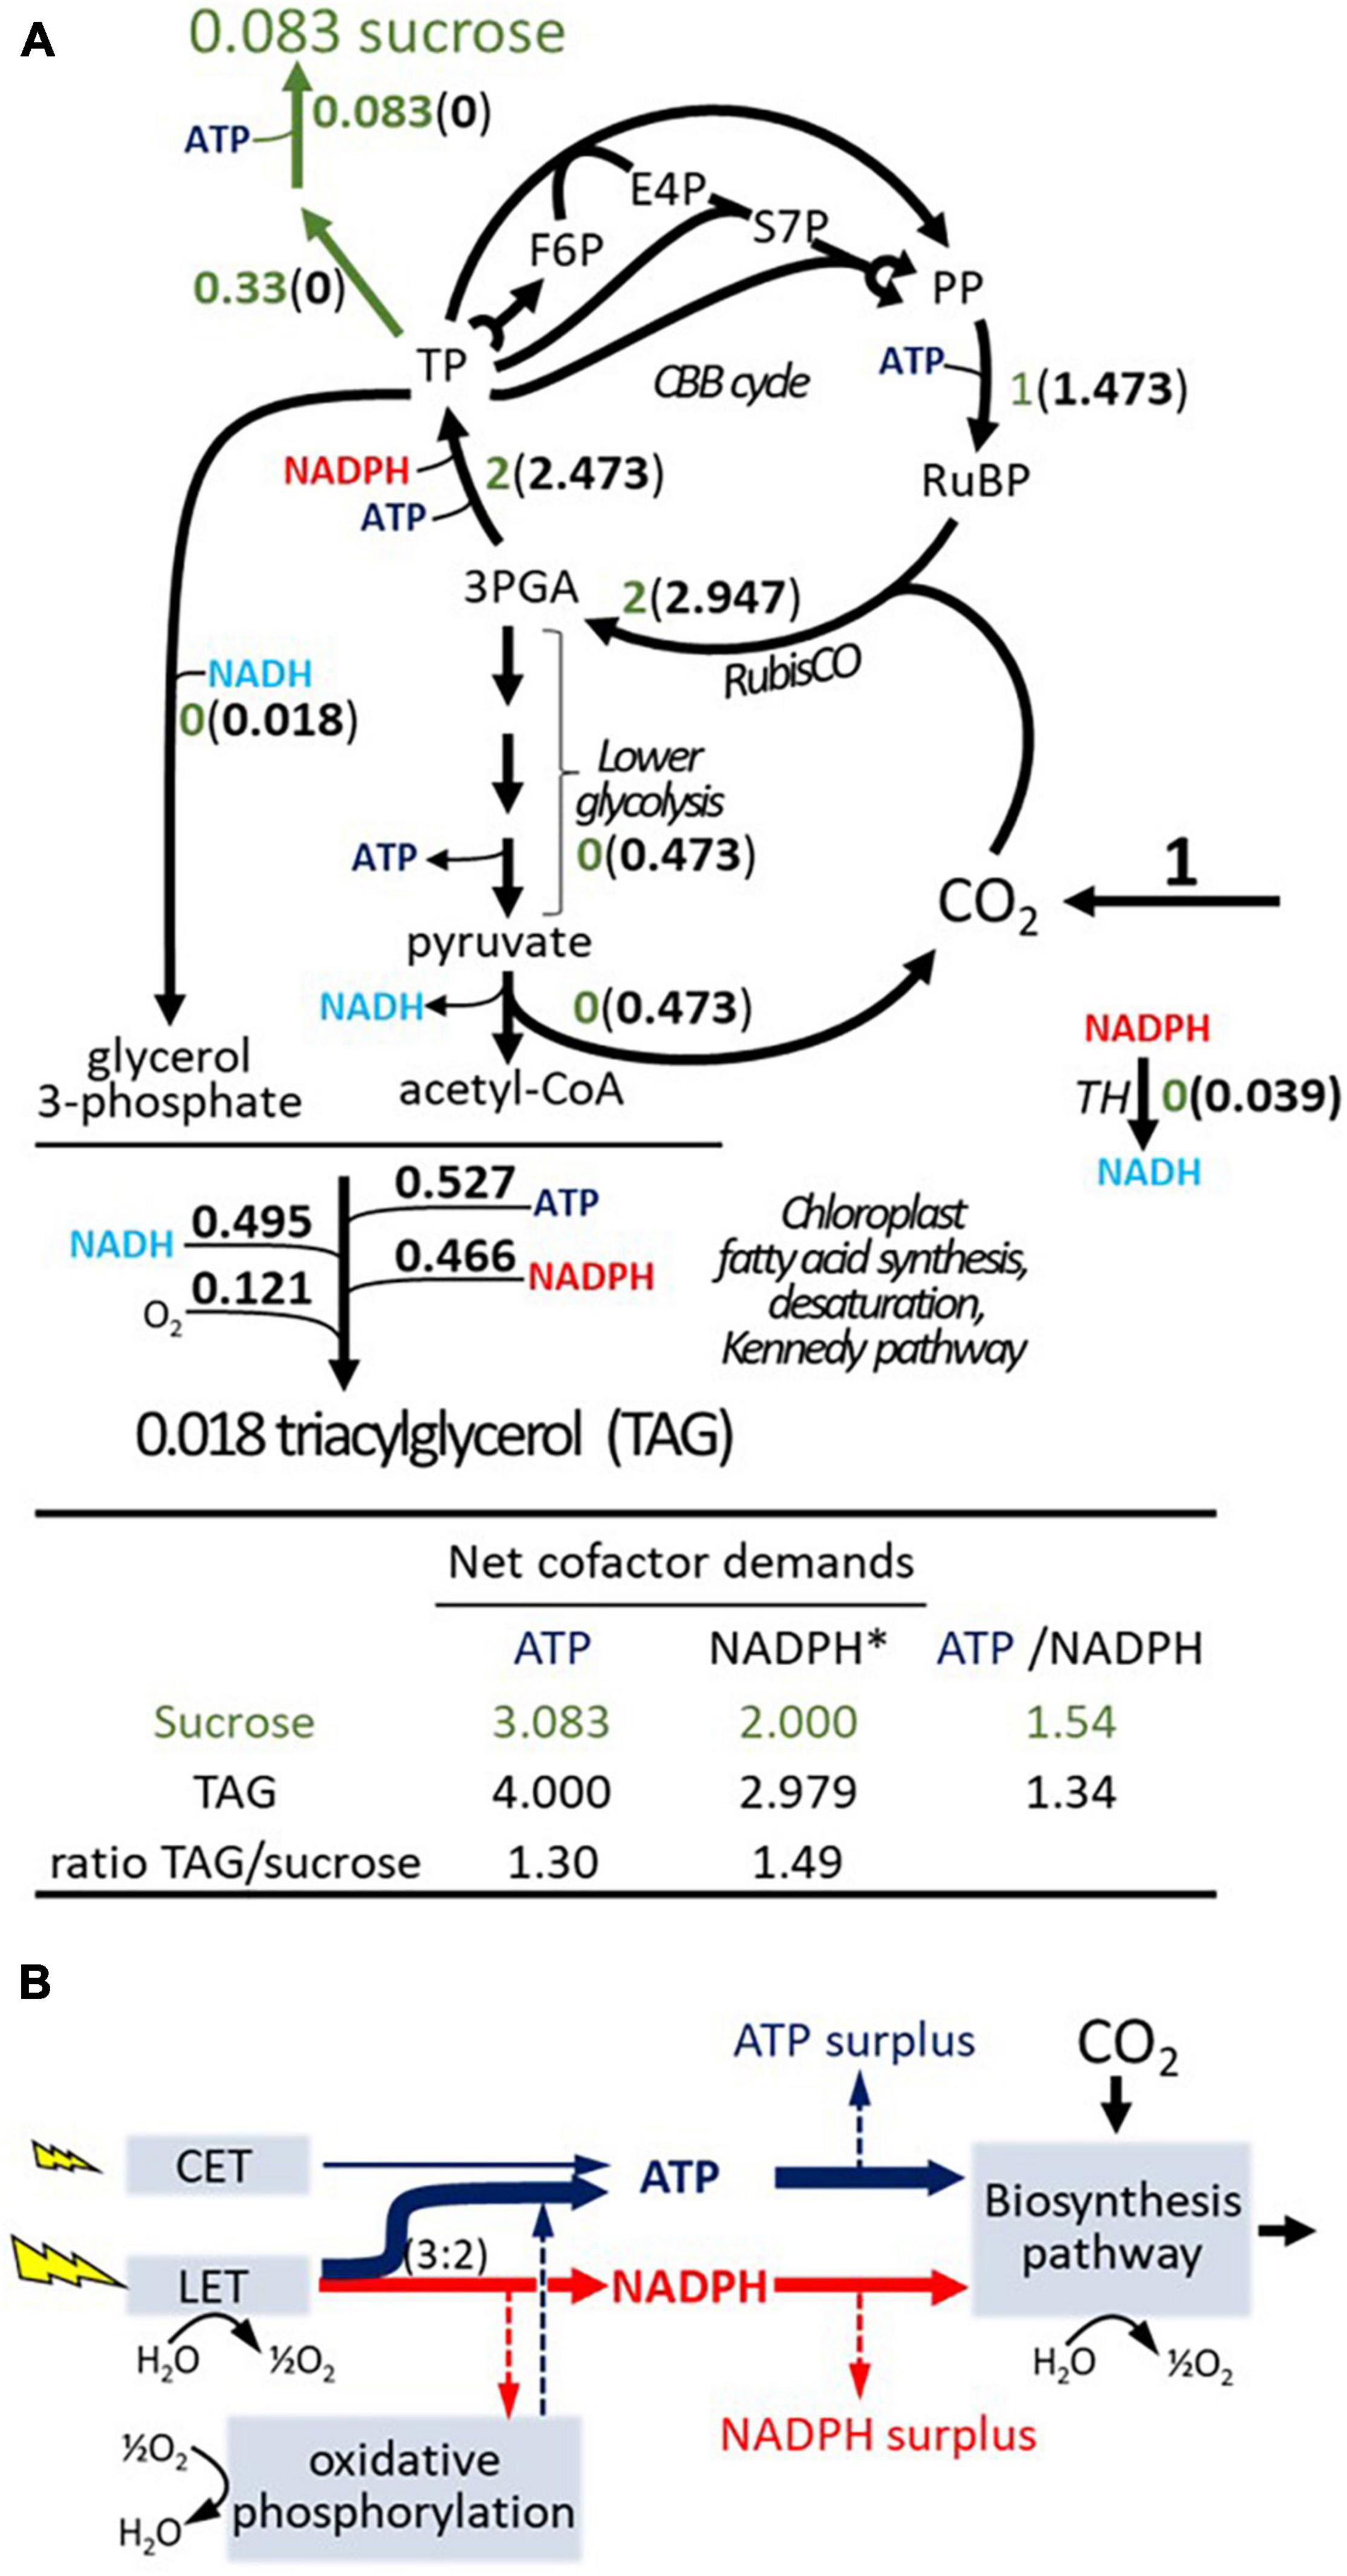
Figure 2. Basic stoichiometries for sucrose and TAG synthesis and cellular energy cofactor budget. (A) Stoichiometries for the assimilation of CO2 via the Calvin–Benson–Bassham (CBB) cycle into sucrose (green shading) or TAG based on balancing a generic plant stoichiometric model (see Supplementary File 3) with fatty acid composition of TAG as in iTJC1414x4. Flux values are normalized relative to one mol of CO2 net assimilation. Oxygen consumption shown for TAG synthesis is due to fatty acid desaturase reactions. (B) Balance of ATP and NADPH between supply (photosynthetic light reactions) and demands (biosynthetic pathway). In modeling scenarios, the light reactions are thought to supply ATP and NADPH at a fixed ratio. If the supply ratio is above the demand ratio, then a surplus in ATP supply occurs that must dissipate in other processes. If the supply ratio is lower than the demand ratio of a biosynthesis pathway, then an NADPH surplus should result. However, mitochondrial oxidative phosphorylation allows for adjustment of the supply ratio. Otherwise, a NADPH surplus exists. CET, cyclic electron transport; F6P, fructose 6-phosphate; GAP, glyceraldehyde 3-phosphate; LET, linear electron transport; 3-PGA, 3-phosphoglycerate; PP, pentose phosphates; RuBP, ribulose 1,5-bis-phosphate; RubisCO, ribulose 1,5-bis-phosphate carboxylase/oxygenase; S7P, sedoheptulose 7-phosphate; TH, unspecified transhydrogenase activity; TP, triose phosphate (e.g., glyceraldehyde 3-phosphate, dihydroxyacetone phosphate); TAG, triacylglycerol. *photosynthetic reducing equivalents.
Considering ATP and NADPH relative to each other, the ATP/NADPH demand ratio for TAG synthesis is lower than that for sucrose (Figure 2A). The basic concept of an energy cofactor budget is outlined by the supply/demand scheme shown in Figure 2B. If the ATP/NADPH supply ratio is higher than the demand ratio for a biosynthetic product, then there remains an ATP surplus which must dissipate in a process other than biosynthesis. If the ATP/NADPH supply ratio is lower than the demand ratio, then there will be a surplus in reducing equivalents, which can be dissipated by activity of oxidative phosphorylation or by another oxidative process (Figure 2B). Based on the stoichiometric setup of light reactions in iTJC1414, the ATP/NADPH ratio supplied by the LET chain is 1.5 (Supplementary File 3). Note that there are some uncertainties about the true ratio of ATP/NADPH output from LET found in plants, but most literature sources determine the ratio as being close to 1.5 (Noctor and Foyer, 1998; Allen, 2003; Kramer and Evans, 2011). Thus, considering LET to be active with only a very small additional ATP contribution by CET, the photosynthetic supply is sufficient to match the demands of 1.54 ATP per NADPH for sucrose synthesis (Figure 2B). Supposing that the ATP and NADPH supply is tailored this way for sucrose synthesis with a rigid supply ratio of 1.54, the demand ratio of 1.34 for TAG (Figure 2A) will cause an ATP surplus. If NADPH supply and demand are aligned, the ATP surplus amounts to 13% of the production [(1.54−1.34)/1.54]. Based on the principle outlined in Figure 2B we modeled and assessed the effects of a rigid energy cofactor supply for the two cell types of C4 metabolism in iTJC1414x4. This allowed to define a reference scenario for CO2 assimilation into sucrose, where photosynthetic ATP and NADPH production are in balance with metabolic demands in both cell types. Based on this reference state, the energy balance in TAG biosynthesis scenarios can be evaluated.
Obtaining a Balanced Energy Budget in C4 Photosynthesis
In C4 photosynthesis, different metabolic activities must be coordinated across the two cell types. Before applying sorghum-specific constraints to the distribution of light energy among the two cell types in iTJC1414x4, we first verified the basic configuration where the light uptake fluxes and the relative activities of LET and CET were freely adjustable. If sucrose synthesis was simulated by minimization of total light uptake, it was found that with the overall photosynthetic energy cofactor supply is 3.647 ATP and 2.431 NADPH per mol CO2 assimilated (Table 4, scenario 1, sucrose). Since sucrose synthesis requires 2 NADPH per CO2 assimilated (Table 2), there is an oversupply of 0.431 NADPH. Further inspection of the flux scenario revealed that this amount of reducing equivalents is consumed by mitochondrial oxidative phosphorylation, which generates additional ATP, resulting in an adjusted overall cofactor supply of 5.083 ATP and 2 NADPH per mol CO2 (Table 4, scenario 1, sucrose). This adjusted supply meets the above established general expectation for the basic photosynthetic demands of 3.083 ATP and 2 NADPH per mol CO2 (Figure 2A), after it is also considered that the operation of the C4 cycle incurs an additional 2 ATP/CO2 at the pyruvate-phosphate dikinase (PPDK) step (Figure 1). Potentially, the additional ATP could be generated by CET. However, the basic sucrose synthesis flux scenario predicts CET to be inactive in both cell types (Supplementary Table 7). Flux modes analysis of the isolated ATP and NADPH generating system shows that ATP production via combined LET and oxidative phosphorylation activity has higher quantum use efficiency than ATP production via CET (Supplementary File 3).
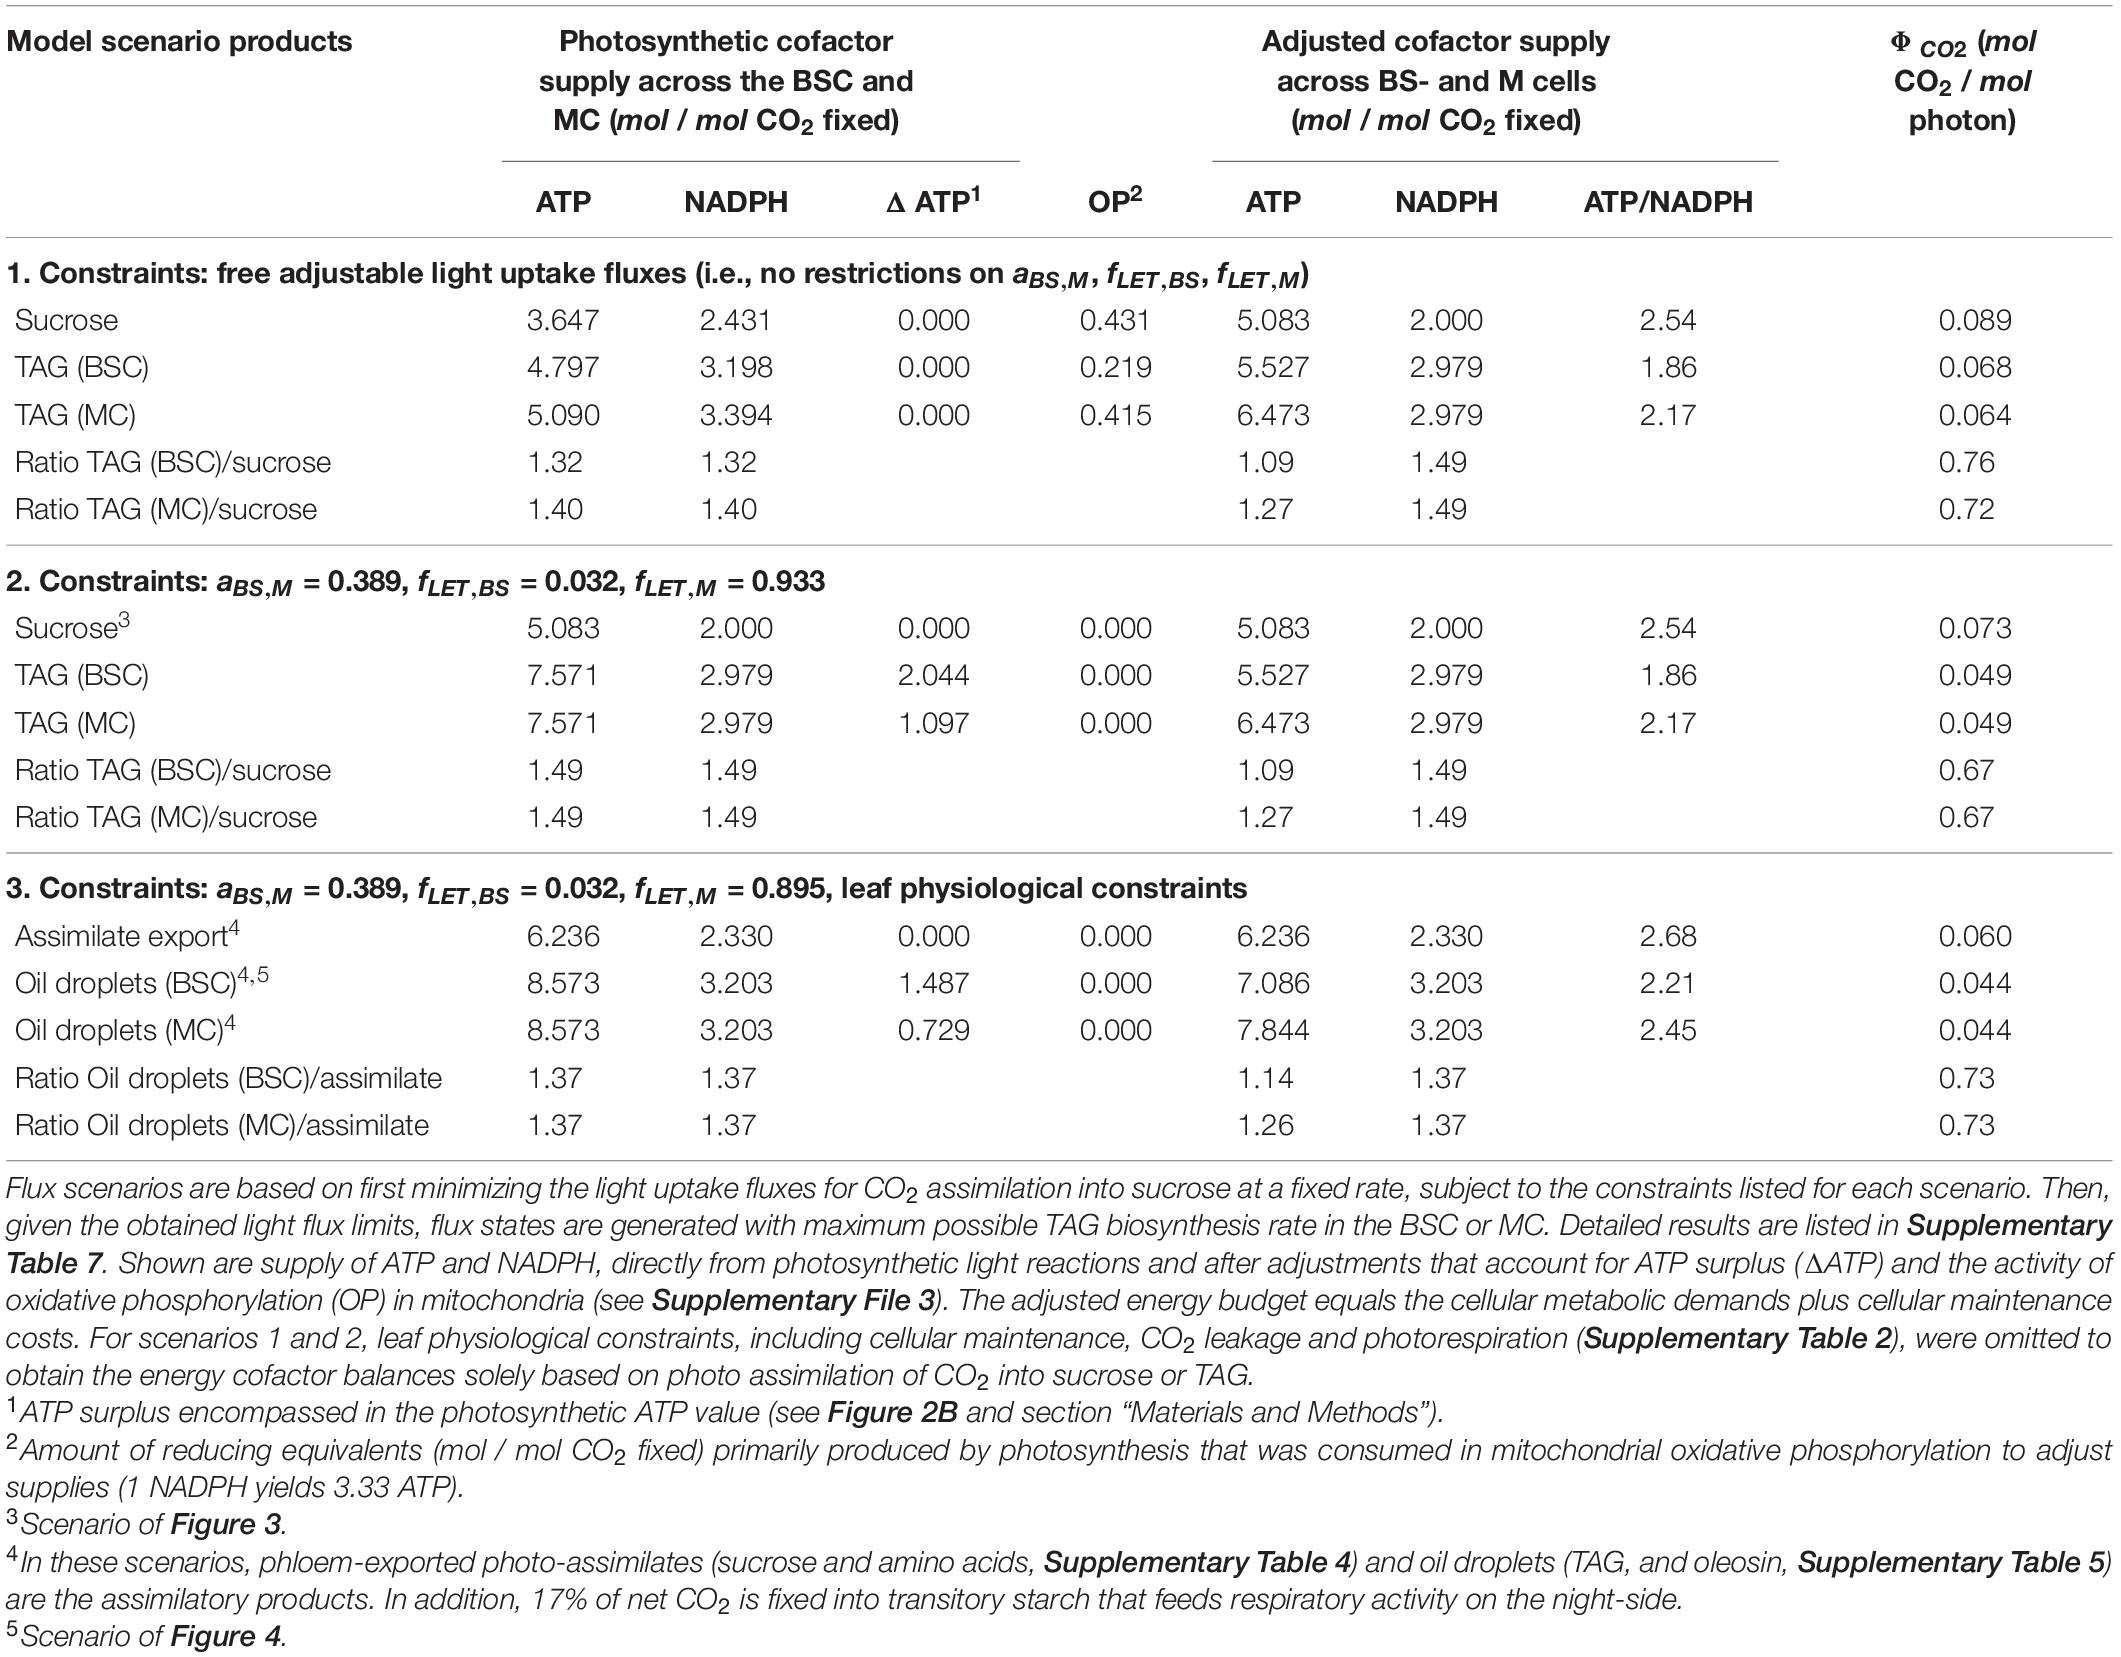
Table 4. Energy budgets for photo-assimilation of CO2 in iTJC1414x4.
To develop a sorghum-specific configuration of light energy distribution, we assumed that a typical mature sorghum leaf must have a photosynthetic energy cofactor supply that is well balanced with the metabolic demands of sucrose synthesis. To define a typical sorghum light distribution pattern with energy balance for sucrose synthesis, we relied on a model of cell-type specific electron transport in C4 photosynthesis by Yin and Struik (2018). The analytical model predicts the energy budgets for the major sub-types of C4 photosynthesis based on the cofactor demands of the CBB cycle, taking sub-type specific variations in the C4 cycles into consideration and by estimating photosynthetic production capacity based on leaf morphology and the distribution of chlorophyll and photosystems I and II between BSCs and MCs. We used the Yin and Struik (2018) model to predict three parameters to be incorporated into our sorghum FBA model: the ratio of light absorptance between the BSC and MC (aBS,M) and, for the BSC and MC, respectively, the fraction of absorbed light that drives LET (fLETBS, fLETM). With sorghum specific parameters and defining sucrose synthesis as the energy consuming metabolic activity, the Yin and Struik (2018) model predicts a balanced C4 energy budget at aBS,M = 0.398, fLETBS = 0.032, and fLETM = 0.933 (see Supplementary File 3 for details). After the three energy budget parameters were applied to iTJC1414x4 (Equations 6, 7), no ATP surplus or oxidative phosphorylation adjustment was detected for the two cell types (Table 4, scenario 2, sucrose). If, instead of sucrose, TAG is the product in the BSC or the MC, then an ATP surplus of 2.044 or 1.097 ATP per CO2 fixed can be detected, respectively (Table 4, scenario 2, TAG). This means that using these energy budget parameters, a state was defined in iTJC1414x4 where cell-type specific photosynthetic ATP and NADPH supplies are in balance with cell-type specific demands for sucrose synthesis. Figure 3 illustrates the functioning of C4 metabolism under this condition. With the 3-PGA/triose phosphate shuttle operating, 37% of the reduction of 3-PGA to GAP takes place in MC, meaning that 37% of the ATP and NADPH demand at this step in the CBB cycle is assigned to the MC. The malate/pyruvate shuttle mechanism, which transfers both CO2 and reducing equivalents, is dominant. However, 29.4% of the CO2 is transported via the aspartate/alanine mechanism, which transports CO2 only (Figure 3). This means that only 70.6% of the possible capacity to move NADPH with the C4 shuttle is used. Overall, the imposition of the energy budget parameters appears to create a realistic reference state with balanced energy budget for sucrose synthesis.
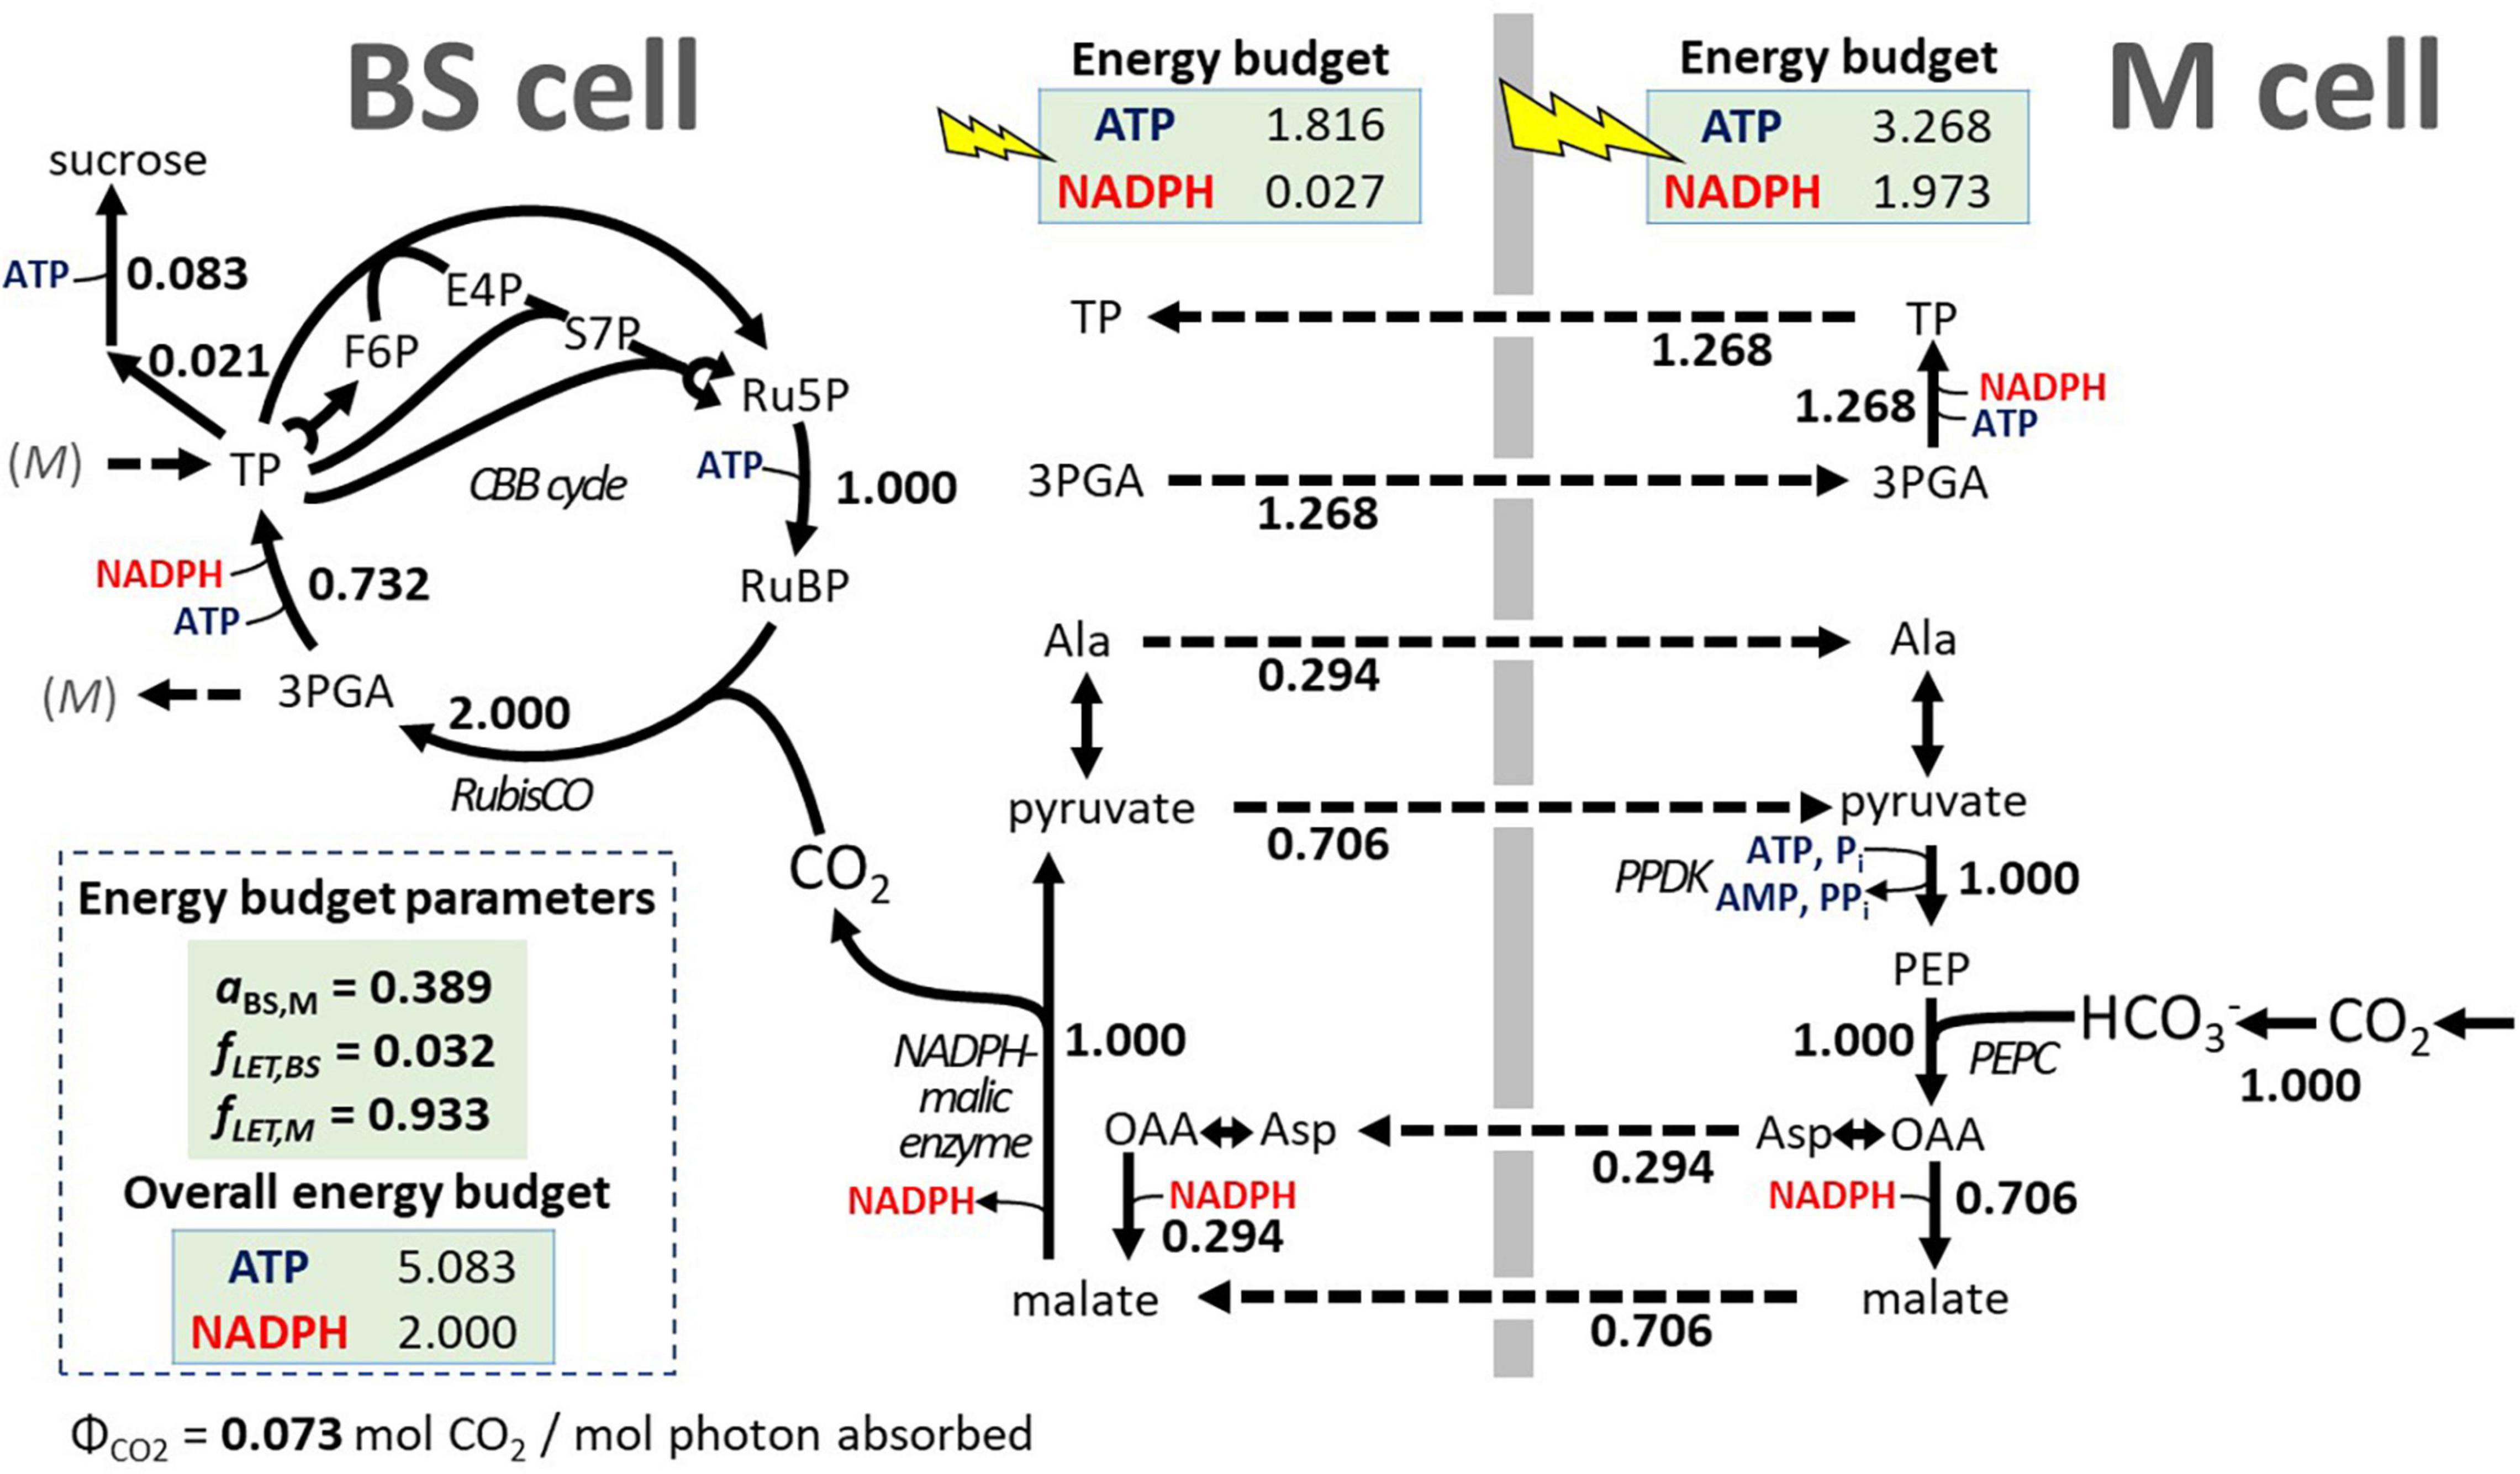
Figure 3. Effect of energy budget parameters on the C4 photosynthesis scheme in iTJC1414x4. Flux values are shown relative to uptake of one unit CO2. The shown sorghum-specific parameters for light flux distribution (energy budget parameters) were derived from a cell-type-specific electron transport model for C4 plants by Yin and Struik (2018) and cause BSC- and MC-specific production of ATP and NADPH by photosynthetic light reactions to balance the photosynthetic supplies and metabolic demands. Note that at the PPDK step, AMP needs to be recycled, leading to a net demand of 2 mol ATP for PEP regeneration. Flux values are obtained from the primary FBA solution using flux projections (see section “Materials and Methods” and Supplementary Table 7, model scenario 3). 3PGA, 3-phosphoglycerate; aBS,M, BS:M ratio in light absorption; Ala, alanine; Asp, aspartate; BS cell, bundle sheath cell; CBB, Calvin–Benson–Bassham; E4P, D-erythrose-4-phosphate; F6P, D-fructose-6-phosphate; fLET,BS, fraction of BS cell absorbed irradiance that is used for linear electron transport; fLET,M, fraction of M cell absorbed irradiance that is used for linear electron transport; M cell, mesophyll cell; OAA, oxaloacetate; PEP, phosphoenolpyruvate; PPDK, pyruvate phosphate dikinase; Ru5P, D-ribose-5-phosphate; RubisCO, ribulose 1,5 bisphosphate carboxylase oxygenase; RuBP, D-ribulose-1,5-bisphosphate; S7P, D-sedoheptulose-7-phosphate; TP, triose phosphates; ΦCO2, absorbed quantum yield for CO2 uptake (mol CO2 / mol photon).
Definition of a Physiologically Relevant Mature Leaf Reference State With Balanced Energy Budget in C4 Photosynthesis
In Figure 3 we consider sucrose biosynthetic costs only. To simulate carbon assimilation more realistically, we need to calibrate the model to the overall photosynthetic capacity of a sorghum leaf and incorporate estimates on additional energetic costs due to photorespiration, CO2 leaking back from BSC to MC and costs related to respiratory activity. As described in section “Materials and Methods,” to set the photosynthetic capacity we derived a typical daily CO2 assimilation rate based on a survey of literature-reported maximal photosynthetic CO2 fixation rates at mid-day, daily time course integrals as well as measured leaf dark respiration rates Accordingly, we estimate the total daily CO2 assimilation rate for sucrose synthesis in a mature sorghum leaf to be 1.344 mol CO2/m2/day, with a respiratory loss of 0.131 mol CO2/m2/day. We next used these two rates in an iterative cycle that is outlined in Supplementary Figure 4 to set the model’s light uptake and maintenance fluxes as well as to adjust the energy budget parameters, beginning with the values for aBS,M, fLET,BS, and fLET,M obtained above from the Yin and Struik model (Table 4, scenario 2).
In short, we first determined the minimal light levels for which the combined net daily CO2 assimilation and respiratory loss (1.475 mol CO2/m2/day) can be converted into sucrose. Second, while keeping these light fluxes constant, we raised the day-time maintenance cost so that the combined CO2 rate was reduced back to the net daily CO2 assimilation rate of 1.344 mol CO2/m2/day. Assuming that maintenance respiratory loss during the 14 h day-time also applies to the night-time (10 h), the night-time ATP and NADPH drain reactions were set to 10/14 of the daytime rates. Third, to obtain a mature leaf reference state, the photo-assimilate export rate was maximized. The iterative cycle was repeated by adjusting fLET,M until, across the two cell types, no ATP surplus or supplemental ATP production by mitochondrial oxidative phosphorylation could be detected. This means that at the final state the photosynthetic production of ATP and NADPH was balanced with the overall demands for synthesis of the exported photo-assimilate. In result, we obtained light uptake fluxes of 6.30 and 15.82 mol photons/m2/day for the BSC and MC, respectively. The daytime ATP and NADPH drain reactions were determined to be 0.369 and 0.123 mol/m2/day, respectively. The corresponding nighttime values for ATP and NADPH drain reactions were 0.264 and 0.088 mol/m2/day, respectively. These settings for nighttime maintenance cause a nighttime respiratory CO2 loss that is 13.4% of the CO2 uptake flux. Nighttime respiratory loss of non-stressed S. bicolor plants has been estimated before to be between 10 and 16% of the daily photosynthesis rate (Hodges et al., 1979). We therefore consider the respiratory loss of 13.4% to be realistic. The balanced C4 energy budget was obtained after an adjustment of the value for fLET,M from 0.933 (Table 4, scenario 2, sucrose) to 0.895, while aBS,M and fLET,BS were kept at their formerly determined values (Table 4, scenario 3, assimilate export). The predicted absorbed quantum yield for CO2 uptake is 0.060 mol CO2 / mol photons (Table 4, scenario 3, assimilate export), which is similar to the measured value for sorghum leaves of 0.061 mol CO2 / mol photons (Ehleringer and Pearcy, 1983). Finally, this scenario was taken to define a mature leaf reference state with balanced energy budget based on which carbon partitioning between assimilate export and oil droplet deposition can be further characterized. All constraints that define this state are listed in Supplementary Table 2 and Figure 1 highlights the constraints related to light flux, photorespiration, CO2 leakage and maintenance cost.
Triacylglycerol Synthesis Causes ATP Surplus
By default, TAG biosynthesis and accumulation can take place in all four sub-models of iTJC1414x4. Given the above reference state, we tested the efficiency of conversion of CO2 into TAG in all four sub-models (Supplementary Figure 5). Overall, TAG production can take place in the BSC- and MC-day models at the same rate. In the dark models maximal TAG production is reduced by less than 1%, relative to the maximal day rate (Supplementary Figure 5). If energy budget parameters are applied (Table 4), the photosynthetic energy budgets are balanced for sucrose synthesis, while for TAG synthesis, a substantial ATP surplus is detected. For scenario 2 (Table 4), the ATP surplus values of 2.044 and 1.097 for TAG production in the BSC and MC, respectively, amount to 27 and 14.5% of the photosynthetic ATP production. For scenario 3 (Table 4) these percentages are 17.3 and 8.5%, respectively. ATP surplus under TAG synthesis does not occur when light flux distribution is freely adjustable (Table 4, scenario 1), which demonstrates that the ATP surplus is a consequence of application of the energy budget parameters. The model prediction of ATP surplus suggests that, unless there are mechanisms to flexibly adjust light energy input or to discharge the surplus in ATP in another process, high rates of TAG synthesis in a leaf might be stalled due to energy cofactor imbalances. To further explore model predictions of TAG biosynthesis, a scenario of daytime TAG accumulation in BSCs is further detailed in Figure 4. As seen for sucrose synthesis (Figure 3), CO2 from the environment is moved from MC to BSC via the malate/pyruvate shuttle mechanism with minor participation of the aspartate/alanine shuttle. In contrast to the sucrose synthesis scheme, a part of the pyruvate produced by NADP-ME in the BSC serves as a precursor to acetyl-CoA and fatty acid biosynthesis (Figure 4). The same amount of pyruvate that is removed from the pyruvate/malate shuttle cycle is replenished in MCs by conversion of 3-PGA to phosphoenolpyruvate. Altogether, a scheme emerges by which pyruvate destined to fatty acid synthesis is generated from 3-PGA via phosphoenolpyruvate under participation of the 3-PGA/triose phosphate shuttle and the C4 shuttles, while omitting the pyruvate kinase and PPDK steps (Figure 4, blue trace). The scheme is cost-saving relative to direct conversion of 3-PGA to pyruvate in BSC, since generating phosphoenolpyruvate in the C4 cycle with PPDK comes at a net cost of 2 ATP. However, the overall savings per unit pyruvate entering fatty acid synthesis is only one ATP since using pyruvate kinase in the BSC would gain one ATP (Figure 4).
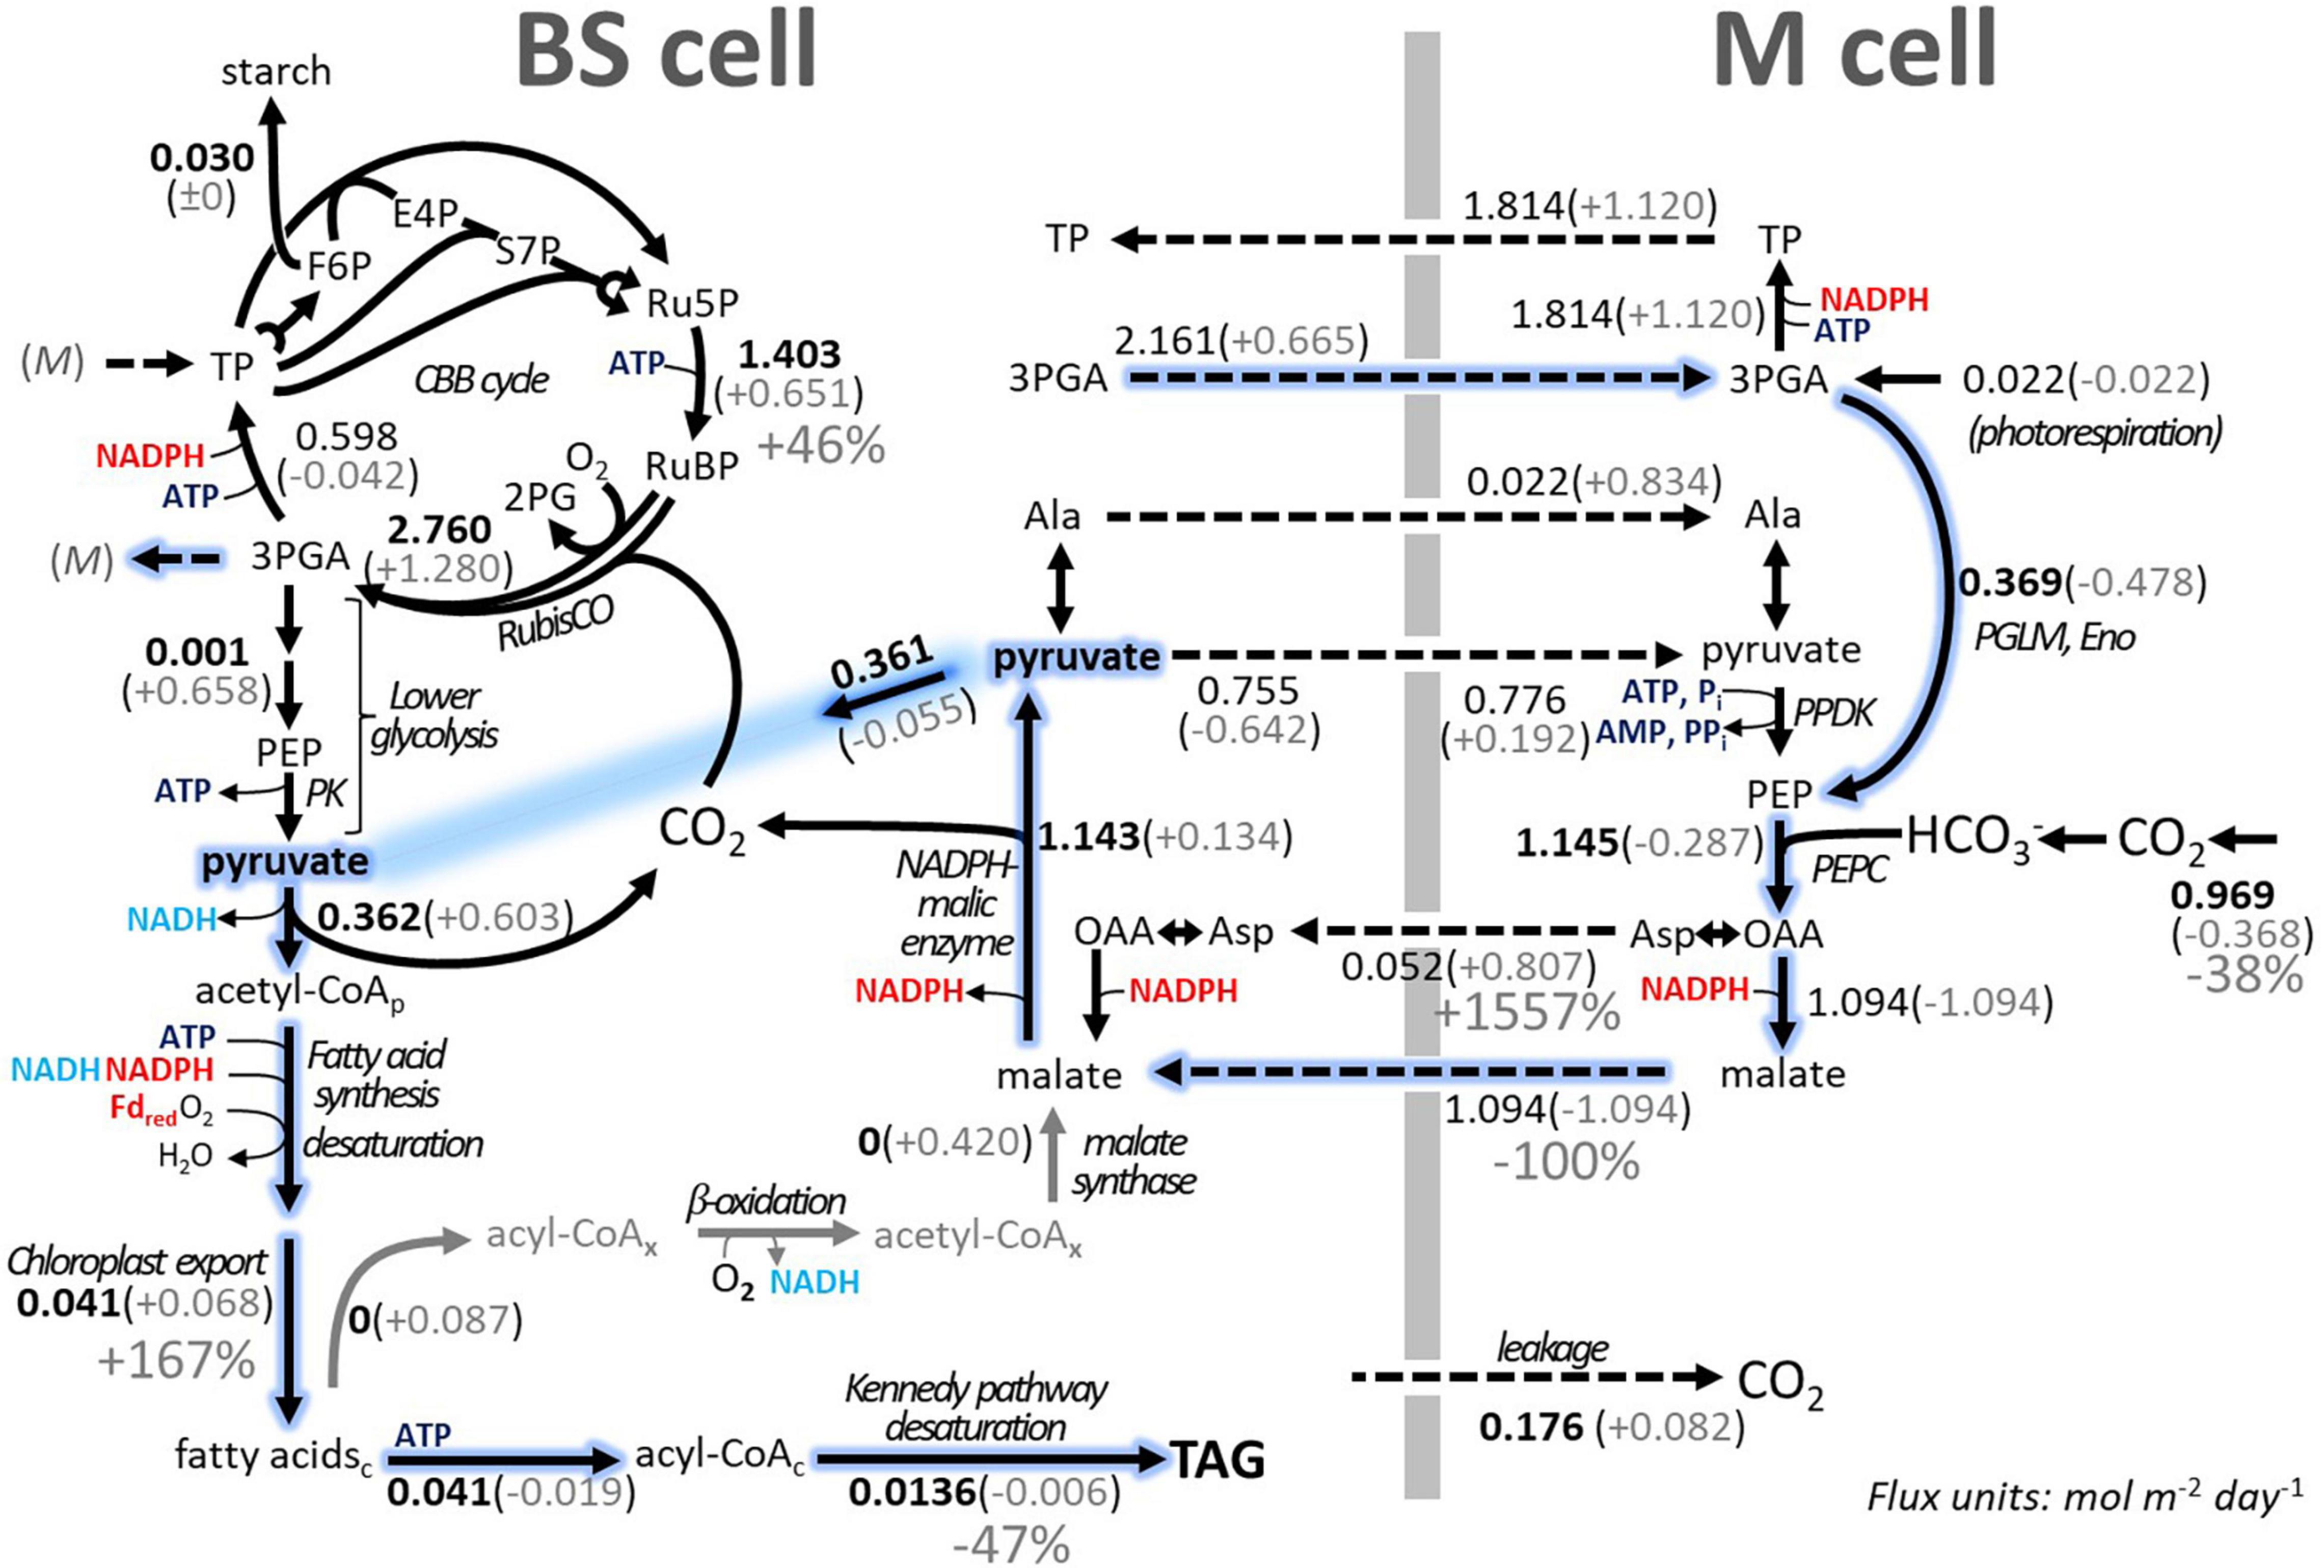
Figure 4. Schematic overview of TAG biosynthesis in the BSC of iTJC1414x4 and impact of fatty acid futile cycling on TAG yield. An uncompartmentalized schematic view of the day sub-models is given summarizing major fluxes, which were predicted based on multilevel optimization (flux projections, see section “Materials and Methods”). Bolded flux values are invariable in the FBA solution space. Flux units are mol m–2 day–1 and complete flux solutions are listed in Supplementary Table 7. Gray values given in parentheses are changes in flux values upon enforcing fivefold cycling [i.e., fatty acid biosynthesis / (3 × TAG storage flux) = 5]. Gray arrows summarize the degradation of fatty acids and formation of malate, a process that extends across the cytosol, mitochondrial, and peroxisomal compartments. Dashed arrows indicate metabolite transport through plasmodesmata between cell types. The BSC pyruvate pool is shown twice as emphasized in blue. Also marked in blue is a scheme where generation of pyruvate destined to fatty acid synthesis intersects with the 3PGA/triose phosphate shuttle and the C4 shuttle. Subscripts “c,” “p,” and “x” indicate metabolites specific to the cytosolic, plastidic, and peroxisomal compartment, respectively. 3-PGA, 3-phosphoglycerate; Ala, alanine; CBB, Calvin–Benson–Bassham; Eno, enolase; F6P, fructose 6-phosphate; Fdred, reduced ferredoxin; OAA, oxaloacetate; PEPC, phoephoenolpyruvate carboxylase; PGLM, phosphoglyceromutase; Pi, inorganic phosphate; PK, pyruvate kinase; PPDK, pyruvate, phosphate dikinase; PPi, inorganic pyrophosphate; Ru5P, ribulose 5-phosphate; RubisCO, ribulose 1,5 bisphosphate carboxylase oxygenase; RuBP, ribulose 1,5-bis-phosphate; S7P, sedoheptulose 7-phosphate; TAG, triacylglycerol; TP, triose phosphate.
Shifts in Energetic Demands Associated With a Trade-off of Assimilate Export vs. Triacylglycerol Biosynthesis
The amount of TAG that is accumulated in a leaf will depend on the fraction of photo-assimilate that can be re-directed into oil droplet biosynthesis by a metabolic engineering approach and by the number of days the accumulation can take place before the material is harvested. Imposition of a range of carbon partitioning ratios is demonstrated in Figures 5A,B. Carbon allocation is shifted between photo-assimilate export and oil droplet deposition while starch is synthesized at a constant rate of 4.8 g/m2/day (Figure 5A), which reflects a constant loss of daily net carbon assimilation by nighttime respiration. As carbon allocation toward oil droplets increased from 0 to 100% at the expense of photo-assimilate synthesis, the TAG mass flux as well as the carbon molar flux into TAG deposition did not increase linearly, but with a slightly downward bending trend (Figure 5). This indicates that net carbon fixation decreases as TAG deposition increases. Supplementary Figure 6 confirms that, as carbon allocation to TAG increased, the simulated net CO2 uptake rate decreased from 1.32 to 0.97 mol carbon/m2/day, while the energy inputs (photon uptakes) remain constant. This means that, from the same light energy inputs, 72.4% of the amount of CO2 that is fixed into sucrose can be fixed into TAG. Given a predicted daily TAG accumulation rate, the number of days until a desired amount of TAG per dry weight is reached can be calculated based on Equation 3 (see section “Materials and Methods”). Figure 5B shows the effect of change in carbon allocation on the predicted number of days until 1, 5, or 20% TAG (w/dw) are reached in mature leaves. For example, if 5% of net carbon assimilation was allocated to oil droplets, the time taken until a 20% TAG level is reached was predicted to be 18 days (Figure 5B). If 20% of net CO2 assimilation was allocated to oil droplets, then this level could be reached within 5 days. Altogether, it appears that if only a small shift in carbon allocation from assimilate toward oil droplet production can be achieved, substantial TAG accumulation should be possible within a month.
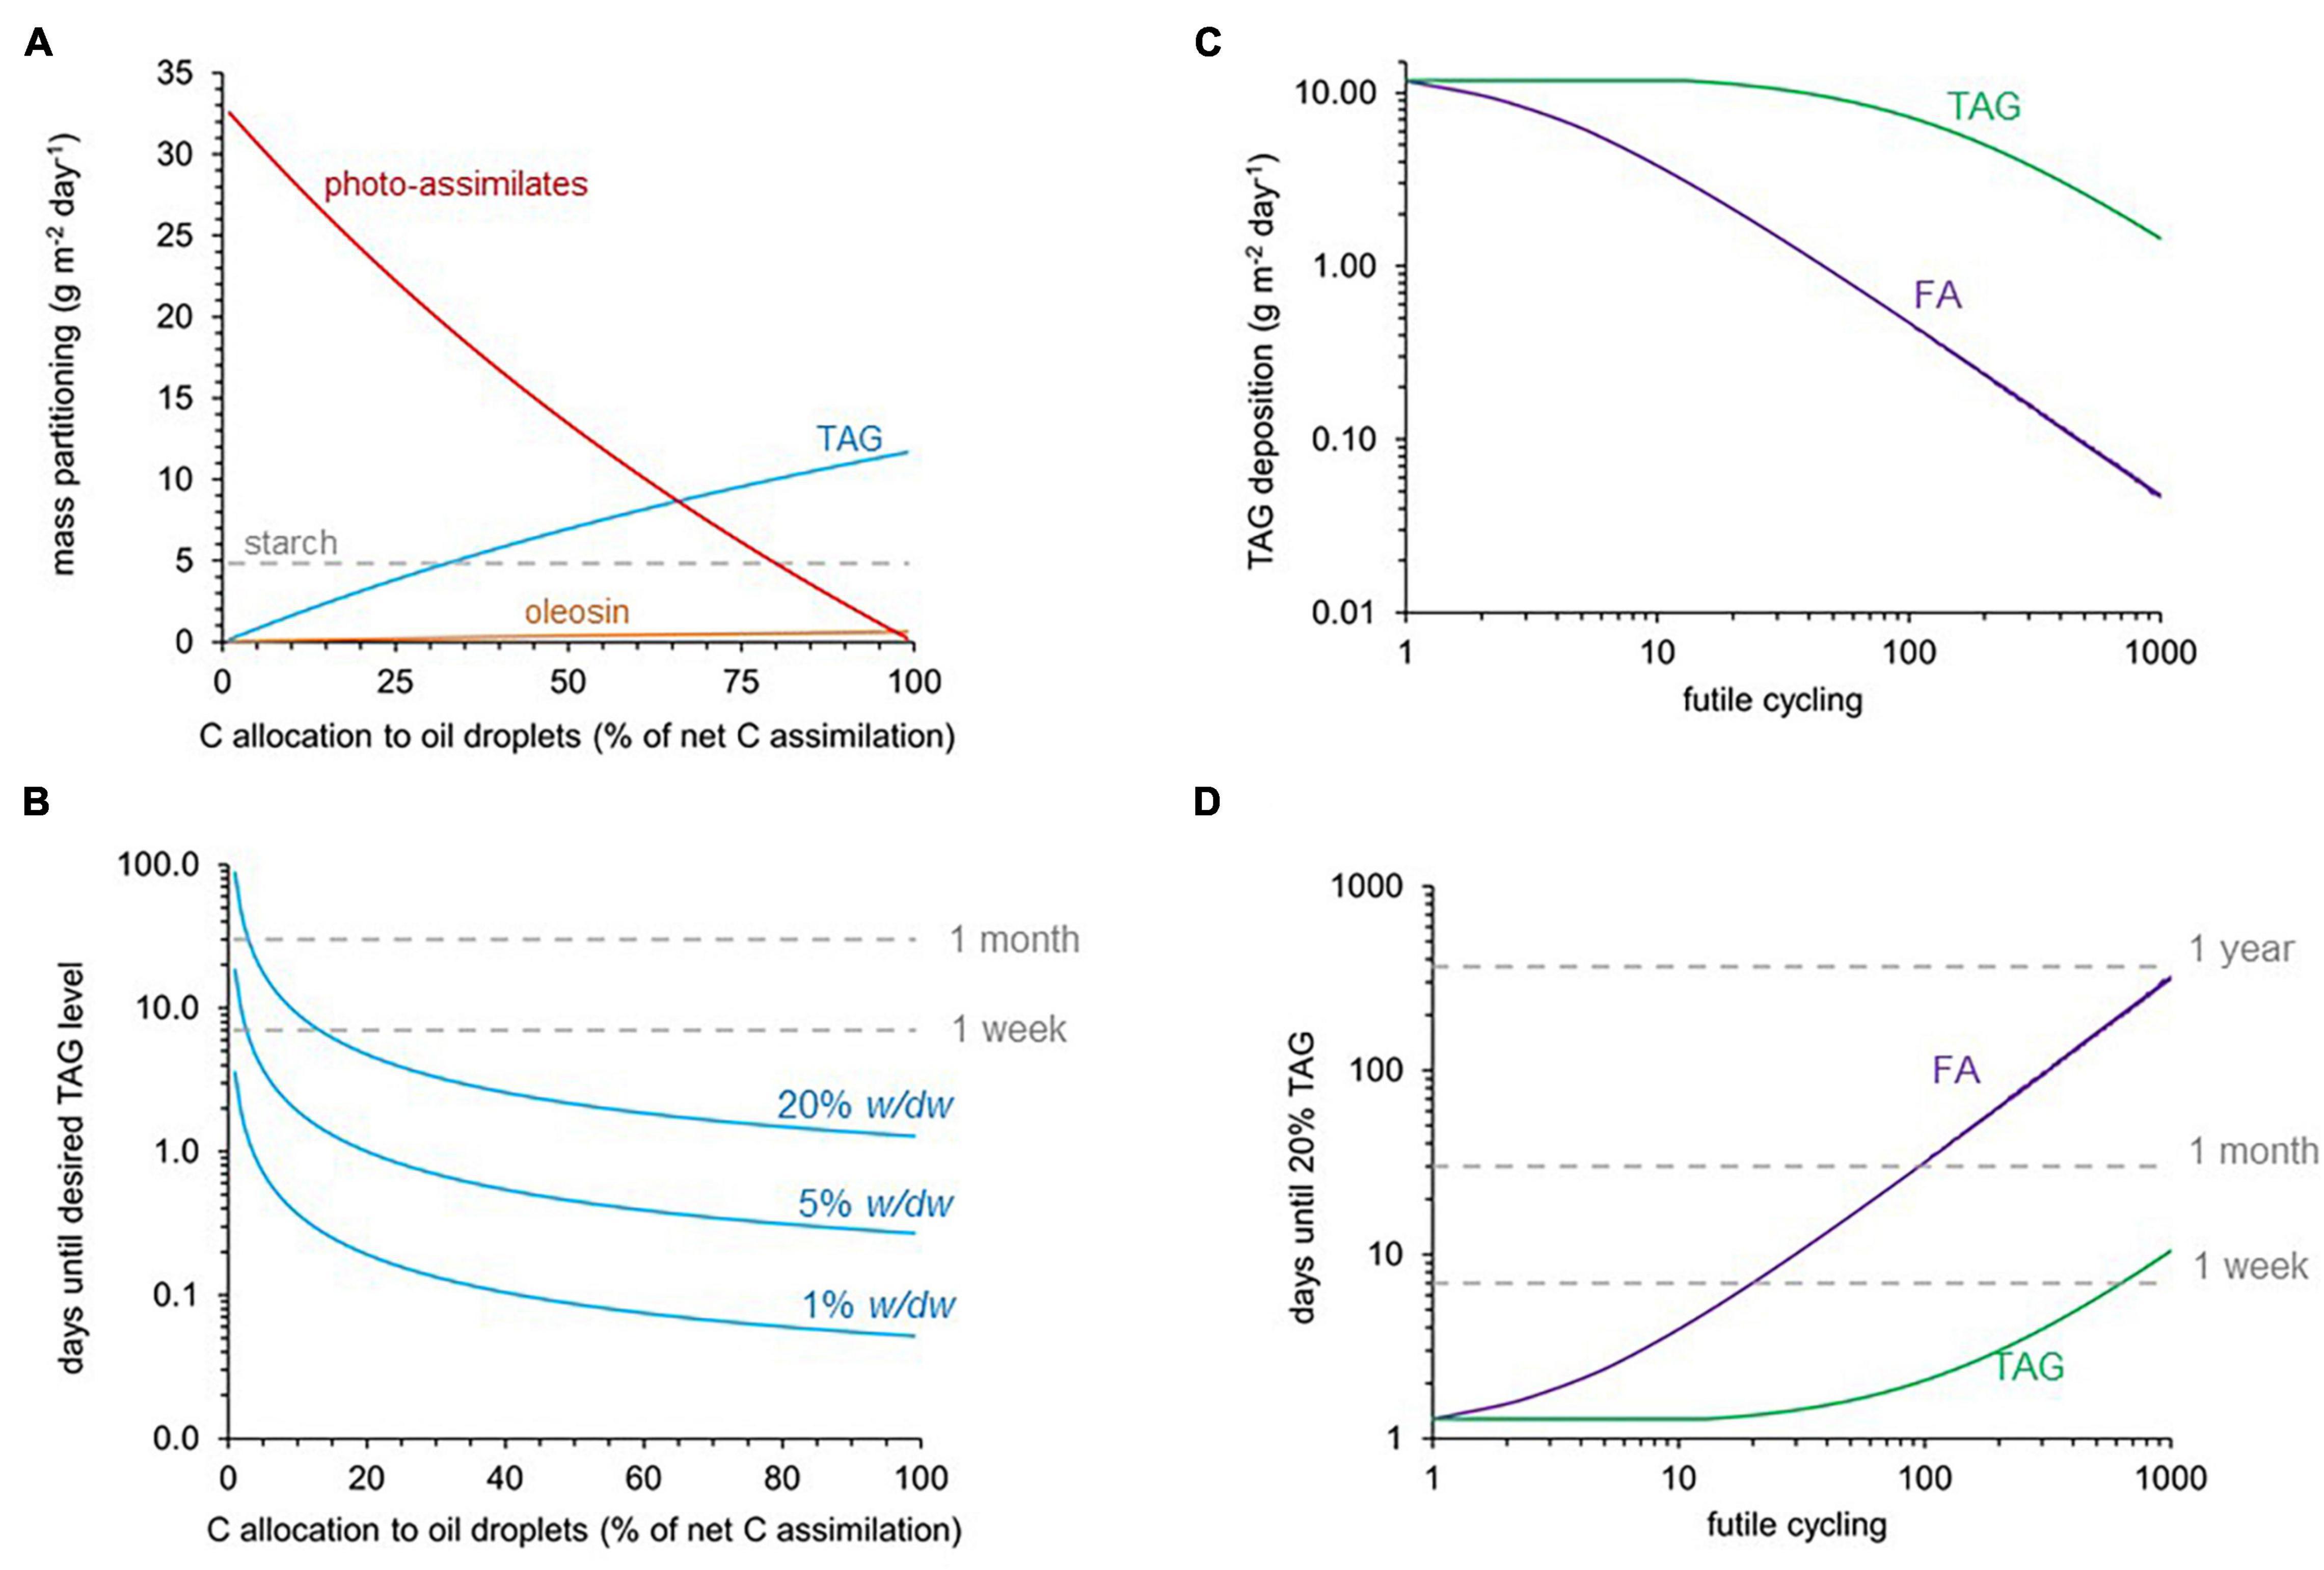
Figure 5. Model simulations for TAG accumulation in mature leaves. Daily photo-assimilate export (sucrose and amino acids) and TAG accumulation was modeled for mature Sorghum bicolor leaves under full-sun exposure (iTJC1414x4). See Supplementary Table 2 for main model constraints. (A) Mass partitioning of primary photo-assimilates between photo-assimilates (exported), starch (transitory), and TAG, which is deposited in the leaf with oleosin. Starch is not counted as net assimilation since it is completely degraded by night respiration activities. (B) Time period until a target level (1, 5, 20% w/dw) of TAG accumulation is reached, in dependence of the fraction of assimilated carbon being allocated to oil droplets (i.e., TAG and oleosin synthesis). The effects of TAG (purple) and FA (green) futile cycles on (C) TAG deposition and (D) the time needed to reach 20% (w/dw) TAG in leaf tissue if 100% of net photo-assimilated carbon is partitioned into oil droplets. TAG or fatty acids are synthesized up to 1,000-fold in excess over what is stored as TAG in oil droplets. Cycling units are mol TAG synthesis per mol TAG accumulated in oil droplets (TAG cycling) and mol fatty acid synthesis per mol fatty acid stored in oil droplets (FA cycling) (see section “Materials and Methods,” Equations 4, 5).
Effect of Futile Cycling on Triacylglycerol Accumulation
Leaf lipase activities (e.g., TAG hydrolysis) and the capacity for oxidative degradation of fatty acids by peroxisomal β-oxidation can result in futile cycles of synthesis and degradation which diminish the rate of net TAG accumulation. In iTJC1414x4, cyclic synthesis and degradation of fatty acids and of TAG can be imposed onto the model by the numerical constraints shown in Equations 4, 5. We define cycling as the multiplication factor by which the rate of synthesis of fatty acids or TAG exceeds the rate at which fatty acids or TAG itself are deposited in TAG. Fivefold cycling of fatty acids (Equation 5), for example, means that the de novo synthesis of fatty acids is five times the amount of fatty acid that is processed and stored in TAG. All fatty acids that are produced but not stored can only enter the peroxisomal process of β-oxidation. Besides fatty acid cycling, TAG cycling means that newly synthesized TAG is hydrolyzed into glycerol and free fatty acids, which then can be re-utilized to synthesize TAG. This requires glycerol and free fatty acids to be activated to glycerol phosphate and CoA esters, both of which are ATP-driven processes (reactions “GlycerolKinase,” “PalmitoylCoASynthesis,” “OleoylCoASynthesis,” “LinoleoylCoASynthesis,” and “LinolenoylCoASynthesis”). Figure 4 compares a scenario of TAG synthesis from CO2 without cycling to a scenario where fivefold FA cycling takes place. At fivefold cycling, fatty acid biosynthesis is increased by 2.7-fold while the net CO2 uptake and TAG deposition rates decrease by 62 and 53%, respectively. It is also notable that the CBB cycle flux is predicted to markedly increase under the fivefold cycling condition (Figure 4). Degradation of fatty acids by β-oxidation transfers electrons onto oxygen and NAD+, and the produced NADH can contribute to the overall balance in reducing equivalents. Carbon from β-oxidation is predicted to be recovered as malate, and in the pyruvate/malate shuttle mechanism its production makes up for the reduced synthesis and transport of malate from MCs to BSCs (Figure 4).
Assuming all net CO2 was allocated toward oil droplets, we simulated the impact on the rate of TAG storage by levels of increasing futile cycling (Figures 5C,D). As seen in Figure 5C, as TAG cycling was increased up to about 50-fold, the rate of TAG deposition decreased only slightly. Notably, fatty acid cycling more strongly affects TAG deposition than TAG cycling. As can be deduced from the graphs in Figure 5C, a 50% reduction of the maximal rate of TAG deposition is obtained for about fivefold cycling of fatty acids, while about 100-fold TAG cycling is needed to reduce TAG deposition in the same way. This difference can be in part explained by the difference in re-synthesis cost. Re-synthesis of oleoyl-CoA from acetyl-CoA requires 9 ATP and 17 reducing equivalents, while re-cycling of one free oleic acid into TAG requires activation of the free fatty acid to the CoA ester by acetyl-CoA synthetase (EC 6.2.1.1) in coordination with adenylate kinase (EC 2.7.4.3), which comes at a net cost of 2 ATP. The effect of cycling on the daily net TAG deposition rate can be used to predict TAG accumulation over time (Equation 3). The time needed to reach a 20% TAG target increases as FA or TAG cycling increase (Figure 5D). These scenarios were considered again for a 100% allocation of CO2 net assimilation to oil droplets. As before, the time to reach target levels of TAG was much less substantially affected by TAG cycling than by FA cycling (Figure 5D).
Combined Effects of Carbon Allocation and Futile Cycling
Both FA and TAG futile cycling can be imposed in combination with a carbon partitioning scenario. Figure 6 shows a factorial plot for simulating the three variables for up to 250-fold cycling for fatty acids and TAG. The time duration to reach 20% leaf TAG is shown in color coding. In agreement with the analysis in Figures 5, 6 shows how FA cycling has generally more substantial effects than TAG cycling across a range of carbon partitioning ratios. Although we show up to 250-fold futile cycling, model simulations with high cycling rates might be unlikely to occur in reality due to physiological limitations in flux capacity. To estimate limitations on fatty acid and TAG cycling fluxes, we predicted fatty acid biosynthesis rates when total leaf biomass is produced (Supplementary Table 3) under conditions of light flux, photorespiration, CO2 leakage and maintenance cost as defined above for the mature leaf reference state (Supplementary Table 2). This simulation predicted that fatty acids, while contributing to biomass formation, are newly formed at a rate of 0.11 mol/m2/day, which is equivalent to 12% of the net CO2 fixation rate. We now supposed that 10 times that rate (1.1 mol/m2/day) might define the upper limit in flux capacity for growing tissue or for mature tissue engineered to accumulate TAG. Figure 7 shows imposition of this flux capacity limit for discrete slices of Figure 6 at 10, 5, and 2% net carbon allocation to oil droplets. Simulation results where TAG and fatty acid biosynthesis operate below the upper limits are demarcated. For example, for 5% carbon allocation to oil droplets, maximal about 20-fold TAG and 25-fold FA cycling are feasible and within the demarcated area, the time to reach 20% TAG per leaf dry weight varies between 18 and 28 days (Figure 7B).
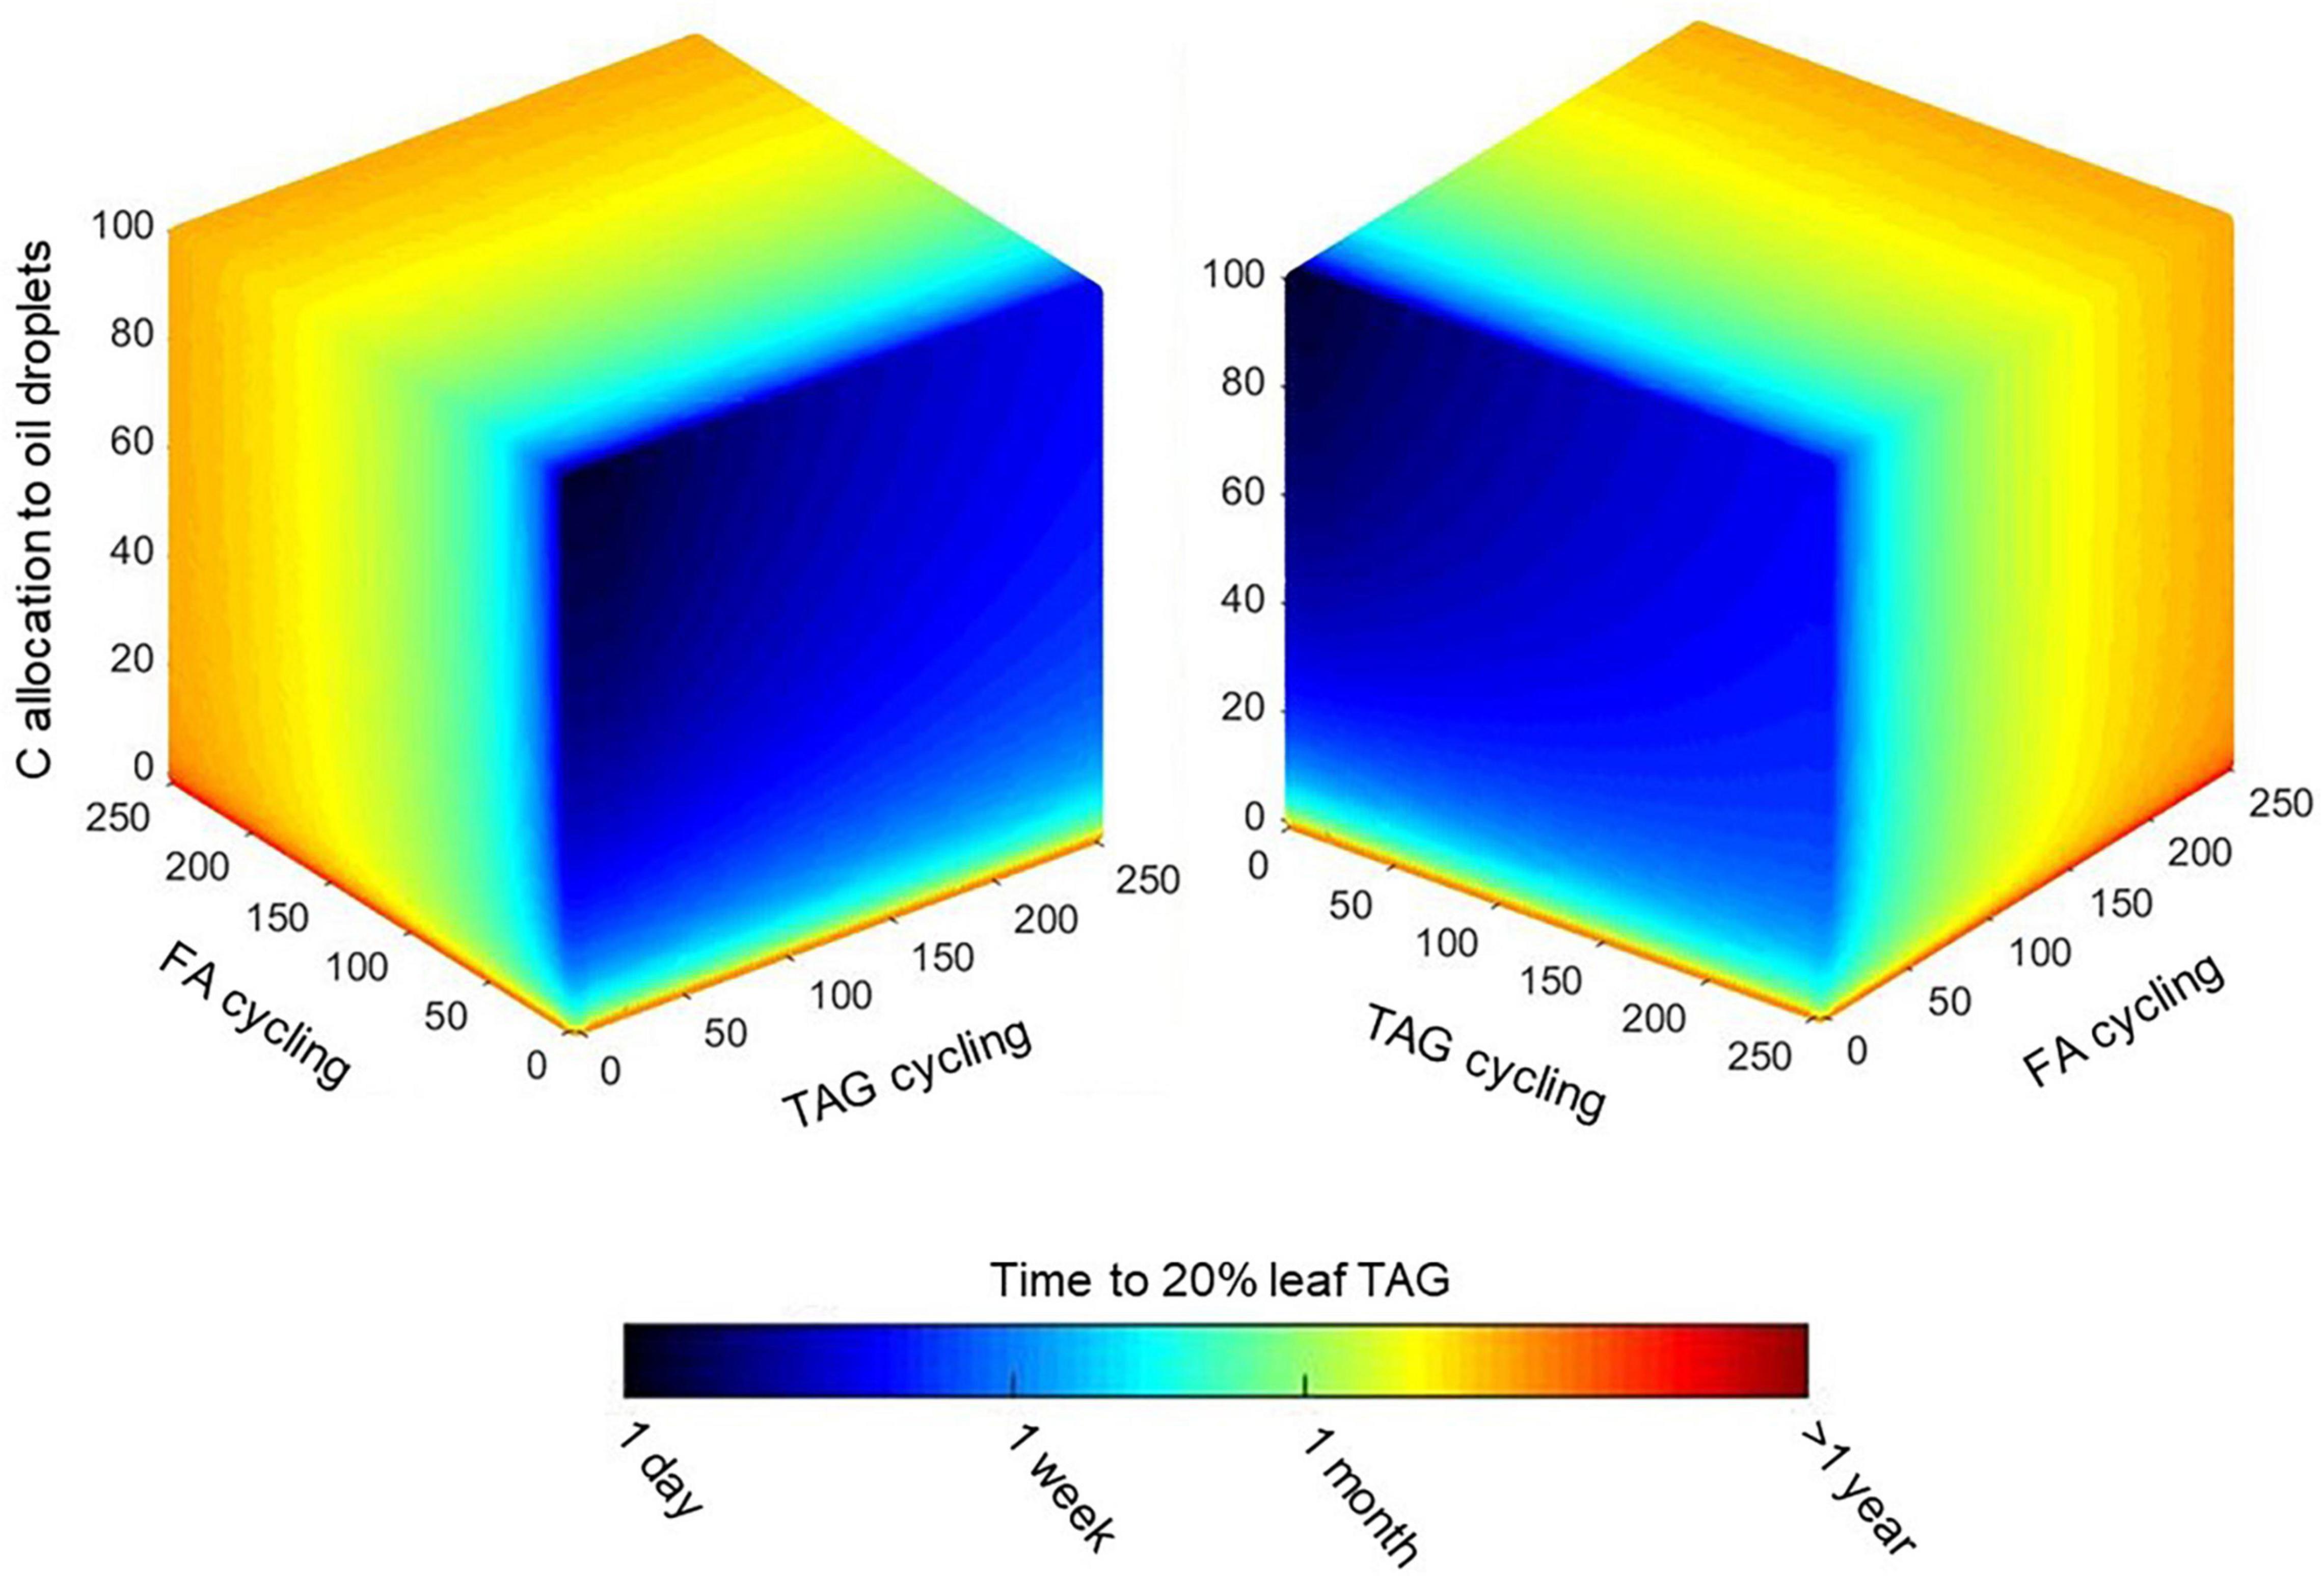
Figure 6. Concurrent effect of allocation and futile cycles on TAG accumulation. Expansion of the Figure 5 simulations to explore how simultaneous variations in net carbon allocation, FA cycling, and TAG cycling affect TAG accumulation in mature Sorghum bicolor leaves. Colors indicate the expected time needed to for stored TAG to occupy 20% (w/dw) of the leaf and are given on a log scale. Cycling units are mol TAG synthesis per mol TAG accumulated in oil droplets (TAG cycling) and mol fatty acid synthesis per mol fatty acid stored in oil droplets (FA cycling).
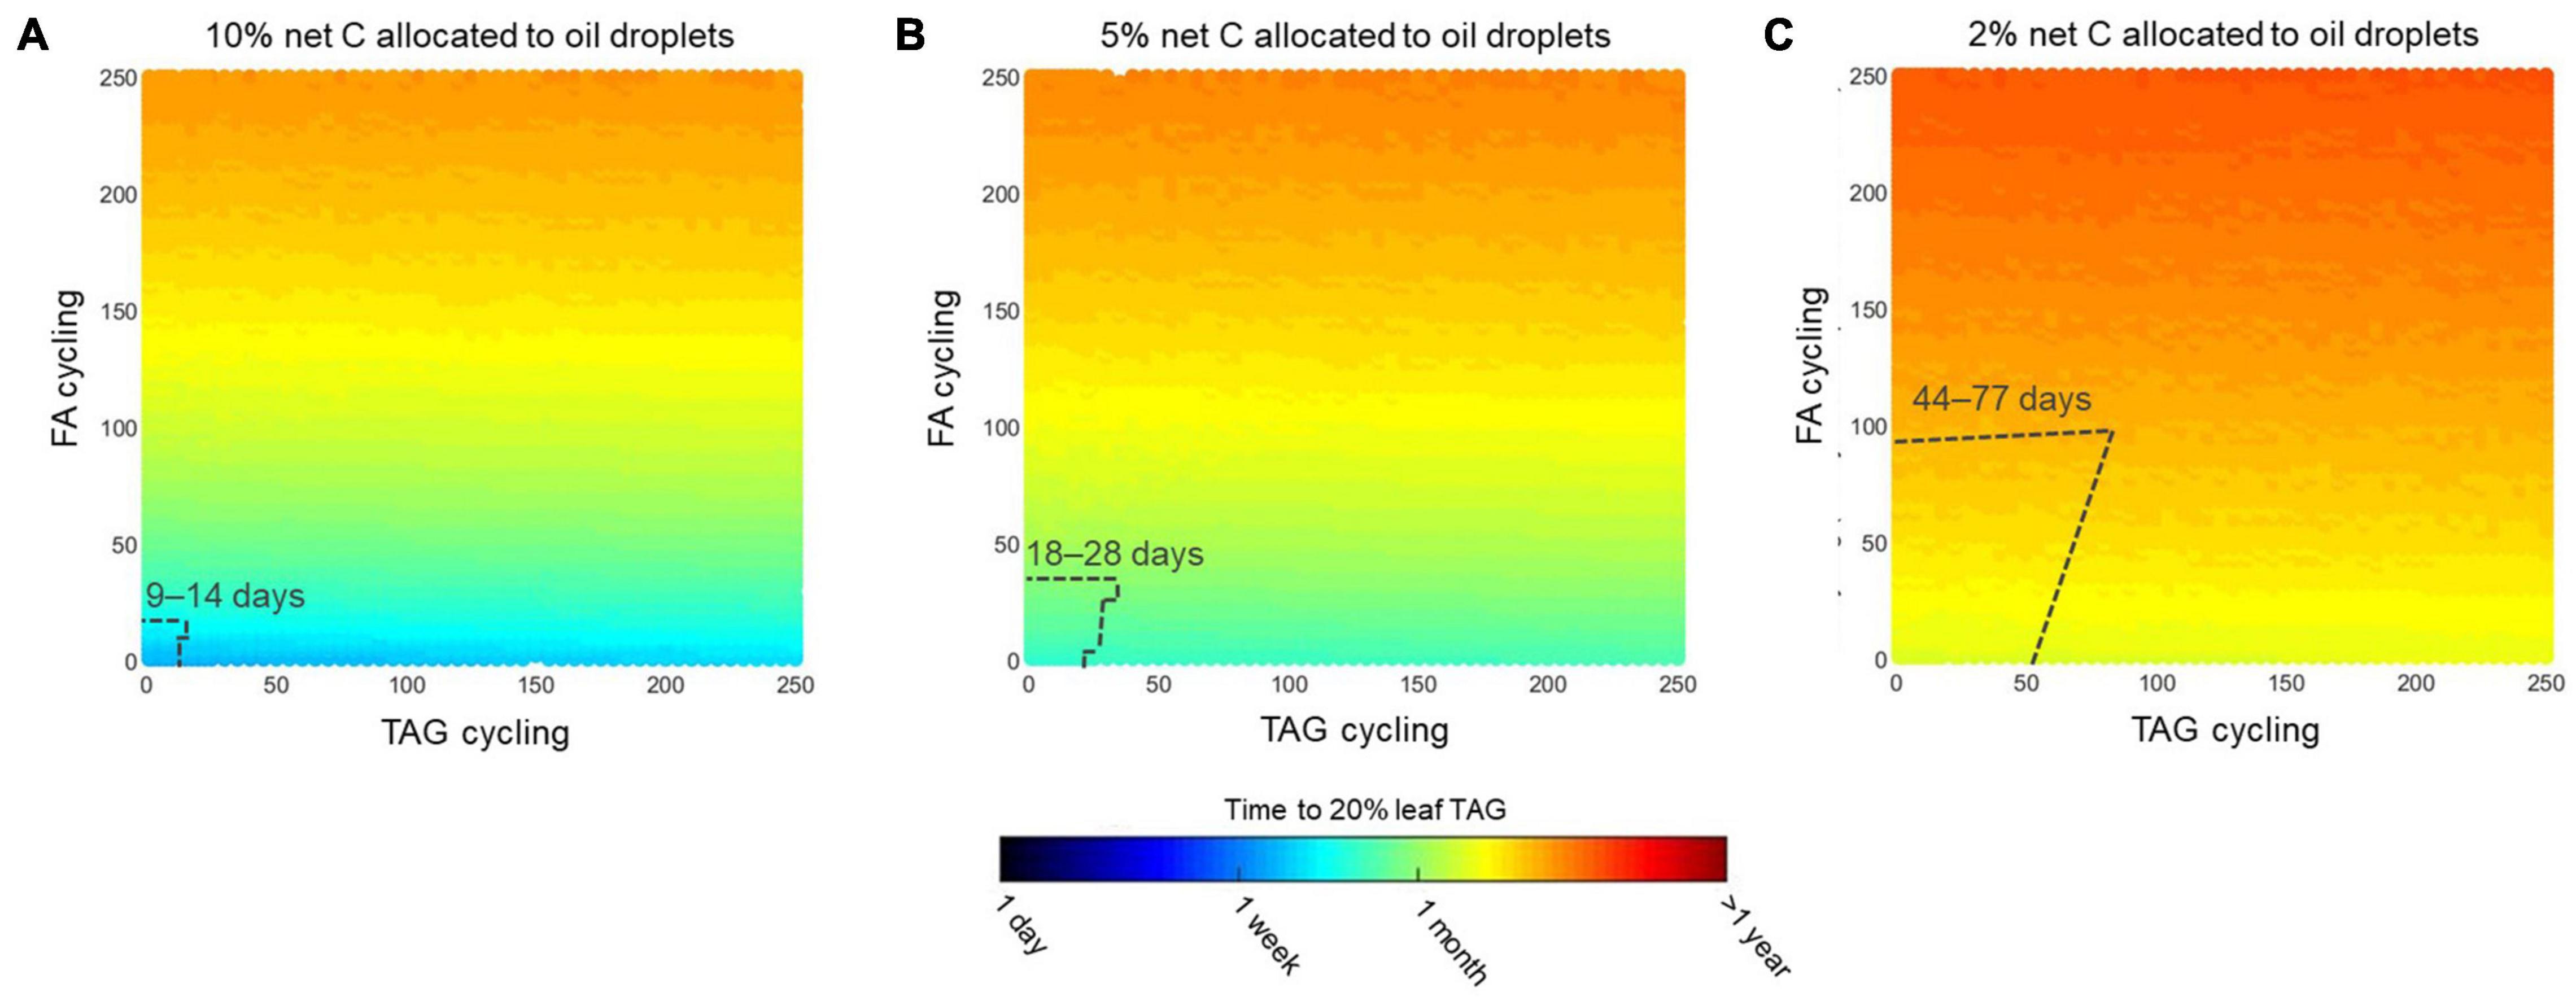
Figure 7. Effect of futile cycles at fixed carbon allocation ratios. Subsets of simulations presented in Figure 6 to illustrate how TAG and FA futile cycling together lead to changes in the time needed to accumulate 20% (w/dw) TAG in mature Sorghum bicolor leaves when (A) 10, (B) 5, or (C) 2% of net carbon is allocated to oil droplets. Colors indicate the expected time on a log scale. Dashed lines indicate a region close to the origin (0, 0) within which maximum flux limits in lipid metabolism are not exceeded. We set these flux limits based on a scenario where leaf biomass synthesis was maximized. In the delimited region simulations, the total fatty acid synthesis rate was less than 10-fold the synthesis rate in the growing leaf scenario. The range of days until 20% TAG is reached in the delimited region is given. Cycling units are mol TAG synthesis per mol TAG accumulated in oil droplets (TAG cycling) and mol fatty acid synthesis per mol fatty acid stored in oil droplets (FA cycling).
Triacylglycerol Accumulation When Leaf Is Shaded Within the Canopy
The simulations on carbon allocation to TAG (Figures 5–7) were based on rates that can be expected when S. bicolor leaves receive full sunlight. Realistically, there are weather dependent reductions in sunlight, effects of temperature and draft conditions, effects of shading within the canopy, as well as reductions in metabolic capacity due to onset of senescence. Of these conditions we decided here to briefly explore the effect of shading, without detailed modeling of canopy effects. At 1 m depths into the canopy, Z. mays leaves have been measured to receive roughly 70% less light than fully exposed leaves (Dohleman and Long, 2009). Consequently, in our shade simulations, we constrained the MC and BSC to receive 70% less light, thus to reduce the total influx for light from 22.12 to 6.63 mol photons/m2/day. With these shade conditions, we simulated how the rate of TAG storage was affected if 0–100% of net CO2 assimilation was allocated to oil droplets, and there was up to 1,000-fold futile cycle activity. At 100% carbon allocation to oil droplets and without futile cycling, TAG could accumulate at 1.35 g/m2/day and reach the 20% yield target in less than 2 weeks (Supplementary Figure 7). If only 30% of net carbon assimilation is allocated to oil droplets or if there is 200-fold TAG cycling, then 20% TAG (w/dw) would be reached within a month.
Discussion
As an emerging concept for the development of high energy renewable plant resources, engineering bioenergy crops to accumulate TAG in their vegetative tissues holds the promise of achieving high overall yields. Panicoid C4 grasses are generally known for their high productivity and potential for use as bioenergy crops. Of these, S. bicolor has excellent genomic resources (Carpita and McCann, 2008; Paterson, 2008; McCormick et al., 2018) and a diploid genome that has not experienced genome duplication since its diversion from the common ancestor with maize (Kim et al., 2014), which positions S. bicolor as a model for other panicoid C4 grasses with more complex polyploid genomes. S. bicolor is also amenable to genetic engineering. For example, S. bicolor leaves have been genetically engineered to over-express WRI, DGAT1, and oleosin and accumulated between 3 and 8.4% oil per leaf dry weight (Vanhercke et al., 2019a). To explore the theoretical capacity of S. bicolor to accumulate TAG, we derived a genome-referenced reconstruction of S. bicolor metabolism (iTJC1414). We put special emphasis on curation of primary metabolism, including metabolism relevant to fatty acid and TAG metabolism. We further present a C4-leaf diel FBA metabolic model (iTJC1414x4) that simulates cycles of day and night leaf metabolism to explore the theoretical capacity of S. bicolor to accumulate TAG in leaves.
Lipids are energy-dense plant products, which means that replacing sucrose by TAG as the photo-assimilatory end-product comes at a higher cost in energy cofactors that must be derived from the light-dependent reactions in chloroplasts. In literature related to plant lipid biofuels it is often pointed out that, on a weight basis, oil has more than twice the energy content of carbohydrate (Durrett et al., 2008; Ohlrogge and Chapman, 2011; Allen et al., 2015; Huang et al., 2016; Xu and Shanklin, 2016; Wan et al., 2017). Based on the fatty acid composition used in our model, sorghum leaf TAG is 2.39 as energy dense as sucrose (Table 2). Thus, one could infer that the biosynthetic cost raises by a similar factor. However, on a per carbon basis, TAG has about 1.4-fold the energy content of carbohydrate (Table 2). Similarly, the requirements in reducing equivalents based on the chemical balance are about 1.4 times higher in TAG (Table 2). In basic agreement with the considerations on energy content and chemical minimal demands, we find that in a C3 photosynthesis context the metabolic demands in ATP and NADPH are 1.3-fold and 1.49-fold higher for TAG, as compared to sucrose synthesis (Figure 2A). If photorespiration activity is considered, very similar ratios are found (Supplementary File 3). Evaluations of C4 photosynthesis in iTJC1414x4 (Table 4, scenario 3) showed 1.37-fold higher demands in NADPH and slightly less than that of a difference in ATP cost. Overall, if done based on comparing energy density on per weight basis, the cost for photo-assimilation of CO2 into TAG will be overestimated.
The basic scenario for TAG biosynthesis in a leaf tissue shows that the generation of acetyl-CoA as a precursor of fatty acid biosynthesis is well-integrated with the CBB cycle (Figures 2A, 4). Indeed, experimental evidence has shown that the plant fatty acid synthesis pathway is co-localized with the CBB cycle to the chloroplast (Ohlrogge and Browse, 1995). Also, fatty acid biosynthesis in leaves has been shown to be strongly light dependent (Roughan and Ohlrogge, 1996; Bao et al., 2000). CO2 labeling kinetics suggest that CO2 is incorporated very fast into fatty acids while free acetic acid or sugars are unlikely direct pathway intermediates (Bao et al., 2000). Experimental evidence further suggests that acetyl-CoA in leaf chloroplasts is derived directly from CBB cycle intermediates via a chloroplast-localized PDHp (Murphy and Leech, 1977; Bao et al., 2000; Joyard et al., 2010). One advantage of proximity of the CBB cycle and fatty acid biosynthesis in one compartment should be very efficient re-fixation by RubisCO of CO2 emitted by PDHp (Figure 2A). Notably, the PDHp produces one mol NADH per mol acetyl-CoA (Figure 2A). While it is most commonly the case that the energy cofactors NADH and NADPH are dedicated toward use in cellular respiration and in reductive biosynthetic reactions, respectively, the NADH produced by PDHp can be assumed to be used entirely in fatty acid biosynthesis (Figure 2A). This is possible since one of the two reducing enzyme activities in the chloroplast fatty acid biosynthesis, enoyl-ACP reductase (EC 1.3.1.9), is considered to be specific to NADH, not NADPH (Slabas et al., 1986; Rafferty et al., 1994; Gonzalez-Thuillier et al., 2015). Besides the CBB cycle, the photosynthetic light reactions are co-localized with fatty acid biosynthesis as well. This suggests a tight coupling between photosynthetic ATP and NADPH supply and biosynthetic demands. It is widely considered that ATP and NADPH provided by the photosynthetic light reactions must match the metabolic demands to prevent photodamage and allow for optimal growth (Noctor and Foyer, 1998; Kramer and Evans, 2011; Walker et al., 2020). To explore the energy supply/demand balance, we defined a reference state for the mature sorghum leaf where photosynthesis ATP/NADPH supply matches the demands for synthesis of phloem-exported photo-assimilates. Relying on the electron transport model for C4 photosynthesis by Yin and Struik (2018), we consider the light energy supply to be defined in a realistic way. Specifically for sorghum, their study essentially predicts that BSCs almost entirely rely on CET and mostly lack protein components of LET (Yin and Struik, 2018). This means that most of the NADPH used in the CBB cycle in BSCs needs to be imported from MCs, as being the case in our simulation (Figure 3). Having therefore defined a reliable reference photosynthetic state, we could further predict that altering the CO2 assimilation product from phloem-exported photo-assimilates into TAG would lead to a sizeable surplus in photosynthetic ATP production (Table 4). An ATP surplus could stall the thylakoid ATP synthase, therefore likely leading to a build-up of the proton motive force that would restrict electron flow toward NADP+.
iTJC1414x4 is a C4 metabolism diel model that allows simulation of the metabolism and resource allocation in a leaf over the diel cycle. We performed in silico simulations to evaluate the assumption that based on its capacity to photo-assimilate CO2, a mature sorghum leaf could potentially accumulate substantial levels of TAG in a short time. Critical for this would be that a sizeable fraction of the assimilated carbon can be diverted away from exported photo-assimilates to oil droplets and that the limiting effects of lipid turnover (futile cycles) can be mitigated. A range of possible scenarios of partitioning of carbon assimilation between oil droplets and photo-assimilates were simulated to predict net possible daily rates in TAG accumulation. We then expressed daily TAG accumulation rates as the number of days it would take to reach a 20% yield target. The 20% level would make production of S. bicolor biodiesel economically feasible (Huang et al., 2016). We determined that if only 5% of the net carbon assimilated would be partitioned toward oil droplet deposition and if there was moderate futile cycling, a 20% w/dw target could be reached in less than a month (Figure 7B). There are several insights that can be derived from this finding. If it is sufficient to divert only a small fraction of assimilated carbon into TAG synthesis, then the above-mentioned problem of energy imbalance for TAG synthesis would be less severe since, apart from TAG synthesis, most of the photosynthetic supply of ATP and NADPH would still be invested into sucrose synthesis and therefore mostly balance with the overall biosynthetic demands. Also, the finding that minimal carbon partitioning might be sufficient to accumulate TAG at substantial levels is useful for a retrospective assessment of reported efforts at engineering leaves to accumulate TAG. Keeping in mind that such past studies were done with different plant species and that TAG accumulation rates are typically not precisely measured, our modeling exploration shown in Figures 5–7 nevertheless suggests the following: if final TAG levels are found to be far below 20% and we assume the accumulation took place during a rather extended time period (>1 month), only minimal reallocation of primary photo-assimilate into TAG could have taken place. As a consequence of these considerations, it seems that engineering efforts should benefit from more detailed experimental characterization of transgenic events, like determination of carbon reallocation ratios by use of isotope tracers. Since our model simulations suggest that accumulation of TAG at substantial levels in leaf tissue is possible within a time frame of only several weeks, high-yield goals might be in reach if TAG biosynthesis is to take place only at the end of the growth cycle. This way, by engineering TAG synthesis to only be activated in the final stage of the crop life cycle, transgenic growth penalties could be largely avoided. The late onset of TAG synthesis could be achieved, for example, by chemical induction (Caddick et al., 1998) or using senescence related promoters (Kim et al., 2015; Vanhercke et al., 2017; Xu et al., 2020). For example, it is known for some species, that ectopic over-expression of the transcription factor WRI1 can cause perturbations in vegetative development (Marchieve et al., 2014). In case of potato plants it was found that, while expression of WRI1 in leaves has resulted in such effects, expression under a sensecence inducible promoter had less adverse affects, with TAG levels peaking at the sensecence stage of leaves (Xu et al., 2020). However, considering TAG accumulation in senescing leaves one also might have to address a number of senescense related effects, including lipid turn-over and degradation (Troncoso-Ponce et al., 2013).
Our model simulations explore a trade-off between photo-assimilates exported to the phloem and the synthesis and deposition of TAG in the leaf tissue. We consider export of sucrose and amino acids as the dominant route of assimilate flow in mature leaves. Starch is modeled as transitory pool (Figure 1) and is not included in the trade-off simulations. Similarly, the levels of leaf sugars are treated as invariably constant in our model. Of relevance here is that in various studies on engineering high oil content in leaves, differences in leaf starch or sugar levels between wild-type and transgenics have been found and that therefore leaf carbohydrates are regularly considered to be major sinks, competing with oil synthesis for photo-assimilates (reviewed in Xu and Shanklin, 2016; Vanhercke et al., 2019b). While a difference in carbohydrate levels might indicate that carbon allocation has been changed, we do not expect differences in leaf carbohydrate levels to be a quantitative indicator of changes in carbon allocation. This should become clearer by the following considerations. In our simulated mature leaf reference state, the sucrose export rate is 0.09 mol/m2/day while transitory starch is synthesized at a rate of 0.03 mol/m2/day (Supplementary Table 7, scenario 4). In weight units this sucrose export amounts to 30.8 g/m2/day. Considering the sorghum leaves to have a dry weight of 60 g/m2 in this study, the sucrose that is synthesized and exported per day can amount to 50% of the leaf’s dry weight. At the same time, sucrose levels that can be measured in a leaf are typically well below 10% w/dw and might undergo diurnal variation (Kalt-Torres et al., 1987; Ning et al., 2018; Liang et al., 2019; Mitchell et al., 2020). This means that, while leaf sucrose levels might be informative of the leaf’s sugar status, sucrose should be understood and modeled as a high turn-over pool. A change in sugar level is unlikely to reflect a change in photo-assimilation of in assimilate partitioning in a quantitative way. Our assertions on the dominance of assimilate export as a carbon sink can be supported by other studies. In maize leaves, CO2 assimilation during a normal day/night cycle has been found to result in generation of 45.5 g sucrose synthesis per m2 leaf area per day, from which 80% was exported (Kalt-Torres et al., 1987). Applying the leaf density that we used here (60 g dw/m2) to the study by Kalt-Torres et al. (1987), the daily sucrose export in maize leaves can amount to 60% of the leaf dw while the sucrose contents of the leaf were maximally at about 4% (w/dw) during the day. A later study confirmed that maize leaves at different developmental stages can export 80% or more of the photo-assimilated sugars (Liang et al., 2019). Overall, we conclude that in studies aimed at engineering plants to accumulate oils in vegetative tissue, the assessment of carbon allocation in leaves of the transgenics should benefit from measurements of overall the CO2 assimilation rate and from tracing this assimilate flow into major sinks.
In the context of this study, the simulated allocation scenarios are predominantly concerned with the assimilation and partitioning of carbon. For simulations relating to the mature leaf reference state, nitrogen assimilation takes place for the synthesis of amino acids that contribute to the exported photo-assimilates and to the oleosin associated with TAG. However, nitrogen assimilation occurs here at a relatively low rate. In a larger context, nitrate assimilation has been considered to be a major sink for photosynthetic energy in higher plants (Noctor and Foyer, 1998). For foliar nitrate assimilation, photosynthetic ATP production is expected to be in excess relative to the demands at the glutamine synthetase step (Noctor and Foyer, 1998), i.e., an ATP surplus is to be expected to occur. This can be demonstrated with iTJC1414x4. If the energy balance computations made for the mature leaf in Table 4 (scenario 3) are modified so that glutamate is the only photo-assimilate exported, nitrate and CO2 are assimilated at a ratio of 0.2:1 and the ATP surplus amounts to 1.69 ATP per CO2 fixed.
In this study we used a C4-leaf diel FBA metabolic model to explore the accumulation of TAG in the leaf. However, maximal energy density in the total above-ground harvested biomass of a bioenergy crop would be best accomplished if all above ground vegetative tissues would accumulate TAG. Therefore, extensions of our approach to a whole plant model need to be considered. Diel FBA models have been used in other plant studies to analyze resource transport and use in a whole-plant system (Gomes de Oliveira Dal’Molin et al., 2015), compare leaf metabolism in C3 and CAM plants during the day and at night (Cheung et al., 2014), and explore energetic limitations of product synthesis in C4 leaves (de Oliveira Dal’Molin et al., 2018). It is important to note that, although these models may connect and balance metabolism across different tissues and between day and night, multi-tissue and diel FBA modeling approaches do not necessarily make any prediction on the growth dynamics of a plant during its life cycle. Therefore, our current model cannot directly account for yield penalty effects that have been observed in plants engineered to constitutively accumulate TAG in green vegetative tissues (Alameldin et al., 2017; Vanhercke et al., 2019a). To model plant growth dynamics and address questions concerning potential yield penalties, whole-plant carbon partitioning and storage of photo-assimilate as TAG in other organs (e.g., stem), the diel steady-state FBA model presented here could be extended into a dynamic FBA (dFBA) model (Varma and Palsson, 1994). In a dFBA time series simulation of a multi-tissue model, each steady state modifies conditions like carbon allocation ratios of the next steady state. For example, dFBA has been used with a multiorgan barley model to investigate how decreases in photosynthesis due to leaf senescence limit the yield of seeds and other sink tissues (Grafahrend-Belau et al., 2013). In addition, Shaw and Cheung (2018) modeled A. thaliana with dFBA and estimated the total biomass and root-to-shoot ratios resulting from herbivory, shading, nitrogen availability, and other features that would have long-term impacts on carbon and/or nitrogen metabolism. By using dFBA to simulate TAG accumulation in vegetative tissues, the joint effects of plant development, leaf age, and other factors could be integrated.
Conclusion
Our simulations of TAG accumulation in mature sorghum leaves suggest that economically feasible levels of TAG could be reached within weeks if only a small fraction of photosynthate is allocated to oil droplets and there is mild FA futile cycling. This means that engineering strategies aimed at activating TAG accumulation only at the end of the growth cycle might result in sufficiently high TAG levels to become economically feasible. Activating TAG accumulation late in development would also mean that the not well understood phenomenon of yield penalty could be avoided. Altogether, our study helps to establish a benchmark to measure metabolic engineering efforts aimed at TAG accumulation in vegetative tissues. Additional efforts to improve the metabolic engineering cycle should certainly also make use of quantitative analysis of metabolic phenotypes, which may include metabolomics and isotope tracer-based efforts at determining synthesis and turnover rates of TAG (Chu et al., 2020, 2022).
Data Availability Statement
The original contributions presented in the study are included in the article/Supplementary Material, further inquiries can be directed to the corresponding author.
Author Contributions
TC and JS conceived the project, reconstructed the genome-referenced, four cell, diel FBA model of sorghum, and co-wrote the manuscript. JS built the generic plant network for C3 photosynthesis and TAG synthesis, analyzed the photosynthetic sub-models, and aligned the Yin and Struik model to the FBA model. TC carried out the model simulations on carbon allocation and futile cycling. Both authors contributed to the article and approved the submitted version.
Funding
Sorghum specific modeling and analysis as well as project supervision (by JS) was funded by the U.S. Department of Energy (DOE) Center for Advanced Bioenergy and Bioproducts Innovation, Office of Science, Office of Biological and Environmental Research under award number DE-SC0018420 (to TC and JS). Methods development and computations related to chemical balances, plant generic biochemical pathways, and concepts of balanced energy budgets in photosynthesis were funded by U.S. DOE, Office of Science, Office of Basic Energy Sciences under contract number DE-SC0012704 – specifically through the Physical Biosciences program of the Chemical Sciences, Geosciences and Biosciences Division (to JS).
Conflict of Interest
The authors declare that the research was conducted in the absence of any commercial or financial relationships that could be construed as a potential conflict of interest.
Publisher’s Note
All claims expressed in this article are solely those of the authors and do not necessarily represent those of their affiliated organizations, or those of the publisher, the editors and the reviewers. Any product that may be evaluated in this article, or claim that may be made by its manufacturer, is not guaranteed or endorsed by the publisher.
Supplementary Material
The Supplementary Material for this article can be found online at: https://www.frontiersin.org/articles/10.3389/fpls.2022.787265/full#supplementary-material
Supplementary File 1 | Sorghum bicolor iTJC1414 single-cell metabolic model in SBML and Excel formats, and MATLAB scripts for running model simulations.
Supplementary File 2 | Sorghum bicolor iTJC1414x4 in SBML and Excel formats, and MATLAB scripts for running model simulations.
Supplementary File 3 | Supplementary information on chemical balances, biochemical pathways, and energy budgets of photosynthesis.
Supplementary File 4 | Input files for METATOOL analysis and model code for the cell type-specific electron transport model by Yin and Struik (2018).
Abbreviations
aBS,M, BSC:MC ratio in light absorption; fLET,BS, fraction of BSC absorbed irradiance that is used for linear electron transport; fLET,M, fraction of MC absorbed irradiance that is used for linear electron transport; OP, oxidative phosphorylation; ΦCO2, absorbed quantum yield for CO2 uptake (mol CO2/mol photon).
Footnotes
- ^ https://phytozome-next.jgi.doe.gov/
- ^ www.genome.jp/kegg/
- ^ www.plantcyc.org
- ^ www.python.org
- ^ https://www.gnu.org/software/glpk/
References
Alameldin, H., Izadi-Darbandi, A., Smith, S. A., Balan, V., Jones, A. D., and Sticklen, M. (2017). Production of seed-like storage lipids and increase in oil bodies in corn (maize; Zea mays L.) vegetative biomass. Industr. Crops Prod. 108, 526–534.
Allen, D. K., Bates, P. D., and Tjellström, H. (2015). Tracking the metabolic pulse of plant lipid production with isotopic labeling and flux analyses: past, present and future. Prog. Lipid Res. 58, 97–120. doi: 10.1016/j.plipres.2015.02.002
Allen, J. F. (2003). Cyclic, pseudocyclic and noncyclic photophosphorylation: new links in the chain. Trends Plant Sci. 8, 15–19. doi: 10.1016/s1360-1385(02)00006-7
Altschul, S. F., Madden, T. L., Schäffer, A. A., Zhang, J., Zhang, Z., Miller, W., et al. (1997). Gapped BLAST and PSI-BLAST: a new generation of protein database search programs. Nucleic Acids Res. 25, 3389–3402. doi: 10.1093/nar/25.17.3389
Arrivault, S., Obata, T., Szecówka, M., Mengin, V., Guenther, M., Hoehne, M., et al. (2017). Metabolite pools and carbon flow during C4 photosynthesis in maize: 13CO2 labeling kinetics and cell type fractionation. J. Exp. Bot. 68, 283–298. doi: 10.1093/jxb/erw414
Balota, M., Payne, W. A., Rooney, W., and Rosenow, D. (2008). Gas exchange and transpiration ratio in sorghum. Crop Sci. 48, 2361–2371. doi: 10.1094/PHYTO-01-12-0014-R
Bao, X., Focke, M., Pollard, M., and Ohlrogge, J. (2000). Understanding in vivo carbon precursor supply for fatty acid synthesis in leaf tissue. Plant J. 22, 39–50. doi: 10.1046/j.1365-313x.2000.00712.x
Bassham, J. A., and Calvin, M. (1960). “The path of carbon in photosynthesis,” in Die CO2-Assimilation/The Assimilation of Carbon Dioxide. ed. A. Pirson (Berlin: Springer), 884–922.
Beechey-Gradwell, Z., Cooney, L., Winichayakul, S., Andrews, M., Hea, S. Y., Crowther, T., et al. (2020). Storing carbon in leaf lipid sinks enhances perennial ryegrass carbon capture especially under high N and elevated CO2. J. Exp. Bot. 71, 2351–2361. doi: 10.1093/jxb/erz494
Bogart, E., and Myers, C. R. (2016). Multiscale metabolic modeling of C4 plants: connecting nonlinear genome-scale models to leaf-scale metabolism in developing maize leaves. PLoS One 11:e0151722. doi: 10.1371/journal.pone.0151722
Caddick, M. X., Greenland, A. J., Krause, K.-P., Qu, N., Riddell, K. V., Salter, M. G., et al. (1998). An ethanol inducible gene switch for plants used to manipulate carbon metabolism. Nature biotechnology 16, 177–180. doi: 10.1038/nbt0298-177
Carpita, N. C., and McCann, M. C. (2008). Maize and sorghum: genetic resources for bioenergy grasses. Trends Plant Sci. 13, 415–420. doi: 10.1016/j.tplants.2008.06.002
Chapman, K. D., Dyer, J. M., and Mullen, R. T. (2013). Commentary: why don’t plant leaves get fat? Plant Sci. 207, 128–134. doi: 10.1016/j.plantsci.2013.03.003
Cheng, F., Wu, J., Fang, L., and Wang, X. (2012). Syntenic gene analysis between brassica rapa and other brassicaceae species. Front. Plant Sci. 3:198. doi: 10.3389/fpls.2012.00198
Cheung, C. M., Poolman, M. G., Fell, D. A., Ratcliffe, R. G., and Sweetlove, L. J. (2014). A diel flux balance model captures interactions between light and dark metabolism during day-night cycles in C3 and crassulacean acid metabolism leaves. Plant Physiol. 165, 917–929. doi: 10.1104/pp.113.234468
Cheung, C. M., Williams, T. C., Poolman, M. G., Fell, D. A., Ratcliffe, R. G., and Sweetlove, L. J. (2013). A method for accounting for maintenance costs in flux balance analysis improves the prediction of plant cell metabolic phenotypes under stress conditions. Plant J. 75, 1050–1061. doi: 10.1111/tpj.12252
Chu, K., Jenkins, L. M., Bailey, S. R., Kambhampati, S., Koley, S., Foley, K., et al. (2020). Shifting carbon flux from non-transient starch to lipid allows oil accumulation in transgenic tobacco leaves. BioRxiv [preprint]. doi: 10.1101/2020.05.15.098632
Chu, K. L., Koley, S., Jenkins, L. M., Bailey, S. R., Kambhampati, S., Foley, K., et al. (2022). Metabolic flux analysis of the non-transitory starch tradeoff for lipid production in mature tobacco leaves. Metab. Eng. 69, 231–248. doi: 10.1016/j.ymben.2021.12.003
Cooney, L. J., Beechey-Gradwell, Z., Winichayakul, S., Richardson, K. A., Crowther, T., Anderson, P., et al. (2021). Changes in leaf-level nitrogen partitioning and mesophyll conductance deliver increased photosynthesis for Lolium perenne leaves engineered to accumulate lipid carbon sinks. Front. Plant Sci. 12:330. doi: 10.3389/fpls.2021.641822
de Oliveira Dal’Molin, C. G., Quek, L.-E., Palfreyman, R. W., Brumbley, S. M., and Nielsen, L. K. (2010). C4GEM, a genome-scale metabolic model to study C4 plant metabolism. Plant Physiol. 154, 1871–1885. doi: 10.1104/pp.110.166488
de Oliveira Dal’Molin, C. G., Quek, L.-E., Saa, P. A., Palfreyman, R., and Nielsen, L. K. (2018). From reconstruction to c4 metabolic engineering: a case study for overproduction of polyhydroxybutyrate in bioenergy grasses. Plant Sci. 273, 50–60. doi: 10.1016/j.plantsci.2018.03.027
Dohleman, F. G., and Long, S. P. (2009). More productive than maize in the Midwest: how does Miscanthus do it? Plant physiol. 150, 2104–2115.
Dohleman, F., Heaton, E., Leakey, A., and Long, S. P. (2009). Does greater leaf-level photosynthesis explain the larger solar energy conversion efficiency of miscanthus relative to switchgrass? Plant Cell Environ. 32, 1525–1537. doi: 10.1111/j.1365-3040.2009.02017.x
Döring, F., Streubel, M., Bräutigam, A., and Gowik, U. (2016). Most photorespiratory genes are preferentially expressed in the bundle sheath cells of the C4 grass sorghum bicolor. J. Exp. Bot. 67, 3053–3064. doi: 10.1093/jxb/erw041
Durrett, T. P., Benning, C., and Ohlrogge, J. (2008). Plant triacylglycerols as feedstocks for the production of biofuels. Plant J. 54, 593–607. doi: 10.1111/j.1365-313X.2008.03442.x
Ehleringer, J., and Pearcy, R. W. (1983). Variation in quantum yield for CO2 uptake among C3 and C4 plants. Plant Physiol. 73, 555–559.
Gomes de Oliveira Dal’Molin, C., Quek, L.-E., Saa, P. A., and Nielsen, L. K. (2015). A multi-tissue genome-scale metabolic modeling framework for the analysis of whole plant systems. Front. Plant Sci. 6:4. doi: 10.3389/fpls.2015.00004
Gonzalez-Thuillier, I., Venegas-Caleron, M., Garces, R., von Wettstein-Knowles, P., and Martinez-Force, E. (2015). Sunflower (helianthus annuus) fatty acid synthase complex: enoyl-[acyl carrier protein]-reductase genes. Planta 241, 43–56. doi: 10.1007/s00425-014-2162-7
Grafahrend-Belau, E., Junker, A., Eschenröder, A., Müller, J., Schreiber, F., and Junker, B. H. (2013). Multiscale metabolic modeling: dynamic flux balance analysis on a whole-plant scale. Plant Physiol. 163, 637–647. doi: 10.1104/pp.113.224006
Graham, I. A. (2008). Seed storage oil mobilization. Annu. Rev. Plant Biol. 59, 115–142. doi: 10.1146/annurev.arplant.59.032607.092938
Gutierrez, M., Gracen, V., and Edwards, G. (1974). Biochemical and cytological relationships in C 4 plants. Planta 119, 279–300. doi: 10.1007/BF00388331
Hatch, M. D. (1987). C4 photosynthesis: a unique elend of modified biochemistry, anatomy and ultrastructure. Biochim. Et Biophys. Acta Rev. Bioenergetics 895, 81–106. doi: 10.1016/s0304-4173(87)80009-5
Hay, J., and Schwender, J. (2011). Metabolic network reconstruction and flux variability analysis of storage synthesis in developing oilseed rape (Brassica napus L.) embryos. Plant J. 67, 526–541. doi: 10.1111/j.1365-313X.2011.04613.x
Hay, J. O., Shi, H., Heinzel, N., Hebbelmann, I., Rolletschek, H., and Schwender, J. (2014). Integration of a constraint-based metabolic model of Brassica napus developing seeds with 13C-metabolic flux analysis. Front. Plant Sci. 5:724. doi: 10.3389/fpls.2014.00724
Heirendt, L., Arreckx, S., Pfau, T., Mendoza, S. N., Richelle, A., Heinken, A., et al. (2019). Creation and analysis of biochemical constraint-based models using the COBRA toolbox v. 3.0. Nat. Protocols 14, 639–702. doi: 10.1038/s41596-018-0098-2
Hodges, T., Kanemasu, E. T., and Teare, I. D. (1979). Modeling dry matter accumulation and yield of grain sorghum. Can. J. Plant Sci. 59, 803–818.
Huang, H., Long, S. P., Clemente, T. E., and Singh, V. (2016). Technoeconomic analysis of biodiesel and ethanol production from lipid-producing sugarcane and sweet sorghum. Industr. Biotechnol. 12, 357–365.
Jenkins, C. L., Furbank, R. T., and Hatch, M. D. (1989). Mechanism of C4 photosynthesis: a model describing the inorganic carbon pool in bundle sheath cells. Plant Physiol. 91, 1372–1381. doi: 10.1104/pp.91.4.1372
Joyard, J., Ferro, M., Masselon, C., Seigneurin-Berny, D., Salvi, D., Garin, J., et al. (2010). Chloroplast proteomics highlights the subcellular compartmentation of lipid metabolism. Prog. Lipid Res. 49, 128–158. doi: 10.1016/j.plipres.2009.10.003
Kalt-Torres, W., Kerr, P. S., Usuda, H., and Huber, S. C. (1987). Diurnal changes in maize leaf photosynthesis : I. carbon exchange rate, assimilate export rate, and enzyme activities. Plant Physiol. 83, 283–288. doi: 10.1104/pp.83.2.283
Kim, C., Wang, X., Lee, T.-H., Jakob, K., Lee, G.-J., and Paterson, A. H. (2014). Comparative analysis of miscanthus and saccharum reveals a shared whole-genome duplication but different evolutionary fates. Plant Cell 26, 2420–2429. doi: 10.1105/tpc.114.125583
Kim, H. U., Lee, K. R., Jung, S. J., Shin, H. A., Go, Y. S., Suh, M. C., et al. (2015). Senescence-inducible LEC2 enhances triacylglycerol accumulation in leaves without negatively affecting plant growth. Plant Biotechnol. J. 13, 1346–1359. doi: 10.1111/pbi.12354
Kramer, D. M., and Evans, J. R. (2011). The importance of energy balance in improving photosynthetic productivity. Plant Physiol. 155, 70–78. doi: 10.1104/pp.110.166652
Lee, K.-R., Kim, E.-H., Kim, K.-H., Park, J.-S., and Kim, H. U. (2017). Vegetable oil production in vegetative plant tissues. Plant Biotechnol. Rep. 11, 385–395.
Li, S., Moller, C. A., Mitchell, N. G., Lee, D., and Ainsworth, E. A. (2021). Bioenergy sorghum maintains photosynthetic capacity in elevated ozone concentrations. Plant Cell Environ. 44, 729–746. doi: 10.1111/pce.13962
Liang, X. G., Gao, Z., Zhang, L., Shen, S., Zhao, X., Liu, Y. P., et al. (2019). Seasonal and diurnal patterns of non-structural carbohydrates in source and sink tissues in field maize. BMC Plant Biol. 19:508. doi: 10.1186/s12870-019-2068-4
Li-Beisson, Y., Shorrosh, B., Beisson, F., Andersson, M. X., Arondel, V., Bates, P. D., et al. (2013). Acyl-lipid metabolism. Arabidopsis Book Am. Soc. Plant Biol. 11:e0161.
Lunn, J. E., and Furbank, R. T. (1997). Localisation of sucrose-phosphate synthase and starch in leaves of C 4 plants. Planta 202, 106–111. doi: 10.1007/s004250050108
Marchieve, C., Nikovics, K., To, A., Lepiniec, L., and Baud, S. (2014). Transcriptional regulation of fatty acid production in higher plants: molecular bases and biotechnological outcomes. Eur. J. Lipid Sci. Technol. 116, 1332–1343.
McCormick, R. F., Truong, S. K., Sreedasyam, A., Jenkins, J., Shu, S., Sims, D., et al. (2018). The Sorghum bicolor reference genome: improved assembly, gene annotations, a transcriptome atlas, and signatures of genome organization. Plant J. 93, 338–354. doi: 10.1111/tpj.13781
Mitchell, M. C., Pritchard, J., Okada, S., Zhang, J., Venables, I., Vanhercke, T., et al. (2020). Increasing growth and yield by altering carbon metabolism in a transgenic leaf oil crop. Plant Biotechnol. J. 18, 2042–2052. doi: 10.1111/pbi.13363
Murphy, D. J., and Leech, R. M. (1977). Lipid biosynthesis from [14 C] bicarbonate,[2-14C] pyruvate and [1-14 C] acetate during photosynthesis by isolated spinach chloroplasts. FEBS Lett. 77, 164–168%@ 0014–5793.
Ning, P., Peng, Y., and Fritschi, F. B. (2018). Carbohydrate dynamics in maize leaves and developing ears in response to nitrogen application. Agronomy 8:302.
Noctor, G., and Foyer, C. H. (1998). A re-evaluation of the ATP: NADPH budget during C3 photosynthesis: a contribution from nitrate assimilation and its associated respiratory activity? J. Exp. Bot. 49, 1895–1908.
Ohlrogge, J., and Chapman, K. (2011). The seeds of green energy: expanding the contribution of plant oils as biofuels. Biochemist 33, 34–38.
Parajuli, S., Kannan, B., Karan, R., Sanahuja, G., Liu, H., Garcia-Ruiz, E., et al. (2020). Towards oilcane: engineering hyperaccumulation of triacylglycerol into sugarcane stems. GCB Bio. 12, 476–490%@ 1757–1693.
Peng, S., Krieg, D. R., and Girma, F. S. (1991). Leaf photosynthetic rate is correlated with biomass and grain production in grain sorghum lines. Photosynthesis Res. 28, 1–7. doi: 10.1007/BF00027171
Peterhansel, C., Horst, I., Niessen, M., Blume, C., Kebeish, R., Kürkcüoglu, S., et al. (2010). “Photorespiration. Arabidopsis 8:e0130. doi: 10.1199/tab.0130
Price, H. J., Dillon, S. L., Hodnett, G., Rooney, W. L., Ross, L., and Johnston, J. S. (2005). Genome evolution in the genus sorghum (poaceae). Ann. Bot. 95, 219–227. doi: 10.1093/aob/mci015
Rafferty, J. B., Simon, J. W., Stuitje, A. R., Slabas, A. R., Fawcett, T., and Rice, D. W. (1994). Crystallization of the NADH-specific enoyl acyl carrier protein reductase from Brassica napus. J. Mol. Biol. 237, 240–242. doi: 10.1006/jmbi.1994.1225
Raines, C. A. (2003). The calvin cycle revisited. Photosynthesis Res. 75, 1–10. doi: 10.1023/A:1022421515027
Roughan, P. G., and Ohlrogge, J. B. (1996). Evidence that isolated chloroplasts contain an integrated lipid-synthesizing assembly that channels acetate into long-chain fatty acids. Plant Physiol. 110, 1239–1247. doi: 10.1104/pp.110.4.1239
Schmidt-Rohr, K. (2015). Why combustions are always exothermic, yielding about 418 kJ per mole of O2. J. Chem. Educ. 92, 2094–2099. doi: 10.1021/acs.jchemed.5b00333
Schnable, P. S., Ware, D., Fulton, R. S., Stein, J. C., Wei, F., Pasternak, S., et al. (2009). The B73 maize genome: complexity, diversity, and dynamics. Science 326, 1112–1115. doi: 10.1126/science.1178534
Schuster, S., Dandekar, T., and Fell, D. A. (1999). Detection of elementary flux modes in biochemical networks: a promising tool for pathway analysis and metabolic engineering. Trends Biotechnol. 17, 53–60. doi: 10.1016/s0167-7799(98)01290-6
Schuster, S., Fell, D. A., and Dandekar, T. (2000). A general definition of metabolic pathways useful for systematic organization and analysis of complex metabolic networks. Nat. Biotechnol. 18, 326–332. doi: 10.1038/73786
Schwender, J., and Hay, J. O. (2012). Predictive modeling of biomass component tradeoffs in Brassica napus developing oilseeds based on in silico manipulation of storage metabolism. Plant Physiol. 160, 1218–1236. doi: 10.1104/pp.112.203927
Sharkey, T. D., and Weise, S. E. (2012). “Autotrophic carbon dioxide fixation,” in Photosynthesis Advances in Photosynthesis and Respiration, eds J. Eaton-Rye, B. Tripathy, and T. Sharkey (Springer), 651–674.
Sharkey, T. D., and Weise, S. E. (2016). The glucose 6-phosphate shunt around the calvin-benson cycle. J. Exp. Bot. 67, 4067–4077.
Shaw, R., and Cheung, C. (2018). A dynamic multi-tissue flux balance model captures carbon and nitrogen metabolism and optimal resource partitioning during arabidopsis growth. Front. Plant Sci. 9:884. doi: 10.3389/fpls.2018.00884
Shih, P. M., Liang, Y., and Loqué, D. (2016). Biotechnology and synthetic biology approaches for metabolic engineering of bioenergy crops. Plant J. 87, 103–117. doi: 10.1111/tpj.13176
Simons, M., Saha, R., Amiour, N., Kumar, A., Guillard, L., Clément, G., et al. (2014). Assessing the metabolic impact of nitrogen availability using a compartmentalized maize leaf genome-scale model. Plant Physiol. 166, 1659–1674. doi: 10.1104/pp.114.245787
Slabas, A. R., Sidebottom, C. M., Hellyer, A., Kessell, R. M. J., and Tombs, M. P. (1986). Induction, purification and characterization of NADH-specific enoyl acyl carrier protein reductase from developing seeds of oil seed rape (Brassica napus). Biochim. Et Biophys. Acta Lipids Lipid Metab. 877, 271–280. doi: 10.1016/0005-2760(86)90304-8
Stitt, M., Huber, S., and Kerr, P. (1987). “Control of photosynthetic sucrose formation,” in Photosynthesis, eds M. D. Hatch and Boardman, N. K. (Amsterdam: Elsevier), 327–409. doi: 10.1016/b978-0-12-675410-0.50012-9
Sweetlove, L. J., Williams, T. C., Cheung, C. M., and Ratcliffe, R. G. (2013). Modelling metabolic CO2 evolution–a fresh perspective on respiration. Plant Cell Environ. 36, 1631–1640. doi: 10.1111/pce.12105
Swigonova, Z., Lai, J., Ma, J., Ramakrishna, W., Llaca, V., Bennetzen, J. L., et al. (2004). On the tetraploid origin of the maize genome. Int. J. Genom. 5, 281–284. doi: 10.1002/cfg.395
Tai, S. S., Chen, M. C., Peng, C. C., and Tzen, J. T. (2002). Gene family of oleosin isoforms and their structural stabilization in sesame seed oil bodies. Biosci. Biotechnol. Biochem. 66, 2146–2153. doi: 10.1271/bbb.66.2146
Ting, J. T., Lee, K., Ratnayake, C., Platt, K. A., Balsamo, R. A., and Huang, A. H. (1996). Oleosin genes in maize kernels having diverse oil contents are constitutively expressed independent of oil contents. Planta 199, 158–165. doi: 10.1007/BF00196892
Troncoso-Ponce, M. A., Cao, X., Yang, Z., and Ohlrogge, J. B. (2013). Lipid turnover during senescence. Plant Sci. 205-206, 13–19. doi: 10.1016/j.plantsci.2013.01.004
Vanhercke, T., Belide, S., Taylor, M. C., El Tahchy, A., Okada, S., Rolland, V., et al. (2019a). Up-regulation of lipid biosynthesis increases the oil content in leaves of Sorghum bicolor. Plant Biotechnol. J. 17, 220–232. doi: 10.1111/pbi.12959
Vanhercke, T., Dyer, J. M., Mullen, R. T., Kilaru, A., Rahman, M. M., Petrie, J. R., et al. (2019b). Metabolic engineering for enhanced oil in biomass. Prog. Lipid Res. 74, 103–129. doi: 10.1016/j.plipres.2019.02.002
Vanhercke, T., Divi, U. K., El Tahchy, A., Liu, Q., Mitchell, M., Taylor, M. C., et al. (2017). Step changes in leaf oil accumulation via iterative metabolic engineering. Metabolic Eng. 39, 237–246. doi: 10.1016/j.ymben.2016.12.007
Vanhercke, T., El Tahchy, A., Liu, Q., Zhou, X. R., Shrestha, P., Divi, U. K., et al. (2014). Metabolic engineering of biomass for high energy density: oilseed-like triacylglycerol yields from plant leaves. Plant Biotechnol. J. 12, 231–239. doi: 10.1111/pbi.12131
Varma, A., and Palsson, B. O. (1994). Stoichiometric flux balance models quantitatively predict growth and metabolic by-product secretion in wild-type Escherichia coli W3110. Appl. Environ. Microbiol. 60, 3724–3731. doi: 10.1128/aem.60.10.3724-3731.1994
von Caemmerer, S., and Furbank, R. T. (2003). The C 4 pathway: an efficient CO 2 pump. Photosyn. Res. 77:191. doi: 10.1023/A:1025830019591
Walker, B. J., Kramer, D. M., Fisher, N., and Fu, X. (2020). Flexibility in the energy balancing network of photosynthesis enables safe operation under changing environmental conditions. Plants 9:301. doi: 10.3390/plants9030301
Walker, R. P., Acheson, R. M., Técsi, L. I., and Leegood, R. C. (1997). Phosphoenolpyruvate carboxykinase in C4 plants: its role and regulation. Funct. Plant Biol. 24, 459–468.
Wan, S., Truong-Trieu, V. M., Ward, T., Whalen, J. K., and Altosaar, I. (2017). Advances in the use of genetically modified plant biomass for biodiesel generation. Bio. Bioprod. Biorefining 11, 749–764.
Wang, X., Shi, Y., Wang, Q., and Li, Y. (2019). Dorsoventral regulation of photosynthetic functions related to morphological and anatomical structures in field-grown sorghum. Photosynthetica 57, 607–616.
Wang, Y., Bräutigam, A., Weber, A. P., and Zhu, X.-G. (2014a). Three distinct biochemical subtypes of C4 photosynthesis? A modelling analysis. J. Exp. Bot. 65, 3567–3578. doi: 10.1093/jxb/eru058
Wang, Y., Long, S. P., and Zhu, X.-G. (2014b). Elements required for an efficient NADP-malic enzyme type C4 photosynthesis. Plant Physiol. 164, 2231–2246. doi: 10.1104/pp.113.230284
Weijde, T. V. D., Alvim Kamei, C. L., Torres, A. F., Vermerris, W., Dolstra, O., Visser, R. G. F., et al. (2013). The potential of C4 grasses for cellulosic biofuel production. Front. Plant Sci. 4:107. doi: 10.3389/fpls.2013.00107
Wilkinson, T. L., and Douglas, A. E. (2003). Phloem amino acids and the host plant range of the polyphagous aphid, aphis fabae. Entomol. Exp. Appl. 106, 103–113.
Winichayakul, S., Scott, R. W., Roldan, M., Hatier, J.-H. B., Livingston, S., Cookson, R., et al. (2013). In vivo packaging of triacylglycerols enhances arabidopsis leaf biomass and energy density. Plant Physiol. 162, 626–639. doi: 10.1104/pp.113.216820
Winter, H., Lohaus, G., and Heldt, H. W. (1992). Phloem transport of amino acids in relation to their cytosolic levels in barley leaves. Plant Physiol. 99, 996–1004. doi: 10.1104/pp.99.3.996
Xu, C., and Shanklin, J. (2016). Triacylglycerol metabolism, function, and accumulation in plant vegetative tissues. Ann. Rev. Plant Biol. 67, 179–206. doi: 10.1146/annurev-arplant-043015-111641
Xu, X. Y., Akbar, S., Shrestha, P., Venugoban, L., Devilla, R., Hussain, D., et al. (2020). A synergistic genetic engineering strategy induced triacylglycerol accumulation in potato (Solanum tuberosum) leaf. Front. Plant Sci. 11:215. doi: 10.3389/fpls.2020.00215
Yin, X., and Struik, P. C. (2018). The energy budget in C4 photosynthesis: insights from a cell-type-specific electron transport model. New Phytol. 218, 986–998. doi: 10.1111/nph.15051
Zhao, D., Reddy, K. R., Kakani, V. G., and Reddy, V. (2005). Nitrogen deficiency effects on plant growth, leaf photosynthesis, and hyperspectral reflectance properties of sorghum. Eur. J. Agron. 22, 391–403. doi: 10.1016/j.eja.2004.06.005
Keywords: bioenergy grasses, metabolic reconstruction, C4 photosynthesis, energy balance, plant lipids, triacylglycerol, constraint-based analysis, Sorghum bicolor
Citation: Clark TJ and Schwender J (2022) Elucidation of Triacylglycerol Overproduction in the C4 Bioenergy Crop Sorghum bicolor by Constraint-Based Analysis. Front. Plant Sci. 13:787265. doi: 10.3389/fpls.2022.787265
Received: 30 September 2021; Accepted: 24 January 2022;
Published: 17 February 2022.
Edited by:
Maria F. Drincovich, Centro de Estudios Fotosintéticos y Bioquímicos (CEFOBI), ArgentinaReviewed by:
Thomas Christopher Rhys Williams, Universidade Federal de Viçosa, BrazilShoko Okada, Commonwealth Scientific and Industrial Research Organisation (CSIRO), Australia
Copyright © 2022 Clark and Schwender. This is an open-access article distributed under the terms of the Creative Commons Attribution License (CC BY). The use, distribution or reproduction in other forums is permitted, provided the original author(s) and the copyright owner(s) are credited and that the original publication in this journal is cited, in accordance with accepted academic practice. No use, distribution or reproduction is permitted which does not comply with these terms.
*Correspondence: Jorg Schwender, schwend@bnl.gov