 Laxmi S. Mishra
 Sanatkumar Mishra
 Daniel F. Caddell
 Devin Coleman-Derr3,4
 Christiane Funk
- 1Department of Chemistry, Umeå University, Umeå, Sweden
- 2Umeå Plant Science Center, Department of Forest Genetics and Plant Physiology, Swedish University of Agricultural Sciences, Umeå, Sweden
- 3Plant Gene Expression Center, US Department of Agriculture-Agricultural Research Service, Albany, CA, United States
- 4Department of Plant and Microbial Biology, University of California, Berkeley, Berkeley, CA, United States
While drought severely affects plant growth and crop production, the molecular mechanisms of the drought response of plants remain unclear. In this study, we demonstrated for the first time the effect of the pseudo-protease AtFtsHi3 of Arabidopsis thaliana on overall plant growth and in drought tolerance. An AtFTSHi3 knock-down mutant [ftshi3-1(kd)] displayed a pale-green phenotype with lower photosynthetic efficiency and Darwinian fitness compared to wild type (Wt). An observed delay in seed germination of ftshi3-1(kd) was attributed to overaccumulation of abscisic acid (ABA); ftshi3-1(kd) seedlings showed partial sensitivity to exogenous ABA. Being exposed to similar severity of soil drying, ftshi3-1(kd) was drought-tolerant up to 20 days after the last irrigation, while wild type plants wilted after 12 days. Leaves of ftshi3-1(kd) contained reduced stomata size, density, and a smaller stomatic aperture. During drought stress, ftshi3-1(kd) showed lowered stomatal conductance, increased intrinsic water-use efficiency (WUEi), and slower stress acclimation. Expression levels of ABA-responsive genes were higher in leaves of ftshi3-1(kd) than Wt; DREB1A, but not DREB2A, was significantly upregulated during drought. However, although ftshi3-1(kd) displayed a drought-tolerant phenotype in aboveground tissue, the root-associated bacterial community responded to drought.
Introduction
Drought is an environmental stress that can negatively impact plant productivity and crop yields (Gupta et al., 2020). Several classes of proteases are involved in the acclimation of plants to drought (reviewed by Vaseva et al., 2011; Fanourakis et al., 2020). For example, the senescence-associated subtilisin protease (SASP) is a key regulator in abscisic acid (ABA) signaling and drought tolerance (Acharya et al., 2013; Wang et al., 2018b). Cysteine proteinases belonging to the vacuolar processing enzymes (VPEs; reviewed by Hatsugai et al., 2015; Vorster et al., 2019) participate in controlling stomatal pore aperture during both pathogen attack and drought stress (Albertini et al., 2014; Lu et al., 2016). Overexpression of the S8 subtilisin-like serine protease (Berger and Altmann, 2000) correlates with decreased stomatal density, enhanced water-use efficiency (WUEi), and drought tolerance (Yoo et al., 2010; Liu et al., 2015; Morales-Navarro et al., 2018). The molecular mechanisms underpinning protease involvement in responses to water deficit remain unclear.
The membrane-embedded filamentation temperature-sensitive H (FtsH) protease family members play an essential role in the degradation of both soluble and membrane proteins and are extensively studied in bacteria, chloroplasts, and mitochondria (Smakowska et al., 2014; Nishimura et al., 2016; Bittner et al., 2017). Annotated members of the FtsH family contain a putative AAA ATPase domain (IPR003593), an ATPase AAA core (IPR003959), and an M41 peptidase domain (IPR000642; https://Arabidopsis.org). In addition to the proteolytically active FtsH proteases, pseudo-proteases, termed FtsHi (i for inactive Sokolenko et al., 2002), have been detected in the genomes of plants. Arabidopsis thaliana encodes five FtsHi enzymes, of which the consensus sequence HEXXH present in the Zn+-binding M41 metalloprotease domain is either altered (FtsHi1/2/4/5) or absent (FtsHi3; Wagner et al., 2012). Homozygous mutants deficient in FtsHi1, 2, 4, or 5 are seed lethal (Kadirjan-Kalbach et al., 2012; Lu et al., 2014; Wang et al., 2018c; Mishra et al., 2019). “Weak” point mutations or heterozygous FTSHi mutants display a pale-seedling phenotype, the plants have smaller rosette sizes throughout their life span (Kadirjan-Kalbach et al., 2012; Lu et al., 2014) and often contain variegated leaves (Wang et al., 2018c). Homozygous ftshi3 is not embryo lethal, but knockdown plants containing about 10% FtsHi3 of wild type (Wt) level display a pale seedling phenotype (Kikuchi et al., 2018; Mishra et al., 2019). Seeds from field-grown ftshi3-2 plants germinated with a significant delay compared to the Wt control (Mishra et al., 2019).
The chloroplast envelope-located FtsHi1, 2, 4, and 5 were found to form a complex with FtsH12 and NAD-dependent malate dehydrogenase (pdNAD-MDH), which functions as a motor for protein translocation into the chloroplast (Kikuchi et al., 2018; Schreier et al., 2018). Even Ycf2 might be part of this complex (Kikuchi et al., 2018). The fifths pseudo-protease, FtsHi3, was instead detected in a separate 1-MD complex (Kikuchi et al., 2018); its function and the identity of the other complex components remain unclear.
In this study, we describe an Arabidopsis ftshi3 mutant that shows a drought-tolerant phenotype above ground but accumulates drought-specific root-associated bacterial communities below ground. Unlike the previously investigated FTSHi3 knockdown lines ftshi3-2 (GK_723C06) and ftshi3 with residual FTSHi3 expression (Kikuchi et al., 2018; Mishra et al., 2019), the knock-down mutant ftshi3-1(kd; GK-555D09-021662) had fully reduced transcription of FTSHi3 and displayed a pale-green phenotype throughout its life span. Characterizing this mutant in the field and controlled conditions, we were able to show that the absence of FtsHi3 impacts leaf stomatal density, lowered stomatal conductance, and increased intrinsic WUEi. The mutant expressed higher levels of the DREB1A in watered and drought conditions, but DREB2A only in watered conditions. Therefore, its drought-tolerant phenotype was attributed to an ABA-independent pathway.
Materials and Methods
Plant Material and Growth Conditions
Arabidopsis thaliana ecotype Columbia-0 (wild type, Wt) and ftshi3-1 (GabiKat-555D09-021662; Kleinboelting et al., 2012) transfer DNA (T-DNA) mutant seeds were obtained from the Nottingham Arabidopsis Stock Center (NASC). T-DNA insertion was confirmed by PCR and sequencing-based methods. Primers used for genotyping and sequencing are listed in Supplementary Table S1.
Arabidopsis Wt and mutant seeds were sterilized with 10% NaOCl, washed four times with sterile water, and then stratified for 2 days at 4°C. The seeds were selected on full-strength MS agar (Murashige and Skoog, 1962), supplemented with 1% sucrose and 75 μg/L sulfadiazine. After growing on plates for 12 days post-germination, the plants were transferred to soil. Stress treatments with mannitol or ABA were performed on agar plates 7 days post-germination. Seedlings were moved with sterile forceps, allowed to grow in the presence of 200 mM mannitol with 1 or 5 μM ABA for 7 days, and collected to determine their dry weight. Other stress experiments were performed as described by Mishra et al. (2019).
Genotyping and Whole-Genome Sequencing
To confirm the ftshi3-1(kd) mutation, high-quality genomic DNA was extracted from the T-DNA insertion lines (Healey et al., 2014; O’malley et al., 2015) and submitted to the BGI European Genome Center for whole-genome sequencing (WGS) Plant DNA sequencing. Next generation sequencing (NGS) data pre-processing was performed at the Umeå Plant Science bioinformatics facility, Sweden, following a standard pipeline.
The sequencing was performed on an Illumina HiSeq4000 sequencer for 150 cycles in paired-end mode. The quality of the reads was assessed using FastQC1, v0.11.4. The data were deemed excellent, and neither no quality-based trimming nor adapter removal was necessary. The TAIR 10 version of the Arabidopsis genome was retrieved from the TAIR resource (Berardini et al., 2015), and the sequence of the tDNA pAC161 plasmid was added to that reference. BWA version 0.7.17 (Li, 2013) was used to index the extended genome reference and align the paired-end reads. Adding the T-DNA plastid sequence allowed for confirming its insertion position and uniqueness. Subsequently, GATK version 4.0.8.1 (Van Der Auwera et al., 2013) was used to process the data following the guidelines of GATK, namely applying the following tools in series: BaseRecalibrator, ApplyBQSR, BaseRecalibrator, AnalyzeCovariates, and HaplotypeCaller. All tools were used with their default settings apart from enabling parallel processing whenever possible. Downstream analyses were conducted in (R Core Team, 2020), version 3.5.1 using Bioconductor (Huber et al., 2015) core and the VariantAnnotation (Obenchain et al., 2014) packages. All scripts are available from the GitHub repository: https://github.com/LSmishra/FtsHi3. The data are available from the European Nucleotide Archive, www.ebi.ac.uk/ena, under the accession ID: PRJNA669866.
Plasmid Construction and Plant Transformation
To construct complementation and knockdown lines, genomic DNA fragments were amplified from A. thaliana by Phusion ®(Thermo Scientific, United States) proofreading polymerase. Knockdown FTSHi3 lines [microRNA (miRNA)-a and miRNA-b] were generated via micro-RNA constructs according to WMD3 – Web MicroRNA Designer (http://wmd3.weigelworld.org/cgi-bin/webapp.cgi; Schwab et al., 2006), with specific primers designed for ‘miRNA-a and miRNA-b (I/II/III/IV miR–s/−a/*s/*a’; Supplementary Table S1), targeting two independent regions of FTSHi3 (AT3G02450). PCR fragments were cloned into the gateway-compatible plasmid RS300 (MIR319a). The construct was recombined into the estrogen-inducible vector pMDC7 for silencing FTSHi3. Wt plants were transformed with these constructs, and T1 seedlings were selected based on their sensitivity to β-estradiol and hygromycin-B resistance. Young seedlings were selected by plating them on MS agar plates containing β-estradiol, whereas, in older plants, the entire rosettes were sprayed with a β-estradiol solution every second day. T2 plants were used for further analysis. A construct containing the amplified FTSHi3 promoter sequence (predicted according to Knudsen, 1999) was generated using the primers “ftshi3 Promoter Forward” and “ftshi3 Reverse for HA-line” (Supplementary Table S1). The pAtftshi3::ftshi3 genomic DNA was cloned into a pENTR/D-TOPO vector and transferred into the destination vector, pGWB15, resulting in a 3xHA tagged gene product. The binary plasmids were transformed into electro-competent Agrobacterium tumefaciens [GV3101::pMP90 (pTiC58DT-DNA); Hellens et al., 2000]. The non-segregating T2 homozygous ftshi3-1 T-DNA line of the GABI-KAT collection was transformed as described by Clough and Bent (1998). The construct in the T1 and T2 generation was confirmed by germinating transgenic seeds on 35 mg/ml hygromycin-B selecting MS agar plates. The experiments were performed on T3 generation seeds.
Field Experiments and Darwinian Fitness Analysis
Field experiments, including Darwinian fitness analysis, were performed in Umeå, Sweden (63°49'07.2"N 20°18'45.0"E) during the weeks 26–36 in 2017 as described in Frenkel et al. (2008). After germinating the seeds on plates, the seedlings were grown at long-day conditions (LD, 21°C, 16-h light/8-h dark) in the greenhouse for 12–14 days. The plants were moved in the field, acclimatized for 24 h, and then grown in semi-natural conditions in the field. After 11 weeks in the field, the plants were moved indoors to dry their seeds and siliques for Darwinian fitness analysis (Mishra et al., 2019). SPSS software was used to perform statistical analyses. The values of p were calculated with an ANOVA and a least significant difference (LSD) post hoc test and Student’s t test. Weather data were obtained from TFE Väder – info (umu.se) maintained by the Department of Applied Physics and Technology, Umeå University, Sweden. The data were collected at a station 650 m from the actual field site (Mishra et al., 2019).
Drought Phenotype Analysis
Water-deficit stress was applied on plants grown on the soil at a relative humidity of 50% and 150 μmol photons m−2 s−1 for approximately 4 weeks before treatment. Plants were exposed to short-day (SD) conditions (8/16 h photoperiod, 22/18°C) or LD conditions (16/8 h photoperiod, 22/18°C).
Severe drought treatment was induced by stopping the irrigation when plants were 4 weeks old until the genotypes showed drought effects compared to the well-watered controls. These controls were watered daily with 550 ml water per tray (15 pots/tray). The pot weight of samples and controls was determined by weighing plants and soil. After 20 days of severe drought, all genotypes were re-watered daily with 350 ml of water for 14 days, and the number of plants resuming their growth was counted. These experiments were performed three times with 10 biological replicates each.
Plant Growth Conditions During the Microbiome Experiment
Wild type, the T-DNA insertion line ftshi3-1 (Gabi Kat-555D09-021662), and lines expressing the pAtFtsHi3::AtFtsHi3::HA (complementation lines) were used to study the microbiome during watered and drought conditions. Surface sterilized seeds were plated on half MS agar media, vernalized at 4°C for 2–3 days, and then moved to a growth chamber exposing them to SD conditions (8/16 h photoperiod, 22/18°C and 120 μmol photons m−2 s−1) with a relative humidity of 70% for approximately 2 weeks. The 2-week-old seedlings were transferred to 5 cm square plastic plant pots with a soil mixture containing 10% field soil, 60% sunshine potting mix, and 30% vermiculite. Field soil had been collected from an agricultural field site located in Albany, California, United States (37.8864°N, 122.2982°W, Simmons et al., 2018). Plants were randomized by treatment, genotype, and replication, with five replicates per genotype and treatment. The plants were allowed to grow at SD conditions (8/16 h photoperiod, 22/18°C and 120 μmol photons m−2 s−1) and were regularly watered with 750 ml of water per tray (each containing 15 randomized pots). At a plant age of 4 weeks, the watered control trays received 850 ml of water, while plants exposed to drought treatment received 450 ml of water per tray for 2–3 weeks. Then, the roots were harvested for genomic DNA extraction and 16S sequencing. Microbiome sample collection and amplicon sequence data processing were performed as described by Mishra et al. (2020). Library preparation and amplicon sequence data processing were performed according to Simmons et al. (2018, 2020) and Xu et al. (2018). All raw reads are deposited in the NCBI Short Read Archive at accession PRJNA669866.
Microbiome Statistical Analyses
All 16S statistical analyses were performed in R v3.6.1 (R Core Team, 2013). Scripts and datasets can be found at https://github.com/colemanderr-lab/Mishra-2021. To account for differences in sequencing read depth across samples, the data per sample were normalized by dividing its reads per amplicon sequence variant (ASV) by the sum of usable reads, resulting in a table of relative abundance frequencies. All sample data were normalized to perform alpha diversity calculations to an even read depth of 17,716 ASVs per sample. The Shannon index was determined with the estimate_richness function in phyloseq v1.30.0 (Mcmurdie and Holmes, 2013), and significance was tested by ANOVA using the aov function in the R stats package. Canonical Analysis of Principal coordinates (CAP) of Bray-Curtis distance was performed using the ordinate function in phyloseq v1.30.0 (Mcmurdie and Holmes, 2013), and pairwise PERMANOVA determined sample type separation with 10,000 permutations using the adonis and calc_pairwise_permanovas functions in vegan v2.5.6 (Dixon, 2003) and mctoolsr v0.1.1.2 (Carini et al., 2016). Indicator species analysis (Dufrêne and Legendre, 1997) was performed after removing low abundance ASVs from the dataset (less than 25 reads and presence in less than 5% of samples) using the indval function in labdsv v2.0-1 (Roberts, 2007). Significant indicators were identified as ASVs with p < 0.05 and indcls > 0.05 following 10,000 permutations.
Phenotypic Characterization
Seedlings of Wt and the ftshi3-1 T-DNA insertion mutant were studied using a Leica MZ9.5.
Measurement of Chlorophyll and Chlorophyll Fluorescence Parameters
Chlorophyll a and b were extracted from 100 mg leaf material according to Porra et al. (1989).
Chlorophyll fluorescence was measured using a PAM-210 (Walz, Germany) on plants growing either in standard or stressed conditions. The measurements were performed on the seventh or eighth leaf per plant per genotype. A 1 s light saturation pulse of 3,000 μmol m−2 s−1 was used to record F0. About 8–10 independent biological replicates of 6-week-old whole plants were dark-adapted for 30 min, the maximum PSII quantum yield Fv/Fm was documented. The total measuring time was 120 s, with saturation pulses (width = 800 ms); data were collected every 10 s. The non-photochemical quenching (NPQ) capacity was determined, and a light intensity of increasing photosynthetically active radiation (PAR) up to a maximum of 2,000 μmol photons m−2 s−1 was applied for 20 min.
Transmission Electron Microscopy
Transmission electron microscopy (TEM) was used to study the chloroplast morphology of the first true leaf of 12-day-old seedlings of Wt, ftshi3-1(kd), and ftshi3-1 (Comp-1 and Comp-2). Sample preparation and microscopy were performed at the KBC electron microscopy platform.
Abscisic Acid Extraction and Quantification
Sample preparation and extraction for Solid Phase Extraction (SPE) and ultra-high performance liquid chromatography mass spectrometry (UHPLC-MS/MS) were performed as described by Haas et al. (2021).
RNA Extraction, Complementary DNA Synthesis, and Quantitative PCR
RNA extraction and complementary DNA (cDNA) synthesis were performed using Invitrogen™ RNAqueous Total RNA Isolation Kit. Isolated RNA was reverse-transcribed into cDNA using Thermo Scientific RevertAid First Strand cDNA Synthesis Kit. Real-Time Quantitative Reverse Transcription PCR (Quantitative RT-PCR) was performed using a Bio-Rad CFX96 thermocycler. The housing-keeping genes ubiquitin, tubulin, and actin (Czechowski et al., 2005) and gene-specific quantitative PCR (qPCR) primers are listed in Supplementary Table S1. The data were analyzed using the Bio-Rad CFX Manager 3.1 software. RNA was isolated from different tissues of 4-week-old plants (i.e., young flowers, leaves, buds, siliques, and stems) and roots of 2-week-old plants germinated on MS agar plates.
Measurements of Stomatal Density and Aperture in Response to ABA Treatment
Four-week-old rosette leaves were excised and peeled by the scotch tape method described by Lawrence II et al. (2018) and floated in ABA (10 μM) dissolved in DMSO for 1.5 h, while the control was floated in a buffer containing only 0.1% (v/v) DMSO. Microscopic images of stomata were taken on a Leica DMi8 at X40 magnification. For stomata density, five microscope fields per leaf were evaluated with five replicates per genotype. Stomatal aperture was measured using ImageJ software. Significance (value of p < 0.05, Student’s t test) of the 45 stomatal aperture measurements was calculated using SPSS software.
Leaf-Level Gas Exchange
A portable photosynthesis system (Li-6400xt, Li-Cor, Lincoln, NE, United States) was used to determine the photosynthesis rate (assimilation AN) and stomatal conductance (gs) as described by Tomeo and Rosenthal (2018). Assimilation AN was measured at a CO2 concentration (Cr) of 400μmol mol−1 air and PAR of 1,000μmol photons m−2s−1 on the seventh or eighth leaf of the rosette across six biological replicates per treatment per genotype. The leaf chamber temperature was standardized to 25°C, and the airflow to 250 μmols−1. Gas exchange parameters were determined during the daytime between 11 am and 4 pm. The ratio of AN/gs calculates the WUEi.
Results
Impact of FtsHi3 on Plant Development
To examine the role of AtFtsHi3 during growth and development, transcript levels of AtFTSHi3 were analyzed in different tissues of Wt Arabidopsis plants (Figure 1A). AtFtsHi3 was ubiquitously expressed in all analyzed tissues, i.e., young flowers, roots, leaves, buds, siliques, and stems. T-DNA mutant seeds were obtained from the NASC. Expression of FTSHi3 in the homozygous mutant ftshi3-1 (GK-555D09-021662) [hereafter ftshi3-1(kd)] was fully reduced (99.18% reduction; Figure 1B), while 10% residual amounts of FTSHi3 expression had been observed in ftshi3-2 (Mishra et al., 2019). Analyzing the Darwinian fitness of various FTSHi mutants, the homozygous ftshi3-2 mutant had displayed a pale-seedling phenotype, but in older plants, its phenotype did not differ from Wt (Mishra et al., 2019). The ftshi3-2 phenotype was similar to ftshi3 (FLAG_215F10; Kikuchi et al., 2018). Interestingly, the phenotype of ftshi3-1 (GK-555D09-021662) differed from ftshi3-2 (GK-723C06_025364) and ftshi3 (FLAG_215F10; a schematic diagram of the location of the various T-DNA insertions is shown in Supplementary Figure S1A). The mutant displayed not only a pale-seedling phenotype but also remained pale throughout its life span (Figure 1C); it further grew significantly smaller than Wt (Figures 1C,D). We observed significantly reduced root growth (around 30%; Figures 1E,F) and lower numbers of lateral roots in ftshi3-1(kd) compared to Wt (Figure 1G).
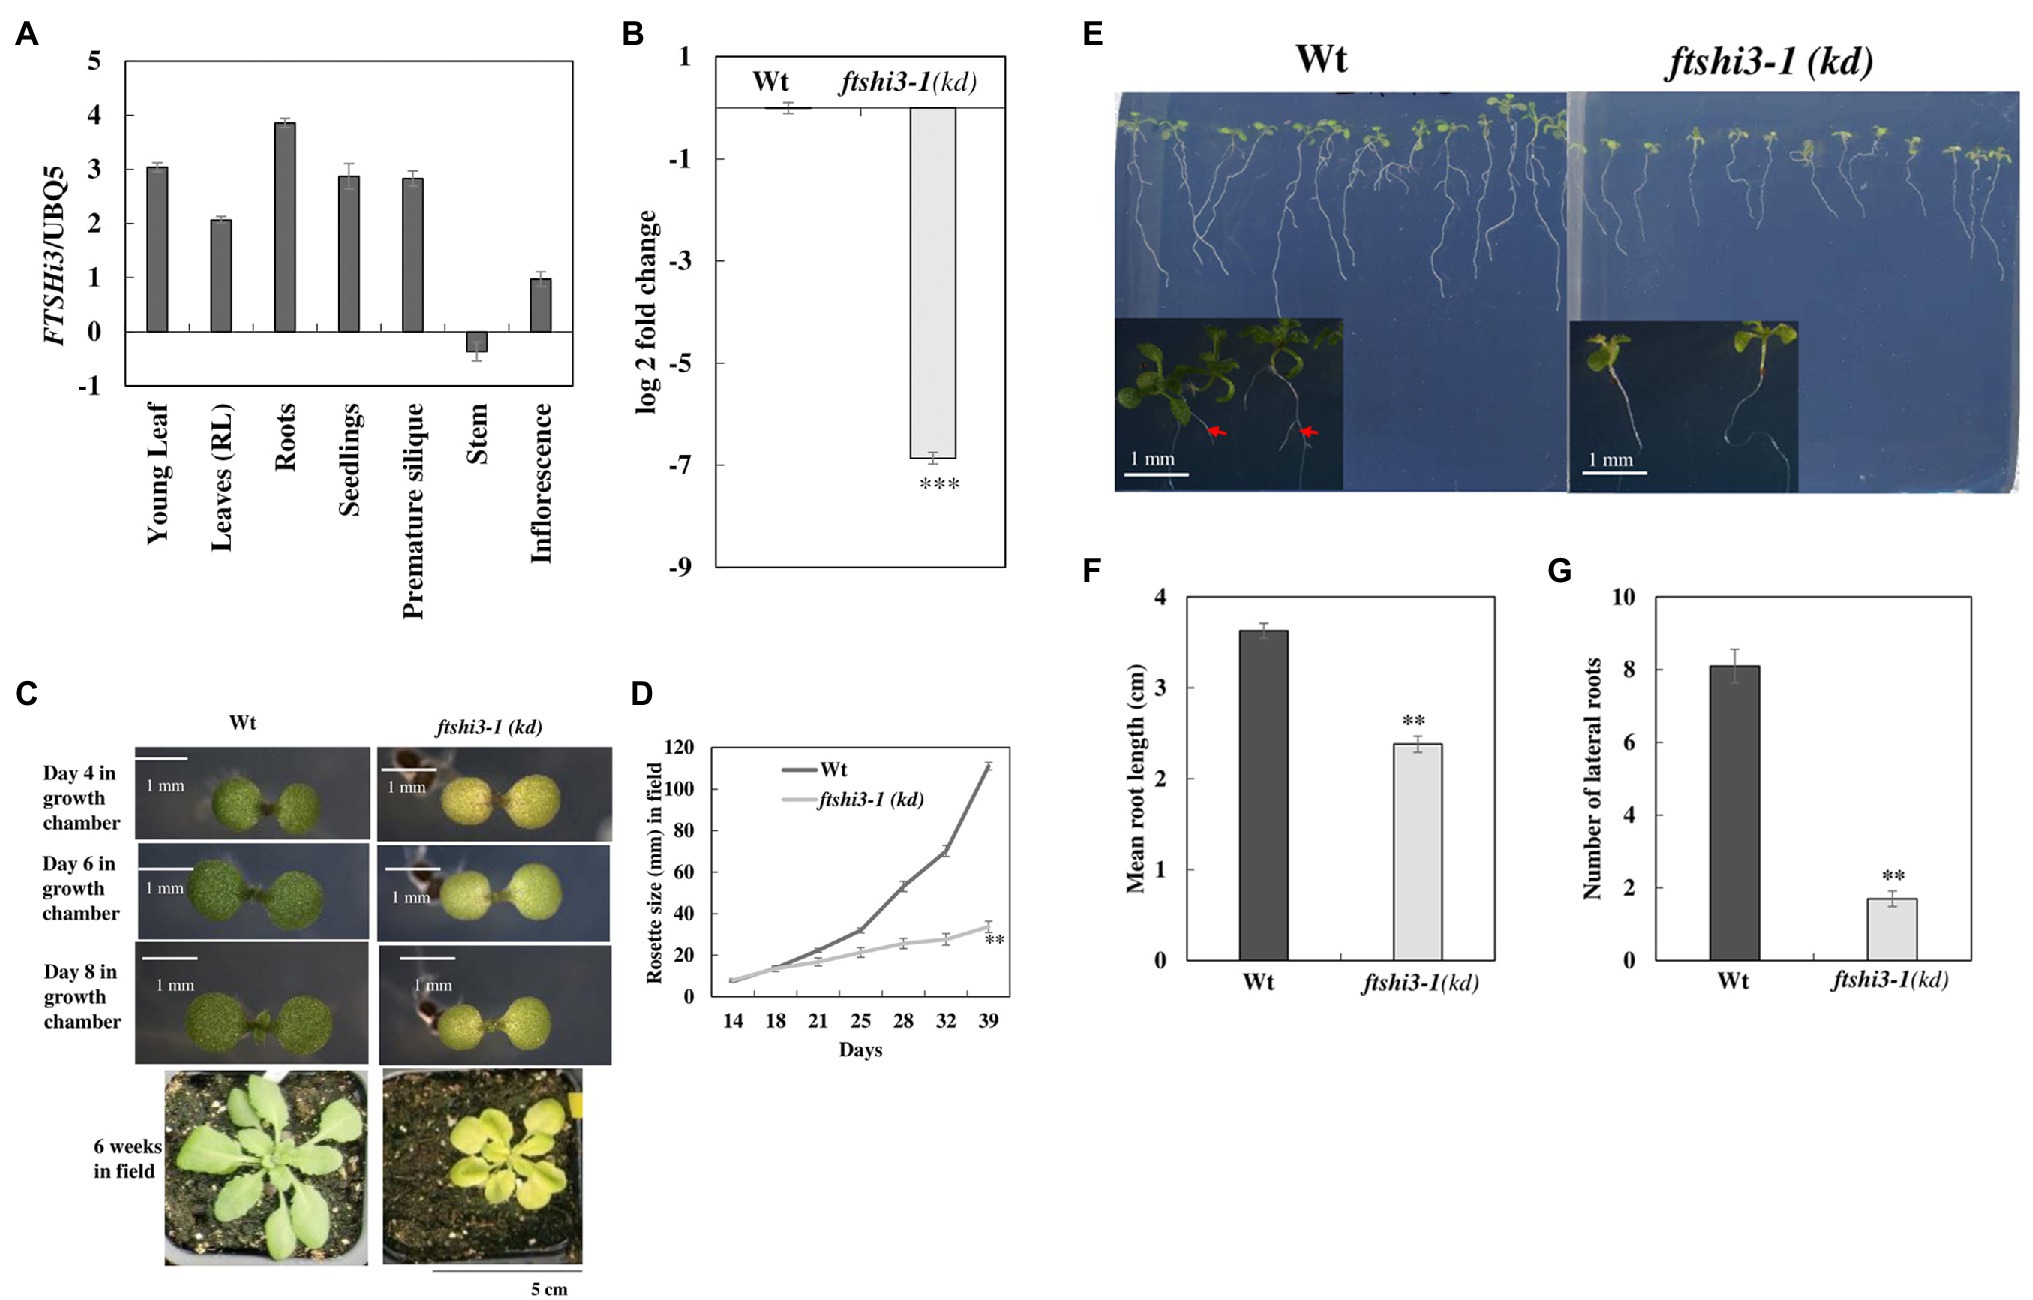
Figure 1. (A) Graphical representation of the organ-specific relative expression of AtFTSHi3 (dCT values normalized to At-UBQ). (B) Log 2-fold change of AtFTSHi3 transcript abundance in 4-week-old rosette leaves of Wt and ftshi3-1(kd). The data are normalized to the expression of genes coding for At-UBQ and At-Tubulin. An asterisk indicates significant differences between Wt and the ftshi3-1 (kd) seedlings (**p < 0.05, Student’s t test, n = 3); error bars represent the SE. (C) Phenotypes of 4-, 6-, and 8-day-old seedlings of Wt and ftshi3-1(kd) grown in a growth chamber under short-day (SD) at 22°C (scale bars are 1 mm), or for 6 weeks under field conditions (Scale bar 5 cm). (D) Rosette diameter measurements were performed from 2 to 6 weeks on field-grown plants. Asterisks indicate a significant difference (**p < 0.05, Student’s t test, n = 8). (E) Root phenotype of 8-day-old seedlings from Wt and ftshi3-1(kd). Arrows indicate the lateral roots. (F,G) Graphical representation of the root length (F) and the number of lateral roots (G; **p < 0.05, Student’s t test, n > 20).
Confirmation of ftshi3 T-DNA Insertion
As the ftshi3-1 (kd) phenotype differed from ftshi3-2 and FLAG_215F10, an initial genotyping screening was performed on the GABI-KAT SET to confirm the T-DNA insertion (Supplementary Figure S1C). The entire genome of ftshi3-1(kd) was sequenced at the Beijing Genomics Institute (BGI, Denmark) to exclude additional T-DNA insertions (Supplementary Figure S1D). Two loci on Chr5 were partially penetrant when aligning the sequence of paired-end reads yielded from the WGS analysis, At5g09590, encoding MITOCHONDRIAL HSO702, and At5g09480, encoding a protein belonging to the hydroxyproline-rich glycoprotein family. Sanger sequencing of these loci in ftshi3-1(kd) revealed that they were intact (data not shown). Therefore, a single GABI-KAT T-DNA insertion in the ftshi3-1(kd) was confirmed.
Complementation was performed by expressing FTSHi3 under the endogenous AtFTSHi3 promoter in the ftshi3-1(kd) background. We designated the resulting transgenic ftshi3-1 (Comp) lines. Initially, 10 independent lines were screened in the T1 generation based on their phenotypes (Supplementary Figure S2A). Two representative transgenic lines in T3, Comp-1, and Comp-2, were selected for further investigations. Both lines displayed recovery to a Wt-like phenotype (Figures 2A,B). The diameters of eight independent rosettes per line measured from 2 to 6 weeks grown in the SD conditions were similar to Wt (Figure 2C). qPCR analysis on RNA extracted from 4-week-old plants grown in SD conditions confirmed restoration of FTSHi3 transcript levels similar to Wt (Figure 2D).
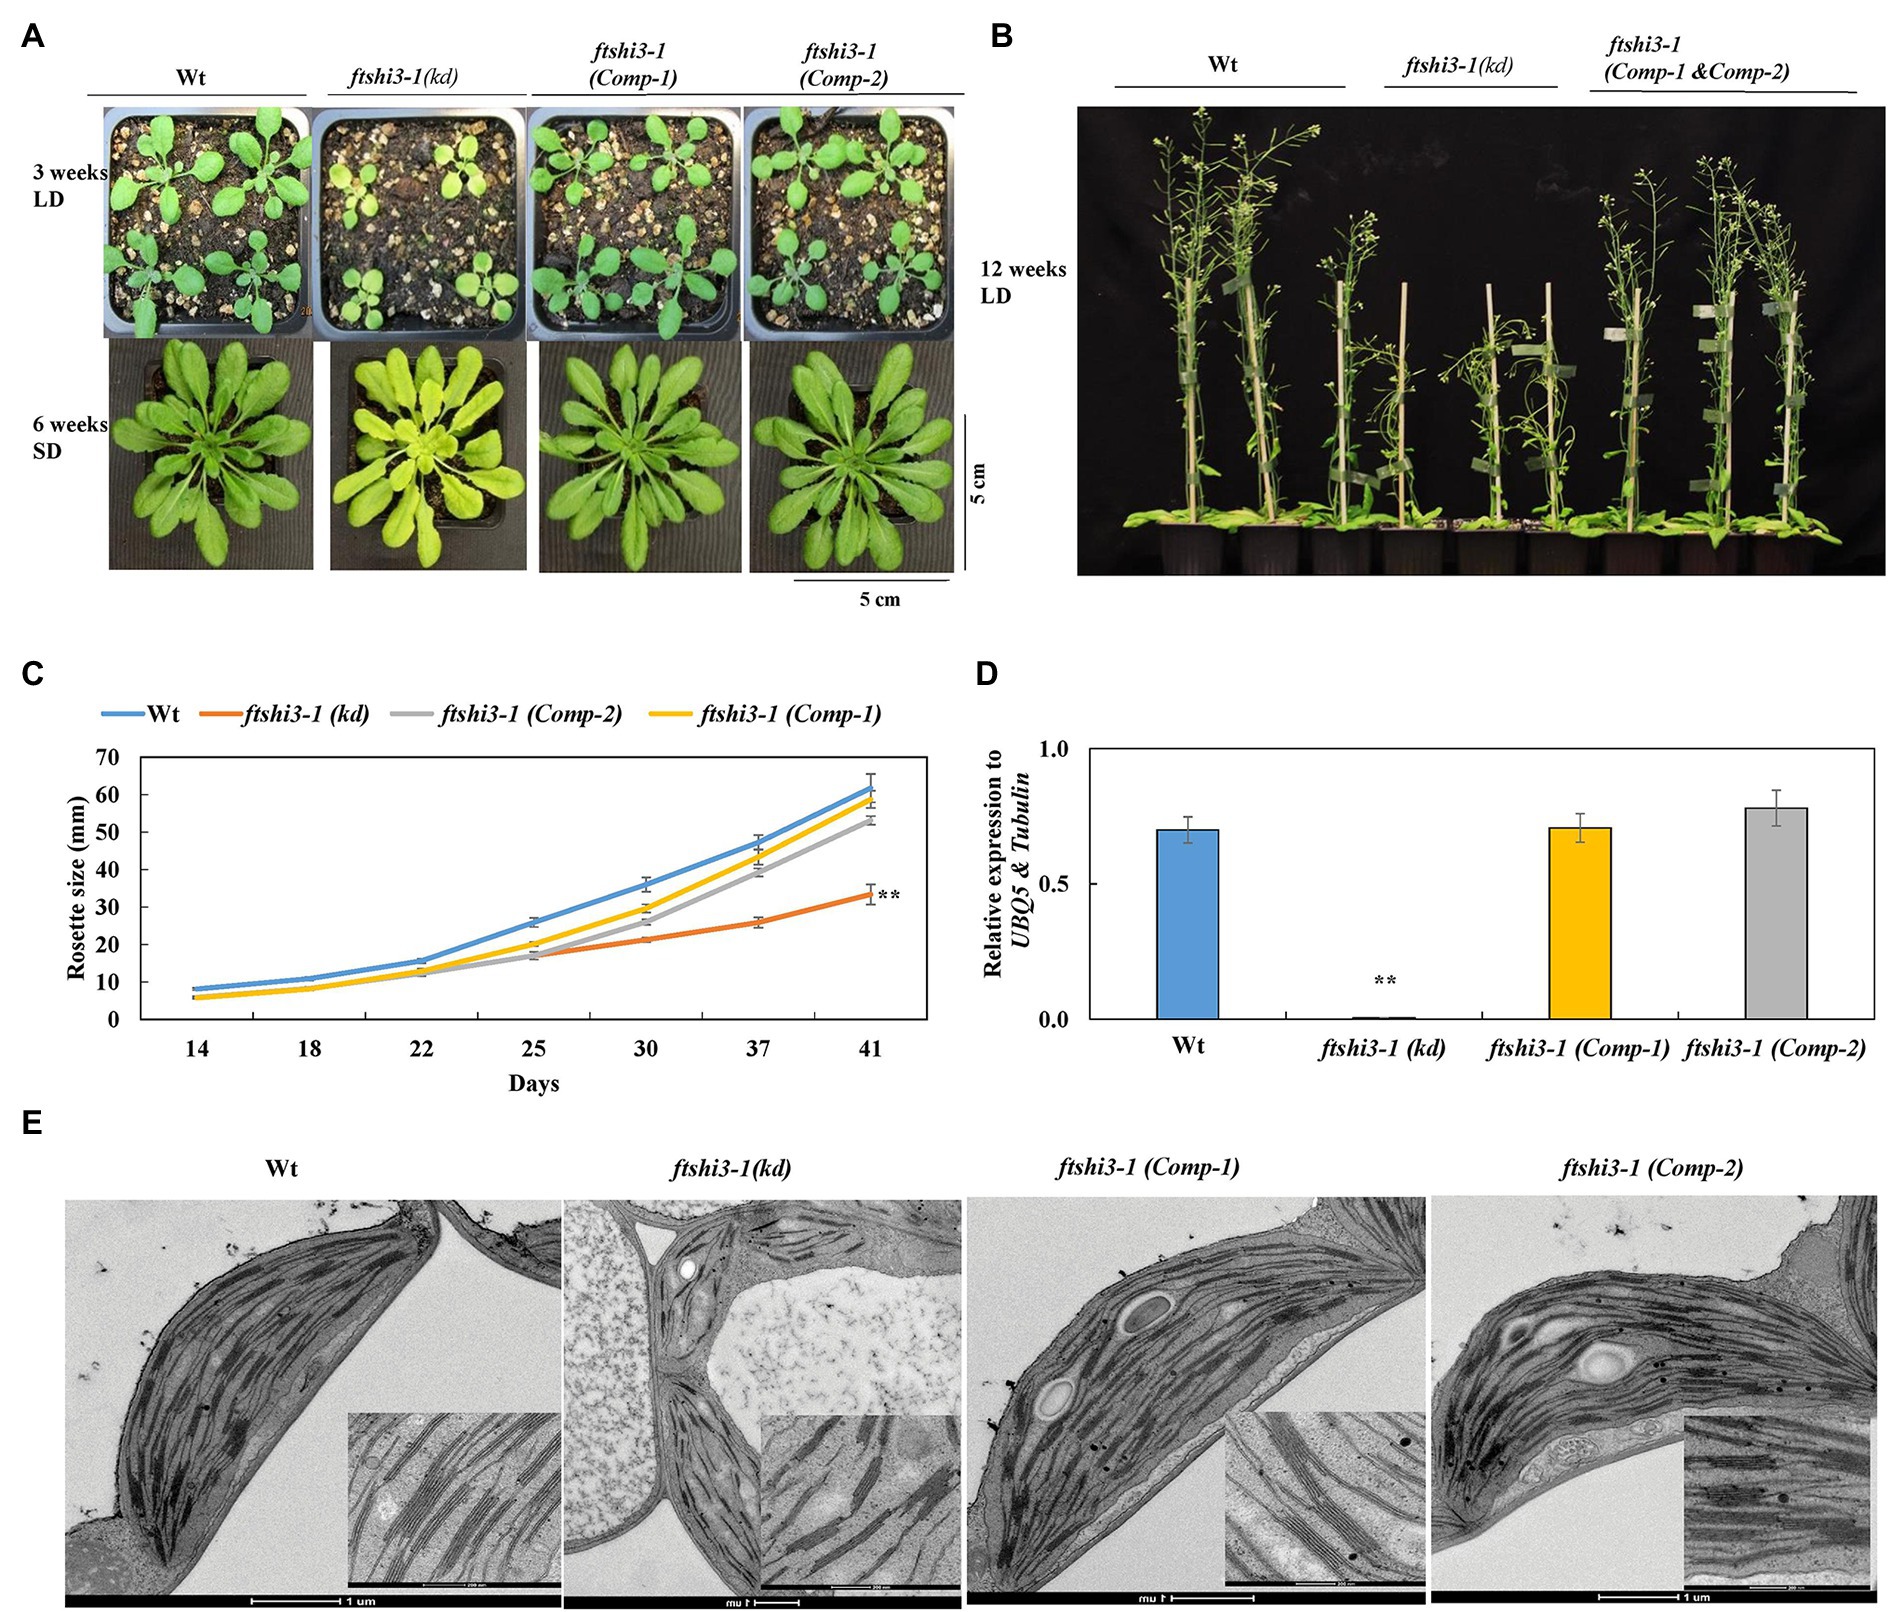
Figure 2. (A) Phenotypes of Wt, ftshi3-1(kd), and ftshi3-1 (Comp-1 and Comp-2) at the age of 3 weeks grown in a long-day (LD; upper panel), 6 weeks in a SD (lower panel) or (B) 12 weeks in LD. (C) Rosette diameter measurements were performed from 2 to 6 weeks grown in SD. Asterisks indicate a significant difference (**p < 0.05, Student’s t test, n = 8). (D) FTSHi3 gene expression analysis of Wt, ftshi3-1(kd), and ftshi3-1 (Comp-1 and Comp-2) lines. Relative expression was normalized to At-UBQ5 and At-Tubulin. Asterisks indicate a significant difference (**p < 0.05, Student’s t test, n = 3). Error bars represent the SE. (E) Transmission electron micrographs of chloroplasts of the first true leaves in Wt, ftshi3-1(kd), and ftshi3-1 (Comp-1 and Comp-2) seedlings. Upper panel bars = 200 nm, lower panel bars = 1 μm.
The chloroplast ultrastructure in the first true leaves of ftshi3-1(kd) was disturbed with a compromised and thinner membrane; chloroplasts contained fewer and distorted thylakoid membranes and fewer starch granules (Figure 2E). Contrary to ftshi3-1(kd), the chloroplast ultrastructure of the first true leaves of the ftshi3-1(Comp) lines revealed fully developed chloroplasts and thylakoid membranes similar to those of Wt (Figure 2E). PSII quantum yield (Fv/Fm) and NPQ performed on these plants grown in SD conditions were similar to Wt, while ftshi3-1(kd) displayed reduced Fv/Fm and significantly higher NPQ (Supplementary Figures S2B,C). The root growth phenotype and the number of lateral roots of ftshi3-1(Comp-1 and Comp-2) lines were similar to Wt (Supplementary Figures S2D,E,F).
MicroRNA lines were also generated expressing artificial miRNAs silencing FTSHi3 expression. We designed miRNA silencing cassettes targeting the regions 533–553 (miRNA-a) and 1,952–1,972 (miRNA-b) of the FTSHi3 coding sequence, respectively (Supplementary Figure S1B). Both cassettes were cloned downstream of a β-estradiol inducible promoter. T2 seedlings containing one of both silencing constructs displayed varying degrees of paleness, ranging from Wt-like plants to pale ftshi3-1(kd)-like plants (Supplementary Figure S3A). The paleness faded in adult plants, but they showed lowered overall growth throughout their life span (Supplementary Figures S3B; upper panel,C). FTSHi3 transcript abundance was analyzed by extracting RNA from 14-day-old seedlings and 4-week-old plants (Supplementary Figures S3D,E). FTSHi3 expression was downregulated in miRNA seedlings with the pale phenotype (miRNA-a1-8 and miRNA-b1-2, 5–6), whereas those lacking paleness showed residual FTSHi3 expression (Supplementary Figure S3C). FTSHi3 expression was downregulated even in adult plants, showing the β-estradiol induction and silencing (Supplementary Figure S3E). These experiments collectively demonstrate that the lack of FtsHi3 in ftshi3-1(kd) is responsible for its distinct phenotype compared to the previously characterized ftshi3 alleles.
Loss of FtsHi3 Affects Stress Tolerance
As controlled laboratory growth conditions do not fully mimic the natural environment of plants, the seedlings were grown in a controlled growth chamber and field experiments were carried out under natural conditions in Umeå, Northern Sweden, in 2017. These studies were only performed on the transposon lines and not on the transgenic ftshi3-1(Comp-1 and Comp-2) lines due to restrictions in the permission. The absence of FtsHi3 yielded smaller plants than Wt in both the growth chamber and the field conditions (Figure 1C, lowest panel). Chlorophyll fluorescence parameters were determined on 45-day-old plants in the field. Fv/Fm was significantly lower in ftshi3-1(kd) compared to Wt (Figure 3A), whereas NPQ was significantly higher under the influence of increasing PAR (Figure 3B). Total chlorophyll contents and the chlorophyll a/b ratios of the seedlings were lower in the mutant (Supplementary Table S2).
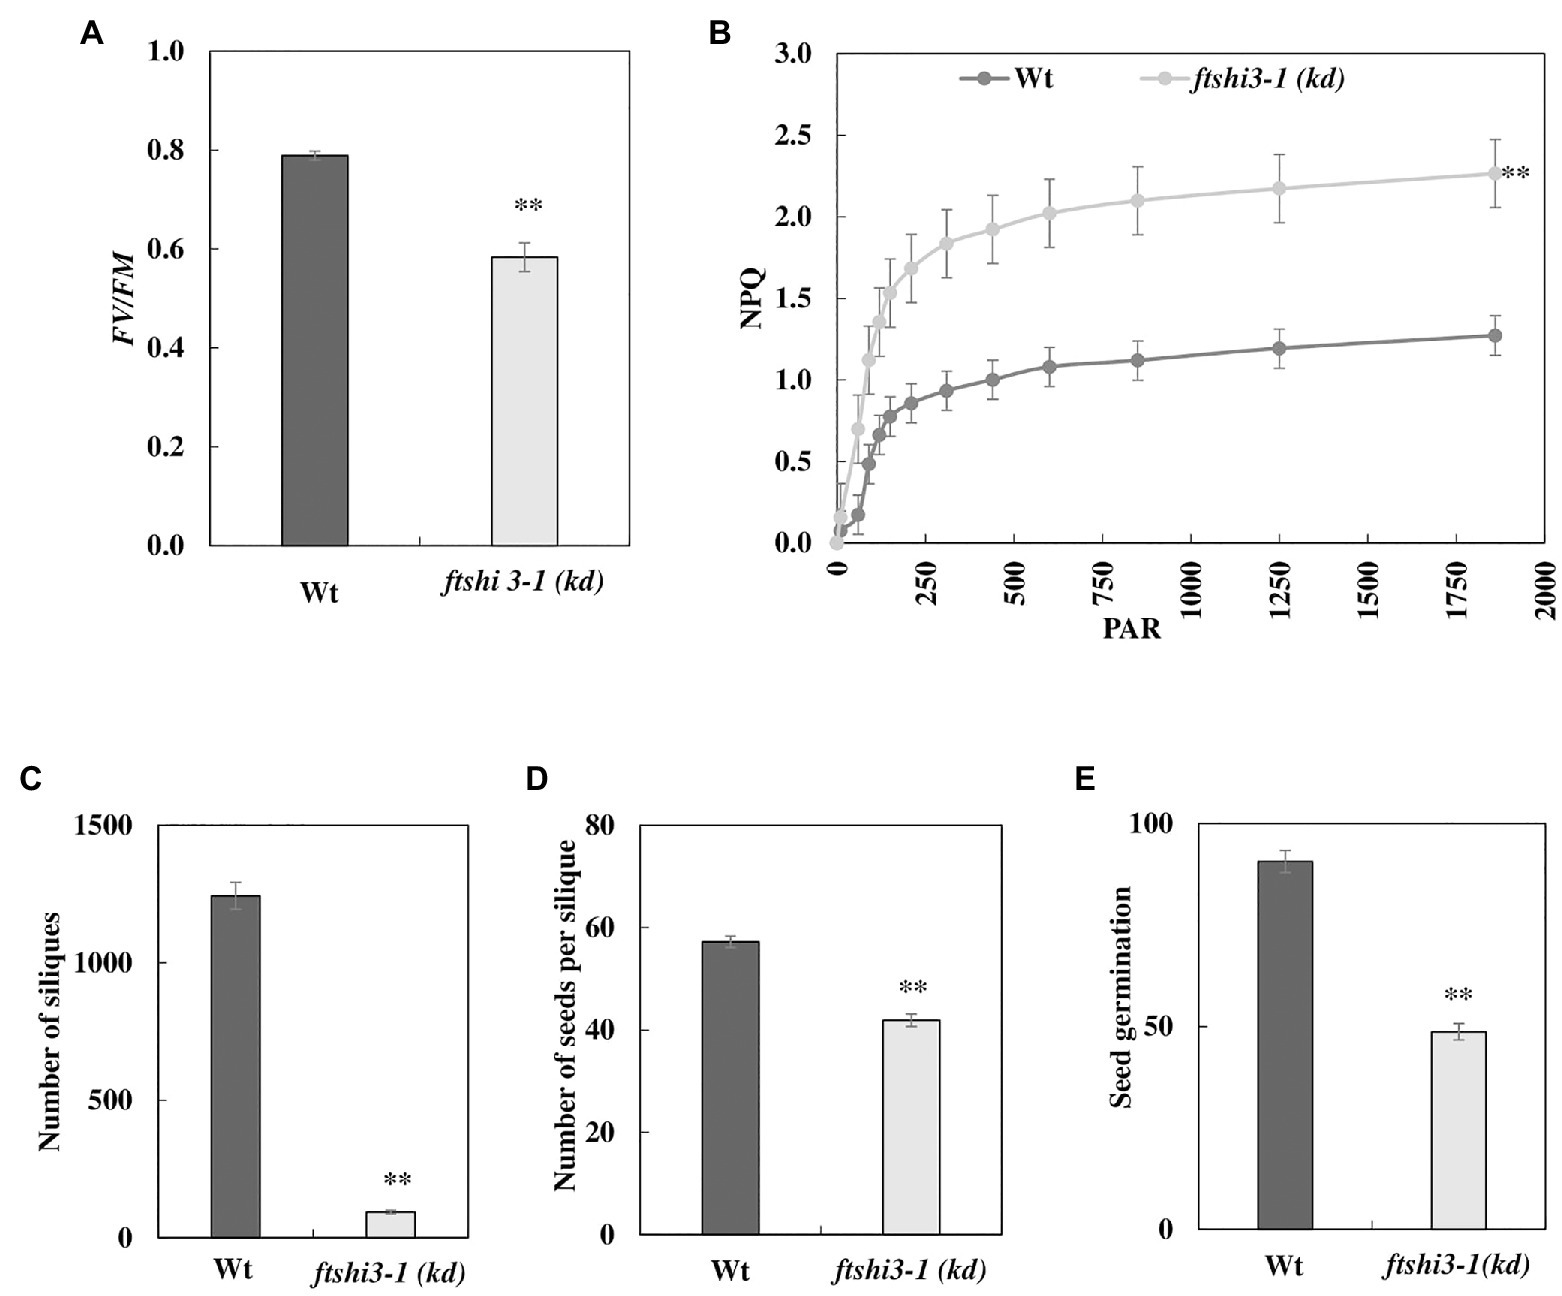
Figure 3. (A) Chlorophyll fluorescence indicating photosynthetic parameters (Fv/Fm) and (B) non-photochemical quenching (NPQ) of Wt and ftshi3-1(kd) measured on plants growing in the field. Asterisks indicate a significant difference (p < 0.05, Student’s t test, n = 8). The number of (C) siliques and (D) seeds per silique. Asterisks indicate a significant difference [**p < 0.001, ANOVA, least significant difference (LSD) post hoc test, n = 50]. (E) Seed germination capacity (determined after 2 days of incubation) of seeds harvested from field-grown plants. Asterisks indicate a significant difference (**p < 0.001, ANOVA, LSD post hoc test, n = 50). Error bars represent the SE.
We ended the field experiment when the first plants contained siliques that were almost dry and ready to shed their seeds. The total number of siliques was counted (Figure 3C), and further, the total number of seeds per silique was estimated by counting seeds from five siliques per plant (Figure 3D; Frenkel et al., 2008). Interestingly, all 50 ftshi3-1(kd) plants planted in the field survived throughout the field experiment despite their growth defects, compared to 43 Wt plants. However, ftshi3-1(kd) lines produced significantly lower numbers of siliques and seeds per silique than Wt (Figures 3C,D). Additionally, the germination of seeds harvested from field-grown ftshi3-1(kd) plants was strongly affected (Figure 3E), showing lower Darwinian fitness than Wt.
The more obvious phenotype of field-grown plants compared to plants grown under controlled conditions is caused by permanently varying growth conditions, including extreme light intensities (for short periods), temperature drops (day/night), flooding, and herbivore attacks (Mishra et al., 2012). To pinpoint which of these factors have the most potent effect on the growth of ftshi3-1(kd), photochemical efficiency, and stress tolerance capacity, Wt and ftshi3-1(kd) plants were compared in laboratory conditions after subjecting them to the individual or combined stresses for 6, 9, and 16 weeks (if possible). At high temperature (30°C), continuous light or high light stress in SD, the rosette diameter of ftshi3-1(kd) increased compared to its growth in the respective control conditions (Supplementary Figures S4A–C,E). After 16 weeks of cold stress at SD conditions, ftshi3-1(kd) plants continued to display pale and small rosettes (Supplementary Figures S4D,E). Fluorescence quenching analyses showed significant differences in Fv/Fm and NPQ between ftshi3-1(kd) and Wt before exposure to stress (t = 0; Supplementary Table S3). Fv/Fm of ftshi3-1(kd) remained lower than Wt even after 3 days of stress exposure, showing slower stress acclimation (Supplementary Figure S4F; Supplementary Table S3). The Fv/Fm of ftshi3-1(kd) only recovered to Wt levels during growth at combined high temperature (30°C) and continuous light (Supplementary Table S3). The NPQ values of ftshi3-1(kd) increased and were significantly higher than those of Wt until 6 weeks of stress exposure (Supplementary Table S3), and dissipation of excess heat was better in the mutant than in Wt.
ftshi3-1(kd) Plants Display Enhanced Tolerance to Drought Stress
The performance of ftshi3-1(kd) was also tested under drought stress. Irrigation was stopped on 4-week-old, soil-grown plants until we observed lethal effects in over 50% of the genotype replicates under investigation. Wt and ftshi3-1(Comp-1 and Comp-2) lines showed an early onset of drought sensitivity compared to ftshi3-1(kd) plants (Figure 4A, lower panel), while under controlled growth conditions with regular irrigation, all lines showed consistent growth (Figure 4A, upper panel). After 12 days of exposure to drought, almost all Wt and ftshi3-1(Comp-1 and Comp-2) transgenic lines withered and became chlorotic, whereas 80% of the ftshi3-1(kd) plants continued to grow (Figure 4A), displaying no drought symptoms, although no difference in pot weight (g) was determined between the genotypes exposed to the same treatment (Supplementary Figure S5A). After 20 days of drought (Supplementary Figure S5B), the plants were re-irrigated with 350 ml of water every day for 14 days, and 15 random pots per tray were selected to test their survival rates (Supplementary Figure S5C). Over 80% of ftshi3-1(kd) plants recovered (Supplementary Figure S5C), whereas only 20% of Wt or ftshi3-1(Comp-1 and Comp-2) lines survived. Wt, ftshi3-1(kd), and ftshi3-1 (Comp-1 and Comp-2) lines were further grown in common trays over 2 weeks in LD conditions in the greenhouse (Supplementary Figure S5D); even shared reservoir ftshi3-1(kd) survived drought treatment for 15 days, while Wt and the complementation lines withered. The observed drought tolerance of ftshi3-1(kd) was independent of the growth time regime (Supplementary Figure S6).
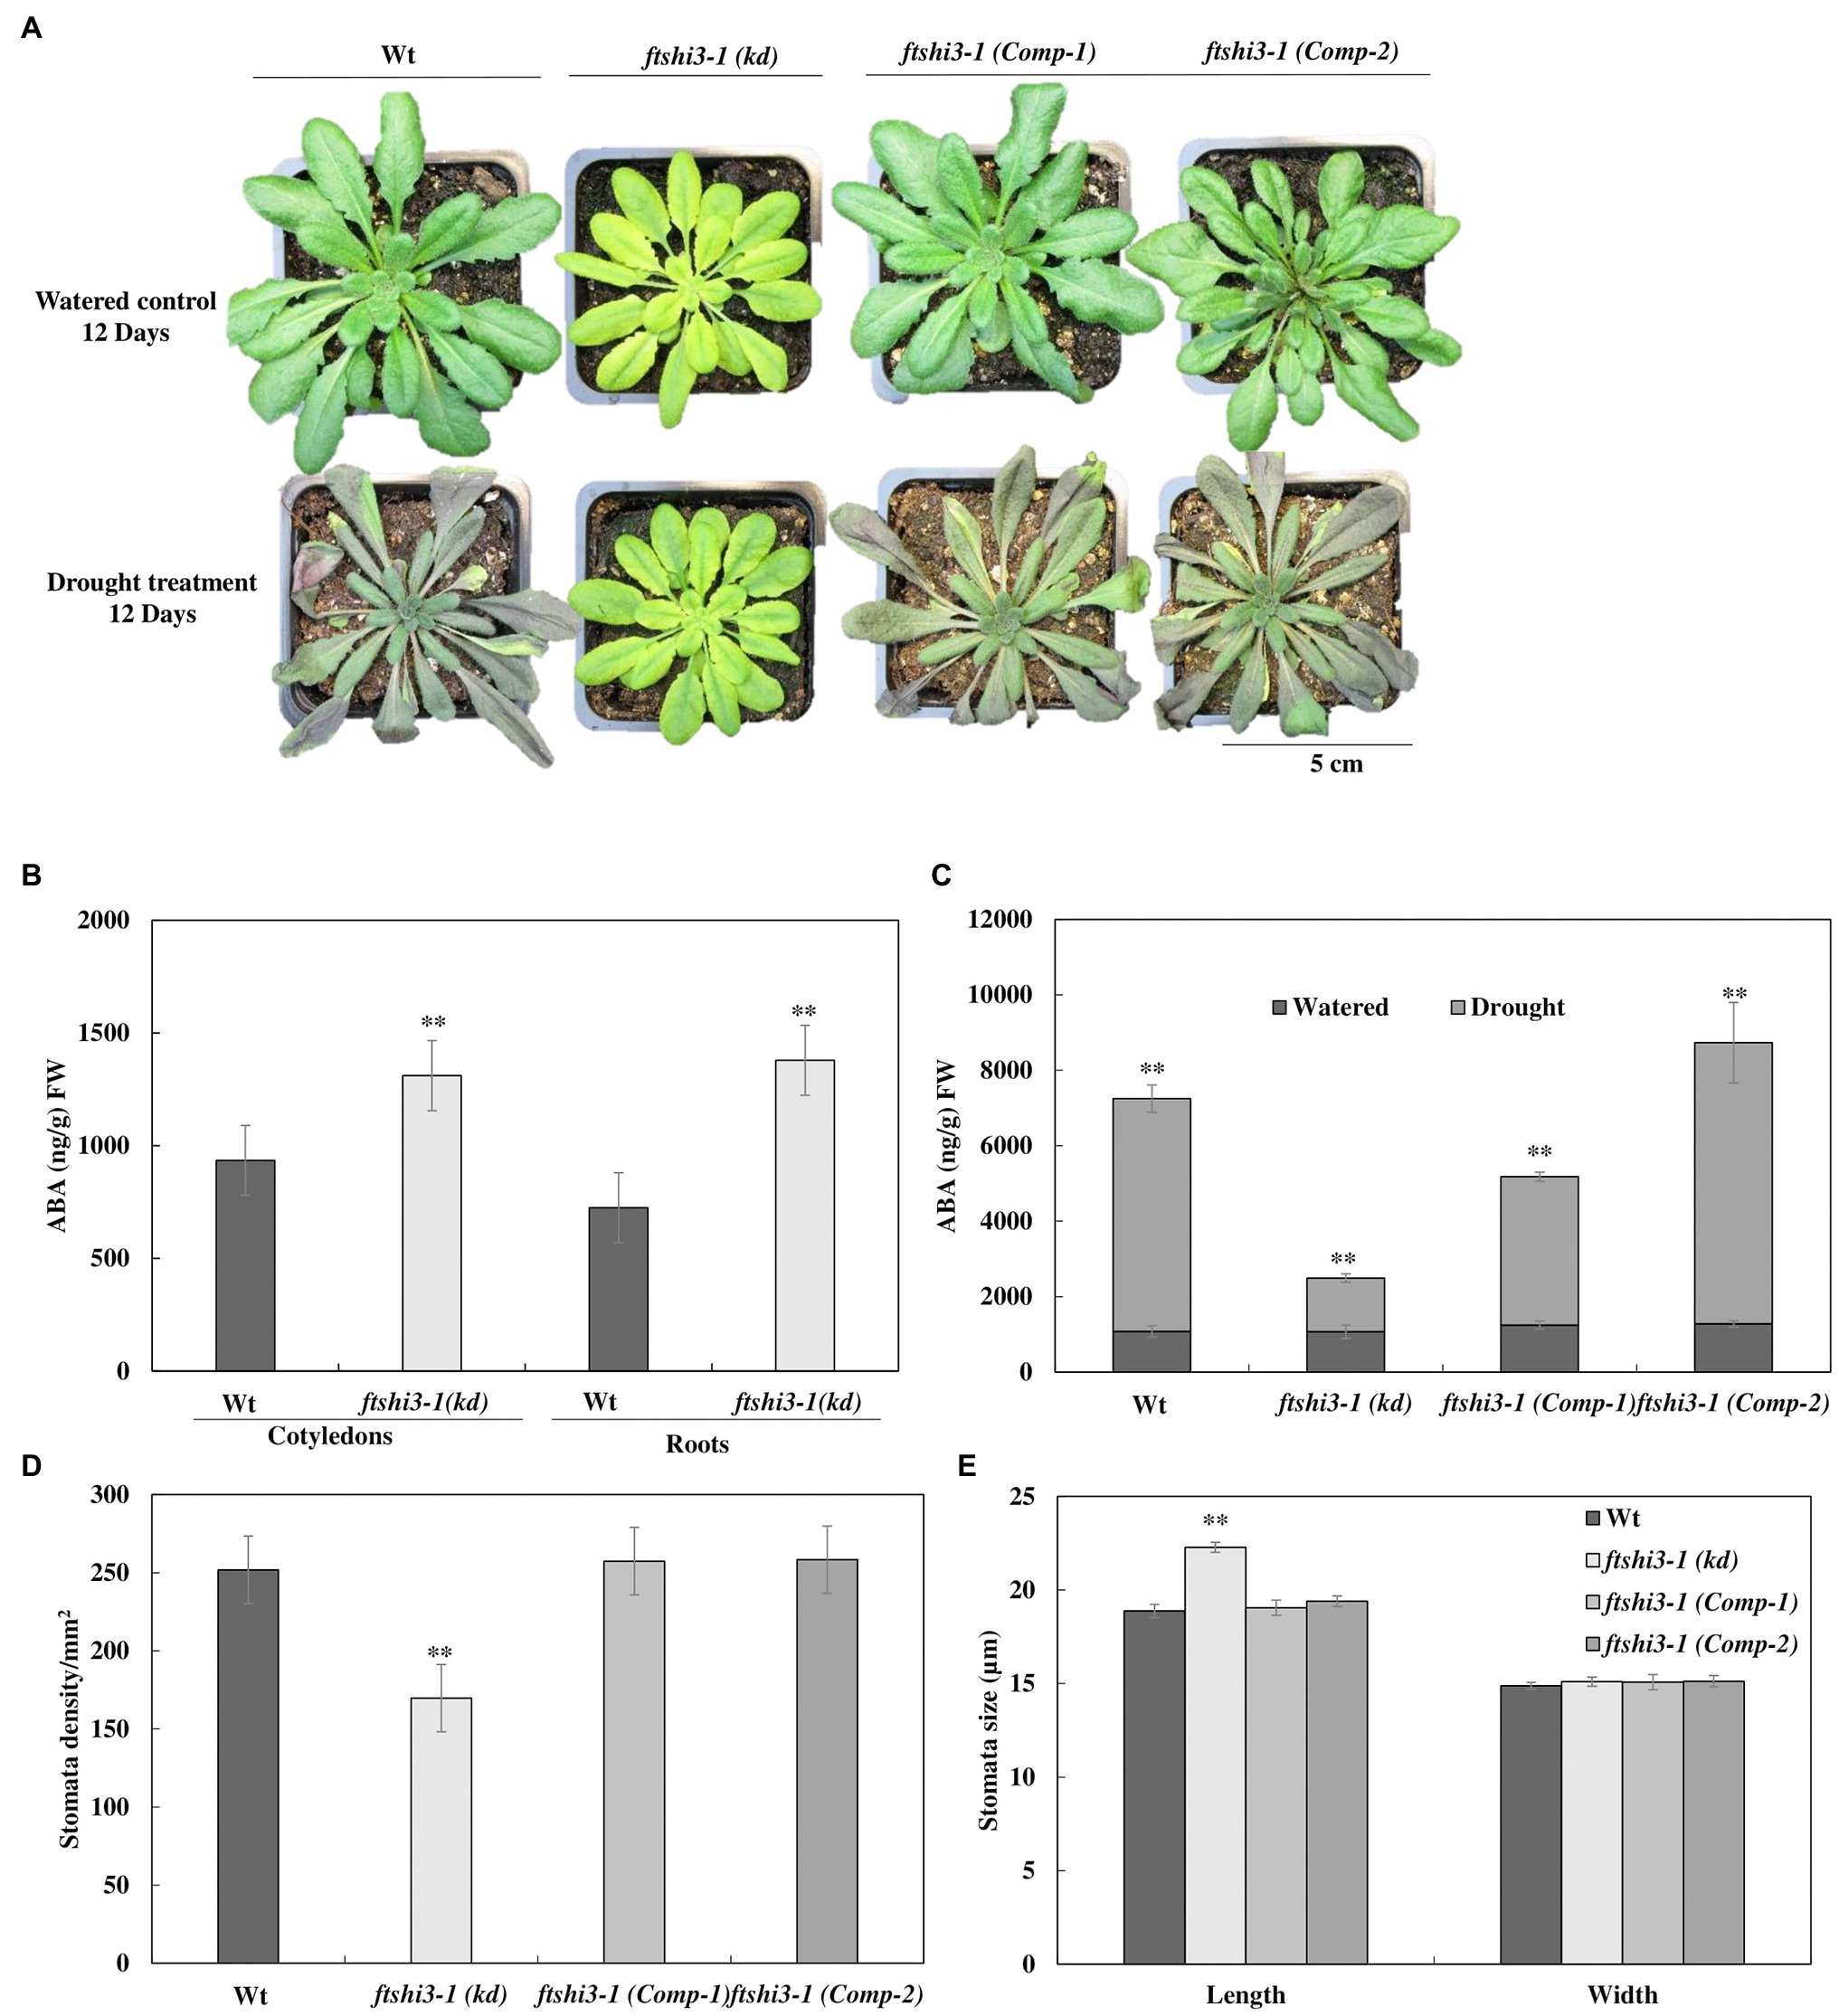
Figure 4. (A) Representative phenotypes of 6-week-old Wt, ftshi3-1(kd), and ftshi3-1 (Comp-1 and Comp-2) plant after exposure to drought stress for 12 days. (B) Quantification of abscisic acid (ABA; ng/g) FW in 10-day-old seedlings of Wt and ftshi3-1(kd) grown in a growth chamber at LD and 22°C. Asterisks indicate a significant difference (**p < 0.05, Student’s t test, n = 3). Error bars represent the SE. (C) Quantification of ABA (ng/g) FW in leaves of watered and drought-stressed plants. Asterisks indicate the significant difference of ABA (ng/gm) content in watered and drought conditions (**p < 0.05, Student’s t test, n = 4). (D) Measurements of the stomatal density and (E) the stomatal size of Wt, ftshi3-1(kd), and ftshi3-1 (Comp-1 and Comp-2). Asterisks indicate a significant difference. Error bars represent the SE.
Gas-exchange parameters during watered and drought conditions were determined under SD conditions (Table 1). No significant differences were observed in net photosynthesis (AN, μmol CO2 m−2 s−1) or CO2 concentration inside the leaf (Ci, μmol CO2 mol−1 air) across the genotypes. In contrast, the leaf stomatal conductance (gs, mol CO2 m−2 s−1) was significantly higher in ftshi3-1(kd) plants compared to Wt and ftshi3-1(Comp-1 and Comp-2) in watered conditions. After 12 days of drought, Wt and ftshi3-1(Comp-1 and Comp-2) had wilted; their AN and gs, therefore, were significantly lower compared to the values received for ftshi3-1(kd) plants (Table 1). The WUEi, i.e., the ratio AN/gs, showed a significant increase in ftshi3-1(kd) compared to Wt and ftshi3-1(Comp-1 and Comp-2) during drought conditions (Table 1).
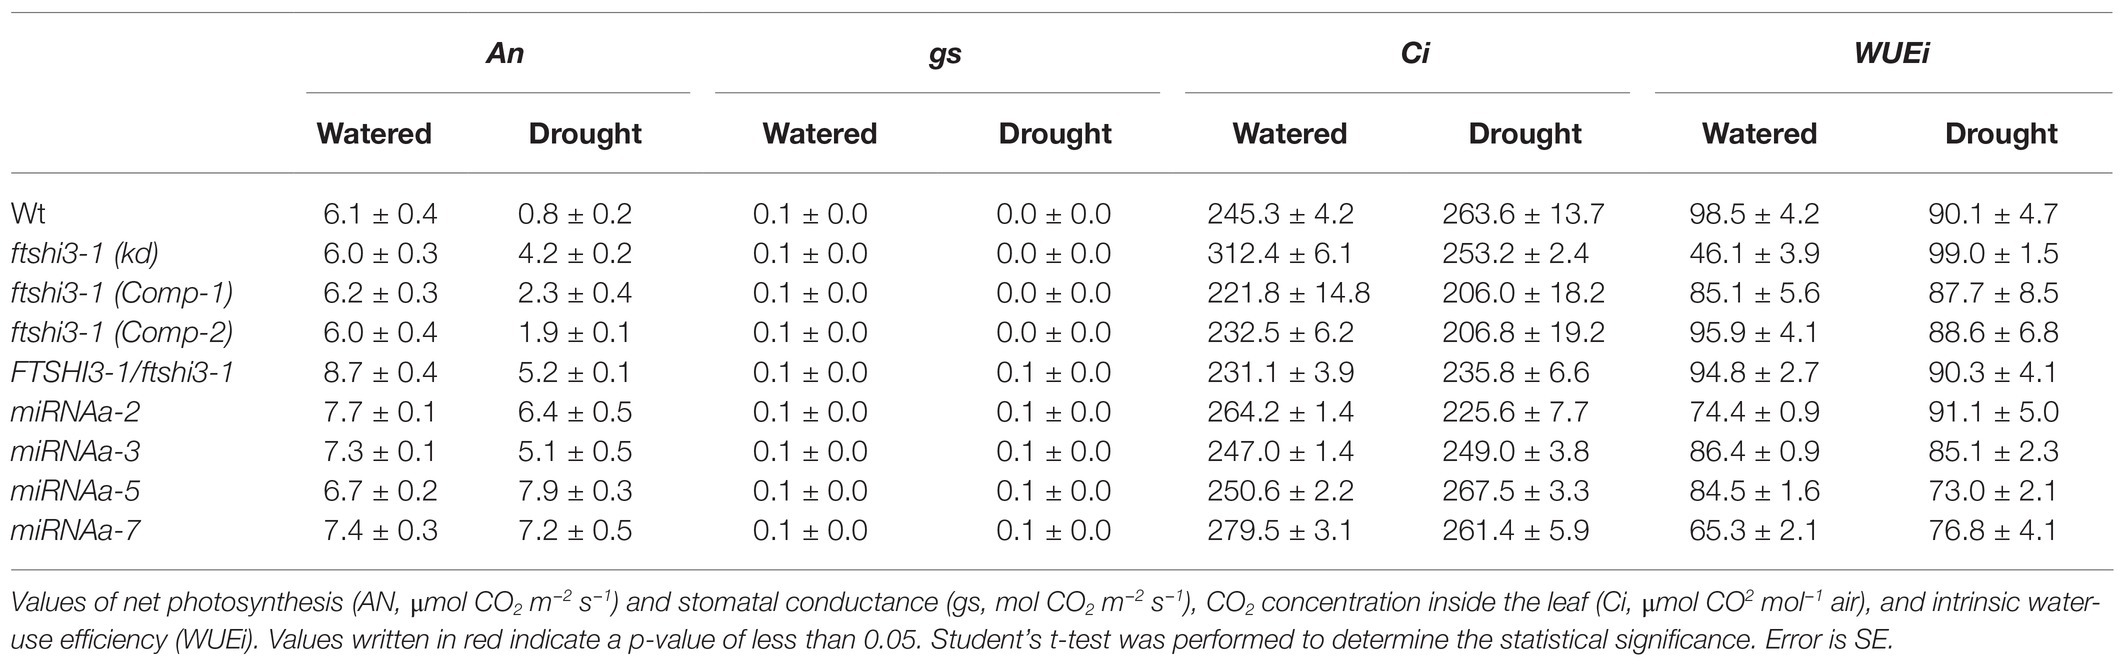
Table 1. Gas-exchange analyses performed on Wt, ftshi3-1(kd), ftshi3-1 (Comp-1 and Comp-2), miRNA-a2/a3/a5/a7, and Ftshi3-1/ftshi3-1 lines grown in watered and drought conditions.
Abscisic acid is an important hormone that increases plant tolerance to stressors (reviewed by Sah et al., 2016). To understand the responses to abiotic stress, the endogenous ABA levels in 10-day-old Wt and ftshi3-1(kd) seedlings grown in a growth chamber at LD and 22°C were determined. Cotyledons and roots of ftshi3-1(kd) seedlings showed a significantly higher ABA accumulation than Wt (Figure 4B). ABA levels were further investigated in watered and drought-stressed adult plants at the age of 6 weeks. While the levels of ABA (ng/g fresh weight) in the leaves of the adult watered plants were similar between lines (Figure 4C), ABA levels were significantly higher in Wt and ftshi3-1(Comp-1 and Comp-2) than in ftshi3-1(kd) during drought stress (Figure 4C). Stomata density and sizes were determined in leaves of Wt, ftshi3-1(kd), and ftshi3-1(Comp-1 and Comp-2) transgenic lines (Figures 4D,E). ftshi3-1(kd) plants contained an average of 169 stomata per mm2 as compared to Wt (252 per mm2) and the ftshi3-1(Comp-1 and Comp-2) lines (257 and 258 per mm2, respectively; Figure 4D). The average stomatal width to length dimension was 18.9 by 14.9 μm for Wt, in contrast to 22.3 by 15.1 μm for ftshi3-1(kd) and 19.05 by 15.08 μm or 19.1 by 15.13 μm for the ftshi3-1(Comp-1 and Comp-2) lines, respectively (Figure 4E). The differences observed between the length of the stomata and the stomata density per mm2 in ftshi3-1(kd) compared to Wt and the ftshi3-1(Comp-1 and Comp-2) lines were significant (Figure 4E).
Abscisic acid has several implications on overall plant growth and development, including regulating plant water balance and osmotic stress tolerance (Cutler et al., 2010); therefore, treatment with exogenous ABA is a way of regulating plant tolerance in agriculture (reviewed by Sah et al., 2016). We investigated the effect of mannitol-induced osmotic stress and exogenous ABA treatment to understand the responses to dehydration and abiotic stress tolerance in Wt, ftshi3-1(kd), and ftshi3-1 (Comp-1 and Comp-2) seedlings. Seven-day-old seedlings of Wt, ftshi3-1(kd), and ftshi3-1(Comp-1 and Comp-2) were grown either in the absence of exogenous ABA and mannitol or exposed to 1 or 5 μM ABA, or 200 mM mannitol for another 7 days. Seedlings of ftshi3-1(kd) sustained significantly in growth rate compared to Wt and the Comp lines when treated with either ABA or mannitol (Figures 5A–C). We further examined the ftshi3-1(kd) guard cell apertures at the abaxial side of the leaves compared to Wt and the ftshi3-1(Comp-1 and Comp-2) lines to understand if the stomatal aperture closure is sensitive to ABA (Figures 5D,E). Response to ABA was determined by calculating the ratio of width/length of the stomata in the presence or absence of exogenous 10 μM ABA (Figures 5D,E). Stomatal apertures in the absence of ABA treatment were smallest in ftshi3-1(kd), averaging 0.35 μm, whereas they averaged 0.47 μm in Wt, and 0.46 and 0.43 μm in the ftshi3-1(Comp-1 and Comp-2) lines, respectively (Figure 5E). When treated with 10 μM exogenous ABA, stomatal closure was induced, with the stomatal apertures of all genotypes decreasing by over 50% (Figure 5E). These results suggest that drought tolerance in ftshi3-1(kd) plants is related to their lower stomatal density instead of ABA sensitivity.
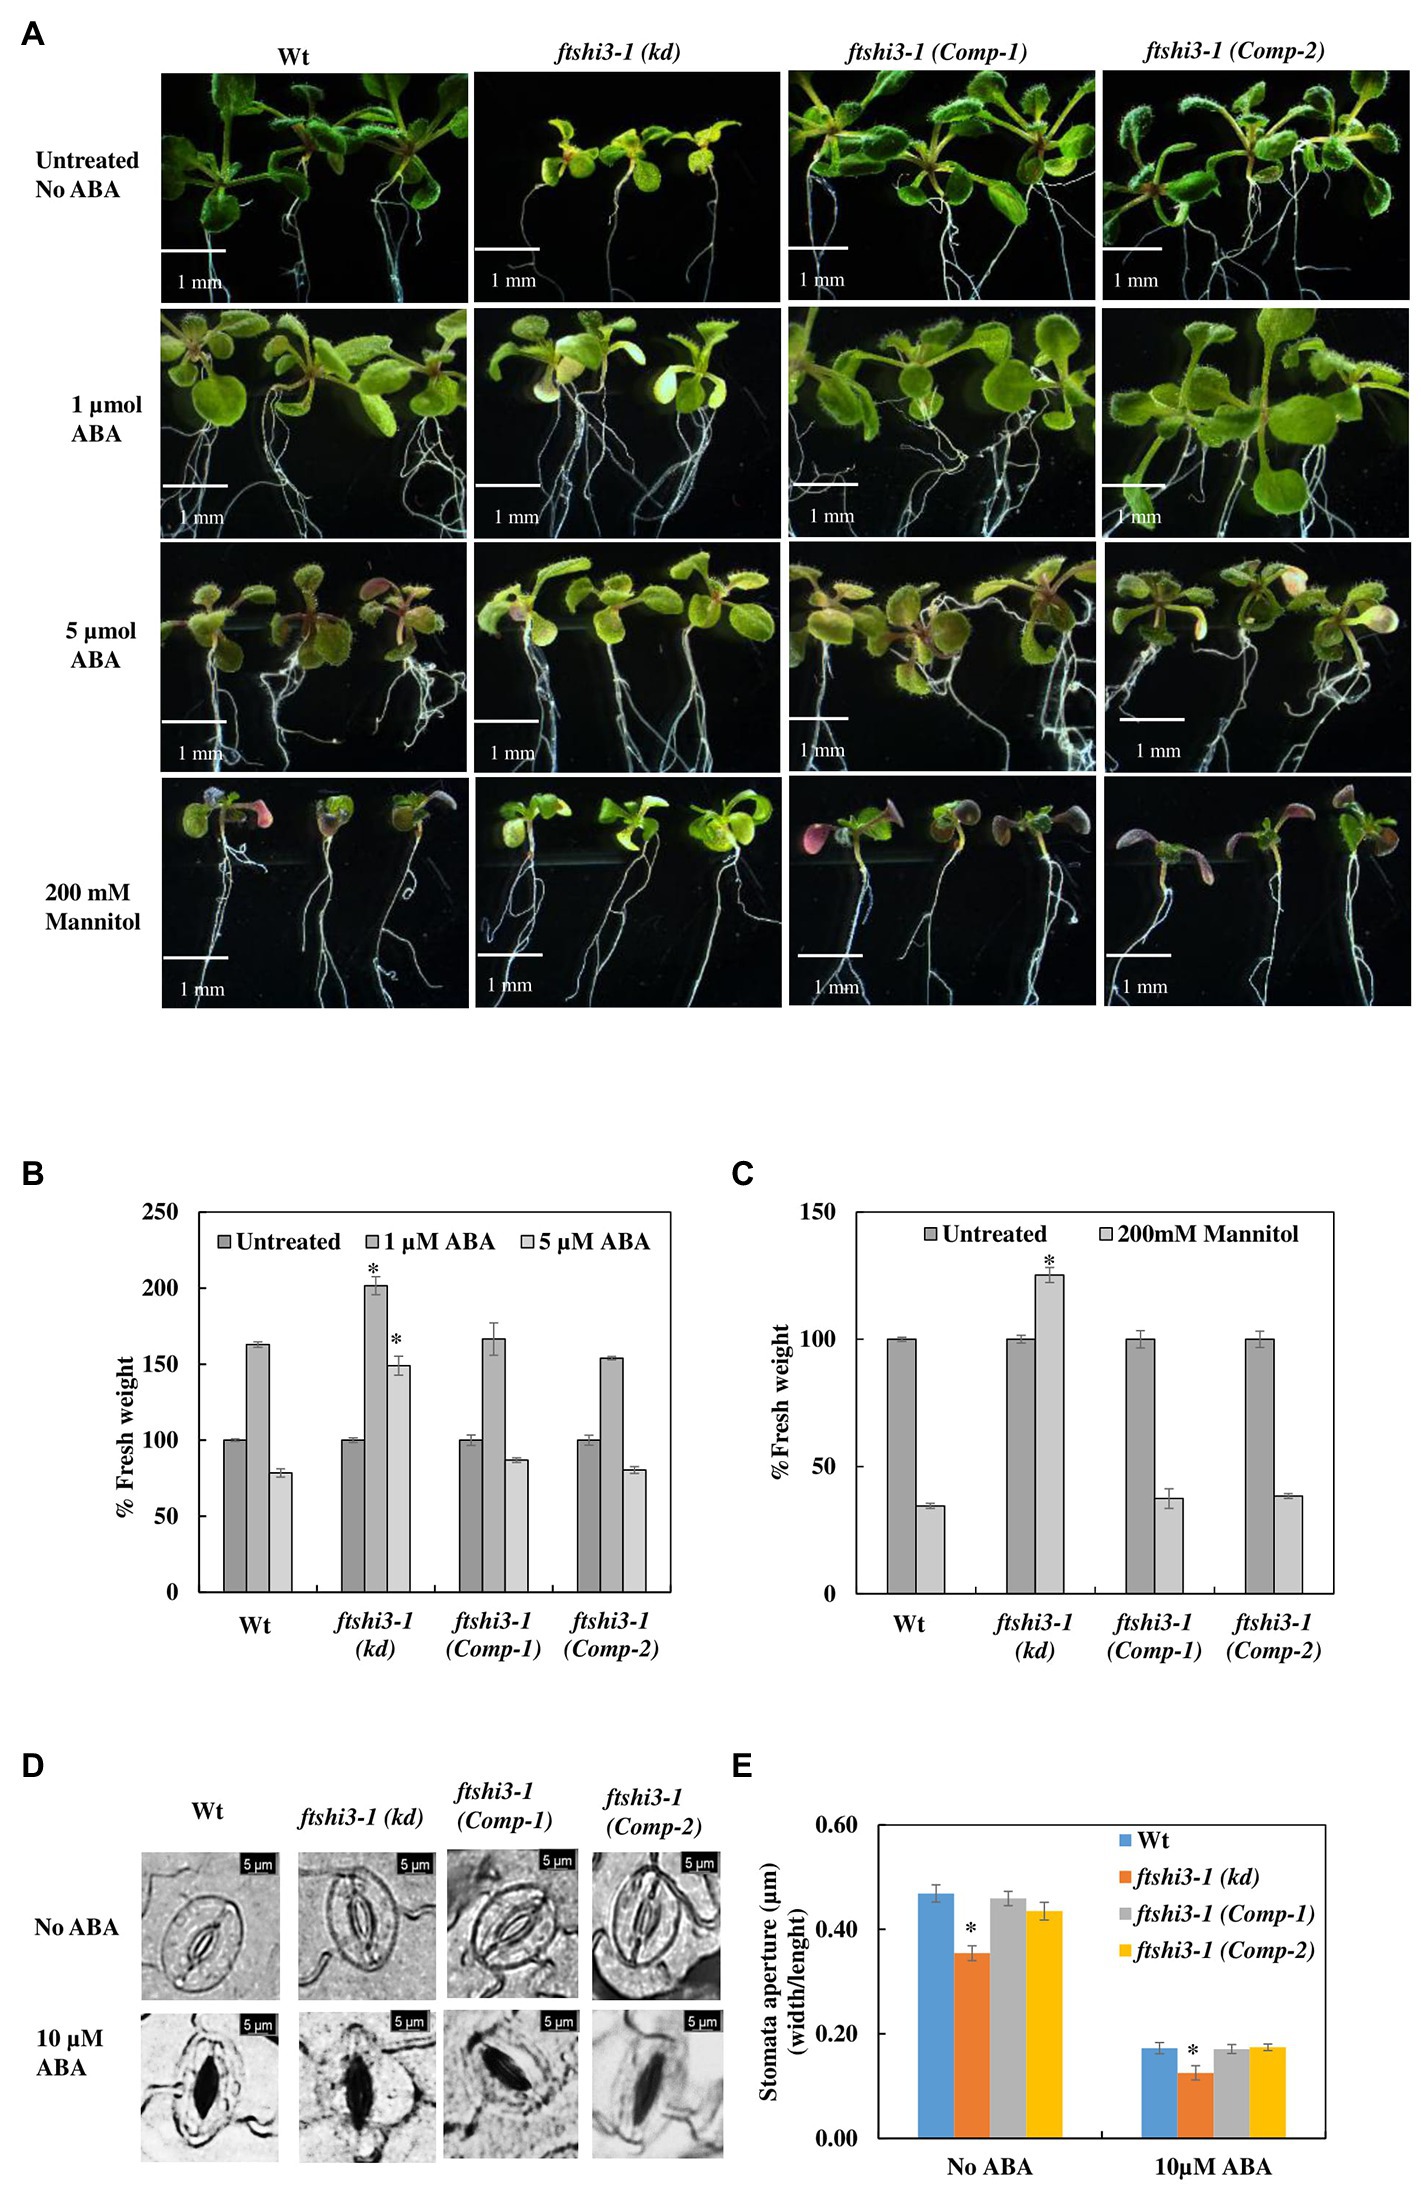
Figure 5. (A) Seedlings of Wt, ftshi3-1(kd), and ftshi3-1 (Comp-1 and Comp-2) grown in the absence of exogenous ABA and mannitol or exposed to 1or 5 μM ABA or 200 mM mannitol. (B,C) Quantification of fresh weight after treatment with 1 or 5 μM ABA or 200 mM mannitol. Asterisks indicate the significant difference to Wt (*p < 0.05, Student’s t test, three sets containing 15 biological replicates each per treatment per genotype). Scale bar: 1 mm. Error bars represent the SE. (D) Microscopic images of stomatal closure in the presence or absence of 10 μM ABA in Wt, ftshi3-1(kd), and ftshi3-1 (Comp-1 and Comp-2) plants. Scale bar: 5 μm. (E) Graphical presentation of the stomatal closure in the presence or absence of 10 μM ABA in Wt, ftshi3-1(kd), and ftshi3-1 (Comp-1 and Comp-2) plants. Asterisks indicate significant differences (Student’s t test, *p < 0.05, five biological replicates; 45 stomata per leaf). Error bars represent the SE.
Transcript Abundance of ABA-Responsive Genes in ftshi3-1(kd) Plants
Drought stress activates ABA-biosynthesis, leading to the expression of ABA-responsive genes, which can be signaled either via an ABA-dependent or an ABA-independent pathway or by cross-talk between both pathways (Yoshida et al., 2014). Among several studied ABA-responsive genes (reviewed by Shinozaki and Yamaguchi-Shinozaki, 2006; Ahuja et al., 2010), we investigated RESPONSIVE TO DESICCATION 29A, 29B, and 22 (RD29A, RD29B, RD22), Dehydration-responsive element-binding protein 1A and 2A (DREB1A, DREB2A; Liu et al., 1998; Nakashima et al., 2009), 9-cis-epoxycarotenoid dioxygenase (NCED3, a key enzyme in the biosynthesis of ABA; Iuchi et al., 2001), and ABA-regulated gene COR47 (COLD-REGULATED 47) belonging to the dehydrin protein family. We also investigated genes whose expression indicates progressive drought stress, DI21 (DROUGHT-INDUCED21; Gosti et al., 1995) and P5CS (delta1-pyrroline-5-carboxylate synthase), which is involved in the biosynthesis of proline but is expressed in the whole plant under water-limiting conditions (Yoshiba et al., 1999). The transcript accumulation of ABA-responsive genes was determined in both watered (Figure 6A; Supplementary Figure S7A) and drought (Figure 6B; Supplementary Figure S7B) conditions in Wt, ftshi3-1(kd), and in the ftshi3-1(Comp-1 and Comp-2) lines. The expression of RD29A, RD29B, RD22, DREB1A, DREB2A, NCED3, DI21, COR47, and P5CS in ftshi3-1(kd) and Wt in watered condition (Figure 6A) and drought conditions (Figure 6B) are shown in relation to the housekeeping gene actin. Under watered conditions, the expression of two ABA-independent genes, DREB1A and DREB2A, were significantly higher in ftshi3-1(kd; Figure 6A). In comparison, DREB1A, but not DREB2A, was significantly upregulated during drought in ftshi3-1(kd) plants relative to Wt (Figure 6B). The expression of other drought-responsive genes RD29A, RD29B, RD22, COR47, NCED3, and P5CS were significantly lower in ftshi3-1(kd) plants compared to Wt in watered and drought conditions. Although the underlying mechanism for these expression patterns is unknown, RD29A, RD29B, RD22, NCED3, DI21, COR47, and P5CS are also markers of progressive drought; except for RD22, all these genes were significantly upregulated in the drought-sensitive Wt compared to ftshi3-1(kd) plants after 12 days of drought (Figure 6B). Expression of RD22, RD29B, NCED3, DI21, and P5CS in the ftshi3-1(Comp-1 and Comp-2) lines was comparable to Wt when grown in either condition (Supplementary Figures S7A,B). These data corroborate our observation that ABA accumulation in ftshi3-1(kd) plants is elevated in watered seedlings and reduced during drought (Figures 4B,C).
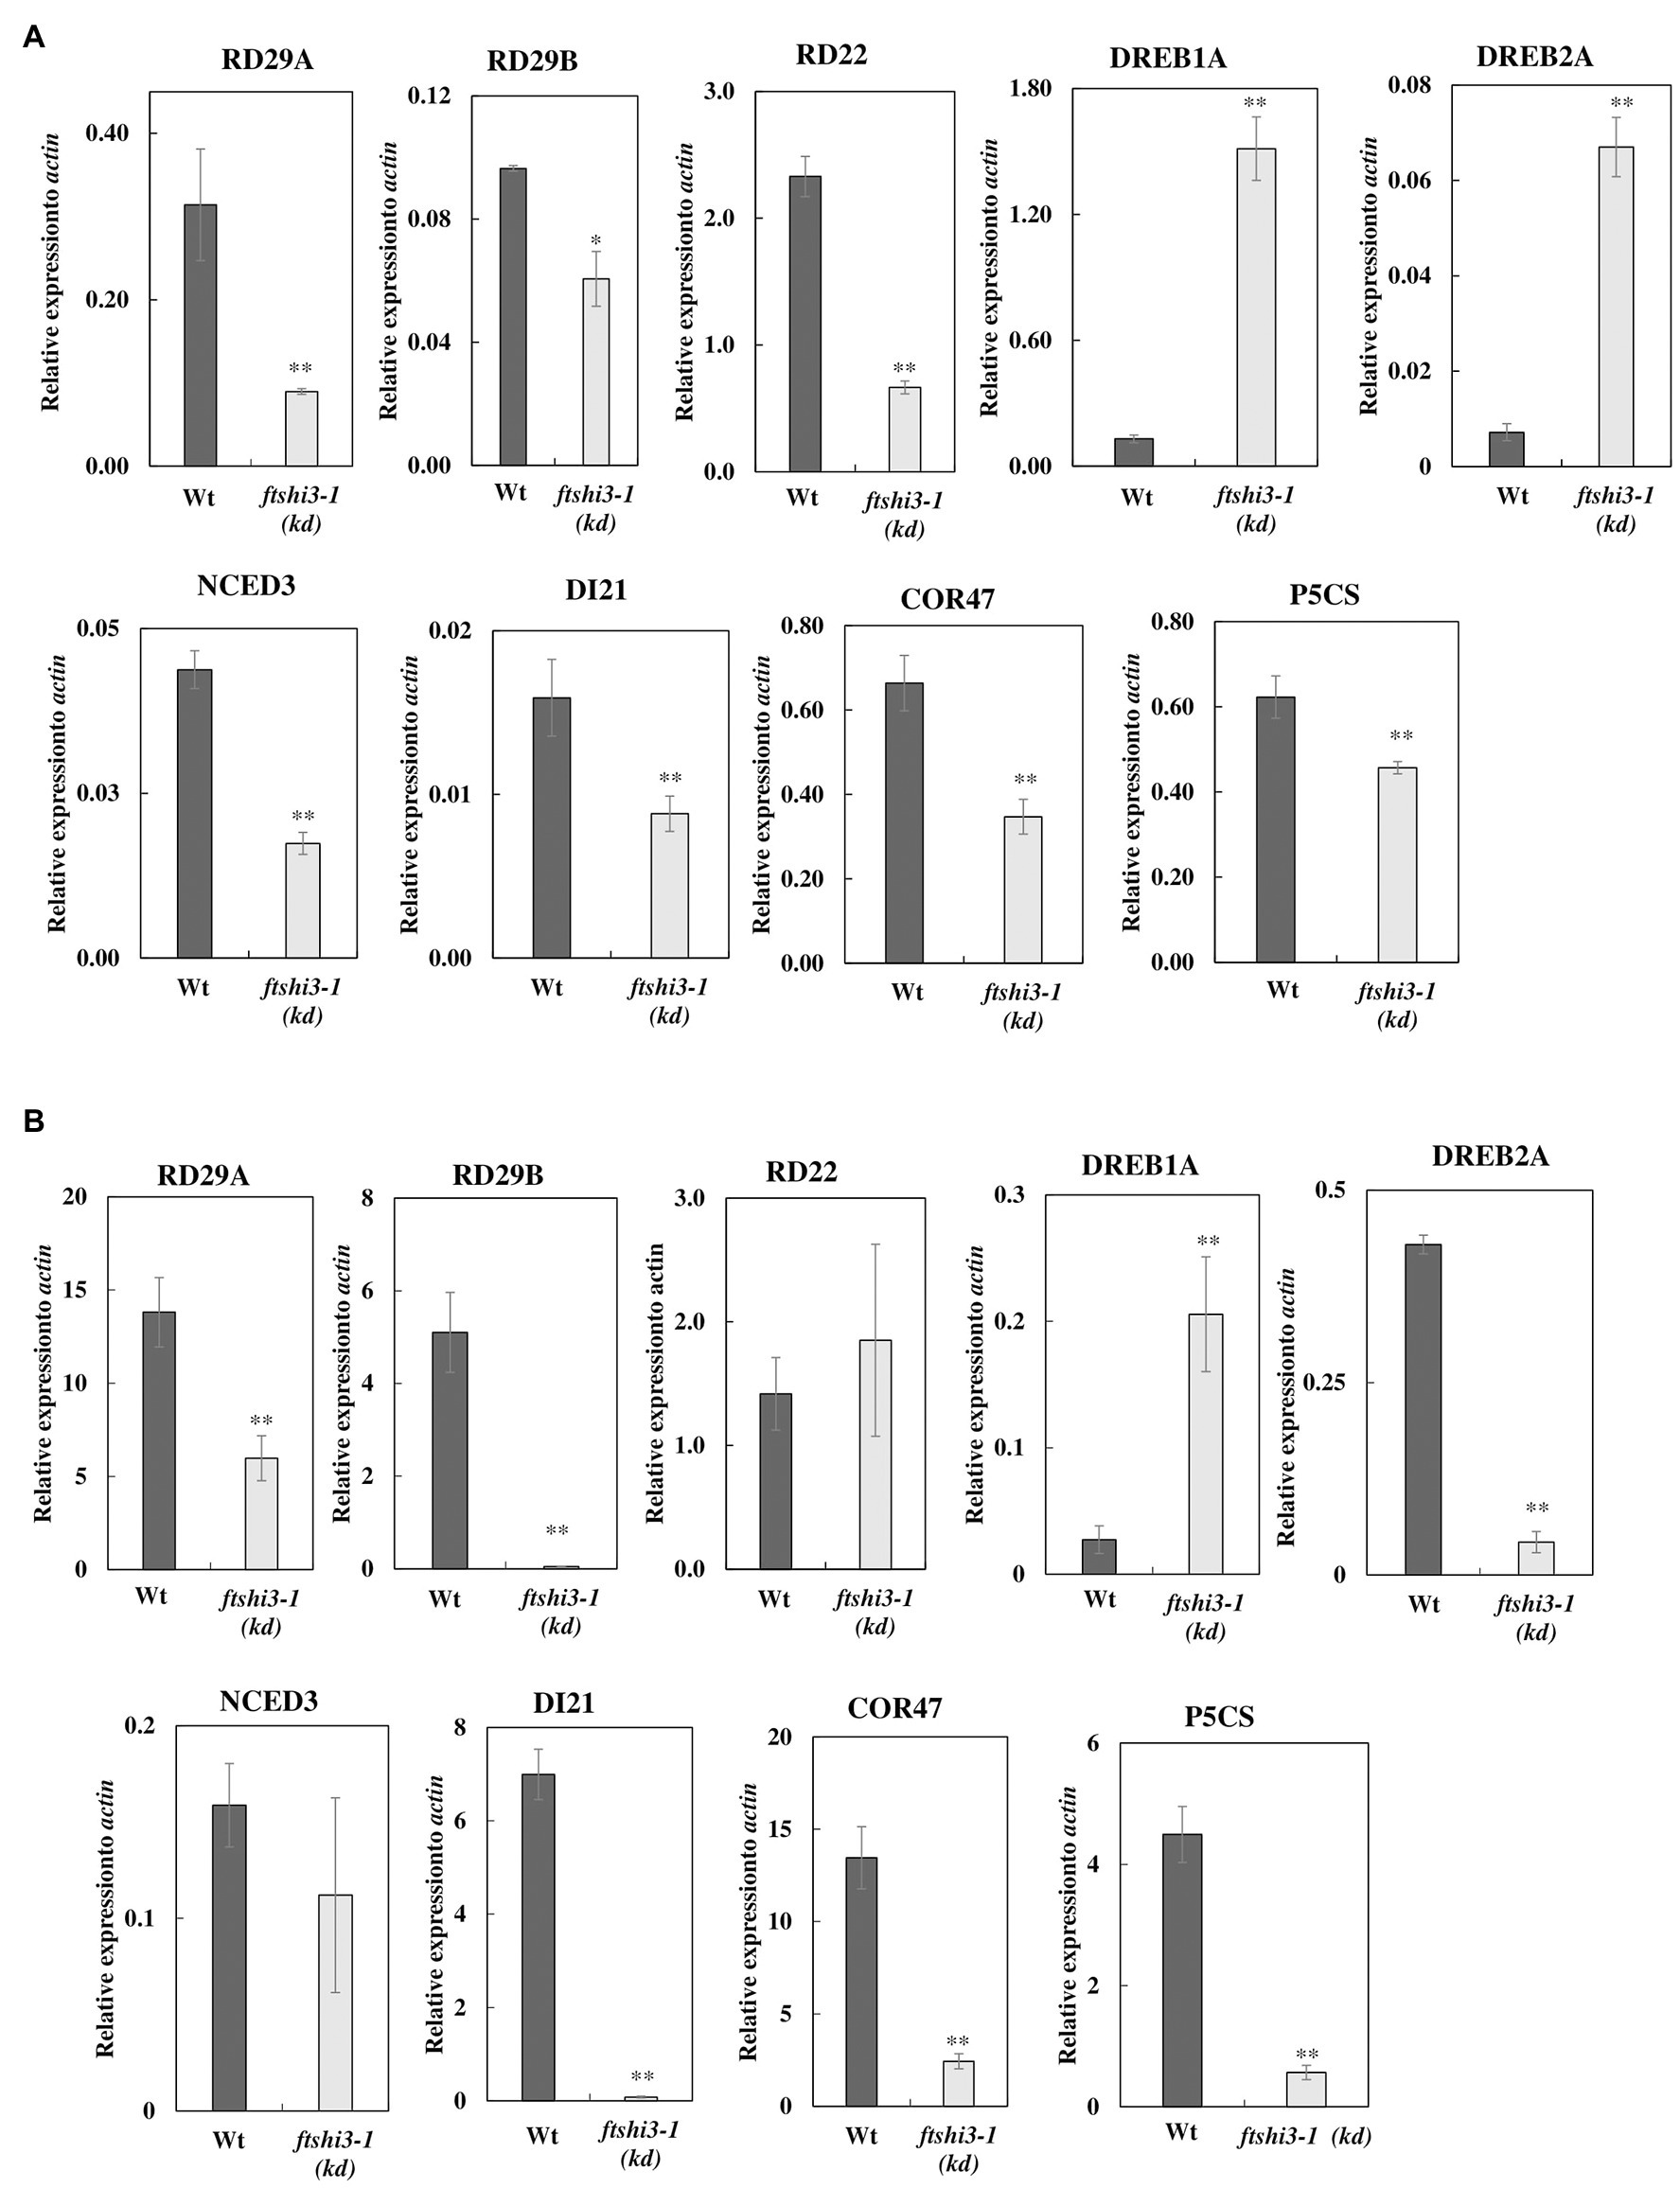
Figure 6. (A) Relative expression of drought-responsive genes in ftshi3-1(kd) in watered conditions. The data were normalized to the expression of genes coding for Arabidopsis, actin. Asterisks indicate significant differences (Student’s t test, *p < 0.05; **p < 0.001, n = 3). (B) Relative expression of drought-responsive genes under drought conditions for 14 days, normalized to the expression of actin. Asterisks indicate significant differences (Student’s t test, **p < 0.001, n = 3). Error bars represent the SE.
MicroRNA Induced Silencing of FtsHi3 Also Generates a Drought-Tolerant Phenotype
We performed drought stress experiments on miRNA-a2/a3/a5/a7 chosen based on their low expression of FTSHi3 (Supplementary Figure S3B). Similar to ftshi3-1(kd) plants, miRNA-a2/a3/a5/a7 plants were drought tolerant (Supplementary Figure S3B, lower panel). Additionally, similar to ftshi3-1(kd), the expression of DREB1A and DREB2A was enhanced in miRNA-a2/a3/a5/a7 plants compared to Wt in watered conditions (Supplementary Figures S3F,G).
We also investigated heterozygous ftshi3-1 T-DNA lines (FTSHi3-1/ftshi3-1; Supplementary Figure S8A). FTSHi3-1/ftshi3-1 lines were genotyped from the batch of seeds obtained from NASC. Similar to ftshi3-1(kd) and miRNA-a2/a3/a5/a7, the heterozygous lines displayed reduced rosette size, lowered FTSHi3 expression similar to the miRNA lines, and non-pale older plants (Supplementary Figures S8A,C–D). When exposed to drought stress, FTSHi3-1/ftshi3-1 lines behaved like ftshi3-1(kd) and miRNA-a2/a3/a5/a7 plants (Supplementary Figures S3B, S8A; Table 1), suggesting that the pleiotropic association of FTSHi3 expression to drought tolerance is not necessarily linked to the pale green phenotype.
ftshi3 (kd) Plants Recruit a Differential Drought-Responsive Bacterial Community Compared to Wt
ftshi3-1(kd) plants display enhanced drought tolerance, reduced root length, and reduced lateral root formation. To test if these phenotypes result in the colonization of distinct root-associated bacteria, watered and drought treatments were applied to Wt, ftshi3-1(kd), and ftshi3-1(Comp-1 and Comp-2) grown in “common garden” trays with a shared soil reservoir. Roots were harvested, and we performed 16S rRNA community profiling. Alpha diversity between genotypes did not vary significantly by treatment (Shannon, F = 0.987, p = 0.458; Figure 7A). However, CAP of Bray-Curtis distances constrained for the interaction between treatment by genotype showed a significant shift in beta diversity (R2 = 0.333, p < 0.001), with CAP1 separating samples by watering treatment (Figure 7B). Pairwise PERMANOVA calculated the separation between samples. Notably, while the aboveground phenotypes of ftshi3-1(kd) are consistent with increased drought tolerance, both ftshi3-1(kd) and Wt recruited significantly different bacterial profiles between watering and drought treatments (Wt, R2 = 0.233, Q = 0.045; ftshi3-1(kd), R2 = 0.273, Q = 0.023), suggesting that ftshi3-1(kd) plants were responding to water stress (Figure 7B; Supplementary Table S4). Further supporting this observation, all genotypes displayed increases in the relative abundance of Actinobacteria under drought (Figure 7C), consistent with drought response in roots (Naylor et al., 2017; Fitzpatrick et al., 2018). While all genotypes demonstrated an increase in the relative abundance of Actinobacteria, drought contributed to distinct bacterial communities between Wt and ftshi3-1(kd; R2 = 0.201, Q = 0.028; Figure 7B; Supplementary Table S4). We performed indicator species analyses to identify genera associated with different watering treatments and/or host genotypes. We identified 43 significant indicators of watered conditions and 87 associated with drought (Dufrene-Legendre, p < 0.05, indcls > 0.5; Figure 7D; Supplementary Table S5). Consistent with the increase in the overall relative abundance of Actinobacteria during drought, all significant indicators belonging to the phyla Actinobacteria were associated with drought (Figure 7D). Compared to watering vs. drought treatments, fewer bacterial indicators were identified for different host genotypes. For example, only a single indicator belonging to the phyla Actinobacteria (Arthrobacter sp.) was found to be explicitly associated with Wt during drought, and none were explicitly associated with ftshi3-1(kd), whereas 19 Actinobacteria indicators were broadly associated with drought treatment rather than a specific host genotype (Figure 7D). However, the drought ftshi3-1(kd) had the largest number of significant indicators of any genotype (n = 12; Figure 7D; Supplementary Table S5), suggesting it harbored the most distinct bacterial community. These data collectively suggest that ftshi3-1(kd) displays drought-tolerant phenotypes in aboveground tissue, while the root-associated bacterial community responds to drought.
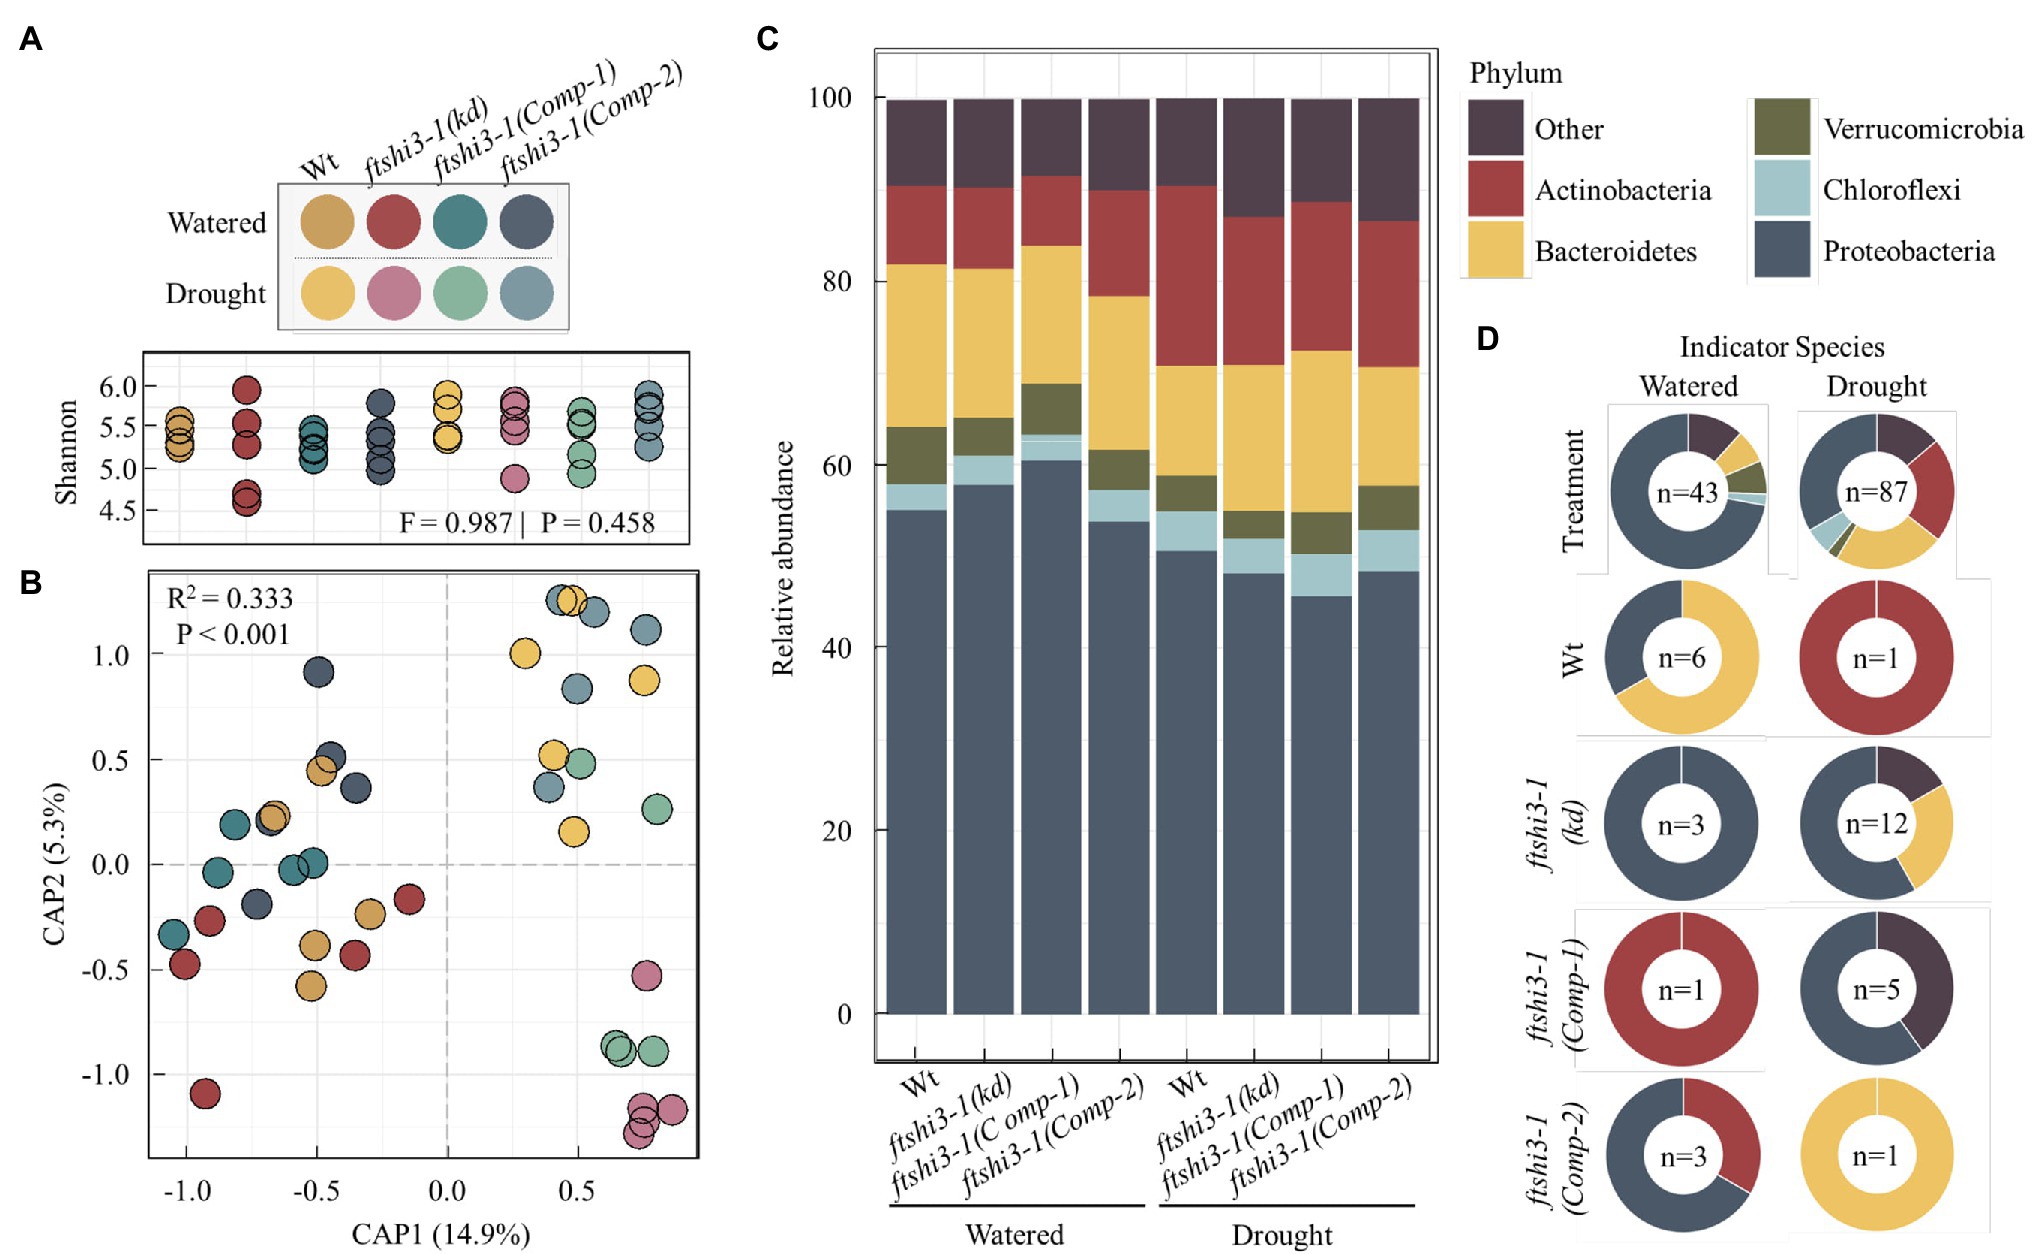
Figure 7. The root-associated bacteria of ftshi3-1(kd) shift under drought. (A) Alpha diversity (Shannon) of root-associated bacteria. Colors depict different watering treatments and host genotypes. (B) Constrained ordination of root-associated bacterial community composition constrained the interaction between treatment and genotype and colored as in (A). (C) The relative abundance of root bacteria at the phylum level. Colors represent the top five phyla. Additional phyla combined as “Other.” (D) Significant bacterial indicators of watering or drought treatment across all genotypes (top two plots) or between all genotypes and treatments (bottom eight plots) identified by Dufrene-Legendre analysis (p < 0.05, indcls > 0.5). The number of significant indicators identified for each group is listed in the center of each chart. Indicators were merged by phyla, with colors representing the top five phyla as in (C).
Discussion
The chloroplast serves as the compartment for photosynthesis and houses, many vital metabolic pathways crucial for various aspects of plant growth and development (Sakamoto et al., 2008). Plants carrying a mutation in a nuclear-encoded, plastid-localized protein, therefore, often display pale-seedling phenotypes (Myouga et al., 2010). Seedlings with reduced amounts or depleted in one of the FtsHi pseudo-protease family members are commonly pale (Kadirjan-Kalbach et al., 2012; Lu et al., 2014; Kikuchi et al., 2018; Schreier et al., 2018; Wang et al., 2018c; Mishra et al., 2019; Schäfer et al., 2019). Contrary to earlier described ftshi3 mutants (Kikuchi et al., 2018; Mishra et al., 2019), ftshi3-1(kd; GK-555D09-021662) showed not only a pale seedling phenotype but also reduced root growth and significant growth reduction through its life span (Figures 1A–G). Chloroplasts of ftshi3-1(kd) plants had aberrant chloroplast ultrastructure. The question, therefore, arises of why the phenotype of ftshi3-1(kd) differs from the ones of ftshi3-2 (Mishra et al., 2019) and FLAG_215F10 (Kikuchi et al., 2018). In ftshi3-1(kd), FTSHi3 transcription was almost absent (Figure 1B), while an expression of 10% remained in ftshi3-2 (Mishra et al., 2019). Therefore, one could speculate that relatively high amounts of FtsHi3 per cell are needed during early seedling development, leading to a pale seedling phenotype even in mutants with moderate expression of the enzyme. However, in adult plants, the amount of FtsHi3 needed for normal development is lower, supporting this hypothesis, and both ftshi3-2 (Mishra et al., 2019) and FLAG_215F10 (Kikuchi et al., 2018) develop into Wt-looking plants. Similarly, our miRNA and heterozygous lines displayed Wt-looking adult plants, while the growth reduction and pale phenotype of ftshi3-1(kd) persist throughout its lifespan.
Another possible explanation of the differences in phenotypes could be the site of transposon insertion (Supplementary Figure S1A). A C2H2(Zn) transcription factor binding site (TFBS) is located in the upstream region of the FTSHi3 gene and at the exact location of the ftshi3-1(kd) T-DNA insertion site (highlighted in Supplementary Figure S1A). PlantPAN 3.0 (Chow et al., 2018) and AthaMap (Hehl et al., 2015) both predicted TFBS for the ZAT members ZAT10, ZAT18 (indicated by red and black triangles), and ZAT2 (indicated by orange circles triangles) on the 5′UTR. C2H2-EAR zinc finger protein Zat10 in Arabidopsis enhances the tolerance of plants to osmotic stress (Mittler et al., 2006). ZAT10 is required for responses to abiotic stress (reviewed by Ciftci-Yilmaz and Mittler, 2008; Han et al., 2020) and can act as both activator and repressor of stress-response genes, especially during drought or osmotic stress (Mittler et al., 2006). We are aware that this TFBS is located within the coding region, but knowledge on TFs is progressing and might provide a probable explanation for the variation of the phenotype between ftshi3-1 (GK-555D09-021662) and ftshi3-2 (GK-723C06_025364) and ftshi3 (FLAG_215F10).
Growth under (semi-)natural conditions is challenging for plants and might affect their Darwinian fitness. While ftshi3-1(kd) could survive the stress arising from challenging field conditions (all 50 plants growing in the field survived), seed dormancy and germination indicated lower Darwinian fitness (Figures 3D,E). Plant hormones like ABA and gibberellins (Finch-Savage and Leubner-Metzger, 2006; Rodríguez-Gacio Mdel et al., 2009) influence seed dormancy and germination; for efficient germination, ABA levels should remain low in germinating seeds (Wang et al., 2018a). ftshi3-1(kd) seedlings (cotyledons and roots) showed significantly higher accumulation of ABA compared to Wt (Figure 4B); the delay in their germination, therefore, might be caused by overaccumulation of ABA. Since elevated ABA enhances the adaptation of plants to various abiotic stresses (Tuteja, 2007), ftshi3-1(kd) plants might be primed to handle abiotic stress better than the Wt (Gunapati et al., 2016; Liu et al., 2019).
Most intriguing was the drought tolerance of ftshi3-1(kd). Exposed to drought stress, the performance of ftshi3-1(kd) was far better than Wt, and the mutant showed signs of drought only after 20 days (Figures 4A,C; Supplementary Figure S5A). ftshi3-1(kd) plants are smaller than Wt; however, we do not believe that the drought tolerance of this mutant is caused only by less water usage. ftshi3-1(kd) displayed drought tolerance also in shared and common trays with Wt (e.g., Supplementary Figures S5B,C) or in “common garden” experiments with soil and water as a shared reservoir between Wt and ftshi3-1(kd; Supplementary Figure S5D). The ftshi3-1(kd) mutant senses drought, as shown by its specific root-associated microbiome. Drought stress has been shown to enrich Actinobacteria within the root microbiome of a broad range of angiosperms (Naylor et al., 2017; Fitzpatrick et al., 2018). Therefore, drought-tolerant ftshi3-1(kd) were predicted to display reduced enrichment of Actinobacteria during drought stress compared to Wt. However, the community composition of all genotypes significantly differed between watering treatments, and similar increases in the relative abundance of Actinobacteria were observed across all genotypes (Figure 7). Furthermore, 95% of drought-associated Actinobacteria identified by indicator species analysis were genotype agnostic (Supplementary Table S5). These data suggest that, while above ground phenotypes of ftshi3-1(kd) are consistent with increased drought tolerance, the root-associated bacterial community of ftshi3-1(kd) during drought treatment responded to water stress.
While our data support a typical drought response of ftshi3-1(kd), the bacterial community composition differed from Wt, particularly during drought. Notably, ABA, which plays an essential role during drought stress tolerance in plants and also antagonises the plant immune system via a salicylic acid-dependent mechanism (Yasuda et al., 2008). Changes in salicylic acid biosynthesis and signaling are known to modulate root-associated colonization of bacteria (Lebeis et al., 2015). We propose that the distinct bacterial community observed in ftshi3-1(kd) during drought is driven by significant differences in ABA accumulation and regulation compared with Wt. If and how these distinct root-associated bacteria contribute to the increased drought tolerance observed in ftshi3-1(kd) will be an interesting avenue for future research.
Abscisic acid concentrations were significantly lower in ftshi3-1(kd) exposed to drought stress than Wt or the complementation lines, indicating a delay in perceiving drought stress above ground. Increased endogenous ABA concentrations are common for drought-stressed plants with closed stomata to prevent intracellular water loss (Radin and Ackerson, 1981; Cutler et al., 2010). Osmotic stress imposed by drought was shown to be transmitted either via an ABA-dependent or an ABA-independent pathway (Yoshida et al., 2014). DREB1A/DREB2A plays an essential role in the ABA-independent acclimation to drought stress (Nakashima et al., 2009). DREB1A and DREB2A are transcription factors that recognize the cis-acting element DRE/CRT, which is involved in gene expression during dehydration (Liu et al., 1998; Nakashima et al., 2009). Among the drought-responsive genes investigated, DREB1A was significantly higher expressed in ftshi3-1(kd) in both watered and drought conditions, while DREB2A was transcribed to a greater extent only in watered conditions (Figures 6A,B). Drought-tolerance of ftshi3-1(kd), therefore, seems to be regulated independently of ABA. Overexpression of DREB1A/DREB2A causes a dwarfed phenotype in transgenic plants (Liu et al., 1998), which is confirmed by ftshi3-1(kd) expressing DREB1A and DREB2A at least four times as high as Wt. The lower transcription of genes associated with progressive drought in ftshi3-1(kd) and the lower accumulation of ABA compared to the drought-sensitive Wt and complementation lines point toward a significant delay of ftshi3-1(kd) plants to sense dehydration above ground. While the lower stomatal density and size is accountable, the decreased stomatal conductance in ftshi3-1(kd) and/or other mechanisms is still to be explored.
Mannitol-induced osmotic stress and treatment with exogenous ABA in seedlings enabled us to understand the responses to abiotic stress at the seedling stage of leaf development (Figures 5B,C). Despite the high natural concentration of ABA in ftshi3-1(kd) seedlings, they responded positively to exogenous ABA treatments and survived better than Wt (Figure 5B); ftshi3-1(kd), therefore, is ABA sensitive. Effects observed on plants after exogenous ABA treatment differ from those induced by endogenous ABA (Okamoto et al., 2010). While ftshi3-1(kd) was able to grow (increase in % of fresh weight) at a concentration of 5 μM exogenous ABA, growth of Wt and the complementation lines was inhibited (Figures 5A–C). This dose- and developmental stage-dependent growth response of ftshi3-1(kd) points toward a semi-sensitivity to ABA (Li et al., 2017; Rosales et al., 2019).
We are the first to show an Arabidopsis mutant with reduced expression of the FtsHi3 pseudo-protease to be drought-tolerant. Detailed analysis of this mutant revealed the accumulation of a drought-specific root-associated microbiome. Enhanced FTSH (but not FTSHi) expression during drought was observed in Zea mays. ZmFTSH6 (Zm00001d037232) was upregulated in the drought-tolerant maize mutant (C7–2t; Zhang et al., 2020); however, transgenic tobacco overexpressing ZmFtsH2A and ZmFtsH2B was found not to be drought-tolerant (Yue et al., 2010). Reduced gene expression of FtsH2 and an FtsH-like was observed in Solanum lycopersicum L. in response to drought stress (Tamburino et al., 2017). A reduced abundance of FtsH proteins was recognized in a susceptible Kentucky bluegrass cultivar exposed to drought stress (Xu and Huang, 2010). Comparing the proteomes of Tibetan wild and cultivated genotypes (drought-tolerant XZ5 and drought-sensitive XZ54 and cv. ZAU3) exposed to drought stress identified the amount of the chloroplast thylakoid-located FtsH1 to remain unchanged in XZ5, while it was diminished in XZ54 and ZAU3 (Wang et al., 2015). Although the molecular mechanisms remain unclear, our findings suggest that ftshi3-1(kd) displayed a drought-tolerant phenotype both in young and adult plants in aboveground tissue, while the root-associated bacterial community responded to drought.
Data Availability Statement
The datasets presented in this study can be found in online repositories. The names of the repository/repositories and accession number(s) can be found in the article/Supplementary Material.
Author Contributions
LM, SM, and DC performed the experiments, involved in the formal analysis, and characterized the mutant plants. DC-D and CF supervised the project. CF conceptualized the project and was responsible for funding acquisition. All authors were involved in writing the manuscript. All authors contributed to the article and approved the submitted version.
Funding
We acknowledge financial support from the Swedish Research Council VR (grant number 2019-04472 to CF) and Umeå University (to CF). Umeå University also supported the visit of LM to UC Berkeley with the Visiting Scholar program under the Berkeley Global engagement scheme.
Conflict of Interest
The authors declare that the research was conducted in the absence of any commercial or financial relationships that could be construed as a potential conflict of interest.
Acknowledgments
We thank the bioinformatics facility of the Umeå Plant Science Center2 for technical support. We are grateful for the help of the KBC electron microscopy platform and the Swedish Metabolomics Center supported by Umeå University and the Swedish University of Agricultural Sciences.
Supplementary Material
The Supplementary Material for this article can be found online at: https://www.frontiersin.org/articles/10.3389/fpls.2021.694727/full#supplementary-material
Footnotes
1. ^http://www.bioinformatics.babraham.ac.uk/projects/fastqc/
2. ^https://www.upsc.se/platforms/upsc-bioinformatics-facility.html
References
Acharya, B. R., Jeon, B. W., Zhang, W., and Assmann, S. M. (2013). Open stomata 1 (OST1) is limiting in abscisic acid responses of Arabidopsis guard cells. New Phytol. 200, 1049–1063. doi: 10.1111/nph.12469
Ahuja, I., de Vos, R. C., Bones, A. M., and Hall, R. D. (2010). Plant molecular stress responses face climate change. Trends Plant Sci. 15, 664–674. doi: 10.1016/j.tplants.2010.08.002
Albertini, A., Simeoni, F., Galbiati, M., Bauer, H., Tonelli, C., and Cominelli, E. (2014). Involvement of the vacuolar processing enzyme γVPE in response of Arabidopsis thaliana to water stress. Biol. Plant. 58, 531–538. doi: 10.1007/s10535-014-0417-6
Berardini, T. Z., Reiser, L., Li, D., Mezheritsky, Y., Muller, R., Strait, E., et al. (2015). The Arabidopsis information resource: making and mining the “gold standard” annotated reference plant genome. Genesis 53, 474–485. doi: 10.1002/dvg.22877
Berger, D., and Altmann, T. (2000). A subtilisin-like serine protease involved in the regulation of stomatal density and distribution in Arabidopsis thaliana. Genes Dev. 14, 1119–1131.
Bittner, L.-M., Arends, J., and Narberhaus, F. (2017). When, how and why? Regulated proteolysis by the essential FtsH protease in Escherichia coli. Biol. Chem. 398, 625–635. doi: 10.1515/hsz-2016-0302
Carini, P., Marsden, P. J., Leff, J. W., Morgan, E. E., Strickland, M. S., and Fierer, N. (2016). Relic DNA is abundant in soil and obscures estimates of soil microbial diversity. Nat. Microbiol. 2:16242. doi: 10.1038/nmicrobiol.2016.242
Chow, C.-N., Lee, T.-Y., Hung, Y.-C., Li, G.-Z., Tseng, K.-C., Liu, Y.-H., et al. (2018). PlantPAN3.0: a new and updated resource for reconstructing transcriptional regulatory networks from ChIP-seq experiments in plants. Nucleic Acids Res. 47, D1155–D1163. doi: 10.1093/nar/gky1081
Ciftci-Yilmaz, S., and Mittler, R. (2008). The zinc finger network of plants. Cell. Mol. Life Sci. 65, 1150–1160. doi: 10.1007/s00018-007-7473-4
Clough, S. J., and Bent, A. F. (1998). Floral dip: a simplified method for agrobacterium-mediated transformation of Arabidopsis thaliana. Plant J. 16, 735–743. doi: 10.1046/j.1365-313x.1998.00343.x
Cutler, S. R., Rodriguez, P. L., Finkelstein, R. R., and Abrams, S. R. (2010). Abscisic acid: emergence of a core signaling network. Annu. Rev. Plant Biol. 61, 651–679. doi: 10.1146/annurev-arplant-042809-112122
Czechowski, T., Stitt, M., Altmann, T., Udvardi, M. K., and Scheible, W.-R. (2005). Genome-wide identification and testing of superior reference genes for transcript normalization in Arabidopsis. Plant Physiol. 139, 5–17. doi: 10.1104/pp.105.063743
Dixon, P. (2003). VEGAN, a package of R functions for community ecology. J. Veg. Sci. 14, 927–930. doi: 10.1111/j.1654-1103.2003.tb02228.x
Dufrêne, M., and Legendre, P. (1997). Species assemblages and indicator species: the need for a flexible asymmetrical approach. Ecol. Monogr. 67, 345–366.
Fanourakis, D., Nikoloudakis, N., Pappi, P., Markakis, E., Doupis, G., Charova, S. N., et al. (2020). The role of proteases in determining stomatal development and tuning pore aperture: a review. Plan. Theory 9:340. doi: 10.3390/plants9030340
Finch-Savage, W. E., and Leubner-Metzger, G. (2006). Seed dormancy and the control of germination. New Phytol. 171, 501–523. doi: 10.1111/j.1469-8137.2006.01787.x
Fitzpatrick, C. R., Copeland, J., Wang, P. W., Guttman, D. S., Kotanen, P. M., and Johnson, M. T. (2018). Assembly and ecological function of the root microbiome across angiosperm plant species. Proc. Natl. Acad. Sci. 115, E1157–E1165. doi: 10.1073/pnas.1717617115
Frenkel, M., Johansson Jänkänpää, H., Moen, J., and Jansson, S. (2008). An illustrated gardener’s guide to transgenic Arabidopsis field experiments. New Phytol. 180, 545–555. doi: 10.1111/j.1469-8137.2008.02591.x
Gosti, F., Bertauche, N., Vartanian, N., and Giraudat, J. (1995). Abscisic acid-dependent and-independent regulation of gene expression by progressive drought in Arabidopsis thaliana. Mol. Gen. Genet. MGG 246, 10–18. doi: 10.1007/BF00290128
Gunapati, S., Naresh, R., Ranjan, S., Nigam, D., Hans, A., Verma, P. C., et al. (2016). Expression of GhNAC2 from G. herbaceum, improves root growth and imparts tolerance to drought in transgenic cotton and Arabidopsis. Sci. Rep. 6:24978. doi: 10.1038/srep24978
Gupta, A., Rico-Medina, A., and Caño-Delgado, A. I. (2020). The physiology of plant responses to drought. Science 368, 266–269. doi: 10.1126/science.aaz7614
Haas, J. C., Vergara, A., Serrano, A. R., Mishra, S., Hurry, V., and Street, N. R. (2021). Candidate regulators and target genes of drought stress in needles and roots of Norway spruce. Tree Physiol. doi: 10.1093/treephys/tpaa178 [Epub ahead of print].
Han, G., Lu, C., Guo, J., Qiao, Z., Sui, N., Qiu, N., et al. (2020). C2H2 zinc finger proteins: master regulators of abiotic stress responses in plants. Front. Plant Sci. 11:115. doi: 10.3389/fpls.2020.594317
Hatsugai, N., Yamada, K., Goto-Yamada, S., and Hara-Nishimura, I. (2015). Vacuolar processing enzyme in plant programmed cell death. Front. Plant Sci. 6:234. doi: 10.3389/fpls.2015.00234
Healey, A., Furtado, A., Cooper, T., and Henry, R. J. (2014). Protocol: a simple method for extracting next-generation sequencing quality genomic DNA from recalcitrant plant species. Plant Methods 10:21. doi: 10.1186/1746-4811-10-21
Hehl, R., Norval, L., Romanov, A., and Bülow, L. (2015). Boosting athaMap database content with data from protein binding microarrays. Plant Cell Physiol. 57:e4. doi: 10.1093/pcp/pcv156
Hellens, R., Mullineaux, P., and Klee, H. (2000). Technical focus: a guide to Agrobacterium binary Ti vectors. Trends Plant Sci. 5, 446–451. doi: 10.1016/S1360-1385(00)01740-4
Huber, W., Carey, V. J., Gentleman, R., Anders, S., Carlson, M., Carvalho, B. S., et al. (2015). Orchestrating high-throughput genomic analysis with bioconductor. Nat. Methods 12, 115–121. doi: 10.1038/nmeth.3252
Iuchi, S., Kobayashi, M., Taji, T., Naramoto, M., Seki, M., Kato, T., et al. (2001). Regulation of drought tolerance by gene manipulation of 9-cis-epoxycarotenoid dioxygenase, a key enzyme in abscisic acid biosynthesis in Arabidopsis. Plant J. 27, 325–333. doi: 10.1046/j.1365-313x.2001.01096.x
Kadirjan-Kalbach, D. K., Yoder, D. W., Ruckle, M. E., Larkin, R. M., and Osteryoung, K. W. (2012). FtsHi1/ARC1 is an essential gene in Arabidopsis that links chloroplast biogenesis and division. Plant J. 72, 856–867. doi: 10.1111/tpj.12001
Kikuchi, S., Asakura, Y., Imai, M., Nakahira, Y., Kotani, Y., Hashiguchi, Y., et al. (2018). A Ycf2-FtsHi heteromeric AAA-ATPase complex is required for chloroplast protein import. Plant Cell 30, 2677–2703. doi: 10.1105/tpc.18.00357
Kleinboelting, N., Huep, G., Kloetgen, A., Viehoever, P., and Weisshaar, B. (2012). GABI-Kat simpleSearch: new features of the Arabidopsis thaliana T-DNA mutant database. Nucleic Acids Res. 40, D1211–D1215. doi: 10.1093/nar/gkr1047
Knudsen, S. (1999). Promoter2. 0: for the recognition of PolII promoter sequences. Bioinformatics 15, 356–361.
Lawrence II, S., Pang, Q., Kong, W., and Chen, S. (2018). Stomata tape-peel: An improved method for guard cell sample preparation. J. Vis. Exp. 137:e57422. doi: 10.3791/57422
Lebeis, S. L., Paredes, S. H., Lundberg, D. S., Breakfield, N., Gehring, J., Mcdonald, M., et al. (2015). Salicylic acid modulates colonization of the root microbiome by specific bacterial taxa. Science 349, 860–864. doi: 10.1126/science.aaa8764
Li, H. (2013). Aligning sequence reads, clone sequences and assembly contigs with BWA-MEM. arXiv [Preprint]. Available at: https://arxiv.org/abs/1303.3997 (Accessed 26 May, 2013).
Li, X., Chen, L., Forde, B. G., and Davies, W. J. (2017). The biphasic root growth response to abscisic acid in Arabidopsis involves interaction with ethylene and auxin signalling pathways. Front. Plant Sci. 8:1493. doi: 10.3389/fpls.2017.01493
Liu, Q., Kasuga, M., Sakuma, Y., Abe, H., Miura, S., Yamaguchi-Shinozaki, K., et al. (1998). Two transcription factors, DREB1 and DREB2, with an EREBP/AP2 DNA binding domain separate two cellular signal transduction pathways in drought- and low-temperature-responsive gene expression, respectively, in Arabidopsis. Plant Cell 10, 1391–1406. doi: 10.1105/tpc.10.8.1391
Liu, Y., Qin, L., Han, L., Xiang, Y., and Zhao, D. (2015). Overexpression of maize SDD1 (ZmSDD1) improves drought resistance in Zea mays L. by reducing stomatal density. Plant Cell Tissue Org. Cult. 122, 147–159. doi: 10.1007/s11240-015-0757-8
Liu, X.-L., Zhang, H., Jin, Y.-Y., Wang, M.-M., Yang, H.-Y., Ma, H.-Y., et al. (2019). Abscisic acid primes rice seedlings for enhanced tolerance to alkaline stress by upregulating antioxidant defense and stress tolerance-related genes. Plant Soil 438, 39–55. doi: 10.1007/s11104-019-03992-4
Lu, W., Deng, M., Guo, F., Wang, M., Zeng, Z., Han, N., et al. (2016). Suppression of OsVPE3 enhances salt tolerance by attenuating vacuole rupture during programmed cell death and affects stomata development in rice. Rice 9:65. doi: 10.1186/s12284-016-0138-x
Lu, X., Zhang, D., Li, S., Su, Y., Liang, Q., Meng, H., et al. (2014). FtsHi4 is essential for embryogenesis due to its influence on chloroplast development in Arabidopsis. PLoS One 9:e99741. doi: 10.1371/journal.pone.0115776
Mcmurdie, P. J., and Holmes, S. (2013). Phyloseq: an R package for reproducible interactive analysis and graphics of microbiome census data. PLoS One 8:e61217. doi: 10.1371/journal.pone.0061217
Mishra, Y., Jänkänpää, H. J., Kiss, A. Z., Funk, C., Schröder, W. P., and Jansson, S. (2012). Arabidopsisplants grown in the field and climate chambers significantly differ in leaf morphology and photosystem components. BMC Plant Biol. 12:6. doi: 10.1186/1471-2229-12-6
Mishra, L. S., Kim, S.-Y., Caddell, D. F., Coleman-Derr, D., and Funk, C. (2020). Loss of Arabidopsis matrix metalloproteinase-5 affects root development and root bacterial communities during drought stress. Physiol. Plant. 172, 1045–1058. doi: 10.1111/ppl.13299
Mishra, L. S., Mielke, K., Wagner, R., and Funk, C. (2019). Reduced expression of the proteolytically inactive FtsH members has impacts on the Darwinian fitness of Arabidopsis thaliana. J. Exp. Bot. 70, 2173–2184. doi: 10.1093/jxb/erz004
Mittler, R., Kim, Y., Song, L., Coutu, J., Coutu, A., Ciftci-Yilmaz, S., et al. (2006). Gain- and loss-of-function mutations in Zat10 enhance the tolerance of plants to abiotic stress. FEBS Lett. 580, 6537–6542. doi: 10.1016/j.febslet.2006.11.002
Morales-Navarro, S., Perez-Diaz, R., Ortega, A., De Marcos, A., Mena, M., Fenoll, C., et al. (2018). Overexpression of a SDD1-Like gene From wild tomato decreases Stomatal density and enhances dehydration avoidance in Arabidopsis and cultivated tomato. Front. Plant Sci. 9:940. doi: 10.3389/fpls.2018.00940
Murashige, T., and Skoog, F. (1962). A revised medium for rapid growth and bio assays with tobacco tissue cultures. Physiol. Plant. 15, 473–497. doi: 10.1111/j.1399-3054.1962.tb08052.x
Myouga, F., Akiyama, K., Motohashi, R., Kuromori, T., Ito, T., Iizumi, H., et al. (2010). The chloroplast function database: a large-scale collection of Arabidopsis ds/Spm-or T-DNA-tagged homozygous lines for nuclear-encoded chloroplast proteins, and their systematic phenotype analysis. Plant J. 61, 529–542. doi: 10.1111/j.1365-313X.2009.04074.x
Nakashima, K., Ito, Y., and Yamaguchi-Shinozaki, K. (2009). Transcriptional regulatory networks in response to abiotic stresses in Arabidopsis and grasses. Plant Physiol. 149, 88–95. doi: 10.1104/pp.108.129791
Naylor, D., Degraaf, S., Purdom, E., and Coleman-Derr, D. (2017). Drought and host selection influence bacterial community dynamics in the grass root microbiome. ISME J. 11, 2691–2704. doi: 10.1038/ismej.2017.118
Nishimura, K., Kato, Y., and Sakamoto, W. (2016). Chloroplast proteases: updates on proteolysis within and across suborganellar compartments. Plant Physiol. 171, 2280–2293. doi: 10.1104/pp.16.00330
O’malley, R. C., Barragan, C. C., and Ecker, J. R. (2015). “A user’s guide to the Arabidopsis T-DNA insertion mutant collections,” in Plant Functional Genomics. eds. J. M. Alonso and A. N. Stepanova (New York, NY: Humana Press), 323–342.
Obenchain, V., Lawrence, M., Carey, V., Gogarten, S., Shannon, P., and Morgan, M. (2014). VariantAnnotation: a bioconductor package for exploration and annotation of genetic variants. Bioinformatics 30, 2076–2078. doi: 10.1093/bioinformatics/btu168
Okamoto, M., Tatematsu, K., Matsui, A., Morosawa, T., Ishida, J., Tanaka, M., et al. (2010). Genome-wide analysis of endogenous abscisic acid-mediated transcription in dry and imbibed seeds of Arabidopsis using tiling arrays. Plant J. 62, 39–51. doi: 10.1111/j.1365-313X.2010.04135.x
Porra, R., Thompson, W., and Kriedemann, P. (1989). Determination of accurate extinction coefficients and simultaneous equations for assaying chlorophylls a and b extracted with four different solvents: verification of the concentration of chlorophyll standards by atomic absorption spectroscopy. Biochim. Biophys. Acta Bioenerg. 975, 384–394.
Radin, J. W., and Ackerson, R. C. (1981). Water relations of cotton plants under nitrogen deficiency: III. Stomatal conductance, photosynthesis, and abscisic acid accumulation during drought. Plant Physiol. 67, 115–119. doi: 10.1104/pp.67.1.115
Roberts, D. W. (2007). labdsv: Ordination and multivariate analysis for ecology. R package version 1.
Rodríguez-Gacio Mdel, C., Matilla-Vázquez, M. A., and Matilla, A. J. (2009). Seed dormancy and ABA signaling: the breakthrough goes on. Plant Signal. Behav. 4, 1035–1049. doi: 10.4161/psb.4.11.9902
Rosales, M. A., Maurel, C., and Nacry, P. (2019). Abscisic acid coordinates dose-dependent developmental and hydraulic responses of roots to water deficit. Plant Physiol. 180:2198. doi: 10.1104/pp.18.01546
Sah, S. K., Reddy, K. R., and Li, J. (2016). Abscisic acid and abiotic stress tolerance in crop plants. Front. Plant Sci. 7:571. doi: 10.3389/fpls.2016.00571
Sakamoto, W., Miyagishima, S.-Y., and Jarvis, P. (2008). Chloroplast biogenesis: control of plastid development, protein import, division and inheritance. Arabidopsis Book 6: e0110. doi: 10.1199/tab.0110
Schäfer, P., Helm, S., Köhler, D., Agne, B., and Baginsky, S. (2019). Consequences of impaired 1-MDa TIC complex assembly for the abundance and composition of chloroplast high-molecular mass protein complexes. PLoS One 14:e0213364. doi: 10.1371/journal.pone.0213364
Schreier, T. B., Cléry, A., Schläfli, M., Galbier, F., Stadler, M., Demarsy, E., et al. (2018). Plastidial NAD-dependent malate dehydrogenase: a moonlighting protein involved in early chloroplast development through its interaction with an FtsH12-FtsHi protease complex. Plant Cell 30, 1745–1769. doi: 10.1105/tpc.18.00121
Schwab, R., Ossowski, S., Riester, M., Warthmann, N., and Weigel, D. (2006). Highly specific gene silencing by artificial microRNAs in Arabidopsis. Plant Cell 18, 1121–1133. doi: 10.1105/tpc.105.039834
Shinozaki, K., and Yamaguchi-Shinozaki, K. (2006). Gene networks involved in drought stress response and tolerance. J. Exp. Bot. 58, 221–227. doi: 10.1093/jxb/erl164
Simmons, T., Caddell, D. F., Deng, S., and Coleman-Derr, D. (2018). Exploring the root microbiome: extracting bacterial community data from the soil, rhizosphere, and root endosphere. J. Vis. Exp. 135:e57561. doi: 10.3791/57561
Simmons, T., Styer, A. B., Pierroz, G., Goncalves, A. P., Pasricha, R., Hazra, A. B., et al. (2020). Drought drives spatial variation in the millet root microbiome. Front. Plant Sci. 11:599. doi: 10.3389/fpls.2020.00599
Smakowska, E., Czarna, M., and Janska, H. (2014). Mitochondrial ATP-dependent proteases in protection against accumulation of carbonylated proteins. Mitochondrion 19, 245–251. doi: 10.1016/j.mito.2014.03.005
Sokolenko, A., Pojidaeva, E., Zinchenko, V., Panichkin, V., Glaser, V. M., Herrmann, R. G., et al. (2002). The gene complement for proteolysis in the cyanobacterium Synechocystis sp. PCC 6803 and Arabidopsis thaliana chloroplasts. Curr. Genet. 41, 291–310. doi: 10.1007/s00294-002-0309-8
Tamburino, R., Vitale, M., Ruggiero, A., Sassi, M., Sannino, L., Arena, S., et al. (2017). Chloroplast proteome response to drought stress and recovery in tomato (Solanum lycopersicum L.). BMC Plant Biol. 17:40. doi: 10.1186/s12870-017-0971-0
Tomeo, N. J., and Rosenthal, D. M. (2018). Photorespiration differs among Arabidopsis thaliana ecotypes and is correlated with photosynthesis. J. Exp. Bot. 69, 5191–5204. doi: 10.1093/jxb/ery274
Tuteja, N. (2007). Abscisic acid and abiotic stress signaling. Plant Signal. Behav. 2, 135–138. doi: 10.4161/psb.2.3.4156
Van Der Auwera, G. A., Carneiro, M. O., Hartl, C., Poplin, R., Del Angel, G., Levy-Moonshine, A., et al. (2013). From FastQ data to high confidence variant calls: the genome analysis toolkit best practices pipeline. Curr. Protoc. Bioinformatics 43, 11.10.1–11 10 33. doi: 10.1002/0471250953.bi1110s43
Vaseva, I., Sabotič, J., Sustar-Vozlic, J., Meglic, V., Kidrič, M., Demirevska, K., et al. (2011). “The response of plants to drought stress: the role of dehydrins, chaperones, proteases and protease inhibitors in maintaining cellular protein function,” in Droughts: New Research. eds. D. F. Neves and J. D. Sanz (Hauppauge, NY, USA: Nova Science Publishers, Inc), 1–46.
Vorster, B. J., Cullis, C. A., and Kunert, K. J. (2019). Plant vacuolar processing enzymes. Front. Plant Sci. 10:479. doi: 10.3389/fpls.2019.00479
Wagner, R., Aigner, H., and Funk, C. (2012). FtsH proteases located in the plant chloroplast. Physiol. Plant. 145, 203–214. doi: 10.1111/j.1399-3054.2011.01548.x
Wang, Q., Guo, Q., Guo, Y., Yang, J., Wang, M., Duan, X., et al. (2018b). Arabidopsis subtilase SASP is involved in the regulation of ABA signaling and drought tolerance by interacting with OPEN STOMATA 1. J. Exp. Bot. 69, 4403–4417. doi: 10.1093/jxb/ery205
Wang, M., Lee, J., Choi, B., Park, Y., Sim, H. J., Kim, H., et al. (2018a). Physiological and molecular processes associated with long duration of ABA treatment. Front. Plant Sci. 9:176. doi: 10.3389/fpls.2018.00176
Wang, T., Li, S., Chen, D., Xi, Y., Xu, X., Ye, N., et al. (2018c). Impairment of FtsHi5 function affects cellular redox balance and photorespiratory metabolism in Arabidopsis. Plant Cell Physiol. 59, 2526–2535. doi: 10.1093/pcp/pcy174
Wang, N., Zhao, J., He, X., Sun, H., Zhang, G., and Wu, F. (2015). Comparative proteomic analysis of drought tolerance in the two contrasting Tibetan wild genotypes and cultivated genotype. BMC Genomics 16:432. doi: 10.1186/s12864-015-1657-3
Xu, C., and Huang, B. (2010). Comparative analysis of drought responsive proteins in Kentucky bluegrass cultivars contrasting in drought tolerance. Crop Sci. 50, 2543–2552. doi: 10.2135/cropsci2010.03.0152
Xu, L., Naylor, D., Dong, Z., Simmons, T., Pierroz, G., Hixson, K. K., et al. (2018). Drought delays development of the sorghum root microbiome and enriches for monoderm bacteria. Proc. Natl. Acad. Sci. 115, E4284–E4293. doi: 10.1073/pnas.1717308115
Yasuda, M., Ishikawa, A., Jikumaru, Y., Seki, M., Umezawa, T., Asami, T., et al. (2008). Antagonistic interaction between systemic acquired resistance and the abscisic acid–mediated abiotic stress response in Arabidopsis. Plant Cell 20, 1678–1692. doi: 10.1105/tpc.107.054296
Yoo, C. Y., Pence, H. E., Jin, J. B., Miura, K., Gosney, M. J., Hasegawa, P. M., et al. (2010). The Arabidopsis GTL1 transcription factor regulates water use efficiency and drought tolerance by modulating stomatal density via transrepression of SDD1. Plant Cell 22, 4128–4141. doi: 10.1105/tpc.110.078691
Yoshiba, Y., Nanjo, T., Miura, S., Yamaguchi-Shinozaki, K., and Shinozaki, K. (1999). Stress-responsive and developmental regulation of Delta(1)-pyrroline-5-carboxylate synthetase 1 (P5CS1) gene expression in Arabidopsis thaliana. Biochem. Biophys. Res. Commun. 261, 766–772. doi: 10.1006/bbrc.1999.1112
Yoshida, T., Mogami, J., and Yamaguchi-Shinozaki, K. (2014). ABA-dependent and ABA-independent signaling in response to osmotic stress in plants. Curr. Opin. Plant Biol. 21, 133–139. doi: 10.1016/j.pbi.2014.07.009
Yue, G., Hu, X., He, Y., Yang, A., and Zhang, J. (2010). Identification and characterization of two members of the FtsH gene family in maize (Zea mays L.). Mol. Biol. Rep. 37, 855–863. doi: 10.1007/s11033-009-9691-3
Keywords: drought, filamentation temperature-sensitive H protease, root microbiome, abscisic acid, Arabidopis thaliana, chloroplast
Citation: Mishra LS, Mishra S, Caddell DF, Coleman-Derr D and Funk C (2021) The Plastid-Localized AtFtsHi3 Pseudo-Protease of Arabidopsis thaliana Has an Impact on Plant Growth and Drought Tolerance. Front. Plant Sci. 12:694727. doi: 10.3389/fpls.2021.694727
Edited by:
Vicent Arbona, University of Jaume I, SpainReviewed by:
Mika Teranishi, Tohoku University, JapanKazuo Nakashima, Japan International Research Center for Agricultural Sciences (JIRCAS), Japan
Copyright © 2021 Mishra, Mishra, Caddell, Coleman-Derr and Funk. This is an open-access article distributed under the terms of the Creative Commons Attribution License (CC BY). The use, distribution or reproduction in other forums is permitted, provided the original author(s) and the copyright owner(s) are credited and that the original publication in this journal is cited, in accordance with accepted academic practice. No use, distribution or reproduction is permitted which does not comply with these terms.
*Correspondence: Christiane Funk, christiane.funk@umu.se
†These authors have contributed equally to this work