 Joseph A. Fisher1,2
 David J. Mikulis3,4,5*
- 1Department of Physiology, University of Toronto, Toronto, ON, Canada
- 2Department of Anaesthesia and Pain Management, University Health Network, University of Toronto, Toronto, ON, Canada
- 3Joint Department of Medical Imaging and the Functional Neuroimaging Lab, University Health Network, Toronto, ON, Canada
- 4The Joint Department of Medical Imaging, Toronto Western Hospital, University of Toronto, Toronto, ON, Canada
- 5Techna Institute & Koerner Scientist in MR Imaging, University Health Network, Toronto, ON, Canada
The brain is a neurovascular organ. A stimulus-response approach is effective in interrogating the physiology of its vasculature. Ideally, the stimulus is standardized across patients, and in a single patient over time. We developed a standard stimulus and attempted to measure, classify, and interpret the many forms of responses. Over the past 20 years, our work has delivered nuanced insights into normal cerebral vascular physiology, as well as adaptive physiological responses in the presence of disease. The trajectory of our understanding did not follow a logical linear progression; rather, it emerged as a coalescence of new, old, and previously dismissed, ideas that had accumulated over time. In this essay, we review what we believe were our most valuable – and sometimes controversial insights during our two decades-long journey.
Overview
Brain vascular health relates to a fundamental ability of the cerebrovascular system to match blood flow to tissue demand. This includes providing oxygen and nutrients as well as eliminating metabolic waste. Cerebrovascular physiology has evolved to maintain this supply in the face of reduced perfusion pressure through autoregulation or, when needed, to provide a surge in supply through neurovascular coupling (Willie et al., 2014). The vascular mechanisms affecting these functions are highly coordinated and very effective in health. However, the mechanisms can be compromised under a variety of conditions that harm vessels or reroute blood flow, including steno-occlusive processes, emboli, thrombosis, vascular malformations, tumors, and vasculitis. Under such conditions, adequate perfusion can be restored only when blood flow bypasses the impediment via an alternate route, referred to as collateral blood supply (Moody et al., 1990; Sobczyk et al., 2020; reviewed in Sheth and Liebeskind, 2015; Figure 1). In the case of upstream obstructions, there is the potential for trophic forces to stimulate the development of new vessels especially in the setting of slowly progressive occlusions as in moyamoya (Scott and Smith, 2009).
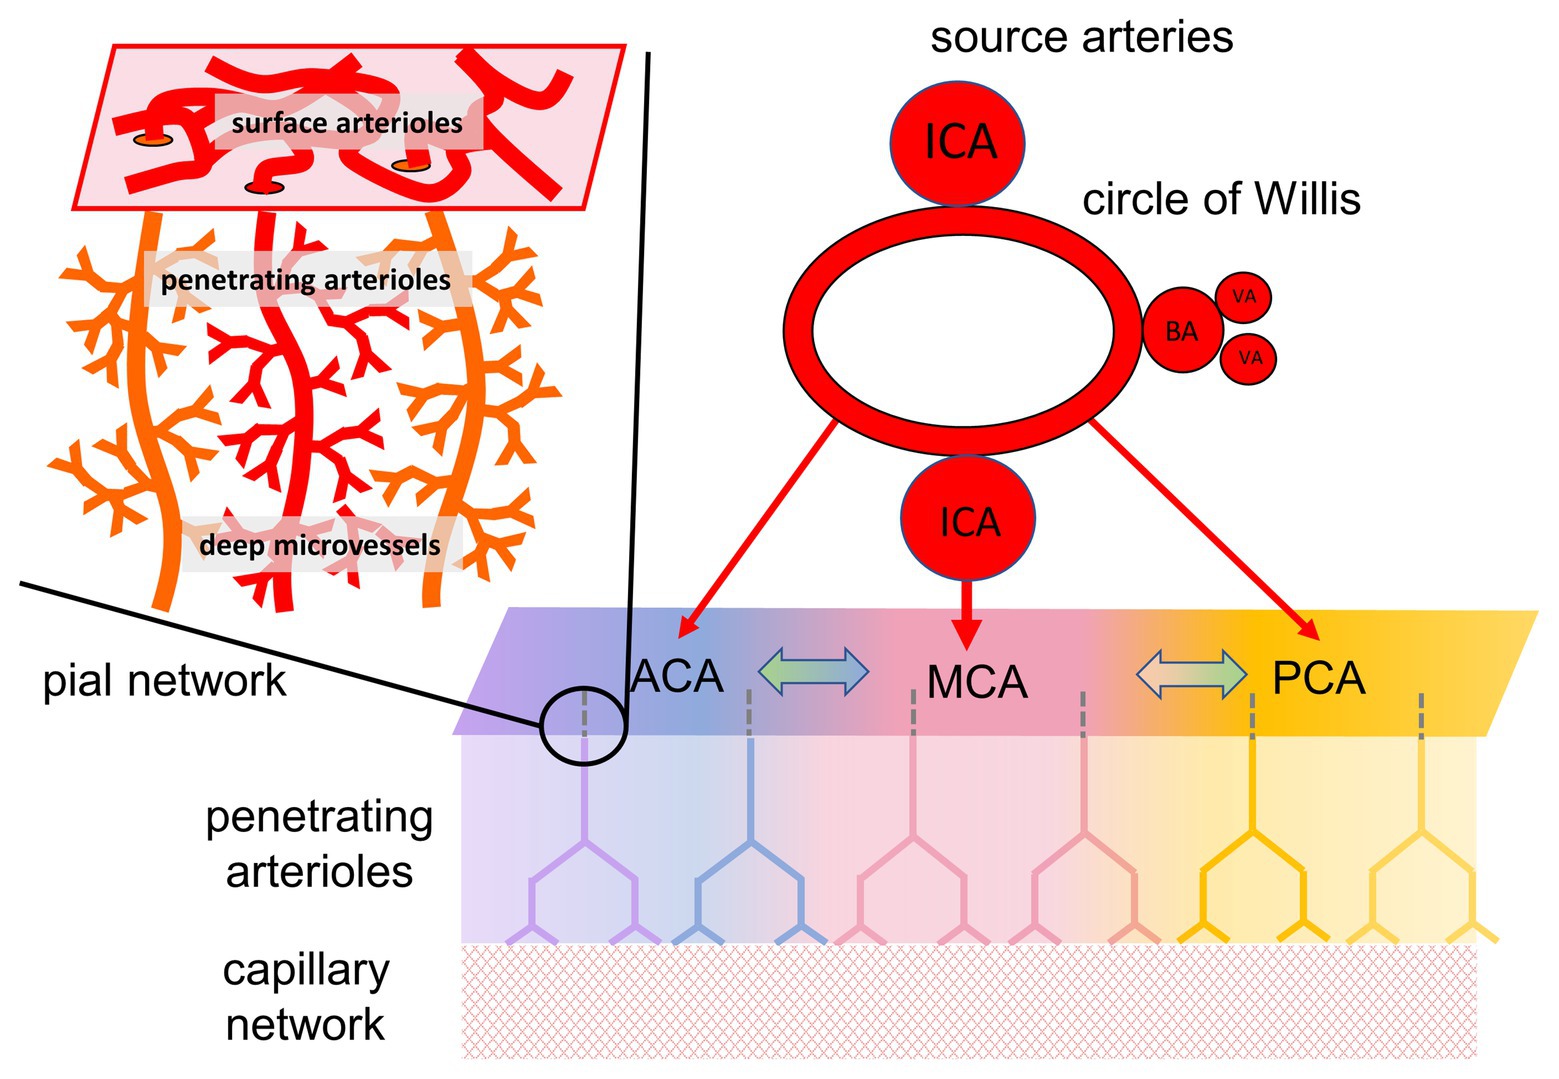
Figure 1. Organization of cerebral blood flow (CBF) and collateral blood flow. CBF is supplied by four extracranial arteries originating from the aortic arch and subclavian arteries, the internal carotid arteries (ICA), and the vertebral arteries (VA). The latter joining to form the basilar artery (BA). Intracranially, these arteries anastomose around the circle of Willis, and separate into the major intracranial vessels perfusing each hemisphere: the anterior cerebral artery (ACA), middle cerebral artery (MCA), and posterior cerebral artery (PCA). Although there are multiple anastomoses between the major cerebral vascular territories, the blood supply to each territory, in baseline states, comes predominantly from its overlying artery (illustrated by color coding). In the case of partial or complete blockage of one of the cerebral arteries, the availability of blood flow depends on the ability to recruit collateral pathways. Figure modified from Fisher et al. (2018).
The status of collateral blood flow is of particular interest in the presence of known large artery steno-occlusive lesions, especially if accompanied by transient neurological symptoms. Such collateral flow may not be reliably detected by angiography (Ben Hassen et al., 2019). Collateral vessels may not contribute to perfusion if downstream tissue requirements are met via the native pathways. Furthermore, the collateral flow passing through tissue arterioles, and capillaries (Moody et al., 1990) is below the resolution of clinical imaging modalities, visible only as a contrast blush on angiography, and exceptionally difficult to quantify. One can, however, follow changes in tissue perfusion through its effect on tissue oxygenation as reflected by the capillary deoxyhemoglobin concentration and its effect on the MRI blood oxygen-level dependent (BOLD) signal.
To test for the presence of effective collateral blood flow distal to a steno-occlusive lesion, a vasodilatory challenge must be applied to the system while observing changes in surrogates of blood flow, like the BOLD signal, in the vascular territory of the compromised supply vessel(s). We typically apply an increase in the arterial partial pressure of carbon dioxide (PaCO2) to induce global dilation in the cerebral vasculature and observe the patterns of changes in cerebral blood flow (CBF). Assuming tissue metabolic activity remains unchanged (Chen and Pike, 2010a), any changes in BOLD signal reflect predominantly changes in blood flow. The change in BOLD (Δ BOLD), normalized for the change in the stimulus (Δ PaCO2), is termed cerebrovascular reactivity (CVR).
Hypercapnia can more than double the resting brain blood flow (Lassen, 1959). Interestingly, the limiting factor in the increase in CBF is the inflow capacity of the extracranial carotid and vertebral arteries (Faraci and Heistad, 1990), in effect setting dilating downstream intracranial vessels in competition for the inflow. In health, hypercapnia-induced regional reductions in resistance are balanced among vessels and vascular territories, resulting in an orderly distribution of blood flow throughout the brain (Bhogal et al., 2014). But in the presence of localized hemodynamic disturbance, such as with a steno-occlusive lesion, localized vasculitis, and other structural or metabolic disorders, global cerebral vasostimulation exposes and amplifies the imbalances in flow distribution. The patterns of flow distribution reflect the summed effects of (i) the strength of the stimulus, (ii) the upstream hemodynamic impediment, (iii) the residual local (downstream) vasodilatory reserves, and (iv) the downstream vasculature’s access to collateral flow pathways. When we began these studies at the turn of the millennium, we could not sort out these effectors, and we were left to observe a variety disrupted flow patterns in patients with cerebrovascular impairment. We nevertheless remained determined to assemble such observations and over time, conceptually order them, and reorder them, into a chain of adaptive processes that reveal new insights into neurovascular physiology, and explain the pathophysiology of disease. In the following section, we will review some of the highlights of this journey.
Cerebrovascular Reactivities
Basic Cerebrovascular Reactivity
On the most basic level, CVR performed with MRI follows a voxel-wise Δ BOLD normalized to the vasoactive stimulus, Δ PaCO2. The limitations of Δ BOLD, as a surrogate of Δ flow have been discussed at length elsewhere (Hoge et al., 1999; Chiarelli et al., 2007; Fierstra et al., 2018). We, like many others, initially made the simplifying assumption that Δ BOLD reflects the change in flow in vessels within each voxel and, therefore, the underlying change in their vascular diameter. We ignored changes in perfusion pressure which, in any event, we could not measure. In the work of other contemporary laboratories, CVR was reported as only the amplitude of response to a stimulus, Δ BOLD, while the magnitude of the stimulus, Δ PaCO2, was unknown, e.g., with breath-holding, and carbogen administration (Mark et al., 2010; Fisher, 2016), or resulting from intravenously administered acetazolamide (reviewed in Fierstra et al., 2013).
We began our studies around 1997 by studying patients with cerebrovascular steno-occlusive disease. The sought-after stimulus at that time was square wave “boxcar” changes in end-tidal PCO2 (PETCO2) to minimize the effect of the known drift of baseline BOLD signal (Vesely et al., 2001), a solution used in functional MRI. Our focus then was to use the reductions in BOLD signal in the territory distal to the vascular occlusion as a biomarker of the severity of hemodynamic compromise. The reduction in flow was referred to as “vascular steal” (Brawley, 1968; Symon, 1968) analogous to “subclavian steal” (Reivich et al., 1961). Over the next decades, steal was considered a sign of increased vulnerability to ischemic stroke (Markus and Cullinane, 2001; Reinhard et al., 2008; Gupta et al., 2012) with the potential to inform decisions about patient management. During this time, we sorted through a number of confounders. The puzzling “steal” seen over the ventricles was eventually explained by Thomas et al. (2013). We also found that various aspects of the stimulus influenced the flow pattern: size of the stimulus (Δ PETCO2), baseline PETCO2, direction of PETCO2 change, rate of change of PETCO2, and others (Sobczyk et al., 2014).
From the time of our earliest investigations, we were troubled that the extent and severity of steal did not always match the degree of stenosis in large vessels. Indeed, we were puzzled by patients with totally occlusive vascular lesions on angiography, but little or no steal, and few or no symptoms. Our working hypothesis was that, in these patients, the blood was bypassing the stenosis and arriving at the parenchyma via another route, i.e., collateral flow (McVerry et al., 2012; Alves et al., 2016; Fisher et al., 2018; Figure 2). This hypothesis was investigated in our laboratory by Sobczyk in a series of studies that were part of her doctoral dissertation.2 She has recently published additional supportive data that challenges the traditional role of the measurement of residual lumen diameter as the primary determinant of stroke risk (Sobczyk et al., 2020). The main implication of this collective work is that the presence of effective collateral flow, rather than the degree of carotid artery narrowing, explains why CVR more accurately predicts the risk of stroke than degree of stenosis alone (Gupta et al., 2012; Reinhard et al., 2014).
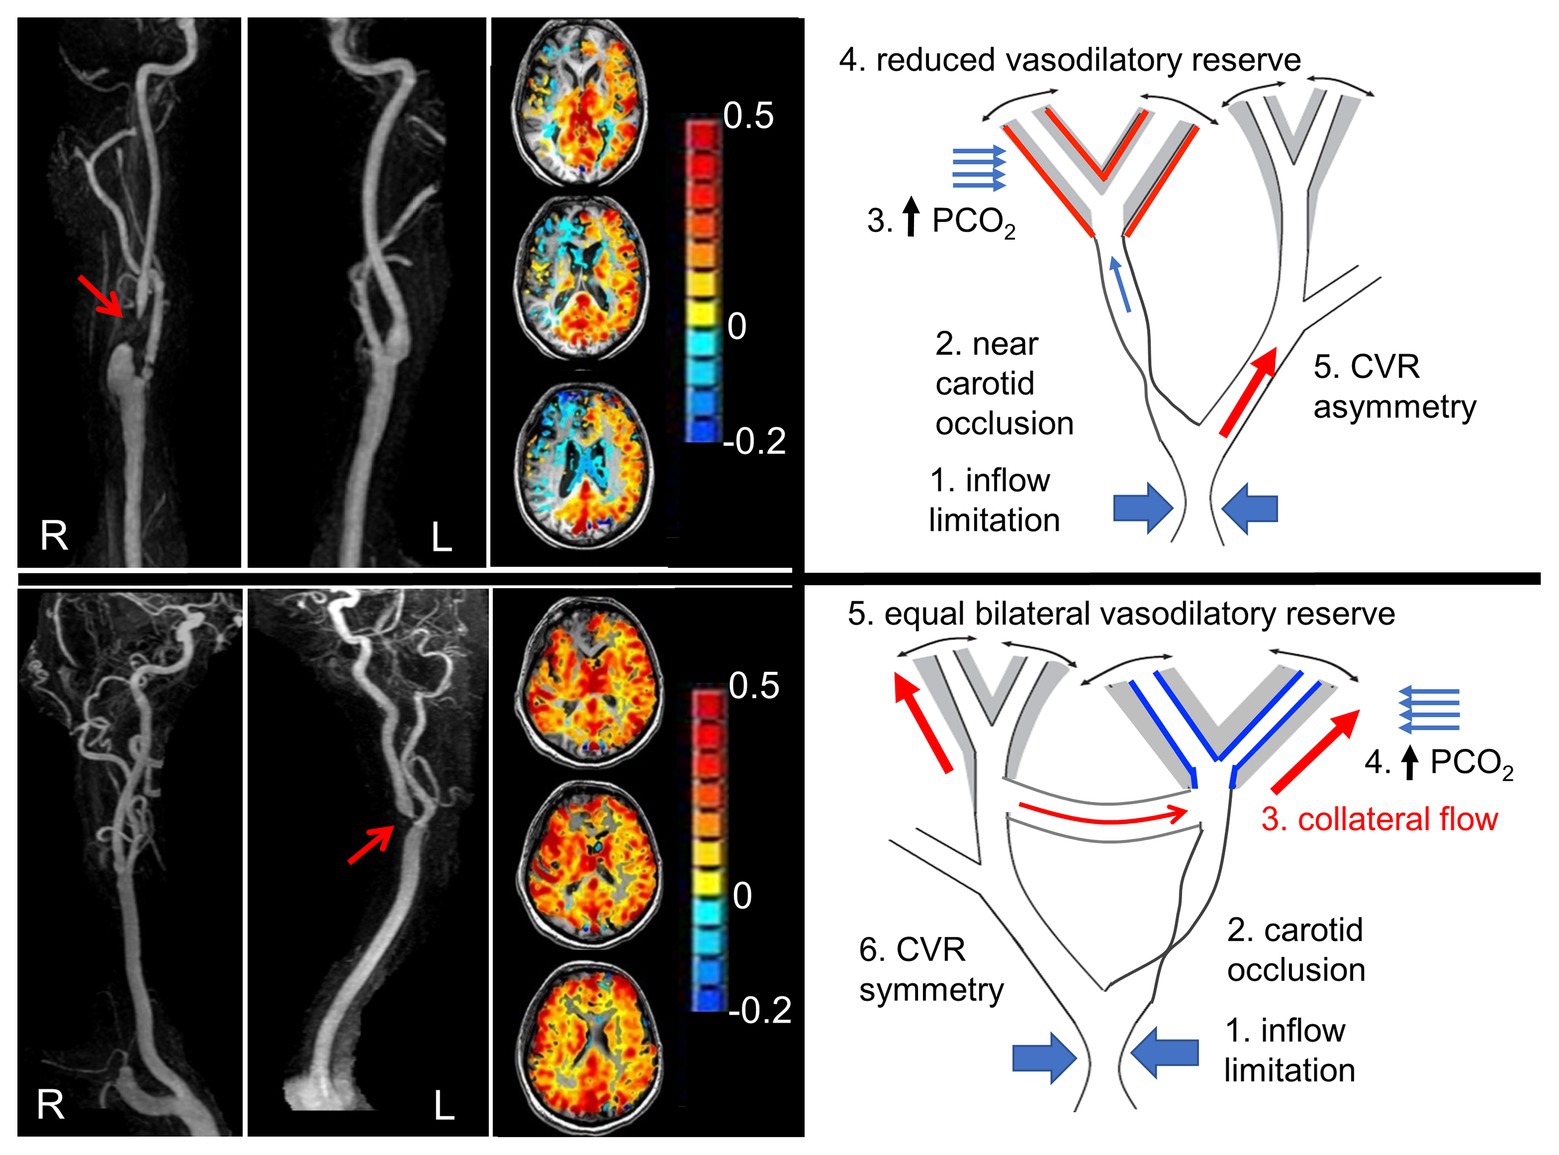
Figure 2. Pathophysiology of steal, and steal as a marker of availability of collateral flow. Left panel shows angiograms from two patients with nearly occluded carotid arteries (red arrows). Next to each are axial slice cerebrovascular reactivity (CVR) maps from the hypercapnic test. The CVR for each voxel is color coded according to the color scheme shown and mapped onto the corresponding voxel of the anatomical scan. The upper panel shows steal physiology (blue voxels on axial scan), and the lower panel shows near normal CVR. The suggested mechanism of each map is shown in the schematic to the right. Upper right panel: (1) Flow capacity of intracranial vessels greater than can be supplied by extracranial vessels depicted as “inflow limitation”; (2) occlusion of a branch; (3) hypercapnia and stimulation of vasodilation; (4) vasodilatory reserve (gray area) is exhausted downstream from the occlusive lesion (indicated by the red lines on the outside of the gray zone), but intact on the contralateral side (indicated by black lines inside gray zone); and (5) with hypercapnia, flow is directed predominantly to the contralateral side, dropping the perfusion pressure at the bifurcation. The reduced perfusion pressure reduces the flow downstream from the lesion. In the lower right panel: (1) Collateral flow bypasses the stenotic lesion. Both sides retain flow reserve. A hypercapnic stimulus results in bilateral positive CVR. Modified from Hoiland et al. (2019).
Advanced Cerebrovascular Reactivity: The Clues to Underlying Physiology
The “box car” stimulus approach was initially very helpful in the analysis of the data, using a “steal/no steal” paradigm to reduce system complexity into a binary assessment with implications for severity of underlying pathology, risk of stroke, and advisability of surgical revascularization. Throughout this period, we also tried to address other aspects of the complexity of CVR by re-examining our initial assumption that Δ BOLD was sufficiently normalized and standardized if simply divided by Δ PETCO2. For further discussion on optimizing the stimulus for interpretation of physiology.
Speed of Response
The ability to generate, literally, square wave changes in PETCO2 gave us many opportunities to observe the delays between the change in PETCO2 and that of raw BOLD signal. We were soon able to predict the processed CVR maps from these data noting that the BOLD signal of healthy vasculature follows PETCO2 very closely in time and amplitude, but the BOLD response of compromised vasculature is delayed and dampened. The standing model to explain lags in vascular flow response to changes in PaCO2 is that of Thomas et al. (2014). In this model, smooth muscle tone responds to the tissue PCO2 which is a function of the rate of buildup and elimination of carbon dioxide (CO2) in the interstitial and intracellular fluid surrounding the vessel. These extravascular tissues are considered to be a CO2 reservoir which has a CO2 capacitance that buffers the amplitude and rates of change of vascular CO2 concentrations and thereby, blood flow. With the publication of Poublanc et al. (2015), we introduced a model whereby vascular smooth muscle responds directly to intra-arterial hydrogen ion concentrations ([H+]). The model holds that with hypercapnia, intra-arterial H+ diffuses into the vascular smooth muscle cells, reduces intra-cellular [Ca++] (Swietach et al., 2013) and relaxes smooth muscle tone (Peng et al., 1998; Boedtkjer, 2018), thereby increasing blood flow. We modeled the flow response to CO2 as a first order exponential where following an abrupt change in arterial [H+], the τ of the BOLD response as it approaches a new equilibrium level represents the fitness of the smooth muscle tone control, with longer τ representing greater dysfunction (see Duffin et al., 2021).
The simplifying assumption of the vascular response being of a first order exponential led to our convolving the actual PETCO2 changes over the duration of the stimulus with (τ) ranging from 2 to 100 s. The speed of response was designated by the exponential that provided the best fit when regressed against the actual BOLD signal. Tau provided a complementary metric to the steady state CVR which is just a measure of the magnitude of response. Duffin from our laboratory showed the phase response from transfer function analysis (TFA) provided a similar measure (Duffin et al., 2015). Indeed, TFA, in addition to τ, has become a standard feature of our post-processing. Dynamic responsiveness has proven to be informative in the assessment of steno-occlusive disease (Poublanc et al., 2015), amnestic mild cognitive impairment and Alzheimer’s disease (Holmes et al., 2020), concussion (Shafi et al., 2020), and sickle cell disease (Forte et al., 2020). We currently believe that the speed of vascular response indicated by tau is a critical element of healthy vascular performance. Tau will also emerge as a highly sensitive biomarker for the severity of diseases that disrupt vessel structure and degrade vascular performance such as diabetes, hypertension, hyperlipidemia, smoking, i.e., those that are associated with hyalin sclerosis in arterioles.
Dynamic responsiveness (i.e., τ) cannot be assessed using such vasoactive stimuli as acetazolamide injection, breath hold, or fixed inspired CO2 (e.g., carbogen). The time courses of change in stimulation for acetazolamide, and the rise of CO2 with these methods, are considerably longer than those of the vascular responses, substantially obscuring them. Moreover, with these methods, PETCO2 is not equal to the PaCO2 (Jones and Jurkowski, 1979; Robbins et al., 1990), the actual independent variable, so the stimulus is not precisely known.
Voxel Flow Measurement and Voxel Vessel Diameters
What Flow Surrogate Measure to Use?
A suitable flow measure for CVR would require high temporal and spatial resolution. Ultrasound Doppler has the former, but not the latter. Furthermore, the velocity measure does not reliably reflect flow because of large changes in diameter of extracranial and intracranial arteries with changes in PaCO2 (Al-Khazraji et al., 2019).
MRI arterial spin labeling (ASL) using a flow-sensitive alternating inversion recovery (FAIR) sequence has 4 s temporal resolution and has been well correlated with positron emission tomography (Chen et al., 2008). It also works well in patients with vascular disease (Mandell et al., 2008). However, FAIR’s truncated spatial resolution to a few slices makes it problematic when whole brain resolution is required. ASL is also confounded by tagged blood arrival delays in patients with dyssynchronous intracranial blood arrival times that occur with cerebrovascular disease. Synchronously tagged blood delayed in collateral paths may arrive in the microcirculation after considerable loss of the spin tag due to T1 relaxation effects, significantly reducing signal to noise ratio. Active research in this area is expected to provide solutions and when they become available, ASL will be a preferred option for measuring CVR.
The BOLD signal is an acknowledged imperfect surrogate for flow. First, the relationship of BOLD to flow is not linear but exponential, rising with increasing flow only at the rate of progressive dilution of a constant amount of deoxyhemoglobin formation (Chiarelli et al., 2007). In addition, BOLD is affected by changes in cerebral blood volume (controlled for by Grubb’s constant; Grubb et al., 1974; Chen and Pike, 2010b) and any changes in oxygen consumption (Chen and Pike, 2010a). Nevertheless, we settled on BOLD MRI for measuring flow changes. It has the advantage of high temporal resolution (1 s), whole brain coverage, and a reasonably linear response in the range of CO2 stimuli applied for measuring CVR metrics (Hoge et al., 1999).
Should All Voxels Exhibit Sigmoid Flow Responses?
In time, we had to reconsider our first, seemingly necessary, simplifying assumption that measured changes in voxel flow reflect changes in the diameters of the vessels of the corresponding voxel. This assumption at first blush seems fundamentally reasonable. But, we nevertheless had doubts, even as we adopted it. We put these doubts aside, but not out of mind. We reconsidered the issue repeatedly over the years. First, we laid out fundamental concepts concerning blood flow: changes in blood vessel diameter have a limited range. At the extremes of the range, the change in diameter per unit change in stimulus is reduced, resulting in a sigmoidal relationship between flow and PaCO2 for a given perfusion pressure. Indeed, the flow response to PaCO2 is sigmoidal in healthy humans (Bhogal et al., 2014, 2015, 2016; Duffin et al., 2019).
Based on the literature, we expected the same response in the presence of vascular disease. Earlier animal studies by Harper and Glass (1965) and later human studies by Ringelstein et al. (1988) used the flow in the whole brain as a model of blood flow response to PaCO2 (Figure 3 and also Sobczyk et al., 2014) at various degrees of reduced perfusion pressure. In those studies, reductions in perfusion pressure flattened the sigmoidal flow-response curves. We generalized these observations in considering that the variations in amplitude and other characteristics of a sigmoidal curve (Figure 4) reflect the integrity of a vessel’s anatomy and physiology. As the vessel’s ability to respond to the PaCO2 wanes, the sigmoid response curve flattens: both the amplitude and slope of the sigmoid decrease. We hypothesized that this would also apply at the level of a local group of vessels represented in an imaging voxel.
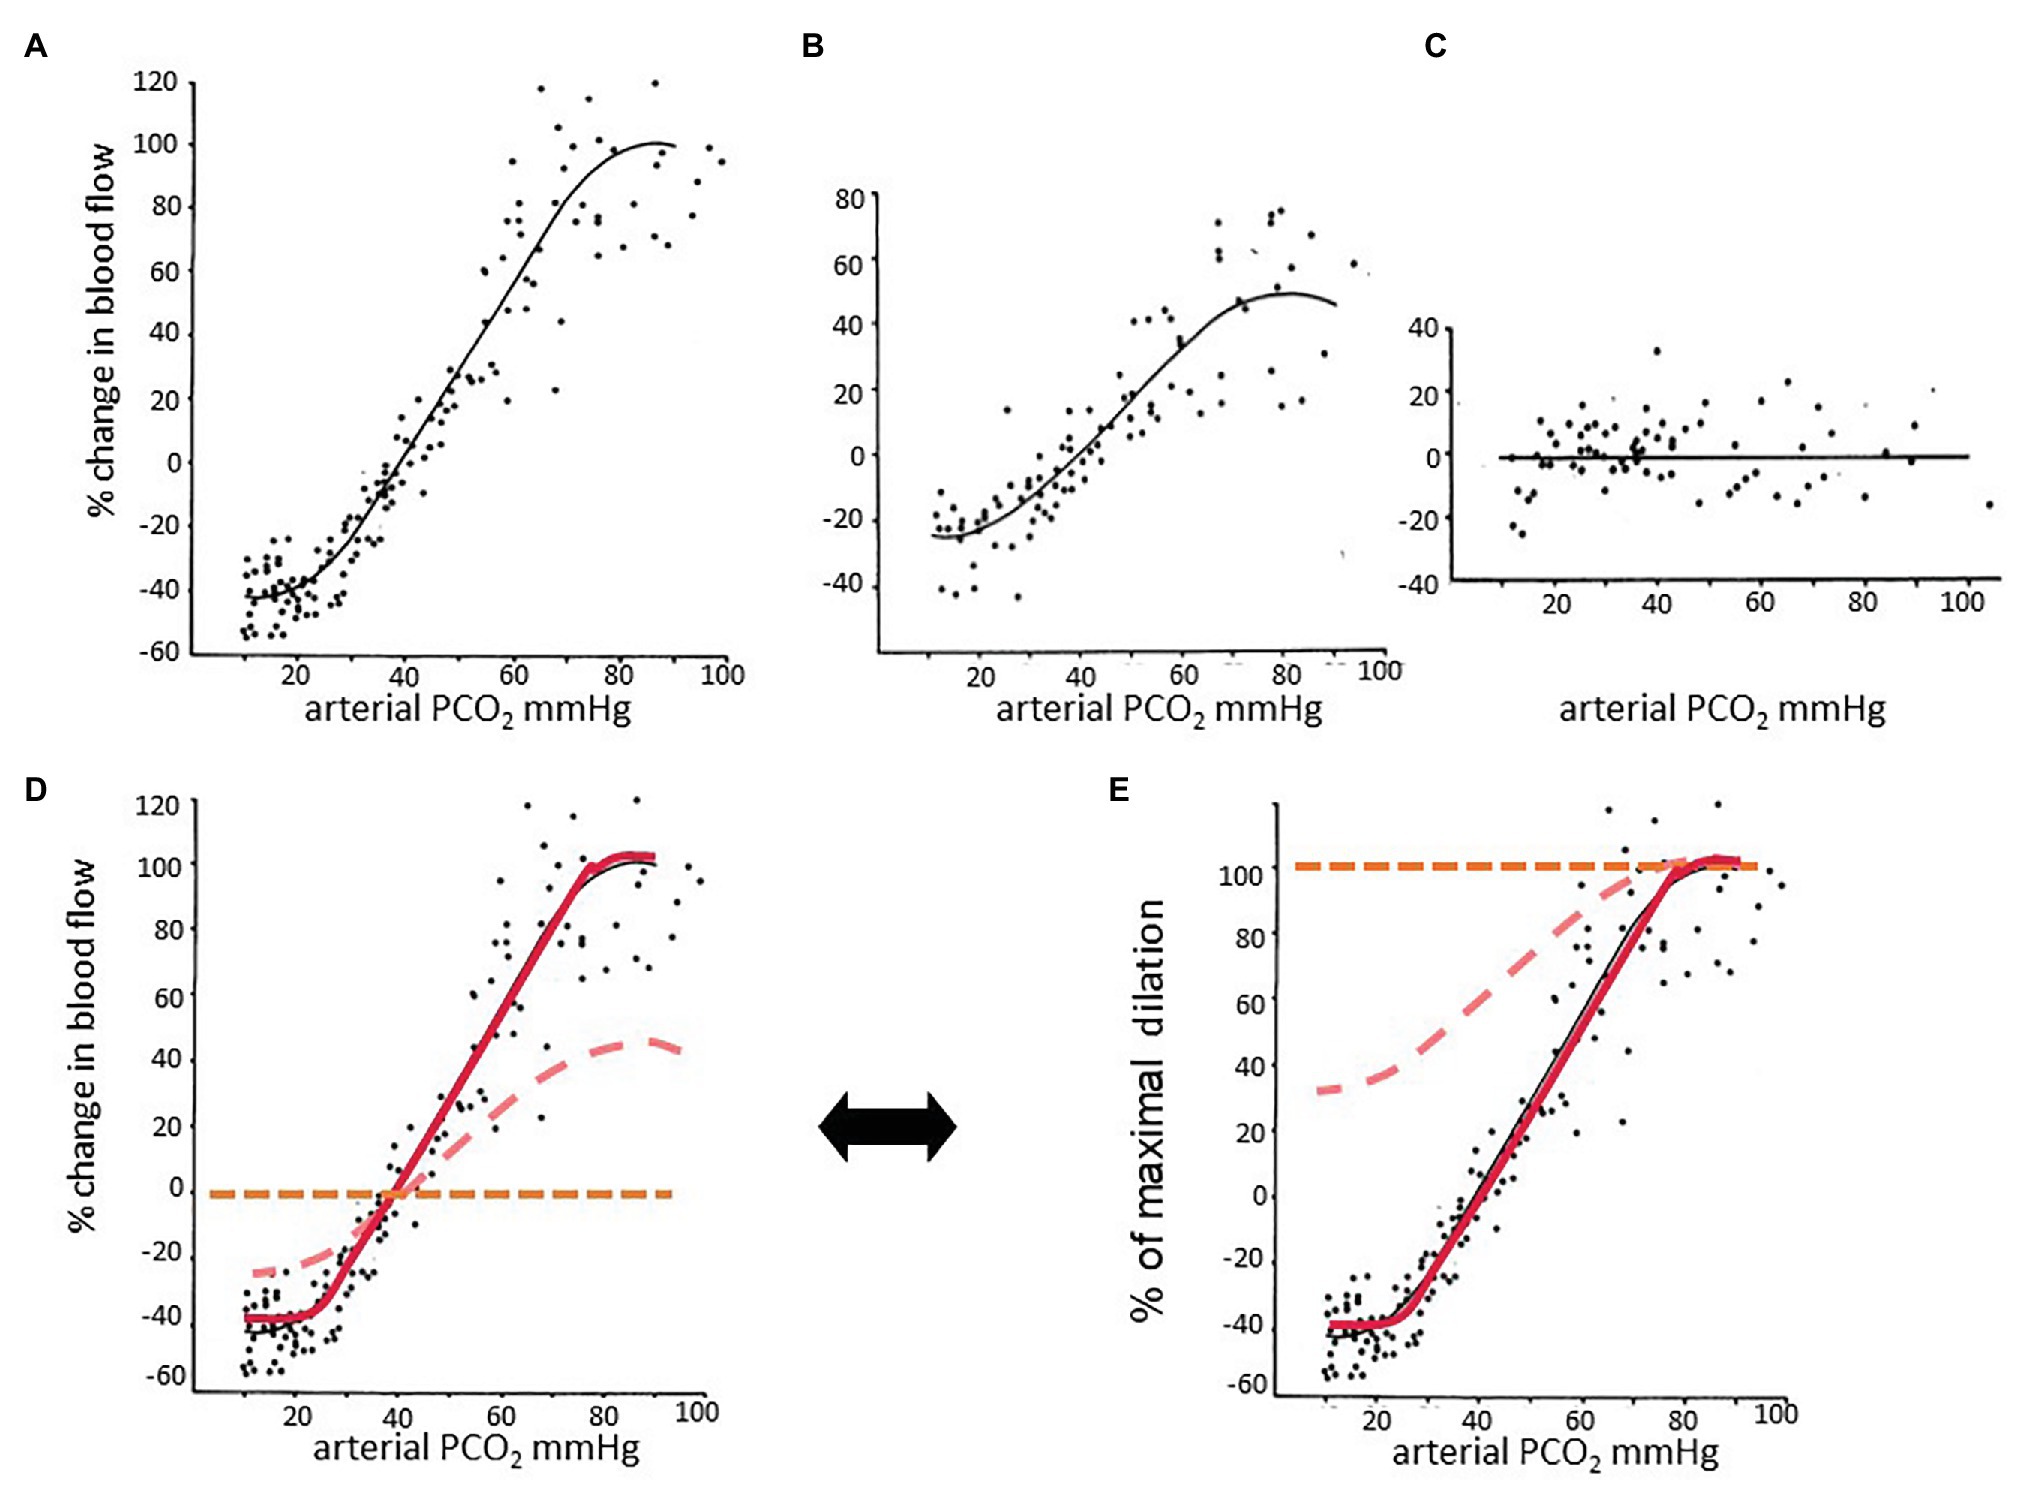
Figure 3. The effect of partial pressure of carbon dioxide (PaCO2) on blood flow at different perfusion pressures. Data taken from Harper and Glass (1965). In this experiment, the authors anesthetized dogs and measured CBF by washout of radioactive counts. Graphs in the top row were taken from the paper and adjusted to the same scale. (A) Normotensive; (B) mild hypotension; (C) severe hypotension. (D) The three graphs are plotted on the same axes. (A) The relationship between PaCO2 and CBF is sigmoidal. (B) The encroachment on the vasodilatory reserve by perfusion pressure autoregulatory-induced vasodilation reduces the reactivity to carbon dioxide (CO2), as indicated by the slopes of the linear part of the sigmoid curves. Perfusion pressure autoregulation and CO2 reactivity compete to alter vessel diameter. (C) When autoregulation is exhausted, there is no further response to hypercapnia and little or no constriction to hypocapnia. (D) The midpoints of the sigmoidal curves are approximately at the resting PCO2. (E) Percent of maximal dilation. At high PCO2, or low blood pressure, vessels are maximally dilated. Healthy vessels in normotensive subjects maintain vascular tone with considerable vasodilatory reserve. Vessels maximizing their autoregulation have minimal vasodilatory reserve. Thus a hypercapnic stimulus of sufficient magnitude will continue to dilate healthy vessels while those that have exhausted their vasodilatory reserve will increase their flow to a lesser extent, or even reduce their flow and suffer steal.
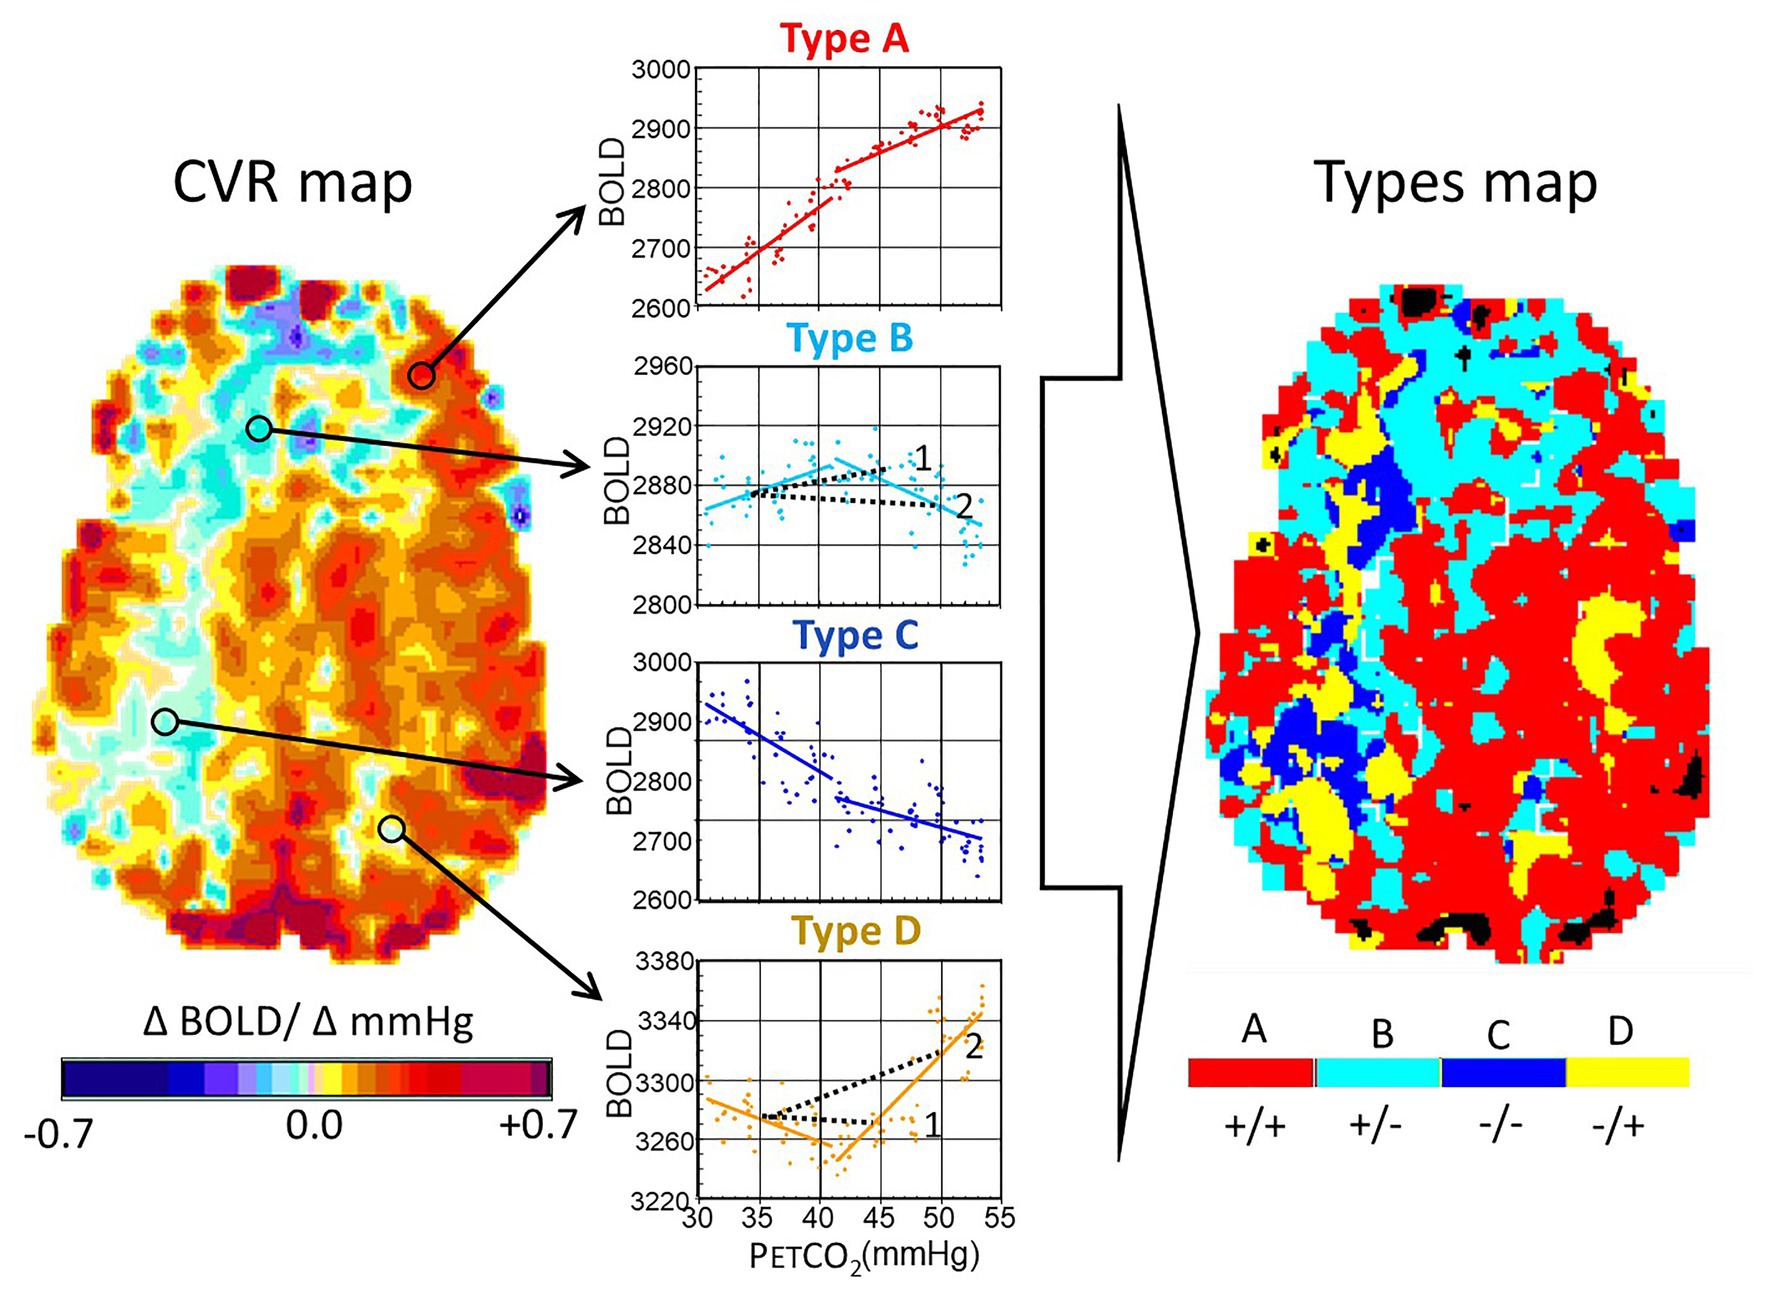
Figure 4. Analysis of ramp hypercapnia data. Stimulus paradigms in an 18-year-old male subject with a history of moyamoya disease affecting the right middle cerebral artery and both anterior cerebral artery territories. The end-tidal PCO2 (PETCO2) was initiated at baseline PETCO2, reduced to 30 mmHg by asking the subject to hyperventilate, and then raised at a constant rate, regardless of minute ventilation or breathing pattern, resulting in a linear rise of PETCO2 vs. time, to 55 mmHg over 4 min. We examined the blood oxygen-level dependent (BOLD) signal as a function of PCO2. The interrogated voxel locations are indicated by the circles on the CVR maps. Types of response: A, positive response with a sigmoidal shape; B, initial positive response which then declines; C, response which progressively declines; and D, response that initially declines but then increases. In healthy people, A Type voxels overwhelmingly predominate, and the map is substantially red. In this patient, voxels are color coded according to the color of the graph corresponding to the Type. Note the projection of CVR as would have been calculated for a 2-point PETCO2 stimulus of 45 and 50 mmHg for the voxels of Type B and D (see 1 and 2). In the upper figure, a PETCO2 stimulus of 45 mmHg results in a positive CVR but at a PETCO2 of 50 mmHg, CVR of the same voxel is negative, indicating “steal.” In the lower figure, PETCO2 of 45 mmHg results in a negative CVR and at 50 mmHg, it is positive. Modified from Duffin et al. (2017).
Seems That Some Voxels Do Not Exhibit Sigmoid Flow Profiles
We tested this intuitively satisfying hypothesis by applying a ramp increase in PaCO2 in patients with cerebrovascular pathology, where the ramping of PaCO2 is intended to capture most of the full sigmoidal range of response. Some of the patients with steno-occlusive disease indeed showed regional steal. When we checked the shape of the responses at the level of the voxel, many voxels in the non-steal territories had sigmoidal responses, but many others had responses that were clearly not sigmoidal – rather they were bimodal, particularly in areas with poor CVR and steal. In these regions, voxels could be classified into one of four general patterns (Figure 4). This surprising finding challenged our previous assumptions that the slope of a straight line fit to two points of the PaCO2-BOLD relationship was a suitable interpretation of the vascular response (Figure 4, dotted lines in Type B and Type D). The abundance of these four types of patterns initially challenged what we ultimately came to accept as axiomatic: the vascular resistance response of all vessels to progressive hypercapnia is indeed sigmoidal, but the flow, or BOLD signal, changes may not be!
A Change in Concept From Sigmoidal Flow, to Sigmoidal Resistance
To reconcile the observations of types of responses with the understanding of the foundation of vascular physiology, we had to jettison the belief that the measured changes in flow reflected only changes in vascular diameter in the underlying voxels. The transformative insight for us was that in patients with cerebrovascular disease, the observed pattern of the changes in flow to a progressively increasing stimulus resulted from the combination of (i) local changes in vascular diameter, as determined by its vasodilatory reserve which is sigmoidal in shape (Sobczyk et al., 2014), and (ii) the uneven distribution of perfusion pressure.
Had the cerebral inflow potential from the extracranial vessels not been limited (as in the aforementioned studies of Harper and Glass, 1965; Ringelstein et al., 1988), possibly all observed flows would indeed reflect the changing vascular diameters and consequent flow resistance of the voxel’s underlying capillaries (Figure 2). But in the presence of restricted inflow and stable systemic blood pressure, local perfusion pressures and thus brain flow distributions become dependent on the pattern of regional flow resistances in the way an electrical current would be by wiring together multiple electrical resistances in parallel, with CVR and steal being a hydraulic analogy of Ohm’s law for electrical resistances (Figure 5). As the vasodilatory stimulus increases, the blood flow will shift to the vessels that can continue to lower their resistance.
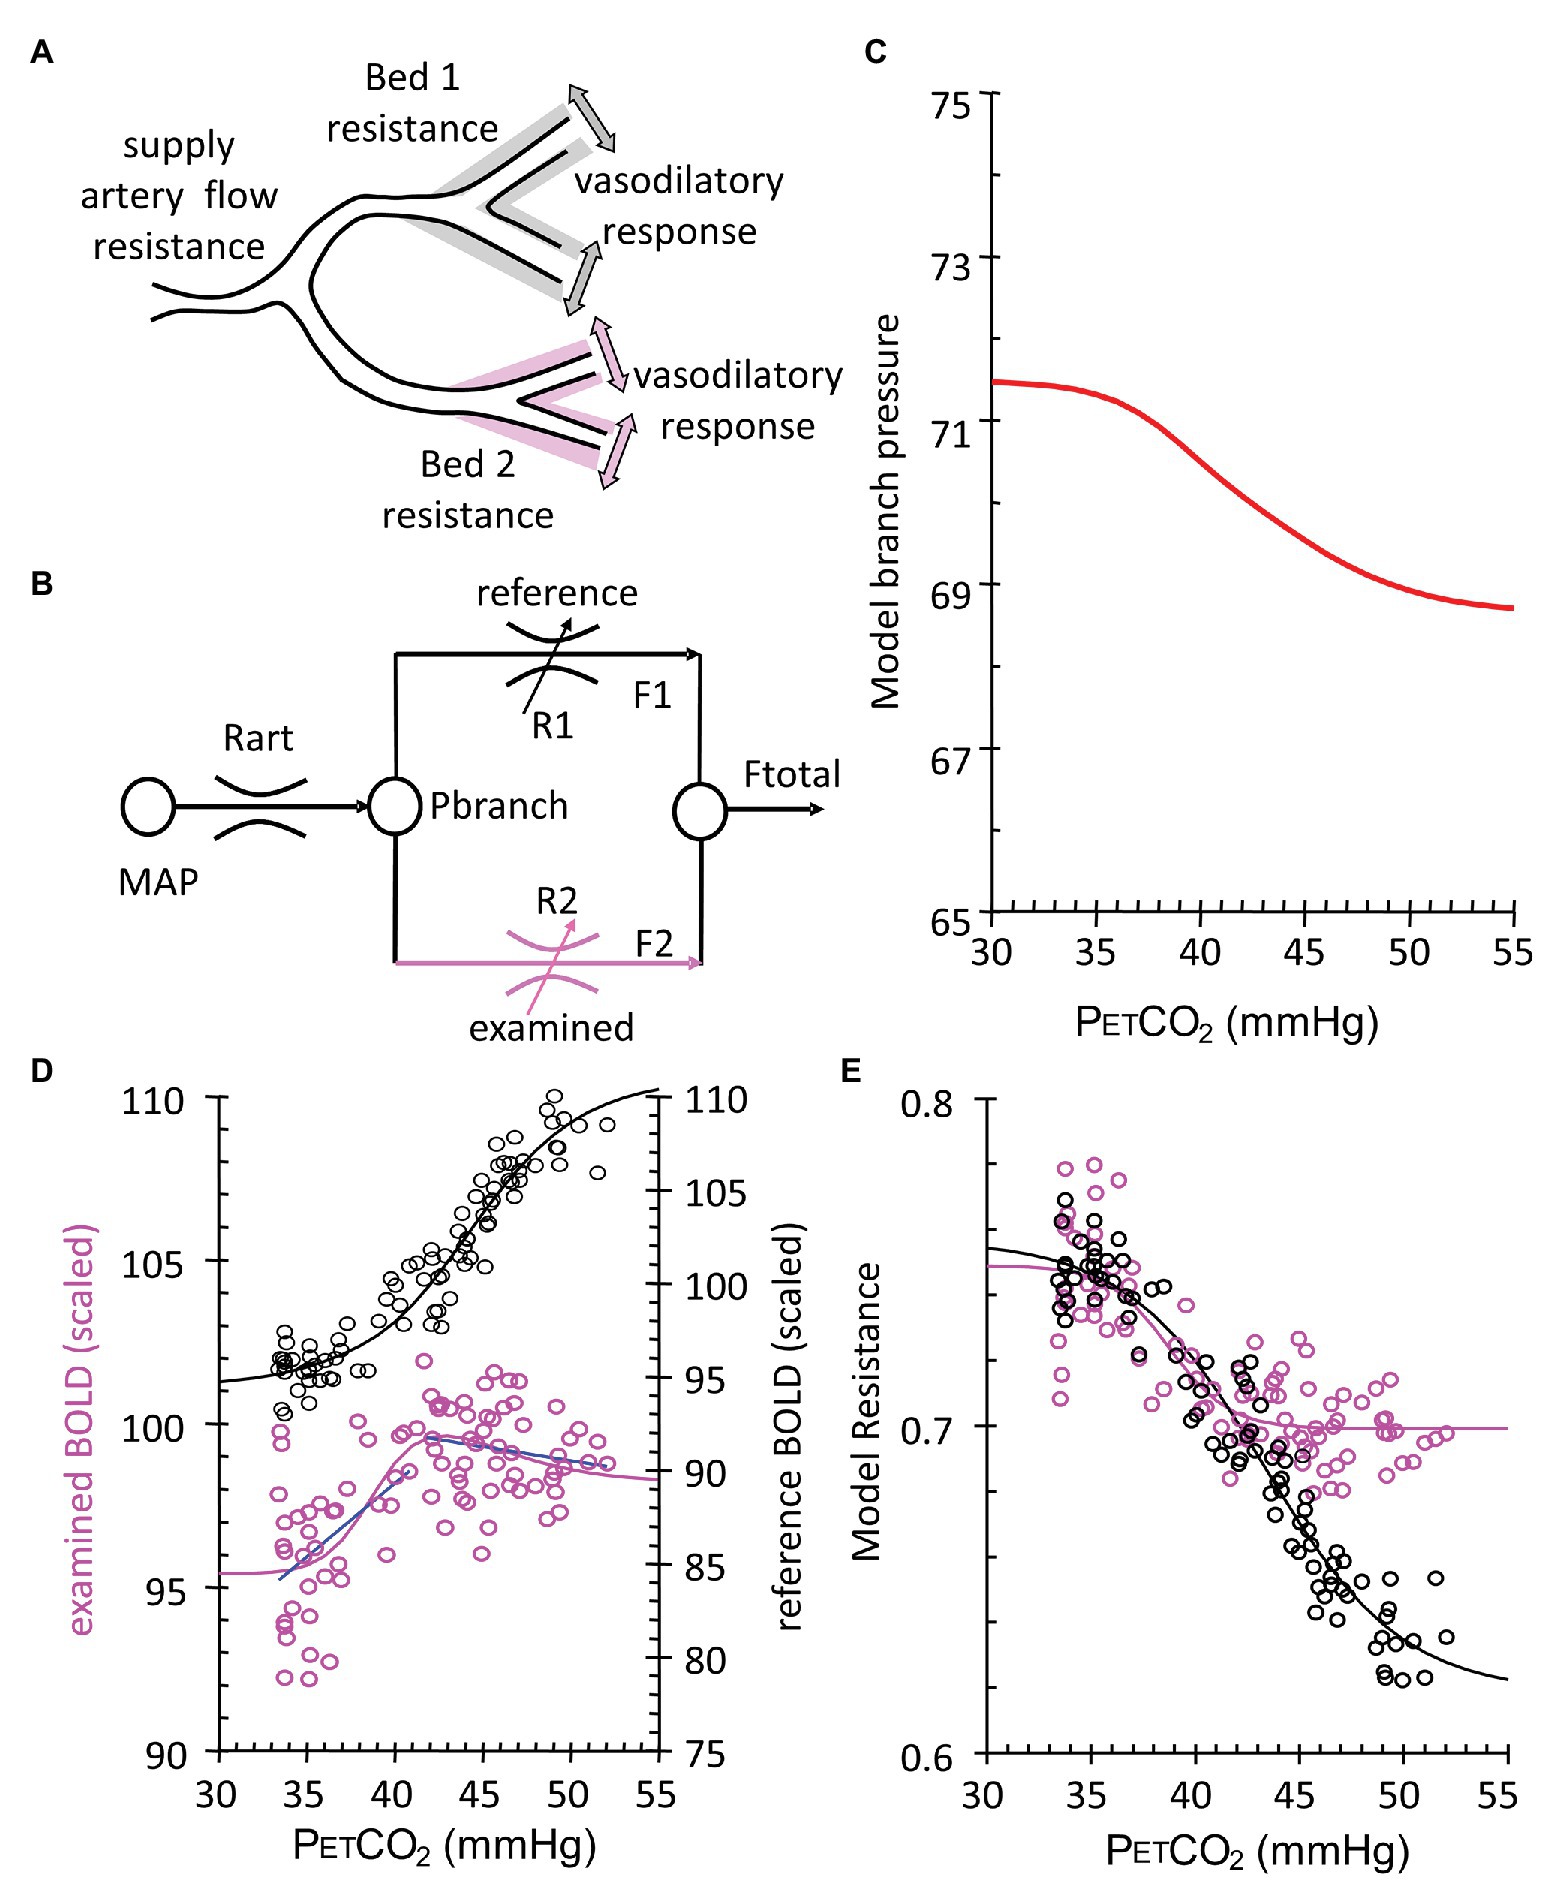
Figure 5. Calculation of voxel resistance sigmoidal profile over range of PETCO2. (A) Theoretical illustration of two brain vascular territories both supplied in parallel by a major artery with resistance (flow limitation). Their vasodilatory responses are shown as shading. (B) Simple resistance circuit model. Reference and examined vascular beds with resistances R1 and R2 are perfused via an arterial flow resistance (Rart) from mean arterial blood pressure (MAP). The pressure perfusing the two branches (Pbranch) and their respective resistances establishes flows through each branch (F1 and F2) that sum to Ftotal. Given F1 and F2 as BOLD measures for the reference and examined voxels, R1 and R2 can be calculated by considering the Model as an analog of an electrical circuit. The Model assumes that this unit may be expanded and contracted in a fractal pattern to contain the blood supply of both hemispheres, from extracranial vessels to capillaries. Every vessel or vascular bed is considered in fluid continuity with every other vessel. As such, we use the examined bed for each unit on a voxel scale, as if it is perfused in parallel with an ideal voxel of full vasodilatory responsiveness. Pbranch values result from the assumption of MAP = 100 mmHg and the pressure loss in Rart assumed to be 30 mmHg (Faraci and Heistad, 1990). Regardless of flow pattern Type (Figure 4), the calculation invariably results in a sigmoidal resistance response to PETCO2. (C) Model branch pressure change with PETCO2. (D) Measured flow responses to PETCO2 (purple open circles and blue Type line fits) and the reference voxel (black open circles). (E) Model resistance-CO2 responses calculated from the Model flow responses and the reference voxel flow. Sigmoid curves (lines) are fitted to the resistance-CO2 responses for each voxel.
We followed up on this insight by modeling regional CBF as a fractal assembly of simple units of two flow resistances in parallel (Figure 5B). The Model, meticulously assembled by Duffin, uses the data of BOLD vs. PETCO2 that includes the two biphasic flows to back-calculate the pattern of vascular resistance in the underlying voxel over the range of the ramp stimulus (Duffin et al., 2017, 2018; Fisher et al., 2017). We found that the PETCO2 vs. resistance curve is indeed sigmoidal in shape, regardless of the net flow pattern, or more specifically flow Type, and vice versa! The sigmoidal shape of the resistance, and not the blood flow changes themselves, is, therefore, a fundamental property of the vasculature. As such, the descriptions of the vascular physiology lend themselves to be summarized by terms describing the mathematical properties of the sigmoid curves (Figure 6).
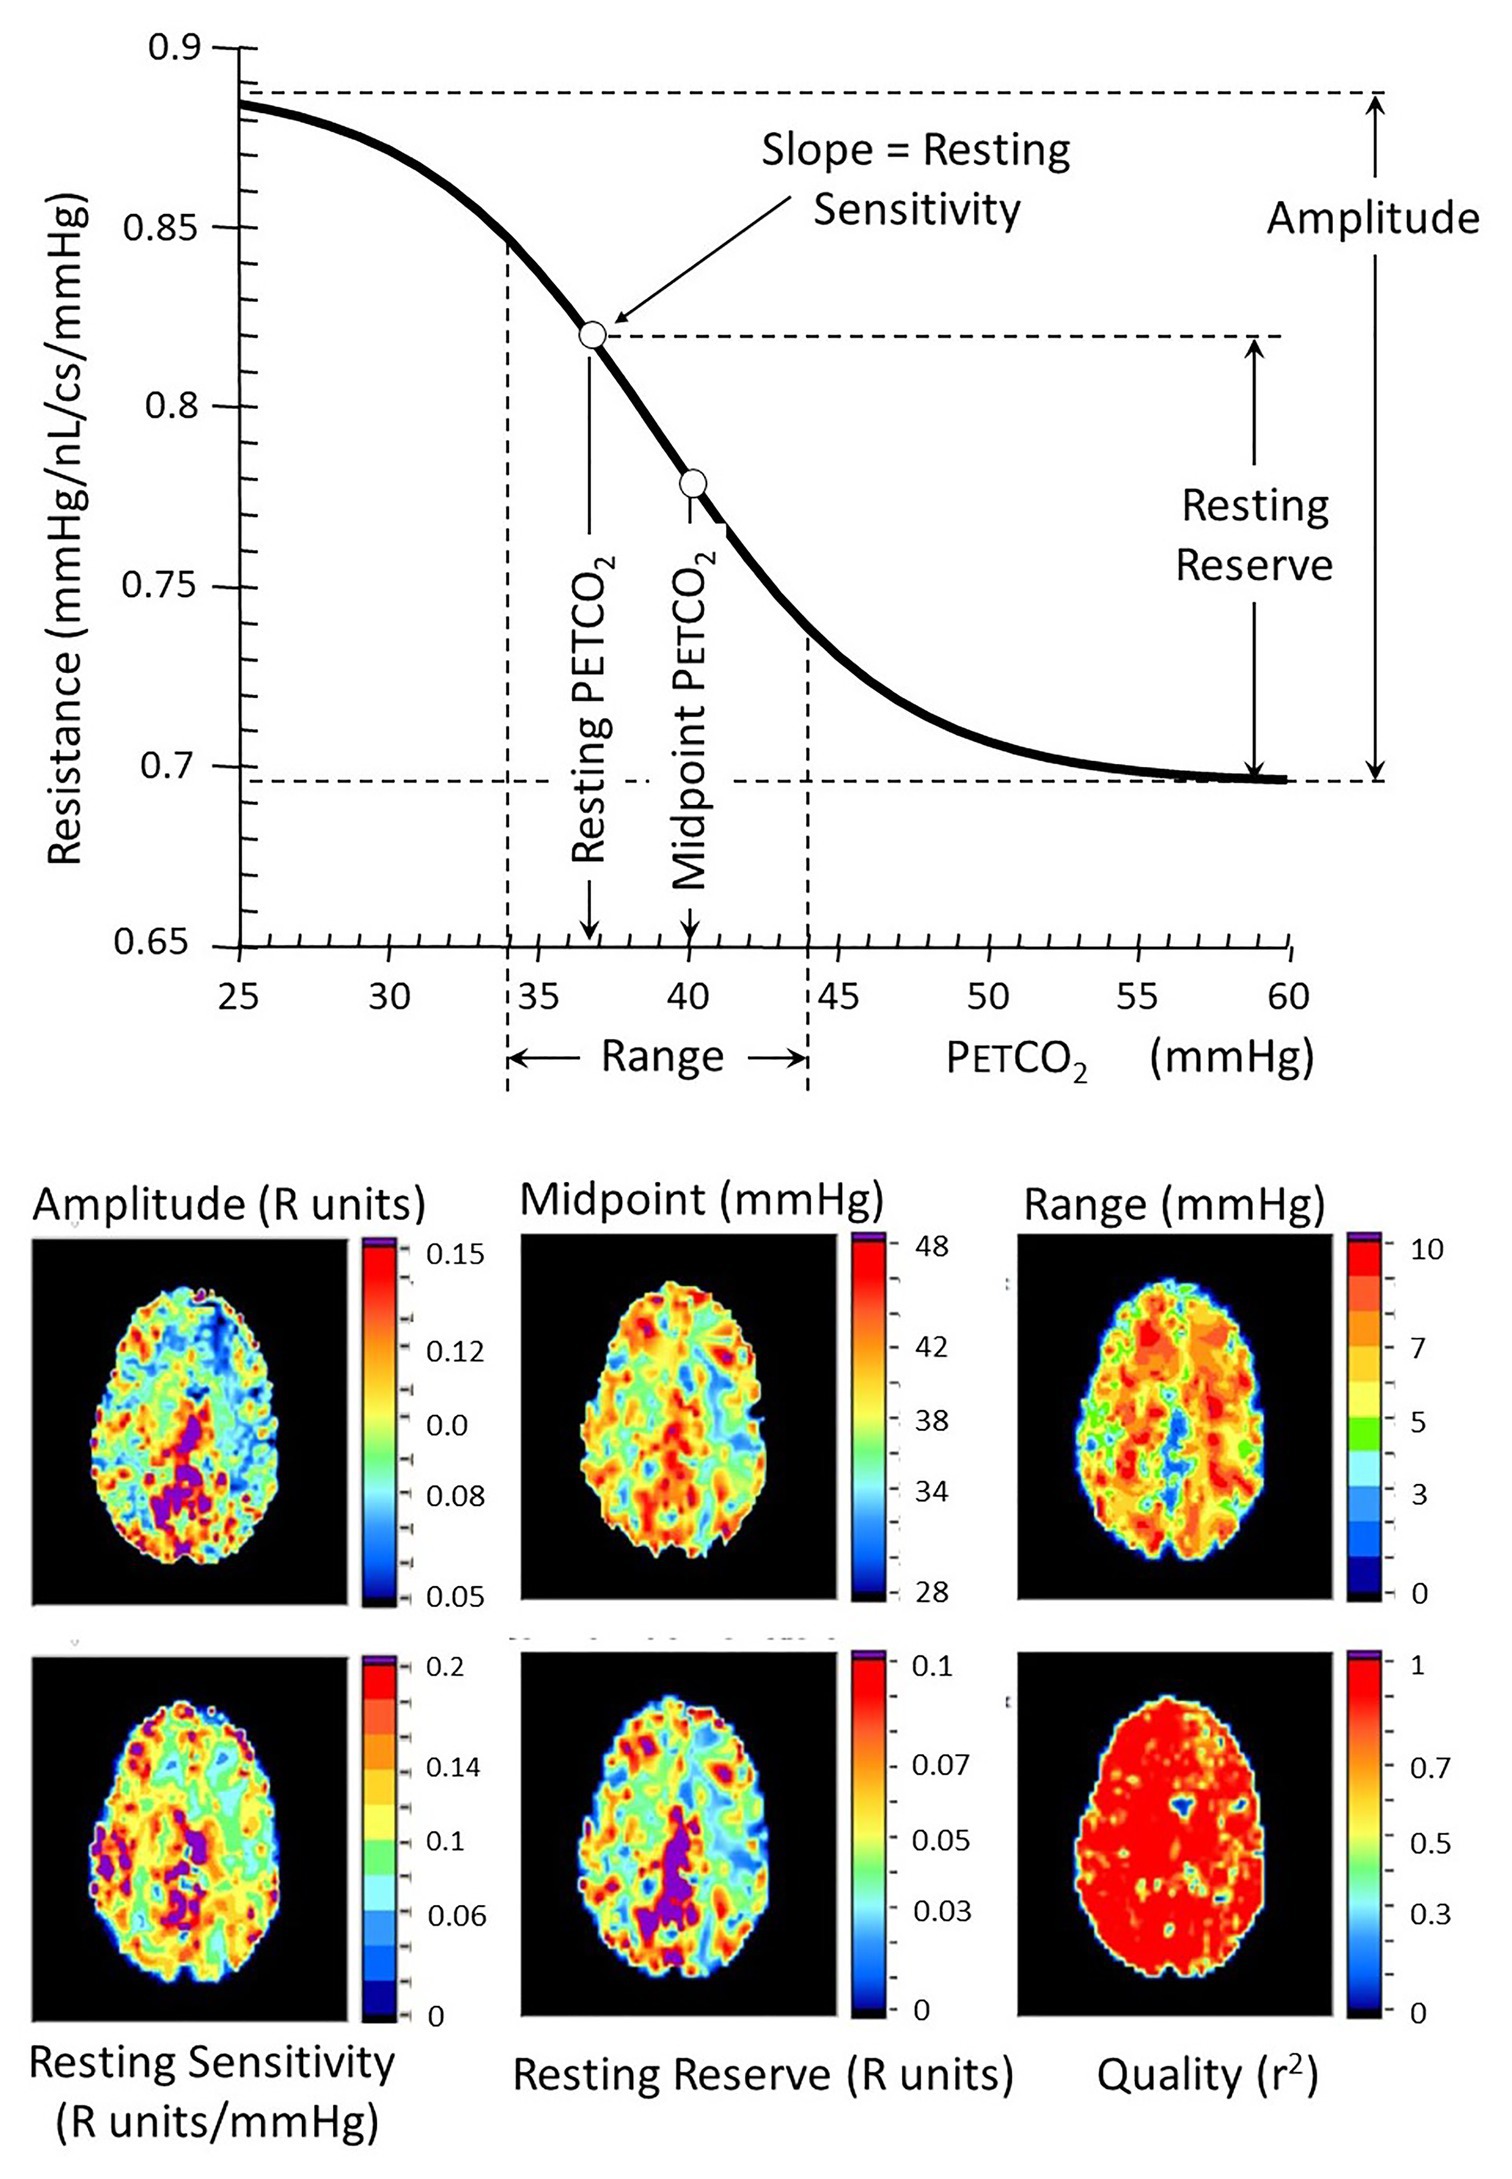
Figure 6. Resistance sigmoid measures (top) and their corresponding anatomical maps (bottom). The vascular model is that described in Figure 5. Various aspects of the resistance-PETCO2 relationship are expressed in the sigmoidal shape of the relationship. The graph shows some of these parameters diagrammatically, and the maps show their anatomical distribution. The amplitude shows the full extent of the vasodilation and vasoconstriction. The midpoint of the sigmoid is the PETCO2 at its steepest slope, and the range is the span of PETCO2 over which the response can be considered linear. The reserve and sensitivity show the vasodilatory reserve available from the subject’s resting baseline PETCO2 and the response sensitivity (sigmoid slope) at resting PETCO2. The quality map shows the r2 fit of the examined voxel resistance sigmoid.
To summarize this section, we had progressed from assuming that the BOLD change reflects the underlying voxel’s linear change in resistance to calculating its actual resistance profile by accounting for the net inflow and the net resistance changes of the vessel’s connected network. In doing so, we find all resistance profile calculations yield sigmoidal relationships, regardless of the observed pattern of flow response to progressive PETCO2. This provides confidence that our calculated correction reflects the underlying vascular physiology.
Requirements For the Clinical Application of CVR
Many forms of CVR have been described using a variety of stimuli and flow assays. All such studies published to date have used these CVR measures to compare cohorts of subjects. Broad questions can be addressed by examining well-matched groups to cancel the “noise” of randomly distributed variables and shortcomings of the test. Despite its merits, this approach has low sensitivity in discerning an abnormality in an individual patient.
To be suitable for “clinical assessment” implies that a CVR test in a single individual could be interpreted as “normal” or “abnormal.” For this, one needs criteria and thresholds for normality and abnormality as in, for example, blood clotting tests. One needs to be able to address questions such as: (1) “Is the CVR test of Mr. Jones within the normal range?,” (2) “Does his CVR suggest that he would benefit from cerebral bypass surgery?,” (3) “How certain can we be that his surgery improved his vascular status as measured by CVR?” These questions have not yet been addressed due to the inherent imprecision of the stimuli used in most studies of CVR: breath holding, fixed inspired PCO2, or acetazolamide.
A requirement for any clinical assessment is a standardized repeatable test that includes the same baseline, the same level of change in PaCO2 from baseline, the same pattern of change over time, and the same duration applied to repeated patient examinations. This standardized test can then be applied to a representative population and examined in standard anatomical space to define the “normal” population, its mean value (m) and its variance, the SD. A patient’s CVR can then be scored using the z-score as the difference between their result and the population m, divided by the SD, giving the probability that the test value falls in the normal range (Sobczyk et al., 2015). This process, also developed by Sobczyk during her doctoral thesis work, is summarized in Figure 7. The analogous process can be applied to follow CVR in a single patient over time, to monitor either the natural history of the disease or the effects of treatment (Sobczyk et al., 2016).
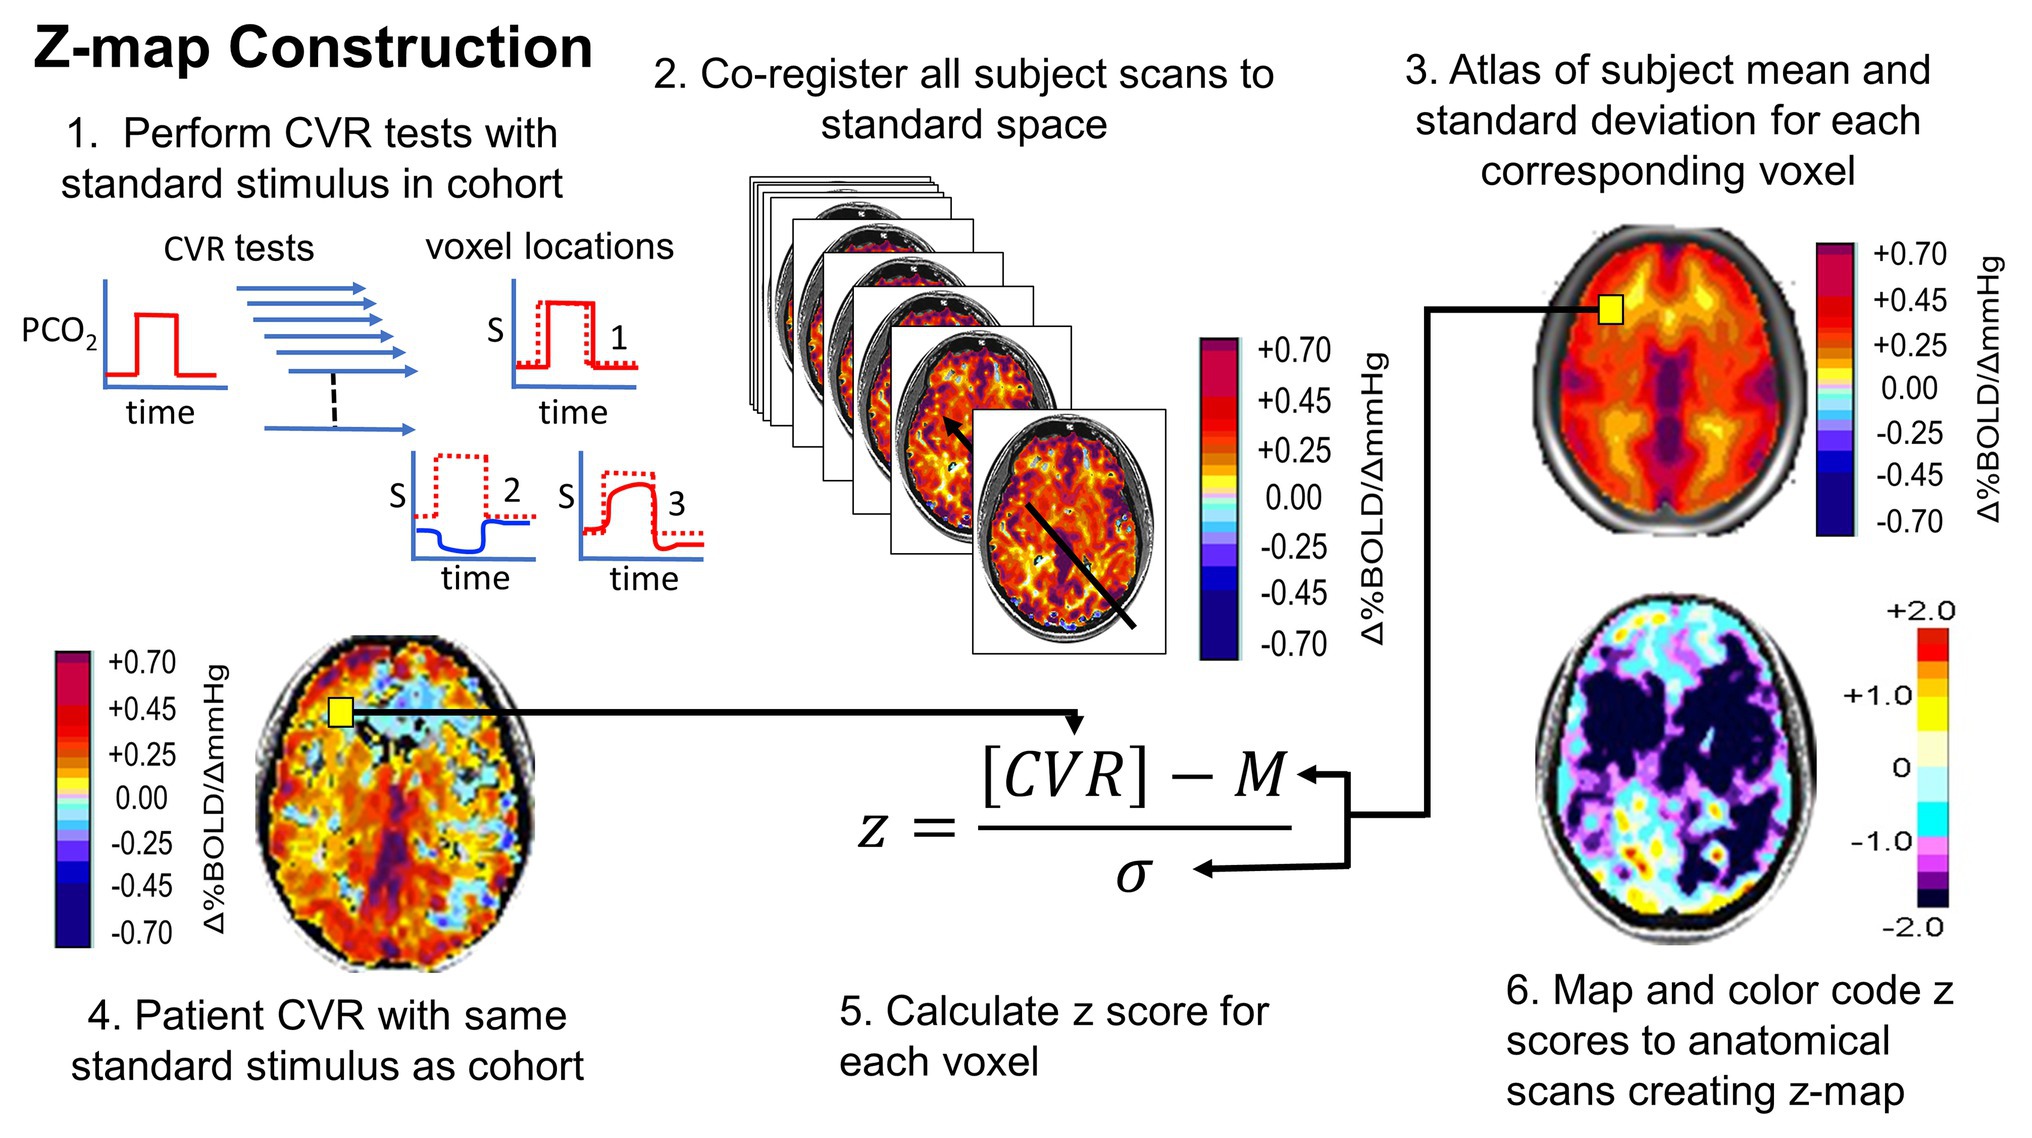
Figure 7. Normalizing the CVR score in terms of the normal range. An identical, repeatable stimulus is applied to a healthy cohort. CVR is calculated and mapped to standard space. Mean (M) and SD are calculated for each voxel. A patient is administered the same test. The patient CVR is assessed as z-scores. Z-scores can be color coded and mapped over the anatomical scan to show the distribution of abnormality (reprinted from Fisher et al., 2018 with permission of the publisher).
Reproducibility in CVR Testing
Reproducible Stimulus
Administering a reproducible stimulus is easy. Obtaining a reproducible physiological effect is very difficult.
Acetazolamide
Acetazolamide (ACZ) infused intravenously, blocks the conversion of carbonic acid (H2CO3) to CO2 and H2O leaving brain tissue somewhat acidified and resulting in vasodilation. ACZ has been administered in supramaximal doses (1.5 mg/kg) with the expectation of a uniform maximal hyperemic response across subjects. Unfortunately, there is uncontrolled individual variation in the magnitude of response, its timing, and ability to maintain isocapnia as the CBF continues to respond to changes in PaCO2. The slow onset time also precludes assessment of the speed of the vascular response to a stimulus. At best, it can be characterized as a binary “on/off” stimulus (albeit without certainty as to timing and maximal effect) so that, as defined, it has significant limitations for single subject clinical application.
Carbon Dioxide
Carbon dioxide is readily available in gaseous form, is safe, inexpensive, and in the absence of hypoxia, has no life-threatening side effects at up to more than triple the baseline PaCO2 (Feihl and Perret, 1994).
Fixed Inspired CO2 Concentration.
PaCO2 is determined by both the fraction of CO2 in inspired gas (FICO2) and the subject’s ventilatory response, termed minute ventilation (⩒E). The former is under the control of the investigator; the latter, however, is uncontrolled, unpredictable, and mostly unmeasured, resulting in an uncontrolled and unpredictable PaCO2 (Baddeley et al., 2000; Peebles et al., 2007; Fisher, 2016).
Precise Targeting of PaCO2.
Clinical, individual testing requires the ability to accurately implement a target PaCO2, the true independent variable, and to do so independently of the major confounder, ⩒E.
i. Dynamic end tidal forcing
In 1982, Robbins (Robbins et al., 1982) described a breath-by-breath feedback method to target PETCO2 by controlling the inspired concentration of CO2 according to the previous PETCO2. An MRI-compatible system was later described (Wise et al., 2007). However, this system is cumbersome, complex, wasteful of source gases, expensive, and not available in assembled form and so must be custom built to be adopted. The relation between the PETCO2 and the PaCO2 remains unverified (Jones et al., 1979; Robbins et al., 1990).
ii. Sequential Gas Delivery (1997+)
At the end of the last century, one of us (JF) was developing a technique of sequential gas delivery (SGD) which enables the delivery of a precise volume of gas to the gas exchange part of the lung regardless of breath size or breathing pattern (Sommer et al., 1998), and was searching for clinical applications. At the same time, DM, a new staff neuroradiologist at the same university (Figure 8), was performing BOLD fMRI studies that used square-wave changes in neuronal activation for augmenting blood flow detectable with BOLD MRI for assessing neurovascular coupling to detect neural networks. He realized that the ability to generate a quantitative repeatable square-wave vasodilatory stimulus using CO2 would have considerable potential for interrogating the entire cerebrovascular system in individual patients with cerebrovascular disease. He was seeking an MRI compatible method of precise gas control for the development of MRI based CVR as a clinical tool and was referred to JF by a colleague.
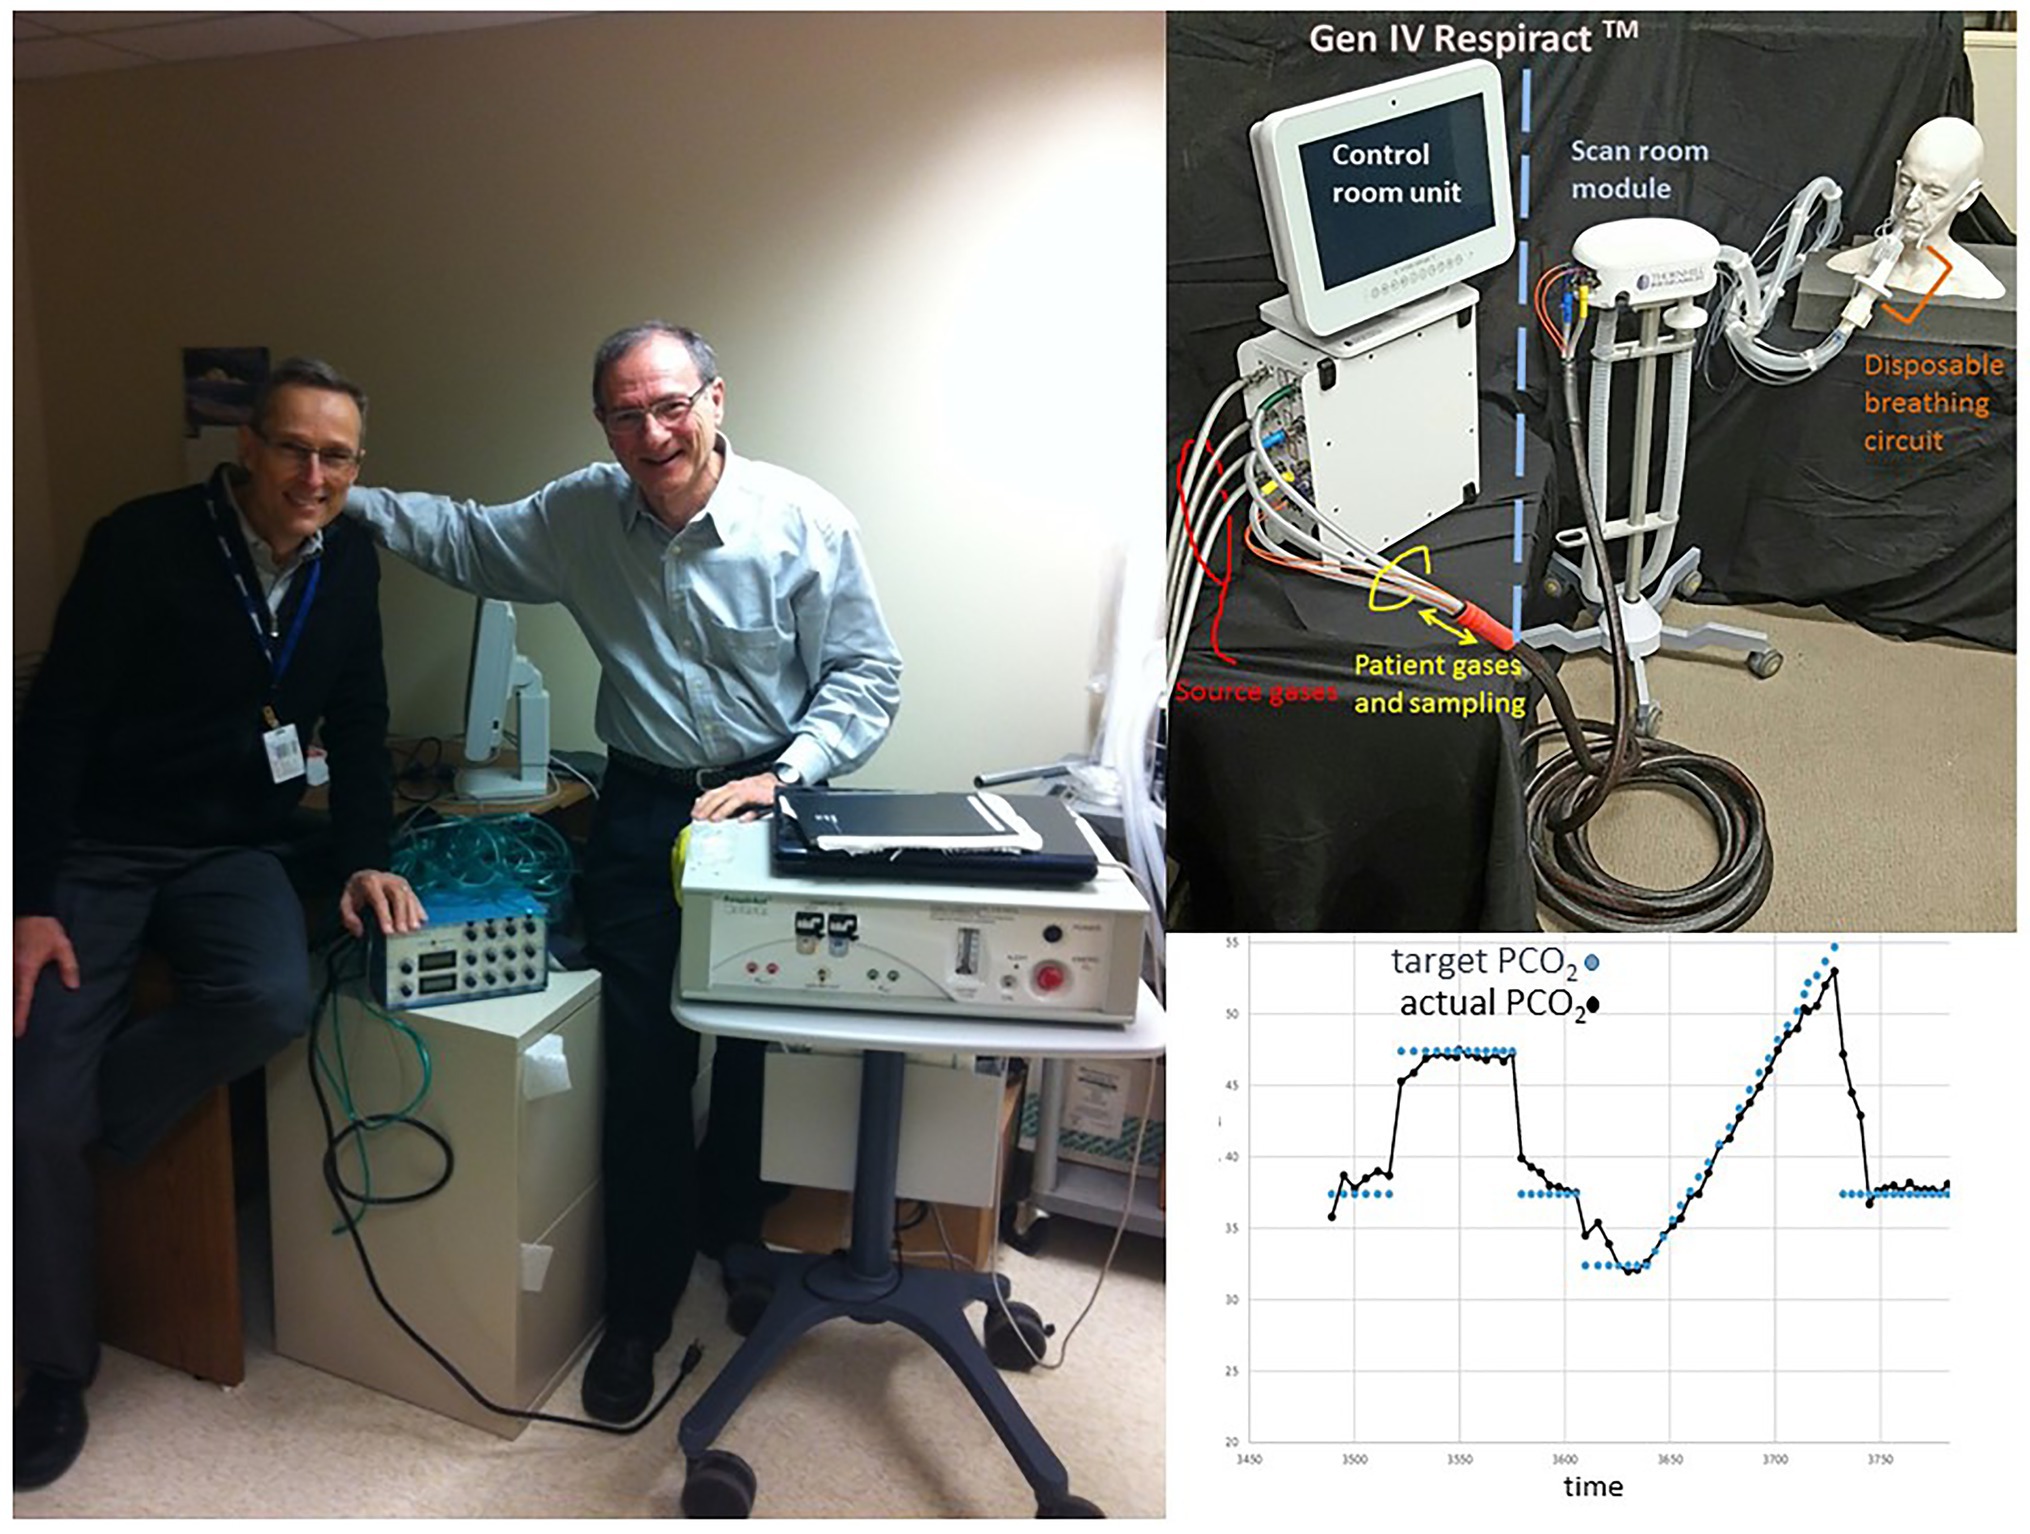
Figure 8. The authors and the generations of gas control devices. Left: DM with hand on Generation 1 end-tidal gas control device used in 1998. JF with hand on Generation 3 gas control device, by then called, RespirAct™. Top right: Generation 4 RespirAct™. Bottom right: Step-ramp paradigm implemented with Generation 4 RespirAct™.
Prospectively targeting PaCO2 is straight forward in theory. The approximate lung volume [functional residual capacity (FRC)] is known from nomograms that take as inputs age, height, weight, and sex. PCO2 in the FRC can be measured as it is equal to PCO2 in exhaled gas. CO2 production from metabolic activity can also be measured (the sum of exhaled PCO2 integrated for flow/time). It is then straightforward to calculate the volume and concentration of CO2 needed to be inhaled in order to attain any target PCO2 in the lung at the end of inspiration (Slessarev et al., 2007).
However, it is not straightforward to restrict inspiration to a discreet volume of CO2-containing gas such that this discrete volume, and only this volume, is distributed to the alveoli, and only to the alveoli (excluding the airways). The early evolution and proof of concept of these methods from basic principles over a decade was amply abetted by a large host of colleagues and graduate students, all co-authors of the early publications on the topic (e.g., Sommer et al., 1998; Vesely et al., 2001; Somogyi et al., 2005; Slessarev et al., 2007). A method of administering such a volume has an additional interesting property: It is the only method in which the PETCO2 is equal to PaCO2, within measurement error, over a large range of PETCO2 in healthy spontaneously breathing humans (Ito et al., 2008) and in newborn and adult ventilated animals with severe lung disease (Fierstra et al., 2011, 2012). This unprecedented precision and accuracy of targeting blood gases enabled the reproducibility, and hence the standardization of the testing, which led to the establishment of normal ranges for CVR voxel by voxel (Sobczyk et al., 2015, 2016), normal test-test variability (Sobczyk et al., 2016), and increased sensitivity enabling, in addition to steno-occlusive disease, the study of the microvascular disease in white matter (Sam et al., 2016a,b,c), dementia (Holmes et al., 2020), and vascular dysfunction of traumatic brain injury (Mutch et al., 2015; Ellis et al., 2016; Shafi et al., 2020).
Surprisingly, despite the hard work, insights, and calculations, the crucial components for successful prospective targeting of PaCO2 with SGD are very simple, inexpensive, and mundane, and, in retrospect, could have been easily accomplished more than 75 years earlier (Fisher et al., 2016). The bigger wonder is that considering their well-described limitations with respect to data acquisition, results, and interpretation, some investigators prefer using breath holding, carbogen, and ACZ as provocative stimuli.
Summary
The patterns of blood flow distribution in the brain in response to a vasoactive stimulus can be complex in the presence of cerebrovascular disease, but they are nevertheless the only comprehensive output data we can access. Any measures we make, interpretations we proffer, and conclusions we come to, can emanate only from analyzing these data. At the most fundamental level, we seek to distinguish “abnormal” from “normal” patterns of flow. To accomplish this aim, we identified a single repeatable vasoactive stimulus and a surrogate measure of CBF. We then performed CVR tests on a healthy cohort to establish normal values. This enables the identification and scoring of pathology in individual patients. Ultimately, we applied these data to understand how the observed patterns of flow revealed vascular pathophysiology in terms of perfusion pressures and vascular diameter summarized as vascular resistance. This essay is an overview of our progress in that regard, over the past two decades.
Data Availability Statement
The raw data supporting the conclusions of this article will be made available by the authors, without undue reservation.
Ethics Statement
All data involving human participants were reviewed and approved by Ethics Review Board University Health Network, Toronto. All patients/participants provided their written informed consent to participate in the studies. The authors have authorized the display of their image in Figure 8.
Author Contributions
JF and DM conceived, authored, and edited the manuscript. Both the authors contributed to the article and approved the submitted version.
Funding
The study was supported by the Andreae Vascular Dementia Research Unit in the Joint Department of Medical Imaging at The University Health Network, the Center for Aging and Brain Health Innovation, The American Society of Neuroradiology, and the Canadian Institutes of Health Research.
Conflict of Interest
The RespirAct™ is produced by Thornhill Medical, a for-profit spin-off from the University Health Network, to enable bone fide investigators to perform REB-sanctioned research. JF and DM have contributed to the development of the technology, and have shares in the company. JF sits on the Board of directors of the company.
Acknowledgments
We would like to thank Steve Iscoe for his helpful comments on the manuscript.
Footnotes
References
Al-Khazraji, B. K., Shoemaker, L. N., Gati, J. S., Szekeres, T., and Shoemaker, J. K. (2019). Reactivity of larger intracranial arteries using 7 T MRI in young adults. J. Cereb. Blood Flow Metab. 39, 1204–1214. doi: 10.1177/0271678X18762880
Alves, H. C., Pacheco, F. T., and Rocha, A. J. (2016). Collateral blood vessels in acute ischemic stroke: a physiological window to predict future outcomes. Arq. Neuropsiquiatr. 74, 662–670. doi: 10.1590/0004-282X20160050
Baddeley, H., Brodrick, P. M., Taylor, N. J., Abdelatti, M. O., Jordan, L. C., Vasudevan, A. S., et al. (2000). Gas exchange parameters in radiotherapy patients during breathing of 2, 3.5 and 5% carbogen gas mixtures. Br. J. Radiol. 73, 1100–1104. doi: 10.1259/bjr.73.874.11271904
Ben Hassen, W., Malley, C., Boulouis, G., Clarencon, F., Bartolini, B., Bourcier, R., et al. (2019). Inter- and intraobserver reliability for angiographic leptomeningeal collateral flow assessment by the American Society of Interventional and Therapeutic Neuroradiology/Society of Interventional Radiology (ASITN/SIR) scale. J. Neurointerv. Surg. 11, 338–341. doi: 10.1136/neurintsurg-2018-014185
Bhogal, A. A., De Vis, J. B., Siero, J. C. W., Petersen, E. T., Luijten, P. R., Hendrikse, J., et al. (2016). The BOLD cerebrovascular reactivity response to progressive hypercapnia in young and elderly. NeuroImage 139, 94–102. doi: 10.1016/j.neuroimage.2016.06.010
Bhogal, A. A., Philippens, M. E., Siero, J. C., Fisher, J. A., Petersen, E. T., Luijten, P. R., et al. (2015). Examining the regional and cerebral depth-dependent BOLD cerebrovascular reactivity response at 7T. NeuroImage 114, 239–248. doi: 10.1016/j.neuroimage.2015.04.014
Bhogal, A., Siero, J. C., Fisher, J. A., Froeling, M., Luijten, P., Philippens, M., et al. (2014). Investigating the non-linearity of the BOLD cerebrovascular reactivity response to targeted hypo/hypercapnia at 7T. NeuroImage 98, 296–305. doi: 10.1016/j.neuroimage.2014.05.006
Boedtkjer, E. (2018). Acid-base regulation and sensing: accelerators and brakes in metabolic regulation of cerebrovascular tone. J. Cereb. Blood Flow Metab. 38, 588–602. doi: 10.1177/0271678X17733868
Brawley, B. W. (1968). The pathophysiology of intracerebral steal following carbon dioxide inhalation, an experimental study. Scand. J. Clin. Lab. Investig. Suppl. 102:XIII. doi: 10.3109/00365516809169045
Chen, J. J., and Pike, G. B. (2010a). Global cerebral oxidative metabolism during hypercapnia and hypocapnia in humans: implications for BOLD fMRI. J. Cereb. Blood Flow Metab. 30, 1094–1099. doi: 10.1038/jcbfm.2010.42
Chen, J. J., and Pike, G. B. (2010b). MRI measurement of the BOLD-specific flow-volume relationship during hypercapnia and hypocapnia in humans. NeuroImage 53, 383–391. doi: 10.1016/j.neuroimage.2010.07.003
Chen, J. J., Wieckowska, M., Meyer, E., and Pike, G. B. (2008). Cerebral blood flow measurement using fMRI and PET: a cross-validation study. Int. J Biomed. Imaging 2008:516359. doi: 10.1155/2008/516359
Chiarelli, P. A., Bulte, D. P., Wise, R., Gallichan, D., and Jezzard, P. (2007). A calibration method for quantitative BOLD fMRI based on hyperoxia. NeuroImage 37, 808–820. doi: 10.1016/j.neuroimage.2007.05.033
Duffin, J., Hare, G. M. T., and Fisher, J. A. (2019). A mathematical model of cerebral blood flow control in anaemia and hypoxia. J. Physiol. 598, 717–730. doi: 10.1113/JP279237
Duffin, J., Mikulis, D. J., and Fisher, J. A. (2021). Control of cerebral blood flow by blood gases. Front. Physiol. 12:640075. doi: 10.3389/fphys.2021.640075
Duffin, J., Sobczyk, O., Crawley, A. P., Poublanc, J., Mikulis, D. J., and Fisher, J. A. (2015). The dynamics of cerebrovascular reactivity shown with transfer function analysis. NeuroImage 114, 207–216. doi: 10.1016/j.neuroimage.2015.04.029
Duffin, J., Sobczyk, O., Crawley, A., Poublanc, J., Venkatraghavan, L., Sam, K., et al. (2017). The role of vascular resistance in BOLD responses to progressive hypercapnia. Hum. Brain Mapp. 38, 5590–5602. doi: 10.1002/hbm.23751
Duffin, J., Sobczyk, O., McKetton, L., Crawley, A., Poublanc, J., Venkatraghavan, L., et al. (2018). Cerebrovascular resistance: the basis of cerebrovascular reactivity. Front. Neurosci. 12:409. doi: 10.3389/fnins.2018.00409
Ellis, M. J., Ryner, L. N., Sobczyk, O., Fierstra, J., Mikulis, D. J., Fisher, J. A., et al. (2016). Neuroimaging assessment of cerebrovascular reactivity in concussion: current concepts, methodological considerations, and review of the literature. Front. Neurol. 7:61. doi: 10.3389/fneur.2016.00061
Faraci, F. M., and Heistad, D. D. (1990). Regulation of large cerebral arteries and cerebral microvascular pressure. Circ. Res. 66, 8–17. doi: 10.1161/01.RES.66.1.8
Feihl, F., and Perret, C. (1994). Permissive hypercapnia. How permissive should we be? Am. J. Respir. Crit. Care Med. 150, 1722–1737. doi: 10.1164/ajrccm.150.6.7952641
Fierstra, J., Machina, M., Battisti-Charbonney, A., Duffin, J., Fisher, J. A., and Minkovich, L. (2011). End-inspiratory rebreathing reduces the end-tidal to arterial PCO(2) gradient in mechanically ventilated pigs. Intensive Care Med. 37, 1543–1550. doi: 10.1007/s00134-011-2260-y
Fierstra, J., Sobczyk, O., Battisti-Charbonney, A., Mandell, D. M., Poublanc, J., Crawley, A. P., et al. (2013). Measuring cerebrovascular reactivity: what stimulus to use? J. Physiol. 591, 5809–5821. doi: 10.1113/jphysiol.2013.259150
Fierstra, J., van Niftrik, C., Warnock, G., Wegener, S., Piccirelli, M., Pangalu, A., et al. (2018). Staging hemodynamic failure with blood oxygen-level-dependent functional magnetic resonance imaging cerebrovascular reactivity: a comparison versus gold standard (15O-)H2O-positron emission tomography. Stroke 49, 621–629. doi: 10.1161/STROKEAHA.117.020010
Fierstra, J., Winter, J. D., Machina, M., Lukovic, J., Duffin, J., Kassner, A., et al. (2012). Non-invasive accurate measurement of arterial PCO(2) in a pediatric animal model. J. Clin. Monit. Comput. 27, 147–155. doi: 10.1007/s10877-012-9403-8
Fisher, J. A. (2016). The CO2 stimulus for cerebrovascular reactivity: fixing inspired concentrations vs. targeting end-tidal partial pressures. J. Cereb. Blood Flow Metab. 36, 1004–1011. doi: 10.1177/0271678X16639326
Fisher, J. A., Iscoe, S., and Duffin, J. (2016). Sequential gas delivery provides precise control of alveolar gas exchange. Respir. Physiol. Neurobiol. 225, 60–69. doi: 10.1016/j.resp.2016.01.004
Fisher, J. A., Sobczyk, O., Crawley, A., Poublanc, J., Dufort, P., Venkatraghavan, L., et al. (2017). Assessing cerebrovascular reactivity by the pattern of response to progressive hypercapnia. Hum. Brain Mapp. 38, 3415–3427. doi: 10.1002/hbm.23598
Fisher, J. A., Venkatraghavan, L., and Mikulis, D. J. (2018). Magnetic resonance imaging-based cerebrovascular reactivity and hemodynamic reserve. Stroke 49, 2011–2018. doi: 10.1161/STROKEAHA.118.021012
Forte, S., Sobczyk, O., Poublanc, J., Duffin, J., Fisher, J. A., and Mikulis, D. J. (2020). Sickle cell cerebrovascular reactivity to a CO2 stimulus is both too little and too slow. Am. Soc. Hematol.
Grubb, R. L. Jr., Raichle, M. E., Eichling, J. O., and Ter-Pogossian, M. M. (1974). The effects of changes in PaCO2 on cerebral blood volume, blood flow, and vascular mean transit time. Stroke 5, 630–639. doi: 10.1161/01.str.5.5.630
Gupta, A., Chazen, J. L., Hartman, M., Delgado, D., Anumula, N., Shao, H., et al. (2012). Cerebrovascular reserve and stroke risk in patients with carotid stenosis or occlusion: a systematic review and meta-analysis. Stroke 43, 2884–2891. doi: 10.1161/STROKEAHA.112.663716
Harper, A. M., and Glass, H. I. (1965). Effect of alterations in the arterial carbon dioxide tension on the blood flow through the cerebral cortex at normal and low arterial blood pressures. J. Neurol. Neurosurg. Psychiatry 28, 449–452. doi: 10.1136/jnnp.28.5.449
Hoge, R. D., Atkinson, J., Gill, B., Crelier, G. R., Marrett, S., and Pike, G. B. (1999). Investigation of BOLD signal dependence on cerebral blood flow and oxygen consumption: the deoxyhemoglobin dilution model. Magn. Reson. Med. 42, 849–863. doi: 10.1002/(sici)1522-2594(199911)42:5<849::aid-mrm4>3.0.co;2-z
Hoiland, R. L., Fisher, J. A., and Ainslie, P. N. (2019). Regulation of the cerebral circulation by arterial carbon dioxide. Compr. Physiol. 9, 1101–1154. doi: 10.1002/cphy.c180021
Holmes, K. R., Tang-Wai, D., Sam, K., McKetton, L., Poublanc, J., Crawley, A. P., et al. (2020). Slowed temporal and parietal cerebrovascular response in patients with Alzheimer’s disease. Can. J. Neurol. Sci. 47, 366–373. doi: 10.1017/cjn.2020.30
Ito, S., Mardimae, A., Han, J., Duffin, J., Wells, G., Fedorko, L., et al. (2008). Non-invasive prospective targeting of arterial P(CO2) in subjects at rest. J. Physiol. 586, 3675–3682. doi: 10.1113/jphysiol.2008.154716
Jones, N. L., and Jurkowski, J. E. (1979). Body carbon dioxide storage capacity in exercise 61. J. Appl. Physiol. 46, 811–815. doi: 10.1152/jappl.1979.46.4.811
Jones, N. L., Robertson, D. G., and Kane, J. W. (1979). Difference between end-tidal and arterial PCO2 in exercise 1. J. Appl. Physiol. 47, 954–960. doi: 10.1152/jappl.1979.47.5.954
Lassen, N. A. (1959). Cerebral blood flow and oxygen consumption in man. Physiol. Rev. 39, 183–238. doi: 10.1152/physrev.1959.39.2.183
Mandell, D. M., Han, J. S., Poublanc, J., Crawley, A. P., Stainsby, J. A., Fisher, J. A., et al. (2008). Mapping cerebrovascular reactivity using blood oxygen level-dependent MRI in patients with arterial steno-occlusive disease: comparison with arterial spin labeling MRI. Stroke 39, 2021–2028. doi: 10.1161/STROKEAHA.107.506709
Mark, C. I., Slessarev, M., Ito, S., Han, J., Fisher, J. A., and Pike, G. B. (2010). Precise control of end-tidal carbon dioxide and oxygen improves BOLD and ASL cerebrovascular reactivity measures. Magn. Reson. Med. 64, 749–756. doi: 10.1002/mrm.22405
Markus, H., and Cullinane, M. (2001). Severely impaired cerebrovascular reactivity predicts stroke and TIA risk in patients with carotid artery stenosis and occlusion 6. Brain 124, 457–467. doi: 10.1093/brain/124.3.457
McVerry, F., Liebeskind, D. S., and Muir, K. W. (2012). Systematic review of methods for assessing leptomeningeal collateral flow. AJNR Am. J. Neuroradiol. 33, 576–582. doi: 10.3174/ajnr.A2794
Moody, D. M., Bell, M. A., and Challa, V. R. (1990). Features of the cerebral vascular pattern that predict vulnerability to perfusion or oxygenation deficiency: an anatomic study. AJNR Am. J. Neuroradiol. 11, 431–439.
Mutch, W. A., Ellis, M. J., Ryner, L. N., Ruth Graham, M., Dufault, B., Gregson, B., et al. (2015). Brain magnetic resonance imaging CO stress testing in adolescent postconcussion syndrome. J. Neurosurg. 125, 648–660. doi: 10.3171/2015.6.JNS15972
Peebles, K., Celi, L., McGrattan, K., Murrell, C., Thomas, K., and Ainslie, P. N. (2007). Human cerebrovascular and ventilatory CO2 reactivity to end-tidal, arterial and internal jugular vein PCO2. J. Physiol. 584, 347–357. doi: 10.1113/jphysiol.2007.137075
Peng, H. L., Ivarsen, A., Nilsson, H., and Aalkjaer, C. (1998). On the cellular mechanism for the effect of acidosis on vascular tone. Acta Physiol. Scand. 164, 517–525. doi: 10.1111/j.1365-201x.1998.tb10701.x
Poublanc, J., Crawley, A. P., Sobczyk, O., Montandon, G., Sam, K., Mandell, D. M., et al. (2015). Measuring cerebrovascular reactivity: the dynamic response to a step hypercapnic stimulus. J. Cereb. Blood Flow Metab. 35, 1746–1756. doi: 10.1038/jcbfm.2015.114
Reinhard, M., Gerds, T. A., Grabiak, D., Zimmermann, P. R., Roth, M., Guschlbauer, B., et al. (2008). Cerebral dysautoregulation and the risk of ischemic events in occlusive carotid artery disease. J. Neurol. 255, 1182–1189. doi: 10.1007/s00415-008-0865-z
Reinhard, M., Schwarzer, G., Briel, M., Altamura, C., Palazzo, P., King, A., et al. (2014). Cerebrovascular reactivity predicts stroke in high-grade carotid artery disease. Neurology 83, 1424–1431. doi: 10.1212/WNL.0000000000000888
Reivich, M., Holling, H. E., Roberts, B., and Toole, J. F. (1961). Reversal of blood flow through the vertebral artery and its effect on cerebral circulation. N. Engl. J. Med. 265, 878–885. doi: 10.1056/NEJM196111022651804
Ringelstein, E. B., Sievers, C., Ecker, S., Schneider, P. A., and Otis, S. M. (1988). Noninvasive assessment of CO2-induced cerebral vasomotor response in normal individuals and patients with internal carotid artery occlusions 1. Stroke 19, 963–969. doi: 10.1161/01.STR.19.8.963
Robbins, P. A., Conway, J., Cunningham, D. A., Khamnei, S., and Paterson, D. J. (1990). A comparison of indirect methods for continuous estimation of arterial PCO2 in men. J. Appl. Physiol. 68, 1727–1731. doi: 10.1152/jappl.1990.68.4.1727
Robbins, P. A., Swanson, G. D., and Howson, M. G. (1982). A prediction-correction scheme for forcing alveolar gases along certain time courses. J. Appl. Physiol. 52, 1353–1357. doi: 10.1152/jappl.1982.52.5.1353
Sam, K., Conklin, J., Holmes, K. R., Sobczyk, O., Poublanc, J., Crawley, A. P., et al. (2016a). Impaired dynamic cerebrovascular response to hypercapnia predicts development of white matter hyperintensities. Neuroimage Clin. 11, 796–801. doi: 10.1016/j.nicl.2016.05.008
Sam, K., Crawley, A. P., Poublanc, J., Conklin, J., Sobczyk, O., Mandell, D. M., et al. (2016b). Vascular dysfunction in leukoaraiosis. AJNR Am. J. Neuroradiol. 37, 2258–2264. doi: 10.3174/ajnr.A4888
Sam, K., Peltenburg, B., Conklin, J., Sobczyk, O., Poublanc, J., Crawley, A. P., et al. (2016c). Cerebrovascular reactivity and white matter integrity. Neurology 87, 2333–2339. doi: 10.1212/WNL.0000000000003373
Scott, R. M., and Smith, E. R. (2009). Moyamoya disease and moyamoya syndrome. N. Engl. J. Med. 360, 1226–1237. doi: 10.1056/NEJMra0804622
Shafi, R., Poublanc, J., Venkatraghavan, L., Crawley, A., Sobczyk, O., McKetton, L., et al. (2020). A promising subject-level classification model for acute concussion based on cerebrovascular reactivity metrics. J. Neurotrauma. doi: 10.1089/neu.2020.7272 [Epub ahead of print]
Sheth, S. A., and Liebeskind, D. S. (2015). Collaterals in endovascular therapy for stroke. Curr. Opin. Neurol. 28, 10–15. doi: 10.1097/WCO.0000000000000166
Slessarev, M., Han, J., Mardimae, A., Prisman, E., Preiss, D., Volgyesi, G., et al. (2007). Prospective targeting and control of end-tidal CO2 and O2 concentrations. J. Physiol. 581, 1207–1219. doi: 10.1113/jphysiol.2007.129395
Sobczyk, O., Battisti-Charbonney, A., Fierstra, J., Mandell, D. M., Poublanc, J., Crawley, A. P., et al. (2014). A conceptual model for CO-induced redistribution of cerebral blood flow with experimental confirmation using BOLD MRI. NeuroImage 92, 56–68. doi: 10.1016/j.neuroimage.2014.01.051
Sobczyk, O., Battisti-Charbonney, A., Poublanc, J., Crawley, A. P., Sam, K., Fierstra, J., et al. (2015). Assessing cerebrovascular reactivity abnormality by comparison to a reference atlas. J. Cereb. Blood Flow Metab. 35, 213–220. doi: 10.1038/jcbfm.2014.184
Sobczyk, O., Crawley, A. P., Poublanc, J., Sam, K., Mandell, D. M., Mikulis, D. J., et al. (2016). Identifying significant changes in cerebrovascular reactivity to carbon dioxide. AJNR Am. J. Neuroradiol. 37, 818–824. doi: 10.3174/ajnr.A4679
Sobczyk, O., Sam, K., Mandell, D. M., Crawley, A. P., Venkatraghavan, L., McKetton, L., et al. (2020). Cerebrovascular reactivity assays collateral function in carotid stenosis. Front. Physiol. 11:1031. doi: 10.3389/fphys.2020.01031
Sommer, L. Z., Iscoe, S., Robicsek, A., Kruger, J., Silverman, J., Rucker, J., et al. (1998). A simple breathing circuit minimizing changes in alveolar ventilation during hyperpnoea. Eur. Respir. J. 12, 698–701. doi: 10.1183/09031936.98.12030698
Somogyi, R. B., Vesely, A. E., Preiss, D., Prisman, E., Volgyesi, G., Azami, T., et al. (2005). Precise control of end-tidal carbon dioxide levels using sequential rebreathing circuits. Anaesth. Intensive Care 33, 726–732. doi: 10.1177/0310057X0503300604
Swietach, P., Youm, J. B., Saegusa, N., Leem, C. H., Spitzer, K. W., and Vaughan-Jones, R. D. (2013). Coupled Ca2+/H+ transport by cytoplasmic buffers regulates local Ca2+ and H+ ion signaling. Proc. Natl. Acad. Sci. U. S. A. 110, E2064–E2073. doi: 10.1073/pnas.1222433110
Symon, L. (1968). Experimental evidence for “intracerebral steal” following CO2 inhalation. Scand. J. Clin. Lab. Investig. Suppl. 102:XIII.
Thomas, B. P., Liu, P., Aslan, S., King, K. S., van Osch, M. J., and Lu, H. (2013). Physiologic underpinnings of negative BOLD cerebrovascular reactivity in brain ventricles. NeuroImage 83, 505–512. doi: 10.1016/j.neuroimage.2013.07.005
Thomas, B. P., Liu, P., Park, D. C., van Osch, M. J., and Lu, H. (2014). Cerebrovascular reactivity in the brain white matter: magnitude, temporal characteristics, and age effects. J. Cereb. Blood Flow Metab. 34, 242–247. doi: 10.1038/jcbfm.2013.194
Vesely, A., Sasano, H., Volgyesi, G., Somogyi, R., Tesler, J., Fedorko, L., et al. (2001). MRI mapping of cerebrovascular reactivity using square wave changes in end-tidal PCO2. Magn. Reson. Med. 45, 1011–1013. doi: 10.1002/mrm.1134
Willie, C. K., Tzeng, Y. C., Fisher, J. A., and Ainslie, P. N. (2014). Integrative regulation of human brain blood flow. J. Physiol. 592, 841–859. doi: 10.1113/jphysiol.2013.268953
Keywords: cerebrovascular reactivity, MRI blood oxygen-level dependent, stroke risk, cerebral steal, hypercapnia, resistance map, speed of response, RespirAct™
Citation: Fisher JA and Mikulis DJ (2021) Cerebrovascular Reactivity: Purpose, Optimizing Methods, and Limitations to Interpretation – A Personal 20-Year Odyssey of (Re)searching. Front. Physiol. 12:629651. doi: 10.3389/fphys.2021.629651
Edited by:
Nicholas P. Blockley, University of Nottingham, United KingdomReviewed by:
Daniel Bulte, University of Oxford, United KingdomBinu P. Thomas, University of Texas Southwestern Medical Center, United States
Copyright © 2021 Fisher and Mikulis. This is an open-access article distributed under the terms of the Creative Commons Attribution License (CC BY). The use, distribution or reproduction in other forums is permitted, provided the original author(s) and the copyright owner(s) are credited and that the original publication in this journal is cited, in accordance with accepted academic practice. No use, distribution or reproduction is permitted which does not comply with these terms.
*Correspondence: David J. Mikulis, david.mikulis@uhn.ca