Detection of Fake News on COVID-19 on Web Search Engines
 Valeria Mazzeo
 Andrea Rapisarda1,2,3
 - 1Department of Physics and Astronomy “Ettore Majorana”, University of Catania, Catania, Italy
- 2Complexity Science Hub Vienna (CSH), Vienna, Austria
- 3INFN Sezione di Catania, Catania, Italy
- 4Department of Political and Social Sciences, University of Catania, Catania, Italy
In early January 2020, after China reported the first cases of the new coronavirus (SARS-CoV-2) in the city of Wuhan, unreliable and not fully accurate information has started spreading faster than the virus itself. Alongside this pandemic, people have experienced a parallel infodemic, i.e., an overabundance of information, some of which is misleading or even harmful, which has widely spread around the globe. Although social media are increasingly being used as the information source, web search engines, such as Google or Yahoo!, still represent a powerful and trustworthy resource for finding information on the Web. This is due to their capability to capture the largest amount of information, helping users quickly identify the most relevant, useful, although not always the most reliable, results for their search queries. This study aims to detect potential misleading and fake contents by capturing and analysing textual information, which flow through search engines. By using a real-world dataset associated with recent COVID-19 pandemic, we first apply re-sampling techniques for class imbalance, and then we use existing machine learning algorithms for classification of not reliable news. By extracting lexical and host-based features of associated uniform resource locators (URLs) for news articles, we show that the proposed methods, so common in phishing and malicious URL detection, can improve the efficiency and performance of classifiers. Based on these findings, we suggest that the use of both textual and URL features can improve the effectiveness of fake news detection methods.
1 Introduction
The reliability and credibility of both the information source and information itself have emerged as a global issue in contemporary society [1, 2]. Undoubtedly, in the last decades, social media have revolutionised the way in which information spreads across the Web and, more generally, the world [3, 4], by allowing users to freely share content faster than traditional news sources. The fact that content spreads so quickly and easily across platforms suggests that people (and algorithms behind the platforms) are potentially vulnerable to misinformation, hoaxes, biases, and low-credibility contents which are daily shared, accidentally or intentionally. The problem of spreading misinformation, however, affects not only the social media platforms but also the World Wide Web. In fact, every time people enter a search query on web search engines (WSEs), such as Google or Bing, they can view and potentially access hundreds, or thousands, of web pages with helpful information, sometimes potentially misleading. Meta title tags displayed on search engine results pages (SERPs) [5] represent then a crucial factor in helping the user understand pages’ content, being the user’s first experience of a website. Although people tend more likely to view and click on the first results on the first page because of search engines’ rank algorithms, e.g., PageRank (Page, 1998), which show the most relevant information in response to a specific query, a good title can be the make-or-break factor which brings users to click on that link and read on [6, 7]. Despite the systematic and significant response efforts and fact-checking against misinformation mobilised by both social media and media companies, fake news still persists due to the vast volume of online content, which leads people to see and share information that is partly, or completely, misleading. Previous and recent studies have almost exclusively focused on data from social media (e.g., Twitter) [8], fact-checking or reliable websites (e.g., snopes.com and politifact.com) [9], or existing datasets [10] which have the benefit to be cost-efficient. Due to the current difficult and unprecedented situation with the COVID-19 pandemic, never seen in the modern era [11], people have asked many questions about the novel coronavirus, such as the origin of the disease, treatment, prevention, cure, and transmission from or to pets, to face these challenges while staying informed and safe. In this study, we focus on news displayed by web search engines, since they represent the best tools for bringing up answers to people’s current questions, extracting information related to COVID-19 outbreak, and proposing an approach based on both textual and uniform resource locator (URL) features to analyse and detect whether news is fake/misleading or reliable (real). The contribution of our work can be summarised as follows:
• We use real-world data from WSEs, analysing both textual data (meta titles and descriptions) and URL information, by extracting feature representations.
• Since most of the previous works on fake news detection were focused on classifier enhancements, not engaging in feature engineering, in this document, we want to provide a new direction for the classification of fake news, proposing an integration of the most commonly used features in fake news detection and features that play an important role in malicious URL detection. The purpose of feature engineering is indeed to feed the original data and provide new and meaningful feature representations to improve machine learning (ML) algorithms for classification. Currently, the problem of detecting fake news via URL has not been well and sufficiently addressed. Several studies focused on fake news detection via ML in social networks [12] have looked at the presence of URLs in the user’s published content [13], without generally performing further analysis on the source of information or extracting other potential relevant URL-based features (features that are, indeed, more common in malicious URLs/phishing detection classifiers). Although, in the past, the usage of URLs in a post/news could have represented a useful parameter for enhancing and improving ML classifiers’ performance, nowadays this could result not enough for differentiating a good source from a bad one in terms of information credibility without a URL-based feature engineering approach. In fact, the more the ML techniques have evolved over time, the more the schemes for spreading fake news have changed.
• We apply re-sampling techniques, such as under-sampling and over-sampling, due to the class imbalance of the real-world dataset [14, 15]. Disproportion between classes still represents an open issue and challenge for researchers focused on classification problems. In a typical news dataset, the number of fake news is likely to be very few compared to the number of real ones, and this fact makes the positive class (fake news) very small compared to the negative class (real news). This imbalance between the two classes would likely make classifiers biased towards the majority class leading to classify all the instances in the dataset as belonging to the majority class.
• We compare different ML algorithms (support vector machine, stochastic gradient descent, logistic regression, naïve Bayes, and random forest) based on their performance. Since we deal with imbalanced data, we evaluate the models looking at
This paper is structured as follows: Materials and Methods introduces our material and methodology. Results describes the results of our experimentation along with their evaluation. In Discussion, we summarise our key findings and give an interpretation of them, also by discussing the implications. Finally, Conclusion draws the conclusions, giving some prospective points for future work.
2 Materials and Methods
2.1 Data Collection
We submitted several COVID-19–related queries (Table 1) on a WSE. For each search result, we extracted metadata information, i.e., URL, title, meta description (or snippet), and date (Figure 1).
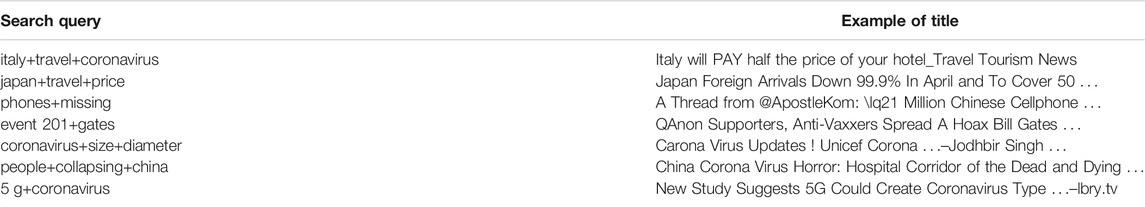
TABLE 1. Search queries submitted to web search engines and meta information results. The results of a search query are often returned as a list of metadata, and they may consist of web pages, images, and other types of files with helpful information.
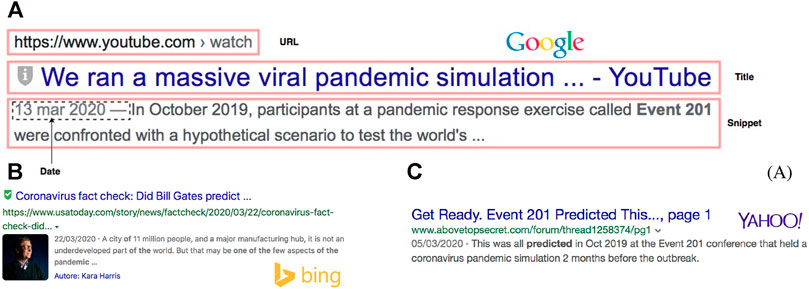
FIGURE 1. Example of search results on some of the most popular web search engines: Google (A), Bing (B), and Yahoo! (C). The most important meta tags displayed by the search engines results pages, in response to user queries, are title, description (or snippet), date, and cached URL. Panel (A) is scaled up in order to highlight the meta tags (in red rectangles) extracted during data collection.
The final dataset consisted of a collection of approximately 3,350 news results (fake/misleading and trusted/“real”), gathered from 2084 different URLs. All the news results were published within a seven-month time interval, between January 20 and July 28, 2020. We chose this time interval as it covered the first COVID-19 pandemic lockdowns proclaimed in Italy and in other countries [18]. Queries were selected based on topics (e.g., generic information on the new virus, pseudo-scientific therapies, conspiracy theories, and travels) [19] that we were monitoring on both the Web (online newspapers) and social media, during the first lockdown period. We also looked at fact-checking websites, such as politifact.com or poynter.com, to check news and information credibility [20].
In order to reduce potential bias due to search engine optimisation, we had carefully planned our data collection as follows:
• We used a VPN to be more consistent with the WSE domain inspected and its results.
• In order to browse the Internet and query the WSE, we used a private/incognito window. This allowed us to prevent our browsing history from being stored and from biasing our results. By using the incognito/private mode, we did not build a detailed picture of our online activity: in this way, all cookies were removed at the end of each session, i.e., we did not save any information about the pages we were visiting, avoiding to create customised results based on our search history. This process was repeated for each query and for each day of collection.
• We collected all the results, and not some of them (e.g., the first two pages or the top 10 results).
Even if we dramatically reduced bias during our data collection, the results from the WSE might be automatically biased by the WSEs we were querying because of their ranking systems, which sort results by relevance. We did not have any control on that, but we tried to address this potential bias comparing results from different WSEs, also across different days. Once we collected data, the labelling procedure was done manually, and it consisted of assigning a binary class label indicating whether the news was real (0) or fake/misleading (1). In the binary fake news detection problem, fake news is usually associated with the positive class, since it is the news detected by the classifier. The data labelling process for training ML algorithms is not only critical but also time-consuming. Because of the limited resources, we considered a limited sample size in our study, but big enough to be considered reliable and sufficiently large for binary detection [21]. The ML workflow proposed in this study was implemented in Python 3.8. Its schematic representation is illustrated in Figure 2.
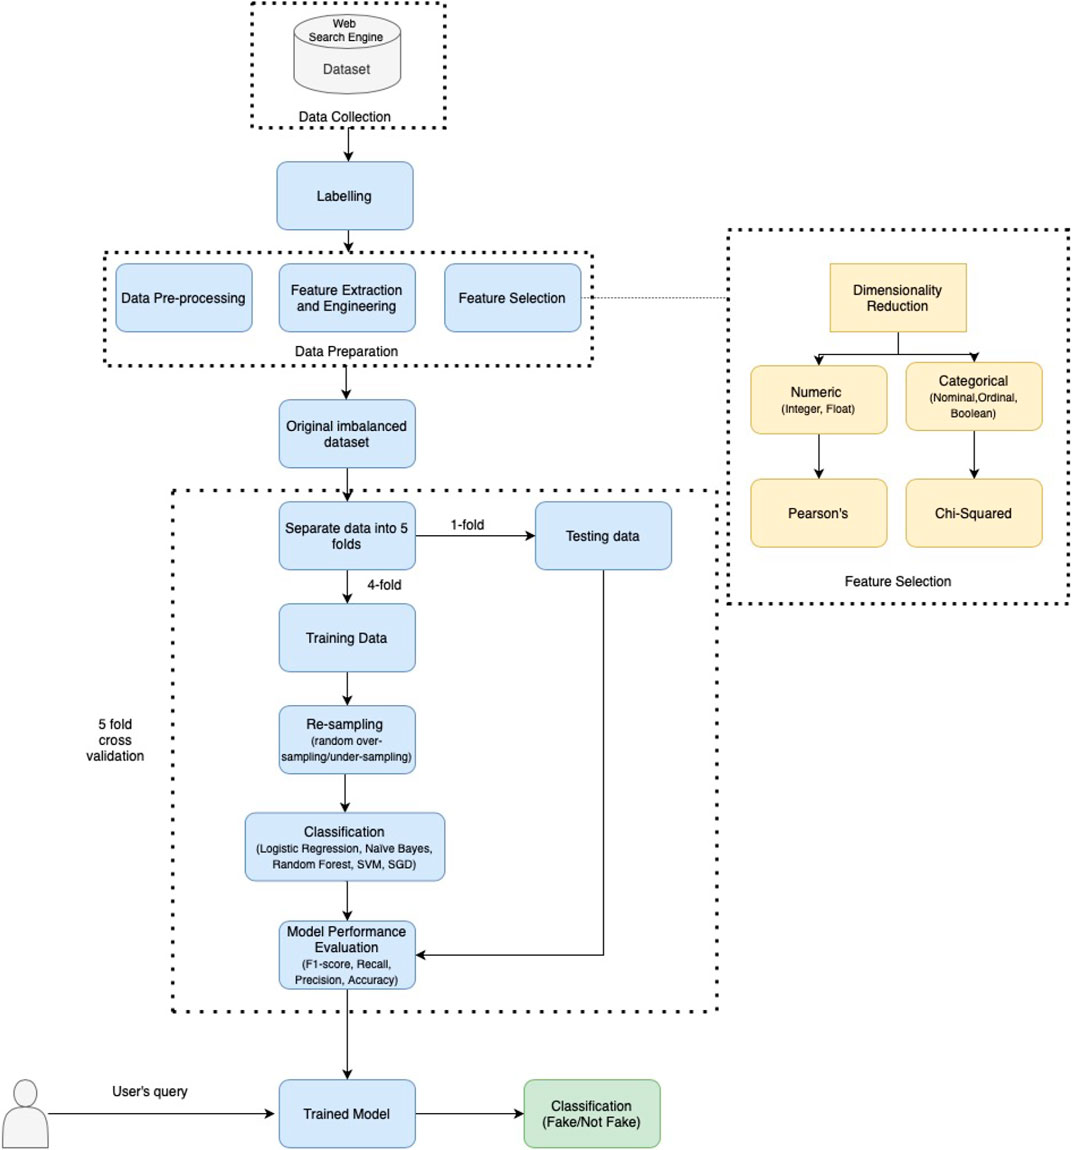
FIGURE 2. Machine learning workflow for training algorithms and classification of results from web search engines (WSEs). A KNN imputation algorithm and MinMaxScalar were used to rescale variables. However, the percentage of missing values in the dataset was very low (
2.2 Data Pre-Processing and Feature Engineering
In order to observe the most meaningful context words and to improve the performance of the classifiers, in the data pre-processing stage, we removed all parts that were irrelevant, redundant, and not related to the content: punctuation (with a few exceptions of symbols, such as exclamation marks, question marks, and quotation marks) and extra delimiters; symbols; dashes from both titles and descriptions; and stopwords [22]. By following guidance and advice given by fact-checking websites (e.g., factcheck.org) and reputable outlet sources (e.g., bbc.com) on how to spot fake news, we looked at the presence of words in capital letters and at the excessive use of punctuation marks in both titles and descriptions. Figure 3 shows the frequency of specific punctuation characters (“!”, “?”, “,” and “:”) and uppercase words in titles and descriptions for news labelled fake (1) and real (0). It is notable that fake news differs much more from the real one by the excessive use of punctuation, quotes, interrogatives, words in all capital letters, and exclamation mark to alert and urge people to read the news.
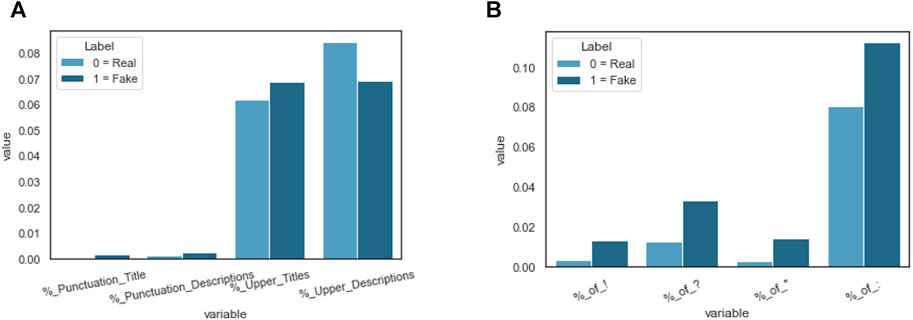
FIGURE 3. Frequency of (A) punctuation characters and uppercase words in meta titles and descriptions and (B) some specific punctuation characters (exclamation mark, question mark, quotes, and colons). With the exception of uppercase words that were used more frequently in meta descriptions, fake news has shown a higher percentage of punctuation in both titles and descriptions, probably by “over-dramatising” events; also, the use of uppercase characters in titles appears more evident in misleading content.
The frequency distributions in Figure 4 illustrate the top 20 uppercase words in the fake news and real news datasets. From the two histograms, we can derive important information regarding the use of various uppercase words in the two news sets. It can be noticed, in fact, that, in the real news dataset, all uppercase words are more related to abbreviations (e.g., United States and United Kingdom), acronyms (e.g., UNICEF), or organisations’ name (NBC and NCBI), while in the fake news dataset, the use of uppercase letters highlights potential warnings (e.g., CONTROL and CREATE), capitalising on coronavirus fears and conspiracy theories. This highlights the different use of capitalising all characters in a word, an unusual habit of reporters working for trustworthy websites, who generally follow style guidelines and journalistic convention.
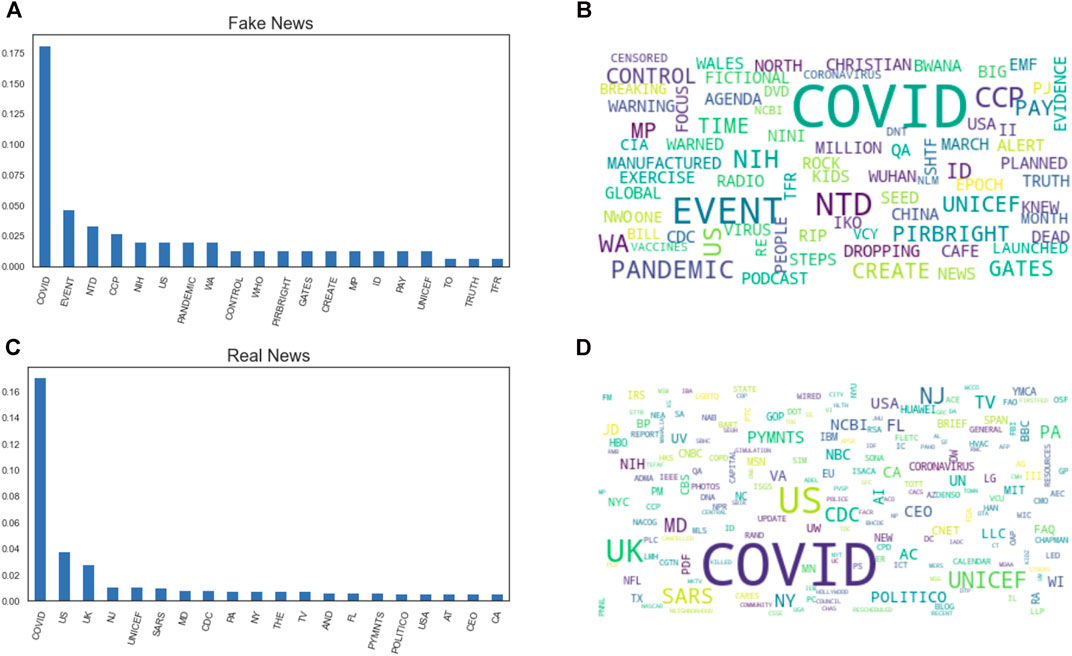
FIGURE 4. The 20 mostly used uppercase words in fake news (A) and real news (C) datasets. In panels (B) and (D), respectively, the word clouds show words sized according to their weights in the datasets. The use of uppercase words is different between the two datasets: in real news, the use of uppercase words is more frequent to indicate acronyms, brands, and organisations, while in fake news, uppercase words emphasise feelings, alerts, and potential warnings.
In the feature engineering stage, which typically includes feature creation, transformation, extraction, and selection, we used pre-training algorithms, such as bag-of-words (BoW) [23] and term frequency–inverse document frequency (TF-IDF) [24, 25], for mapping cleaned texts (titles and descriptions) into numeric representations. Further features (length, counting, and binary) were also extracted from URLs [26].
Information on the age of domain names was gathered from both the Wayback Machine and WHOIS [27], two tools that are crucial resources in the fight against fake news, as they allow users to see how a website has changed and evolved through time, gathering information on when the website was founded and on its country code, top-level domain (TLD), and contact information.
2.3 Re-Sampling
Although various ML methods assume that the target classes have same or similar distribution, in real conditions, this does not happen as data are unbalanced [28], with nearly most of the instances labelled as one class, while a few instances labelled as the other one. Since we worked with real-world data [29, 30], our dataset presented a high class imbalance with significantly less samples of fake news than the real one. To address poor performance in case of an unbalanced dataset, we used the following:
• Minority class random over-sampling technique, which consists in over-sizing the minority class by adding observations.
• Majority class random under-sampling technique, which consists in down-sizing the majority class by randomly removing observations from the training dataset.
The re-sampling algorithms chosen depend on the nature of the data, specifically on the ratio between the two classes, fake/real. Although we had a class imbalance skewed (90:10), we could not treat our case as a problem of anomaly (or outlier) detection. In fact, in order to be considered such a case, we would have had a very skewed distribution (100:1) between the normal (real) and rare (fake) classes. Although the choice of the number of folds is still an open problem, generally researchers choose a number of folds equal to 3 (less common), 5, or 10. We used a fivefold cross-validation due to the small size of our dataset, but enough to contain sufficient variation [31]. Each fold was used once as a validation, while the k−1 remaining folds formed the training set. This process repeatedly ran until each fold of the five folds was used as the testing set.
3 Results
In this section, we discuss features from URLs and the metrics used for evaluating models’ performance and report the classification results.
3.1 URL Analysis
We analysed lexical and host-based features from 2084 distinct URLs. To implement lexical features, we used a bag-of-words of tokens in the URL, where “/”, “?”, “.”, “=”, “_”, and “-” are delimiters. We distinguished tokens that appear in the host name, path, and top-level domain, using also the lengths of the host name and the URL as features [32, 33]. In Table 2, we show all the features extracted from URLs. Word-based features were introduced as well, as URLs were found to contain several suggestive word tokens. An example of the URL structure is shown indeed in Figure 5, where it is possible to distinguish the following parts:
• Scheme: it refers to the protocol, i.e., a set method for exchanging or transferring data, which the browser should use to retrieve any resource on the Web. https is the most secured version.
• Third-level domain: it is the next highest level following the second-level domain in the domain name hierarchy. The most commonly used third domain is www.
• Second-level domain: it is the level directly before the top-level domain. It is generally the part of a URL that identifies the website’s domain name.
• Top-level domain: it is the domain’s extension. The most used TLD is .com. The TLD can also give geographic data of a website, since each country has a unique domain suffix (e.g., .co.uk for United Kingdom websites).
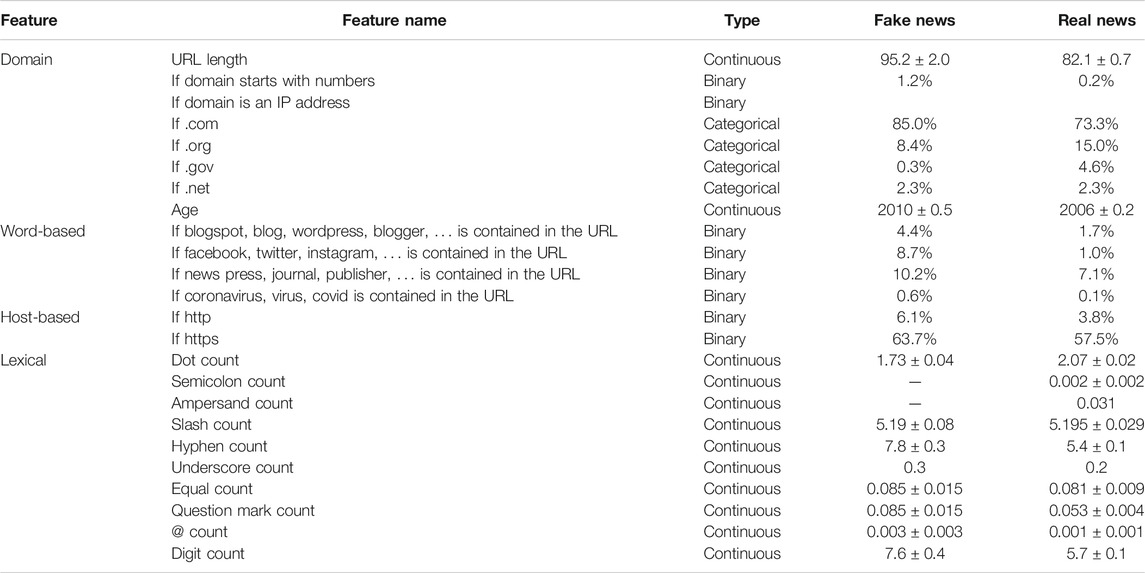
TABLE 2. List of domain, host-based, and lexical features extracted from URLs. There are 8 domain features; 4 word-based features, which show the presence of specific words in a URL; 2 host-based features; and 10 lexical features that include special characters’ count or show the presence of digits in a URL. The purpose of feature engineering was to find and explore new features to improve model performance for fake news detection. We used chi-square statistics and a correlation-based feature selection (CFS) approach. If reported, the error is the standard error of the mean.
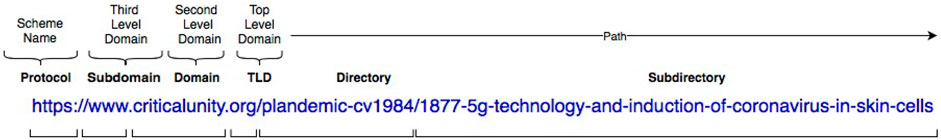
FIGURE 5. URL’s structure. A URL may contain mandatory (scheme and third-level, second-level, and top-level domains) and optional (path) parts.
We used the chi-squared (
• Null hypothesis (H0): there is no significant association between the variables and the dependent variable (fake/not fake).
• Alternate hypothesis (H1): there is an association between the variables and the dependent variable (fake/not fake).
We set a significance level of 0.05 [34]:
• If the p-value was less than the significance level, then we rejected the null hypothesis and concluded that there was a statistically significant association between the variables.
• If the p-value was greater than or equal to the significance level, we failed to reject the null hypothesis because there was not enough evidence to conclude that the variables were associated.
The correlation-based feature selection (CFS) algorithm was used for evaluating the worth or merit of a subset of features, taking into account the usefulness of individual features for predicting the class label. In order to check high correlations among independent variables, we also performed a multicollinearity test. Multicollinearity is indeed a common problem when estimating models such as logistic regression. In general, to simulate predictor variables with different degrees of collinearity, the Pearson pairwise correlation coefficients were varied: an absolute correlation greater than or equal to 0.7 can be considered an appropriate indicator for strong correlation [35]. To measure the increase in the prediction error of the model, the permutation importance feature was employed. The method is most suitable when the number of features is not huge as it is resource-intensive. This method can also be used for feature selection. In fact, it allows to select features based on their importance in the model. If there are features correlated, then the permutation importance will be low for all the correlated features. The choice of permutation importance as an extra method for feature selection was justified also by the use of different models, tree-based and not-tree–based, respectively [36]. These feature selection methods allowed us to select a small number of highly predictive features in order to avoid over-fitting.
In our fake news dataset, the average length of URL was 95.2 characters. This URL length is greater than the values found in [37–39] for phishing URLs. The number of hyphens (-) in the URL was found to be greater than 7 on average for fake news URLs. The most surprising result is in the number of dots in the URL: fake news URLs in our dataset do not contain more than two dots on average. In Table 3, we can observe that websites publishing fake news have generally newer domain name’s age than websites publishing reliable news (Table 3 and Figure 6).

TABLE 3. Summary statistics of domain name’s age (the Wayback Machine) of distinct websites in our dataset.
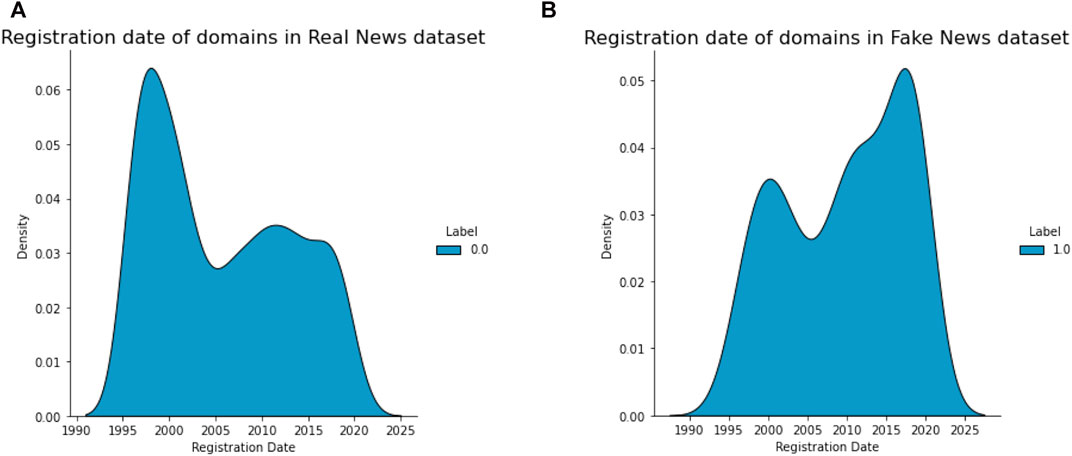
FIGURE 6. Density distribution of domain name’s age by class. The resulting distributions show a very clear negative skew (B) versus a positive skew (A). Age of domain can be extracted from Wayback or WHOIS external services. Based on the analysis, we observed that fake news or misleading content is published or shared more likely by newer websites.
For validating the results shown in Table 3, we used Welch’s t-test, which is usable independently of the data distribution, thanks to the central limit theorem. The p-value (
3.2 Performance Metrics
In terms of model performance measurement, the decision made by the classifier can be represented as a 2 × 2 confusion matrix having the following four categories:
• True positive (TP), i.e.., the number of positive instances that are correctly classified.
• False positive (FP), i.e., the number of misclassified positive instances.
• True negative (TN), i.e., the number of negative instances that are correctly classified.
• False negative (FN), i.e., the number of misclassified negative instances.
To evaluate the effectiveness of models, we used the following metrics [40]:
• Precision, which measures the percentage of news flagged as fake that was correctly classified, is described as follows:
• Accuracy, which measures the percentage of misclassified news, is described as follows:
• Recall, which measures the percentage of actual fake news that was correctly classified, is described as follows:
•
Both F1 score and recall are good metrics for the evaluation of imbalanced data.
3.3 Model Evaluation
Since we are dealing with imbalanced data, the predictive accuracy represents a misleading indicator, as it reflects the underlying class distributions, making it difficult for a classifier to perform well on the minority class [24]. For this reason, we used F1 score [28, 41] and recall metrics, as the higher the value assumed by these metrics, the better the class of interest.
Table 4 shows the evaluation metrics for all the classifiers we considered. It can be noticed that the classification metrics depend on the type of classifier and on the extracted features used for the classification. The logistic regression with BoW model was the most effective classifier when we over-sampled the data, reaching the highest F1 score (71%), followed by the naïve Bayes with BoW model (70%) and SVM with TF-IDF (69%).
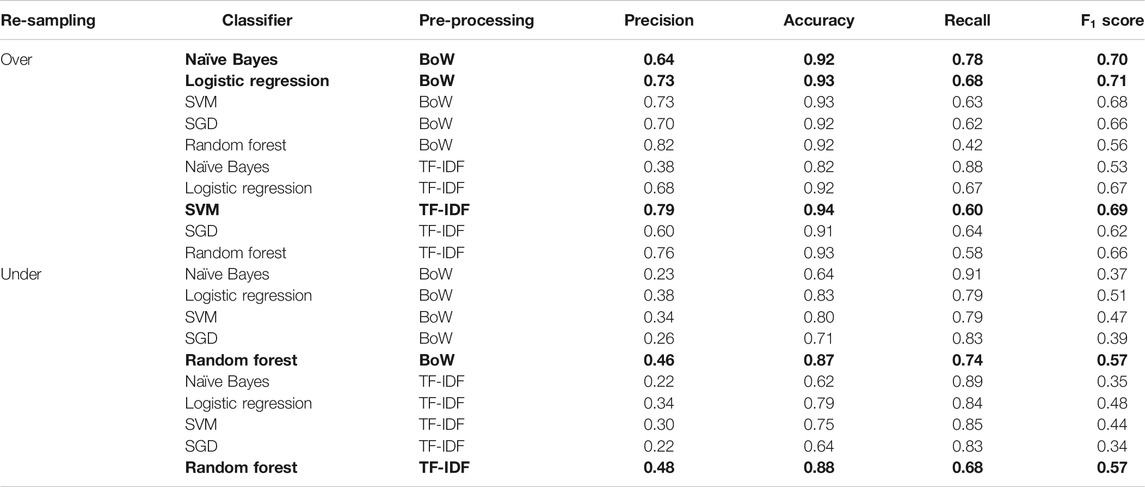
TABLE 4. Evaluation metrics (precision, accuracy, recall, and F1 score) for all the classifiers, considering only textual feature selection. Bold values represent the highest performance results based on the F1 score. We used different metrics for evaluating ML classifiers with BoW and with TF-IDF. As shown in this table, the logistic regression classifier performed better with F1 score 0.71 compared to other classifiers using BoW in case of over-sampled data. Similarly, the SVM classifier performed better using TF-IDF in case of over-sampled data. Due to the small size of the dataset, the under-sampling technique was not well-suited for the classifiers, as the results showed that the classifiers performed very poorly.
When we used the under-sampling technique and removed instances from the majority class, the score of the classifier models was very poor compared to the over-sampling technique. SGD with TF-IDF and naïve Bayes with TF-IDF and BoW came out the worst with F1 scores of 34, 35, and 37%, respectively. From Table 4, it can be seen only the random forest classifier got an F1 score greater than 50%, unlike the other classifiers when the under-sampling algorithm was applied, though the precision metric results were very poor.
Figure 7 shows a comparison of the classifiers using different feature extraction techniques (BoW and TF-IDF) based on the F1 score metric (Table 4).
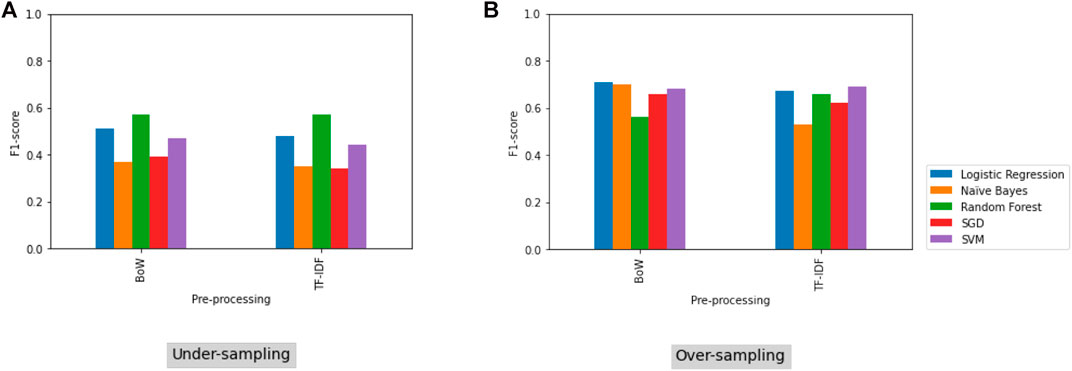
FIGURE 7. Comparison of classification of the F1 score metric for the models obtained by the two feature extraction methods (BoW and TF-IDF) for under-sampled (A) and over-sampled (B) data. The F1 score is used in the case of imbalanced datasets.
Based on the analysis we performed in URL Analysis, we observed a positive influence on the F1 score and recall metrics (Figure 8) in some ML classifiers, after including the most relevant features extracted from URLs. As shown in Table 5, the implementation of new features extracted from URLs successfully assisted the classifiers, by improving their performance.
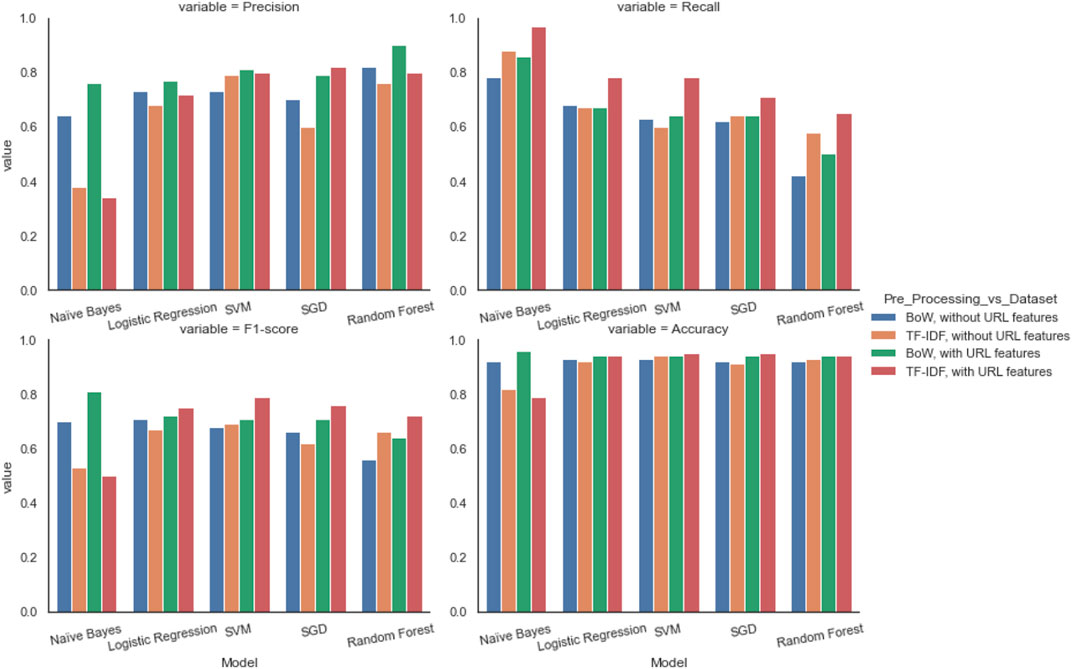
FIGURE 8. Comparison of metrics (precision, accuracy, recall, and F1 score) by model, before and after adding URL features in our ML classifiers. Overall, the results verify the effectiveness of introducing URL features. This is more evident in the classifiers that use TF-IDF.
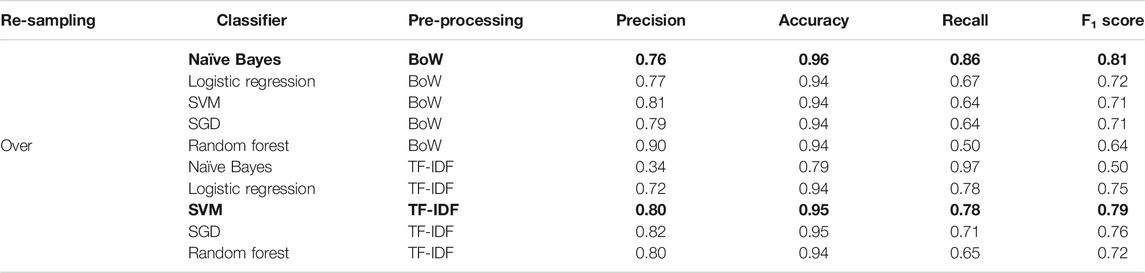
TABLE 5. Evaluation metrics (precision, accuracy, recall, and F1 score) for all the classifiers after URL feature selection. Bold values represent the highest performance results based on the F1 score. As shown in this table, the naïve Bayes classifier performed better with F1 score 0.81 compared to other classifiers using BoW in case of over-sampled data. Similarly, the SVM classifier performed better using TF-IDF with F1 score 0.79. It is evident that adding the URL features improved the model’s performance.
A visual inspection of metrics by model, before and after adding URL features in our ML classifiers, is illustrated in Figure 8. The results verify the effectiveness of introducing URL features, with values approximately above 0.70 for the two types of pre-processing. Before URL feature selection, the highest F1 score was 0.71.
4 Discussion
In binary classification problems, class imbalance represents an open challenge as real-word datasets are usually skewed. One issue involves the determination of the most suitable metrics for evaluating model performance. The F1 score, defined as the harmonic mean of precision and recall (Performance Metrics), has been commonly used to measure the level of imbalance. Our data had a significantly high level of imbalance (majority class, i.e., real news, was approximately 90% of our dataset, and minority class, i.e., fake news, represented only 10% of the dataset). A way to address and mitigate the class imbalance problem was data re-sampling, which consists of either over-sampling or under-sampling the dataset. Over-sampling the dataset is based on rebalancing distributions by supplementing artificially generated instances of the minor class (i.e., fake news). On the contrary, the under-sampling method is based on rebalancing distributions by removing instances of the majority class (i.e., real news). By under-sampling the majority class, we had to reduce the sample size, which resulted to be too small for training models, causing poor performance. By over-sampling data, we instead noticed better results in terms of both recall and F1 score metrics, boosting up the model performance.
We compared models based on popular feature representations, such as BoW and TF-IDF. After over-sampling data, the evaluation metrics returned results with F1 scores over 70% for both logistic regression and naïve Bayes classifiers with BoW.
In order to further improve the results, we decided to focus on news sources as well, exploring and selecting URL features that have displayed high impact in various studies [27, 42, 43].
In fact, just like phishing attacks (e.g., suspicious e-mails or malicious links), fake news continues to be a top concern, as it still spreads across the Web and will continue to spread until everyone understands how to spot it.
A comparison between phishing websites and websites that deliberately have published fake news is shown in Table 6. It is evident that websites that publish and share misleading content have generally URLs with identifiable features (Table 2), like malicious URLs.
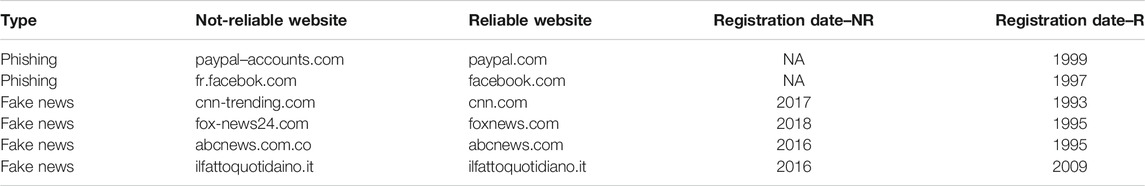
TABLE 6. Comparison of not-reliable (NR) and reliable (R) websites. Alongside lexical features, domain name’s registration date (extracted from WHOIS) can be relevant to spot fake websites.
As shown in Table 6, phishing is carried out also by the typosquatting domain, i.e., by registering a domain name that is extremely similar to an existing popular one. In the past few years, various online websites have been created to imitate trustworthy websites in order to publish misleading and fake content: for example, abcnews.com (registered in 1995) and abcnews.com.co (registered ahead of the 2016 United States election) or ilfattoquotidiano.it (registered in 2009) and ilfattoquotidaino.it (registered in 2016). Table 7 shows an example of the URLs and corresponding data extracted from WSE.
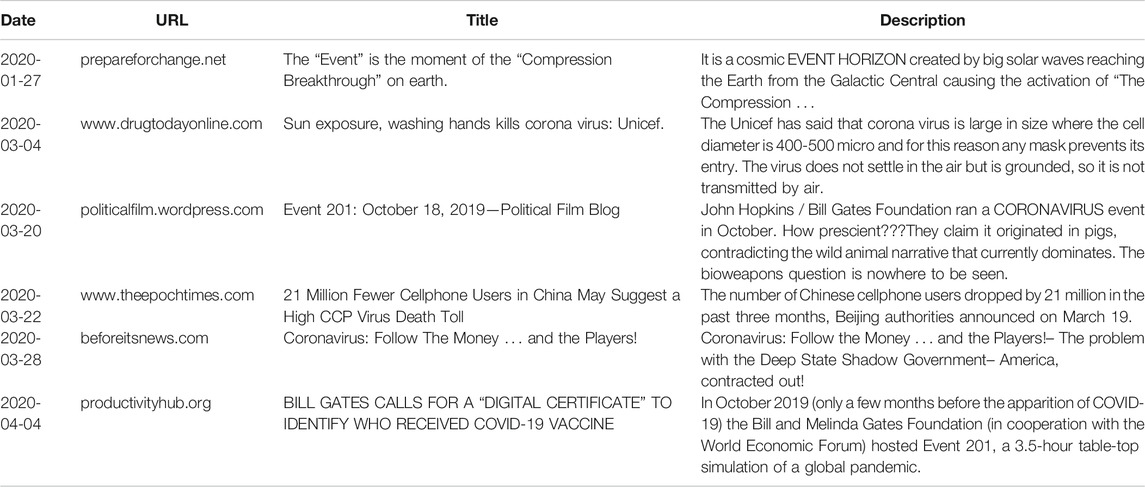
TABLE 7. Example of fake news in our dataset. COVID-19 pandemic has resulted in misleading information, false claims, and pseudo-scientific therapies, regarding the diagnosis, treatment, prevention, origin, and spread of the virus. Conspiracy theories have been widespread too, mostly online through blogs, forums, and social media.
One of the most relevant URL features was certainly the registration date. In our dataset, the average age of domain name of websites publishing fake news was 2008, while that of websites publishing real news was 2004 (Table 3). Most of websites publishing fake news are, therefore, newer than websites which spread reliable news. This was in line with our expectation, i.e., websites publishing reliable news are typically older, having more time to build reputation, while those that publish fake news and misleading content are likely unknown websites created more recently.
The other features extracted from URLs had also a positive impact on the detection problem. By using correlation matrix heatmap and looking at findings from other research works, we selected features that most affected the target variable. Like in phishing, websites or blogs that publish and share fake news may contain special symbols (such as @ and &) to obfuscate links and trick readers into thinking that the URL leads to a legitimate website. For example, abcnews.com.co is a fake website, where the use of dots is for adding an extension (i.e., .co). On the contrary, the proportion of http and https did not provide relevant information, as https secured protocol now is commonly used. News by TLD showed that the most popular TLDs are .com (85% in the fake news dataset; 73.3% in the real news dataset) and .org (8.4% in the fake news dataset; 15% in the real news dataset) (Table 2). Furthermore, large numbers of digits and hyphens (greater than 7 on average) were found within URLs in the fake news dataset, making it possible to compare with results obtained from the analysis of malicious URLs [44, 45].
By entering the selected URL features in the model, the naïve Bayes classifier with BoW achieved an
Based on the achieved result, we concluded that the use of URL features increased the performance of models.
In terms of challenges, the class imbalance of real-world data and the limited accessibility of a high-quality labelled dataset are two of the major ones. The use of ML classification models in fake news detection still appears more challenging in realistic situations, especially on web search engines, where metadata information from thousands of websites is collected.
Furthermore, similarly to phishing attacks, people (or bots) who write fake news and misleading content constantly look for new and creative ways to fool users into believing that their stories involve trustworthy sources. This makes it necessary to keep models continuously updated as fake news is becoming more and more sophisticated and difficult to spot. Also, misleading contents vary greatly and change over time; therefore, it is essential to investigate new features.
5 Conclusion
In this study, we analysed metadata information extracted from web search engines, after submitting specific search queries related to the COVID-19 outbreak, simulating a normal user’s activity. By using both textual and URL properties of data, we trained different machine learning algorithms with pre-processing methods, such as bag-of-words and TF-IDF. In order to deal with class imbalance due to real-world data, we applied re-sampling techniques, i.e., over-sampling of fake news and under-sampling of real news. While the over-sampling technique allowed us to get satisfactory results, the under-sampling method was not able to increase model performance, showing very poor results due to the small sample size. Although news has some specific textual properties which can be used for its classification as fake or real, when we look at search results (titles, snippets, and links), some additional pre-processing can be used to obtain some specific extra features for fake news detection on WSEs. While text features are related to news content, gathered from both titles and snippets, URL features are based on the source websites returned as search results on WSEs.
While most previous studies focused on fake news detection in social media, relying on data which can be directly gathered from the text (e.g., tweets) and from the usage of URLs for improving source credibility, our proposed approach goes further and analyses URL features of the source of information itself. We believe, indeed, that URL pattern analysis via phishing detection techniques can enhance ML algorithms’ ability to detect and mitigate the spread of fake news across the World Wide Web. Checking the source is, indeed, one of the most common advice that fact-checking websites give to online readers [46]. The results from this study suggest that information on URLs, extracted by using phishing techniques (e.g., number of digits, number of dots, and length of the URL), could provide indications to researchers regarding a number of potentially useful features that future fake news detection algorithms might have or develop in order to bring out further valuable information on websites containing mostly false content and improve the model performance.
The analysis of fake news which spreads on the Web might have, however, a potential limitation, due to search engine optimisation. In this study, we proposed a possible solution to address it. In fact, although search engine results might be customised based on online user location and the user’s search history, in order to reduce bias due to prior searching on the WSEs, it would be helpful to change settings preferences, delete cache, cookies, and search history, or use incognito/private windows. Furthermore, the use of proxies (or VPN) could allow to search queries on WSEs being location independent.
In terms of future research on fake news detection, we believe that techniques commonly used for malicious URL detection should also be considered for fake news detection: this would mean building classifiers based not only on traditional lexical and semantic features of texts but also on lexical and host-based features of the URL.
As future work, we therefore plan to construct more discriminative features to detect fake content, by profiling malicious sources of information based on domains, investigating in more detail, with additional performance metrics such as the net reclassification index (NRI), the improvement in prediction performance gained by adding a marker to the set of baseline predictors, in order to facilitate designing even better classification models for fake news detection.
Data Availability Statement
The datasets presented in this study are available upon request in the following online repository: https://github.com/valesdn/Detection-of-fake-news-on-CoViD-19-on-WSE.
Author Contributions
VM collected and analysed the data. AR and GG supervised the study. All authors reviewed the article.
Conflict of Interest
The authors declare that the research was conducted in the absence of any commercial or financial relationships that could be construed as a potential conflict of interest.
References
1. Greer JD. Evaluating the Credibility of Online Information: A Test of Source and Advertising Influence. Mass Commun Soc (2003) 6:11–28. doi:10.1207/s15327825mcs0601_3
2. Zha X, Yang H, Yan Y, Liu K, Huang C. Exploring the Effect of Social media Information Quality, Source Credibility and Reputation on Informational Fit-To-Task: Moderating Role of Focused Immersion. Comput Hum Behav (2018) 79:227–37. doi:10.1016/j.chb.2017.10.038
3. Chou W-y. S, Hunt YM, Beckjord EB, Moser RP, Hesse BW. Social media Use in the united states: Implications for Health Communication. J Med Internet Res (2009) 11(4):e48. doi:10.2196/jmir.1249
4. Breland JY, Quintiliani LM, Schneider KL, May CN, Pagoto S. Social media as a Tool to Increase the Impact of Public Health Research. Am J Public Health (2017) 107(12):1890–1. doi:10.2105/AJPH.2017.304098
5. Brin S, Page L. The Anatomy of a Large-Scale Hypertextual Web Search Engine. Computer Networks ISDN Syst (1998) 30:107–17. doi:10.1016/s0169-7552(98)00110-x
6. Manjesh S, Kanakagiri T, Vaishak P, Chettiar V, Shobha G. Clickbait Pattern Detection and Classification of News Headlines Using Natural Language Processing, International Conference on Computational Systems and Information Technology for Sustainable Solution (CSITSS); December 2017; Bengaluru, India, IEEE. (2017). p. 1–5. doi:10.1109/CSITSS.2017.8447715
7. Bourgonje P, Moreno Schneider J, Rehm G. From Clickbait to Fake News Detection: An Approach Based on Detecting the Stance of Headlines to Articles, Proceedings of the 2017 EMNLP workshop: Natural language processing meets journalism; September 2017; Copenhagen, Denmark. Association for Computational Linguistics (2017) p. 84–9. doi:10.18653/v1/W17-4215
8. Aldwairi M, Alwahedi A. Detecting Fake News in Social media Networks. Proced Computer Sci (2018) 141:215–22. doi:10.1016/j.procs.2018.10.171
9. Elhadad MK, Li KF, Gebali F. Detecting Misleading Information on Covid-19. IEEE Access (2020) 8:165201–15. doi:10.1109/ACCESS.2020.3022867
10. Agarwal V, Sultana HP, Malhotra S, Sarkar A. Analysis of Classifiers for Fake News Detection. Proced Computer Sci (2019) 165:377–83. Available: at https://www.reuters.comp. doi:10.1016/j.procs.2020.01.035
11. Madani Y, Erritali M, Bouikhalene B. Using Artificial Intelligence Techniques for Detecting Covid-19 Epidemic Fake News in Moroccan Tweets. Results Phys (2021) 25:104266. doi:10.1016/j.rinp.2021.104266
12. Helmstetter S, Paulheim H. Collecting a Large Scale Dataset for Classifying Fake News Tweets Using Weak Supervision. Future Internet (2021) 13:114. doi:10.3390/fi13050114
13. Desuky AS, Hussain S. An Improved Hybrid Approach for Handling Class Imbalance Problem. Arab J Sci Eng (2021) 46:3853–64. doi:10.1007/s13369-021-05347-7
14. Al-Rifaie MM, Alhakbani HA. Handling Class Imbalance in Direct Marketing Dataset Using a Hybrid Data and Algorithmic Level Solutions. In: Handling Class Imbalance in Direct Marketing Dataset Using a Hybrid Data and Algorithmic Level Solutions. London, United Kingdom: SAI Computing Conference (2016) p. 446–51. doi:10.1109/SAI.2016.7556019
15. Sokolova M, Japkowicz N, Szpakowicz S. Beyond Accuracy, F-Score and Roc: a Family of Discriminant Measures for Performance evaluationAdvances in Artificial Intelligence. AILecture Notes Computer Sci (2006) 4304:1015–21. doi:10.1007/11941439_114
16. Lee GH, Shin S-Y. Federated Learning on Clinical Benchmark Data: Performance Assessment. J Med Internet Res (2020) 22:e20891–451. doi:10.2196/20891
17. Times F (2021). Available at: https://ig.ft.com/coronavirus-lockdowns/Accessed 2021 04 27.
18. Naeem SB, Bhatti R, Khan A. An Exploration of How Fake News Is Taking over Social media and Putting Public Health at Risk. Health Inf libraries J (2020) doi:10.1111/hir.12320
19.Poynterorg (2020). Available at: https://www.poynter.org/, Accessed: 2020-03-15.
20. Beleites C, Neugebauer U, Bocklitz T, Krafft C, Popp J. Sample Size Planning for Classification Models. Analytica Chim Acta (2013) 760:25–33. doi:10.1016/j.aca.2012.11.007
22. Zhang Y, Jin R, Zhou Z-H. Understanding Bag-Of-Words Model: a Statistical Framework. Int J Mach Learn Cyber (2010) 1:43–52. doi:10.1007/s13042-010-0001-0
23. Al Asaad B, Erascu M. A Tool for Fake News Detection, International Symposium on Symbolic and Numeric Algorithms for Scientific Computing; 20-23 Sept. 2018; Timisoara, Romania. SYNASC (2018) p. 379–86. doi:10.1109/SYNASC.2018.00064
24. Ahmed H, Traore I, Sherif S. Detecting Opinion Spams and Fake News Using Text Classification. Security and Privacy (2017) 1:e9. doi:10.1002/spy2.9
25. Zhu E, Chen Y, Ye C, Li X, Liu F. Ofs-nn: An Effective Phishing Websites Detection Model Based on Optimal Feature Selection and Neural Network. IEEE Access (2019) 7:73271–84. doi:10.1109/ACCESS.2019.2920655
26. Li T, Kou G, Peng Y. Improving Malicious Urls Detection via Feature Engineering: Linear and Nonlinear Space Transformation Methods. Inf Syst (2020) 91:101494. doi:10.1016/j.is.2020.101494
27. Luque A, Carrasco A, Martín A, de las Heras A. The Impact of Class Imbalance in Classification Performance Metrics Based on the Binary Confusion Matrix. Pattern Recognition (2019) 91:216–31. doi:10.1016/j.patcog.2019.02.023
28. Xie W, Liang G, Dong Z, Tan B, Zhang B. An Improved Oversampling Algorithm Based on the Samples' Selection Strategy for Classifying Imbalanced Data. Math Probl Eng (2019) 2019:1–13. doi:10.1155/2019/3526539
29. Agrawal K, Baweja Y, Dwivedi D, Saha R, Prasad P, Agrawal S. A Comparison of Class Imbalance Techniques for Real-World Landslide Predictions. International Conference on Machine Learning and Data Science(MLDS); 14-15 Dec. 2017; Noida, India. IEEE (2017) p. 1–8. doi:10.1109/MLDS.2017.21
30. Lever J, Krzywinski M, Altman N. Model Selection and Overfitting. Nat Methods (2016) 13:703–4. doi:10.1038/nmeth.3968
31. Cho X, Hoa D, Tisenko V. Malicious Url Detection Based on Machine Learning. Int J Adv Computer Sci Appl (2020) 11. doi:10.14569/IJACSA.2020.0110119
32. Wejinya G, Bhatia S. Machine Learning for Malicious Url Detection. In: M Tuba, S Akashe, and A Joshi, editors. ICT Systems and Sustainability Advances in Intelligent Systems and Computing, Goa, India. (2021) 1270:45. doi:10.1007/978-981-15-8289-9
33. Di Leo G, Sardanelli F. Statistical Significance: P Value, 0.05 Threshold, and Applications to Radiomics-Reasons for a Conservative Approach. Eur Radiol Exp (2020) 4(1):18. doi:10.1186/s41747-020-0145-y1
34. P. Vatcheva K, Lee M, McCormick JB, Rahbar MH. Multicollinearity in Regression Analyses Conducted in Epidemiologic Studies. Epidemiology (2016) 06(2):227. doi:10.4172/2161-1165.1000227
35. Gómez-Ramírez J, Ávila-Villanueva M, Fernández-Blázquez MÁ. Selecting the Most Important Self-Assessed Features for Predicting Conversion to Mild Cognitive Impairment with Random forest and Permutation-Based Methods. Sci Rep (2020) 10:20630. doi:10.1038/s41598-020-77296-4
36. Garera S, Provos N, Chew M, Rubin AD. A Framework for Detection and Measurement of Phishing Attacks. Proceedings of the 2007 ACM Workshop on Recurring Malcode - WORM ’07; 2 November, 2007; Alexandria Virginia USA. New York: ACM (2007) doi:10.1145/1314389.1314391
37. Jeeva SC, Rajsingh EB. Intelligent Phishing Url Detection Using Association Rule Mining. Hum Cent Comput Inf Sci (2016) 6:10. doi:10.1186/s13673-016-0064-3
38. Sankhwar S, Pandey D, Khan RA. Email Phishing: An Enhanced Classification Model to Detect Malicious Urls. ICST Trans Scalable Inf Syst (2018) 6:158529. doi:10.4108/eai.13-7-2018.158529
39. Bekkar M, Djema H, Alitouche T. Evaluation Measures for Models Assessment over Imbalanced Data Sets. J Inf Eng Appl (2013) 3:27–38. doi:10.5121/ijdkp.2013.3402
40. Jeni LA, Cohn JF, De La Torre F. Facing Imbalanced Data--Recommendations for the Use of Performance Metrics. Proc - 2013 Humaine Assoc Conf Affective Comput Intell InteractionACII (2013) 2013:245–51. doi:10.1109/ACII.2013.47
41. Ranganayakulu D, C. C. Detecting Malicious URLs in E-Mail - an Implementation. AASRI Proced (2013) 4:125–31. doi:10.1016/j.aasri.2013.10.020
42. Sonowal G. Phishing Email Detection Based on Binary Search Feature Selection. Sn Comput Sci (2020) 1:191. doi:10.1007/s42979-020-00194-z
43. Wang W, Shirley K. Breaking Bad: Detecting Malicious Domains Using Word Segmentation, IEEE Web 2.0 Security and Privacy Workshop. arXiv:1506.04111 (2015).
44. Palaniappan G, S S, Rajendran B, Sanjay SS, Goyal S, B S B. Malicious Domain Detection Using Machine Learning on Domain Name Features, Host-Based Features and Web-Based Features. Proced Computer Sci (2020) 171:654–61. doi:10.1016/j.procs.2020.04.071
45.Factcheckorg (2016). Available at: https://www.factcheck.org/, Accessed: 2016-11-18.
Keywords: fake news, COVID-19, search engine, machine learning, class imbalance, phishing
Citation: Mazzeo V, Rapisarda A and Giuffrida G (2021) Detection of Fake News on COVID-19 on Web Search Engines. Front. Phys. 9:685730. doi: 10.3389/fphy.2021.685730
Received: 25 March 2021; Accepted: 04 June 2021;
Published: 30 June 2021.
Edited by:
Mahdi Jalili, RMIT University, AustraliaReviewed by:
Alessandro Rovetta, Mensana srls, ItalyTim Kacprowski, Technische Universitat Braunschweig, Germany
Copyright © 2021 Mazzeo, Rapisarda and Giuffrida. This is an open-access article distributed under the terms of the Creative Commons Attribution License (CC BY). The use, distribution or reproduction in other forums is permitted, provided the original author(s) and the copyright owner(s) are credited and that the original publication in this journal is cited, in accordance with accepted academic practice. No use, distribution or reproduction is permitted which does not comply with these terms.
*Correspondence: Valeria Mazzeo, valesdn@gmail.com