Analyses of Daily Market Impact Using Execution and Order Book Information
 Kenta Yamada
 Takayuki Mizuno
- 1Faculty of Global and Regional Studies, University of the Ryukyus, Nishihara, Japan
- 2Research Center for Financial Smart Data, National Institute of Informatics, Tokyo, Japan
- 3Department of Informatics, SOKENDAI (The Graduate University for Advanced Studies), Tokyo, Japan
We analyzed the Tokyo Stock Exchange (TSE) for a 29-month period from August 2014 to December 2016, including every transaction and order book snapshot, and confirmed through a simple statistical test that the market impact depends on each stock. Based on a correlation analysis, we found that the market impact slowly changes over time. From an order book analysis, negative correlations were found between the market impact and the averaged limit order volumes in the order book. We also clarified that one of the factors of market impact is the volume of limit orders in the order book.
1. Introduction
Many previous studies have addressed market impact from theoretical [1–8] and empirical [9–13] viewpoints since it is related to market efficiency and trading costs, especially for trading large volumes.
The analyses of market impact using order book data has since the 2000s gradually become popular [14–18] thanks to the provision of datasets of the order book from stock exchange markets such as the London Stock Exchange (LSE), New York Stock Exchange (NYSE), and Tokyo Stock Exchange (TSE) and developments of computer technology that enable us to analyze huge size of order book data.
These studies mainly focused on short time scale market impact such as a single transaction, a few seconds, or a few minutes. It is useful to discuss how large volume order affects the market price over a long time scale. However long time scale of it, such as daily market impact, has not been studied enough compared to the short time scale. In order to estimate transaction costs, daily market impact analysis is important for asset management companies that manage their position daily.
In a previous study of a historical dataset of the Tokyo Stock Exchange (TSE) for a 17-month period from August 2014 to December 2015 [19], we identified the following two relationships: (i) a proportional relationship between the return of the market price and the order imbalance of the executed volume and (ii) an inverse proportional relationship between the market impact and the averaged order book volume. We also introduced a transaction cost model by calculating the spread cost and applying the relationship between the return and the order imbalance of execution.
We focused on the TOPIX Core 30 where the issues have very high market capitalization and liquidity, such as Toyota and Sony. However, in this study, we analyzed not only the TOPIX Core 30 but also such smaller stocks as the TOPIX Large 70 and Mid 400 and identified the following results about market impact: (i) it depends on issues; (ii) it slowly changes over time; and (iii) one of its factors is order book volume. These findings are useful to estimate transaction costs.
Our paper is organized as follows. In section 2, we present the empirical analysis results of the execution and order book data. Section 3 is our conclusion.
2. Empirical Analysis
We analyzed the Tokyo Stock Exchange data for a 29-month period from August 2014 to December 2016, which recorded every transaction and every order book from the best price (0-th level) to the 7-th level for the TOPIX Core 30, the Large 70, and the Mid 400. The datasets can be purchased from Japan Exchange Group (https://www.jpx.co.jp/english/markets/paid-info-equities/historical/01.html).
In this section, the dataset is analyzed, and we show the market impact depends on each stock by a simple statistical test. We clarify the market impact slowly changes over time based on a correlation analysis of it. Additionally, dependencies of market impact on order book volume are investigated.
Figure 1 shows an example of Sony's market price (stock code: 6758) in the upper figure and the cumulative transaction volume of deal-ask (a market order hits the best-ask price) and deal-bid (a market order hits the best-bid price) in the lower figure from 1 second past 9 a.m. to 1 second before 3 p.m. on June 21, 2016. Execution of the opening and closing transactions usually tends to have very large volume. We focused on continuous sessions in this study, removed the opening and closing transactions, and defined the return of the market price for 1 day:
where Ps and Pe are the prices at 9:00:01 and 14:59:59. The executed order imbalance (ΔV) is calculated as the cumulative deal-ask minus deal-bid 1 s before 3 p.m.
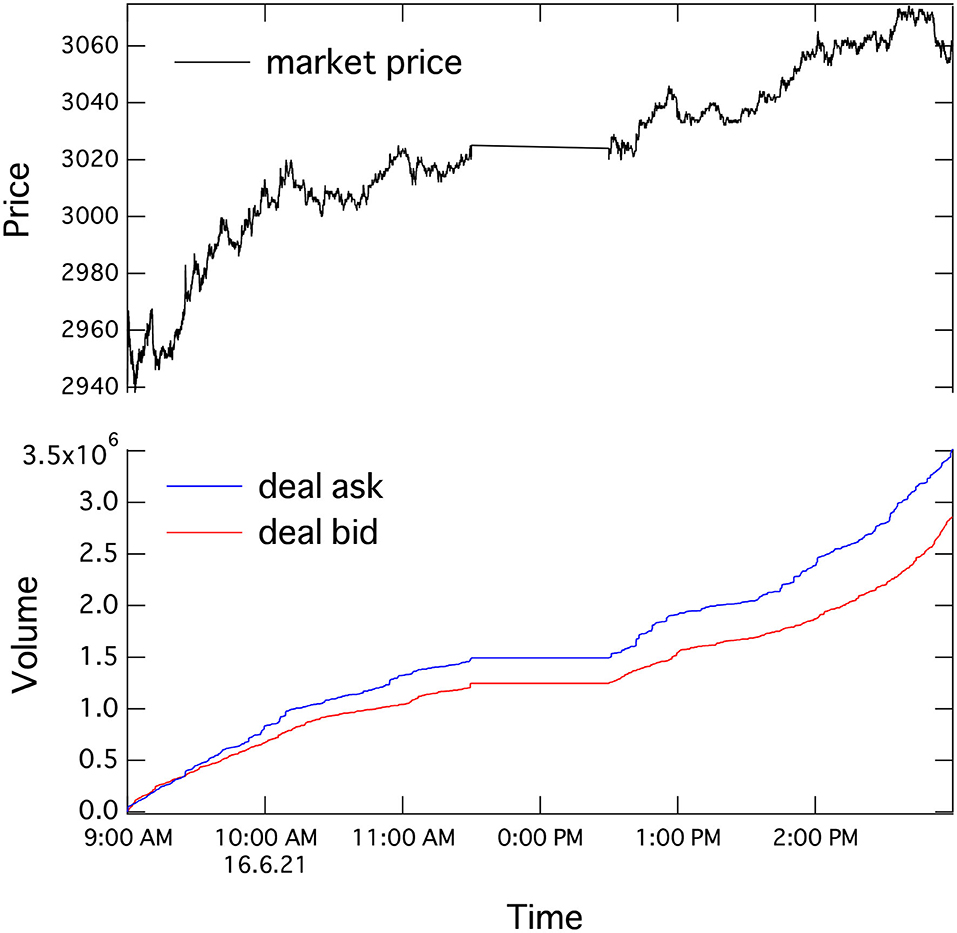
Figure 1. Time series of market price and cumulative transaction volume of Sony (stock code: 6758) from 1 second past 9 a.m. to 1 second before 3 p.m. on June 21, 2016.
Figure 2 shows a scatter plot of the return (r) and the executed order imbalance (ΔV) of the Sony Corporation (stock code: 6758) in the Core 30 and Nippon Paper Industries Co., Ltd. (stock code : 3863) in the Mid 400 from October 1 to 31, 2016. Each point is calculated by the data of a single day. We found a clear linear correlation between return (r) and executed order imbalance (ΔV):
where gradient α is a measurement of market impact. In the case of Sony Corporation (stock code: 6758), , standard error of αl is 4.07 × 10⁻⁹, and p-value for αl is 4.49 × 10⁻⁵. In the case of Nippon Paper Industries Co., Ltd. (stock code: 3863), , standard error is 2.59 × 10⁻⁸, and p-value is 3.78 × 10⁻⁶.
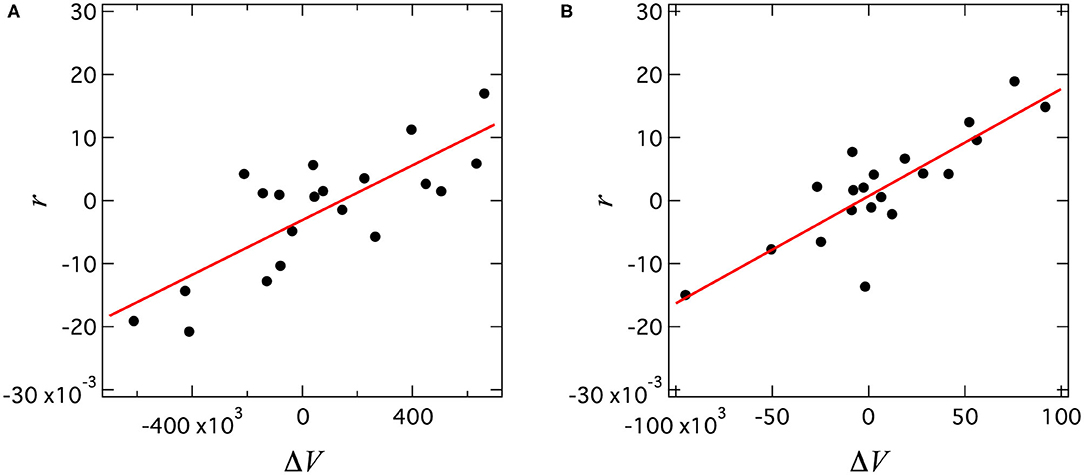
Figure 2. Scatter plots between return (r) and executed order imbalance (ΔV) from October 1 to 31, 2016. (A) Sony corporation (stock code: 6758) in Core 30, (B) Nippon Paper Industries Co., Ltd. (stock code: 3863).
To statistically check the existence of the differences of the market impact among stocks, we define the market impact for one yen as follows:
where αl,i describes the market impact for unit volume, Pi is the last price in a month, and i is the index of the stock. We show examples of monthly time series of during 29-month period for three companies in Figure 3. We compare the monthly market impact, , of companies A and B, and execute the a binomial test. A null hypothesis is the market impacts between company A and B is the same. In other words the probability where the market impact of company A is larger than B is half. If company A has a larger market impact nA times than B, on the other hand company B has a larger market impact nB times than A, a p-value is calculated:
where two times describes a two-tailed test and .
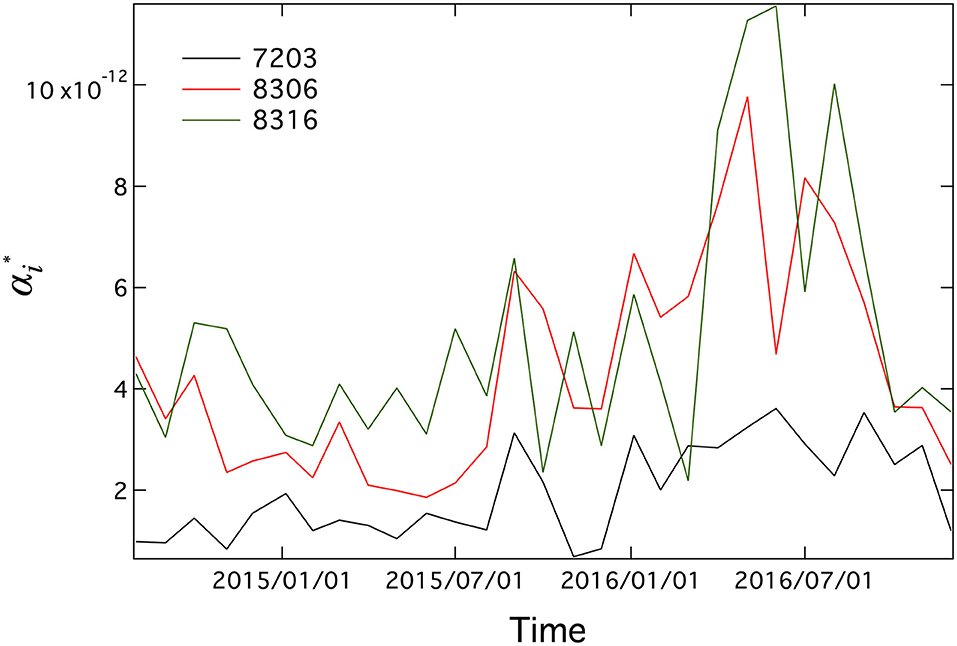
Figure 3. Monthly time series of during 29-month period for three companies: Toyota Motor Corp. (7203), Mitsubishi UFJ Financial Group, Inc. (8306), and Sumitomo Mitsui Financial Group, Inc. (8316).
We applied a statistical test for all the combinations of Core 30, Large 70, and Mid 400. We are interested in small p-values and show a cumulative distribution of the p-values in a log-log scale (Figure 4) and found the actual data have a much bigger proportion of small p-values than a random case. For example, in the actual case, about 68% of the p-values are <0.05, implying the market impact depends on the issues.
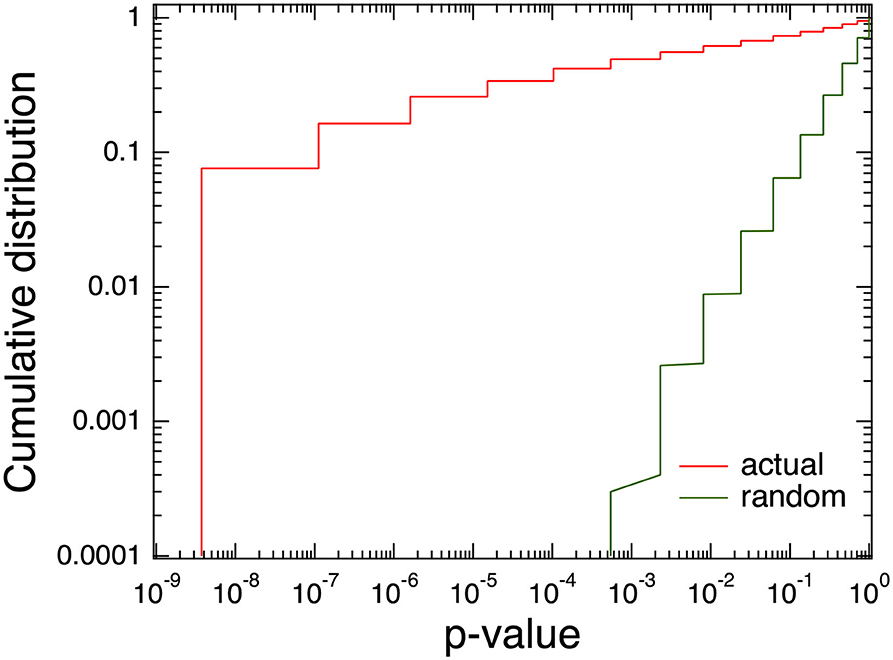
Figure 4. Cumulative distributions of p-values for Core 30, Large 70, and Mid 400.
To check the robustness of the market impact size, we show a scatter plot of the log10 α* at the M-th and M+1-th months in Figure 5. We added a median as well as 25 and 75% percentiles in each box and identified a clear correlation. The correlation coefficients have large values (0.67) in the Pearson product-moment correlation case and 0.71 in the Spearman rank-order correlation case.
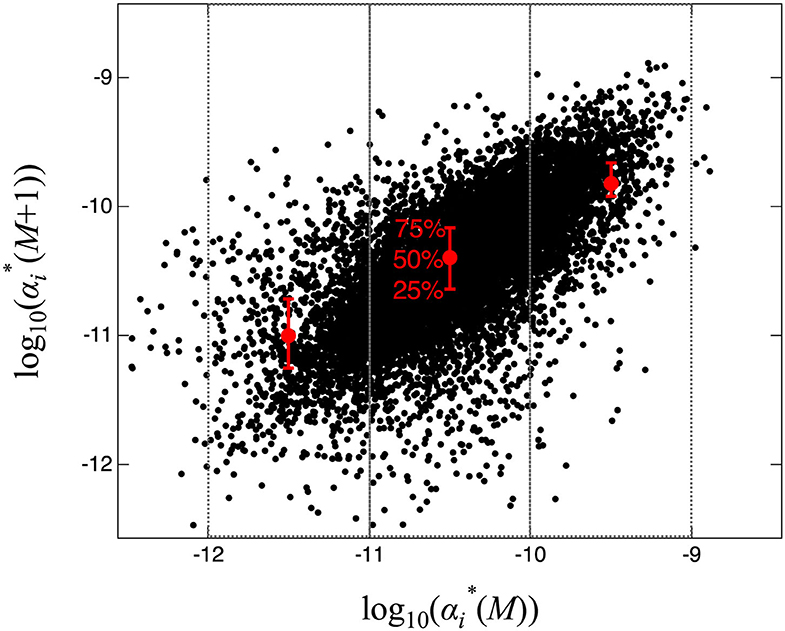
Figure 5. Scatter plot of log α* at M-th and M + 1-th months.
We also checked the ΔM dependencies for the correlation shown in Figure 6. The correlation decreases until ΔM = 12 (1 year) and saturates. For the Spearman rank-order correlation, it is approximately 0.64 when ΔM = 18. The market impact, which does not change drastically, can be estimated using past market impact values.
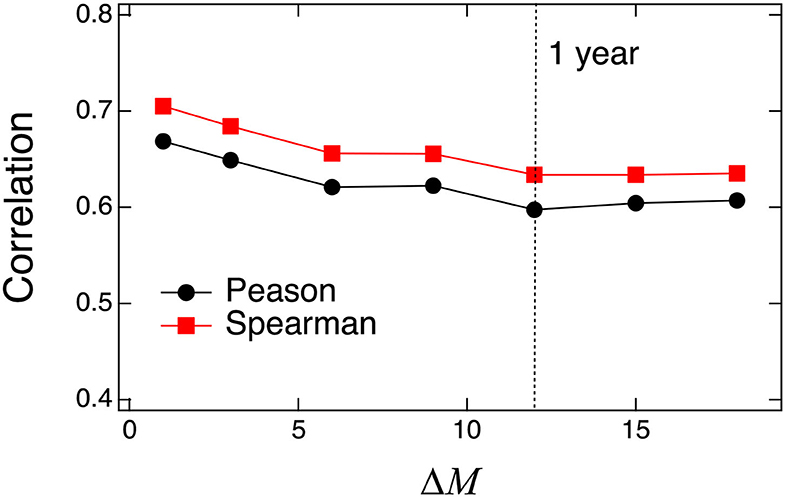
Figure 6. Pearson product-moment correlation and Spearman rank-order correlation for at M and ΔM months.
Next we focused on the relationships between the market impact characterized by and the order book volume. We defined the i-th best-ask and bid-side volumes at t as Va,i(t) and Vb,i(t). For example, the 0th (best) ask-side volume at t is written as Va, 0(t). and the average of both the bid- and ask-sides order book volumes from the 0-th to the 7-th levels at t = ts are given:
where 𝔼 represents the expectation value over the samples. We then defined the daily averaged order book volume:
Here we ignore the opening (9 a.m.), closing (3 p.m.), and lunch (11:30 a.m.–0:30 p.m.) times (Figure 7) and finally calculate the monthly averaged order book volume:
where Td represents trading days of TSE market in 1 month (excluding weekends and holidays).
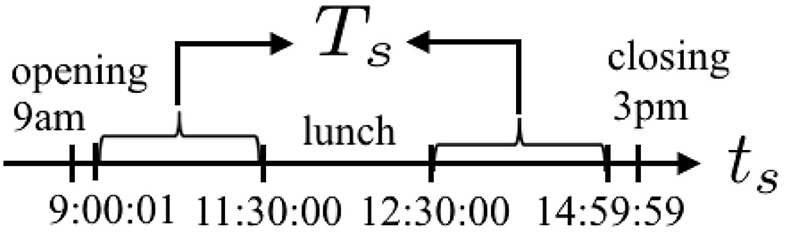
Figure 7. Illustration of Ts.
The upper time series in Figure 8 shows the monthly of the Mizuho Financial Group, Inc. (stock code: 8411), and the lower time series shows the monthly averaged order book volume defined in Equation (7). We observed a negative correlation between these two values.
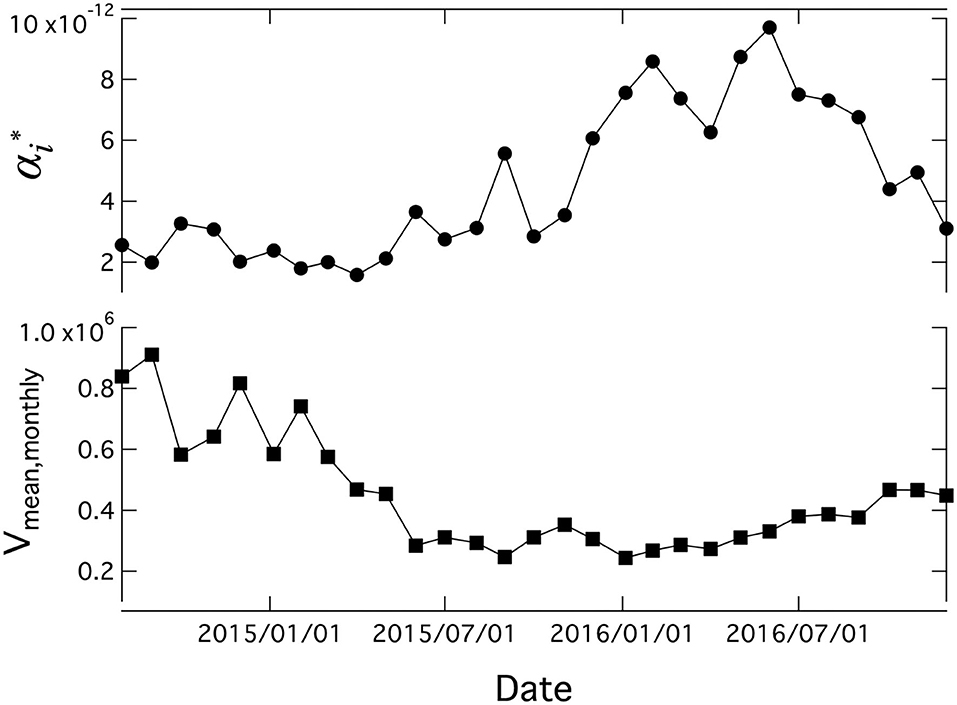
Figure 8. Time series of monthly gradient () of Mizuho Financial Group, Inc. (stock code: 8411) and averaged order book volume (Vmean, monthly) for a 29-month period from August 2014 to December 2016.
One reason for the dependencies is the order book volume; if we normalized the market impact by order book volume, the cumulative distribution of the p-values shifted more to random cases than to unnormalized cases (Figure 9). Here, we focused on order book volumes; if we normalized the market impact by such other effects as order flow and the configuration of the stock holders, the p-value distribution would probably shift more to the random case.
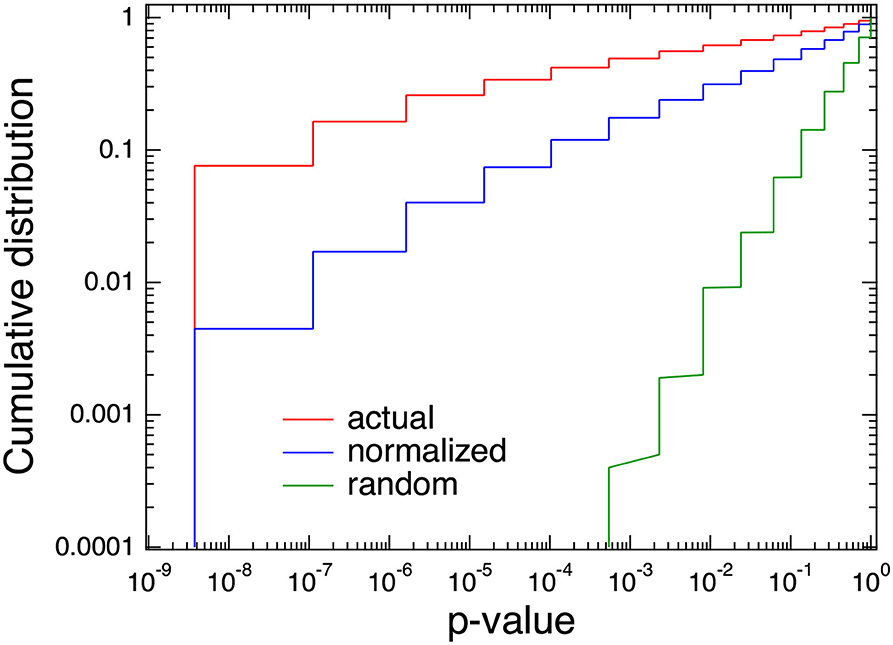
Figure 9. Comparison cumulative distributions of p-values among actual, random, and normalized by order book volume.
3. Conclusion
We showed that the daily market impact depends on stocks by executing a binomial test for the Tokyo Stock Exchange (TSE) during a 29-month period from August 2014 to December 2016. We focused on a longer time scale (such as 1 day) than previous studies that used a single transaction or 5 min. We verified the market impact's robustness and found it does not change drastically and realized that we can estimate it using past market impact values. However, we need to pay attention to big news, such as the Lehman shock, that change market conditions drastically, causing sudden variation in terms of market impact. We also investigated the dependencies of the market impact on order book volume and concluded that if a stock has a larger order book volume, the market impact tends to be smaller. We expect our findings to be useful for discussions about controlling transaction costs.
Data Availability Statement
Publicly available datasets were analyzed in this study. The datasets analyzed for this study can be purchased from Japan Exchange Group (https://www.jpx.co.jp/english/markets/paid-info-equities/historical/01.html).
Author Contributions
KY and TM carried out the conceptualization, methodology, investigation, and validation. KY carried out the formal analysis and prepared and wrote the original draft. TM carried out the project administration and funding acquisition. Both authors contributed to the article and approved the submitted version.
Funding
This work was partly supported by JST (Japan Science and Technology Agency) Precursory Research for Embryonic Science and Technology, Grant Number JPMJPR14DA (KY).
Conflict of Interest
The authors declare that the research was conducted in the absence of any commercial or financial relationships that could be construed as a potential conflict of interest.
References
2. Scholes MS. The market for securities: substitution versus price pressure and the effects of information on share prices. J Bus. (1972) 45:179–211.
3. Kraus A, Stoll HR. Price impacts of block trading on the New York stock exchange. J Finance. (1972) 27:569–88. doi: 10.2307/2978262
4. Stoll HR. The supply of dealer services in securities markets. J Finance. (1978) 33:1133–51. doi: 10.2307/2326945
5. Kyle AS. Continuous auctions and insider trading. Econometrica. (1985) 53:1315–35. doi: 10.2307/1913210
6. Obizhaeva A, Wang J. Optimal Trading Strategy and Supply/Demand Dynamics. National Bureau of Economic Research (2005). Available online at: http://www.nber.org/papers/w11444.
7. Gatheral J. No-dynamic-arbitrage and market impact. Quant Finance. (2010) 10:749–59. doi: 10.1080/14697680903373692
8. Kyle AS, Obizhaeva AA. Market microstructure invariance: empirical hypotheses. Econometrica. (2016) 84:1345–404. doi: 10.3982/ECTA10486
9. Hasbrouck J. Measuring the information content of stock trades. J Finance. (1991) 46:179–207. doi: 10.2307/2328693
10. Kempf A, Korn O. Market depth and order size1. J Financ Markets. (1999) 2:29–48. doi: 10.1016/S1386-4181(98)00007-X
11. Evans MDD, Lyons RK. Order flow and exchange rate dynamics. J Polit Econ. (2002) 110:170–80. doi: 10.1086/324391
12. Breen WJ, Hodrick LS, Korajczyk RA. Predicting equity liquidity. Manage Sci. (2002) 48:470–83. doi: 10.1287/mnsc.48.4.470.210
13. Lillo F, Farmer JD, Mantegna RN. Econophysics: master curve for price-impact function. Nature. (2003) 421:129–30. doi: 10.1038/421129a
14. Weber P, Rosenow B. Order book approach to price impact. Quant Finance. (2005) 5:357–64. doi: 10.1080/14697680500244411
15. Cont R, Kukanov A, Stoikov S. The price impact of order book vents. J Financ Econ. (2014) 12:47–88. doi: 10.1093/jjfinec/nbt003
16. Eisler Z, Bouchaud JP, Kockelkoren J. The price impact of order book events: market orders, limit orders and cancellations. Quant Finance. (2012) 12:1395–419. doi: 10.1080/14697688.2010.528444
17. Taranto DE, Bormetti G, Bouchaud JP, Lillo F, Toth B. Linear models for the impact of order flow on prices. II. The Mixture Transition Distribution model. Quant Finance. (2018) 18:917–31. doi: 10.1080/14697688.2017.1397283
18. Taranto DE, Bormetti G, Bouchaud JP, Lillo F, Toth B. Linear models for the impact of order flow on prices. I. History dependent impact models. Quant Finance. (2018) 18:903–15. doi: 10.1080/14697688.2017.1395903
Keywords: financial markets, stock price, market impact, market microstructure, order book analysis
Citation: Yamada K and Mizuno T (2020) Analyses of Daily Market Impact Using Execution and Order Book Information. Front. Phys. 8:366. doi: 10.3389/fphy.2020.00366
Received: 13 April 2020; Accepted: 29 July 2020;
Published: 24 November 2020.
Edited by:
Mahdi Jalili, RMIT University, AustraliaReviewed by:
Gholamreza Jafari, Shahid Beheshti University, IranYuyao Wang, Nanjing University of Science and Technology, China
Copyright © 2020 Yamada and Mizuno. This is an open-access article distributed under the terms of the Creative Commons Attribution License (CC BY). The use, distribution or reproduction in other forums is permitted, provided the original author(s) and the copyright owner(s) are credited and that the original publication in this journal is cited, in accordance with accepted academic practice. No use, distribution or reproduction is permitted which does not comply with these terms.
*Correspondence: Kenta Yamada, k-yamada@grs.u-ryukyu.ac.jp