 Priscila F. de Aquino1†
 Paulo Costa Carvalho2,3†
 Fábio C. S. Nogueira4
 Clovis Orlando da Fonseca5
 Júlio Cesar Thomé de Souza Silva6
 Maria da Gloria da Costa Carvalho7
 Gilberto B. Domont4Nilson I. T. Zanchin2
 Juliana de Saldanha da Gama Fischer2*
- 1Laboratory of Microbial Diversity from Amazon with Importance for Health, Instituto Leônidas e Maria Deane, Fiocruz, Manaus, Amazonas, Brazil
- 2Laboratory for Proteomics and Protein Engineering, Carlos Chagas Institute, Fiocruz, Curitiba, Paraná, Brazil
- 3Laboratory of Toxinology, Instituto Oswaldo Cruz, Fiocruz, Rio de Janeiro, Brazil
- 4Laboratory for Protein Chemistry, Chemistry Institute, Federal University of Rio de Janeiro, Rio de Janeiro, Brazil
- 5Department of General and Specialized Surgery, Antonio Pedro University Hospital, Fluminense Federal University, Rio de Janeiro, Brazil
- 6Department of Neurosurgery, Ipanema Federal Hospital, Rio de Janeiro, Brazil
- 7Laboratory of Molecular Pathology, Department of Pathology, University Hospital Clementino Fraga Filho, Federal University of Rio de Janeiro, Rio de Janeiro, Brazil
Tumors consist of cells in different stages of transformation with molecular and cellular heterogeneity. By far, heterogeneity is the hallmark of glioblastoma multiforme (GBM), the most malignant and aggressive type of glioma. Most proteomic studies aim in comparing tumors from different patients, but here we dive into exploring the intratumoral proteome diversity of a single GBM. For this, we profiled tumor fragments from the profound region of the same patient’s GBM but obtained from two surgeries a year’s time apart. Our analysis also included GBM‘s fragments from different anatomical regions. Our quantitative proteomic strategy employed 4-plex iTRAQ peptide labeling followed by a four-step strong cation chromatographic separation; each fraction was then analyzed by reversed-phase nano-chromatography coupled on-line with an Orbitrap-Velos mass spectrometer. Unsupervised clustering grouped the proteomic profiles into four major distinct groups and showed that most changes were related to the tumor’s anatomical region. Nevertheless, we report differentially abundant proteins from GBM’s fragments of the same region but obtained 1 year apart. We discuss several key proteins (e.g., S100A9) and enriched pathways linked with GBM such as the Ras pathway, RHO GTPases activate PKNs, and those related to apoptosis, to name a few. As far as we know, this is the only report that compares GBM fragments proteomic profiles from the same patient. Ultimately, our results fuel the forefront of scientific discussion on the importance in exploring the richness of subproteomes within a single tissue sample for a better understanding of the disease, as each tumor is unique.
Introduction
Glioblastoma multiforme (GBM) is by far the most malignant and aggressive type of glioma. Despite the conventional treatments such as surgical resection, radiotherapy, and chemotherapy, GBM is likely to recur. The approximate median survival rate for recurrent GBM patients after surgery is of 7.4 months (1), so to comprehend this disease, an understanding of the molecular mechanisms inherent from recurrence is fundamental (2). Furthermore, due to heterogeneity, glioblastomas, and gliomas in general, do not present well-defined surgical margins (3).
In a previous report, transcriptomic data revealed that, for most cases, fragments from the same GBM sample could be classified into at least two molecular subgroups (4); needless to say, tumors consist of cells in different stages of transformation, resulting in both molecular and cellular heterogeneity. We recently assessed the proteomic profile of two different morphological regions from the same GBM sample derived from a formalin-fixed paraffin-embedded tissue (FFPE) (5) and found proteins exclusively identified in each region. These results corroborate on the postulation of the great variability, within the a single GBM, be it at the transcriptomic or proteomic level (6). Aquino et al. used a Multidimensional Protein Identification Technology (MudPIT) (7) to compare the protein profile present in gastric cancer biopsies against its respective resection margin and healthy tissue acquired from endoscopic patients (8). The authors suggested that the resection margin “seemed more proteomically alike” to cancer than the healthy tissue (8). In another work from Aquino et al., a gastric cancer biopsy was sectioned into ten parts and then each part was analyzed by MudPIT. The authors pinpointed tissue-specific proteins along the entire stomach with different levels of abundancy (9).
The aforementioned studies reflect difficulties and challenges in the inter and intratumoral assessment. In fact, large-scale intratumor heterogeneity assessments have been tremendously overlooked, most possibly because of technical difficulties. Nevertheless, the study of intratumor heterogeneity is now recognized as one of the main areas in the study of cancer, culminating in ever-increasing evidence that intratumor heterogeneity is the key to understanding treatment failure (10). The reasons are many, heterogeneity affects the tumor biology in various ways; for example, through the generation of chemoresistant microenvironment, or even rendering mutations that could be linked with a therapy failure (3). The understanding of such heterogeneity is fundamental for designing treatments that are more effective.
Here, we perform a GBM intratumoral heterogeneity study by comparing tumor fragments from the same patient, but obtained from surgeries held 1 year apart. Our quantitative proteomic assessment was performed by labeling the tryptic peptides with Isobaric Tags for Relative and Absolute Quantitation (iTRAQ) (11) and then performing a four-step offline MudPIT with an Orbitrap Velos mass spectrometer. Our study includes proteomic profiling of the profound, intermediary, and external regions of the GBM tumor.
Case Presentation
The University Hospital Ethics committee approved this study under the following permit: CONEP 9681 no. 124 25000.009267/2004-25. A written informed consent was acquired from the patient.
A 49-year-old white man presenting painful headaches, drowsiness, and dysarthria was admitted to the neurosurgery service. A brain magnetic resonance imaging (MRI) scan revealed a regular space-occupying lesion in the right temporal lobe that was enhanced with gadolinium. MRI revealed presence of a right temporal mass with an intense surrounding vasogenic edema. The patient promptly (December, 2011) underwent a right temporal craniotomy with total tumor resection that was also confirmed by MRI. In order to control the intracranial hypertension, the patient was treated with dexametazona before and after surgery. Histological analysis carried out by three different pathologists confirmed the diagnosis of a GBM. The patient was treated with hydantoin and subjected to radiotherapy concomitantly with chemotherapy using temozolomide. After 15 days, the patient was accepted to join the phase I/II protocol of intranasal administration of 55 mg of the monoterpene perillyl alcohol four times a day (12–14). One year later, the patient returned to the same hospital presenting similar symptoms and another MRI was obtained (Figure 1). The patient underwent a second neurosurgery due to the recurrence of the GBM.
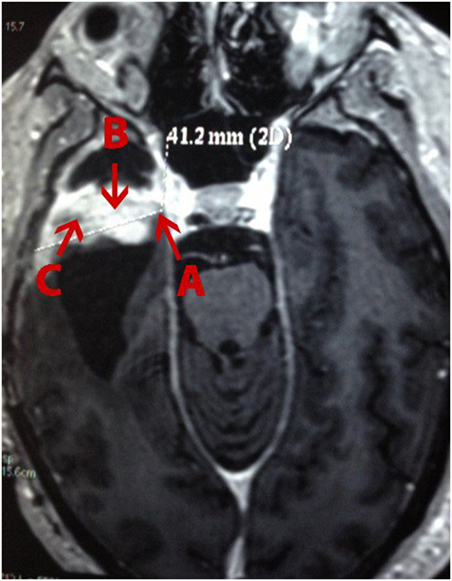
Figure 1. Magnetic resonance imaging (MRI) of a patient with recurrent glioblastoma multiforme (GBM) in the right temporal lobe. (A), external; (B), profound; and (C), intermediary (as in according to the tumor’s center) area of the GBM.
One tumor fragment from the profound region was obtained during the first surgery and three tumor fragments, from different regions (i.e., profound, external, and intermediary) (Figure 1), from the second surgery. All fragments were stored at −80°C for further proteomic analysis.
Experimental Section
Materials
Isobaric Tags for Relative and Absolute Quantitation (Cat. no 4352135) and Self-Pack Poros 20 R2 resin (Cat. no 1112810) were acquired from Applied Biosystems. Qubit® Protein Assay Kit (Cat. no Q33212) and RapiGest SF acid-labile surfactant (Cat. no 186001861) were purchased from Invitrogen (Carlsbad, CA, USA) and Waters Corp. (Milford, MA, USA), respectively. Sequence grade modified trypsin (V511A) was purchased from Promega. Strong Cation Exchange Macro Spin Column (Cat. no 744202) was acquired from Harvard Apparatus. All other laboratory reagents were acquired from Sigma-Aldrich (St. Louis, MO, USA), unless specified otherwise.
Sample Preparation and Protein Digestion
All four glioblastoma sample lysates were obtained by sonication in ice, with amplitude of 30% for three cycles of one and a half minute each (Hielscher – UP50H) immerse in a solution containing 0.2% of RapiGest™ (w/v) in 50 mM triethylammonium bicarbonate. Then, the lysates were centrifuged at 20,000 × g during 30 min at 4°C. Subsequently, the protein content was quantified by a fluorimetric assay using the Qubit® 2.0 platform according to the manufacturer’s instructions. Two hundred micrograms of protein from each region were reduced with 20 mM of Tris (2-carboxyethyl) phosphine (TCEP) at 60°C for 30 min. Afterward, all samples were cooled to room temperature and incubated in the dark with 66 mM of iodoacetamide (IAA) for 30 min.
Afterward, the samples were digested for 20 h with sequence grade modified trypsin (Promega) at a 1:50 (E/S) ratio at 37°C. Following digestion, all reactions were acidified with 10% (v/v) trifluoroacetic acid (0.5% v/v final concentration) to stop proteolysis and degrade RapiGest. The samples were centrifuged for 30 min at 20,000 × g at 20°C to remove insoluble materials.
Isobaric Tags for Relative and Absolute Quantitation Labeling
The peptides were desalted with Poros® R2 resin (Applied Biosystems) packed “in house” according, to the manufacturer’s instructions. Twenty micrograms of tryptic peptides obtained from each area of the glioblastoma (i.e., profound from the first surgery, profound, intermediary, and external area from the second surgery) were labeled with the iTRAQ reagents according to the manufacturer’s directions. Briefly, for each iTRAQ 4-plex reagent vial, 70 μL of ethanol was individually added at room temperature. Each vial was vortexed and its contents were transferred to another tube containing twenty micrograms of digested peptides and labeled as follows: profound area from first surgery with iTRAQ-114, and profound, intermediary, and external areas from the second surgery labeled with iTRAQ-115 (Figure 1), iTRAQ-116 (Figure 1), and iTRAQ-117 (Figure 1), respectively. Subsequently, the samples were incubated for 1 h at room temperature. Labeled peptides were combined in a single tube and concentrated on a SpeedVac (Thermo Fischer Scientific).
Strong Cation Exchange Chromatograph
The labeled peptides were suspended in solution A (5 mM KH2PO4 + 25% ACN, pH 3) and loaded into a strong cation exchange macro spin column from Harvard Apparatus. Peptides were eluted from the column in a stepwise manner by applying solution A with increasing KCl concentrations of 75, 150, 250, and 350 mM. Each fraction was desalted once again with Poros R2 resin 20 μm (Applied Biosystems) according, to manufacturer’s instructions. The flow-through was also desalted and stored for posterior analysis.
Mass Spectrometry Analysis
The desalted peptide mixture was analyzed three times as follows. The setup used an Easy-nLC II (Proxeon) coupled online with a LTQ-Orbitrap Velos (Thermo, San Jose, CA) mass spectrometer (15). The peptide mixtures were loaded in a pre-column (2 cm, 200 μm inner diameter, 5 μm C18 beads Reprosil-AQ Pur, Dr. Maisch) and were chromatographically separated using a 20 cm analytical column (75 μm inner diameter) that was packed in-house with 3 μm C18 beads (Reprosil-AQ Pur, Dr. Maisch). The flow rate was 200 nL/min and the mobile phase composition was 5% acetonitrile in 0.1% formic acid. We then applied a 120 min gradient using first 5–40% acetonitrile in 0.1% formic acid for 100 min, then 40−95% acetonitrile in 0.1% formic acid for 20 min. The effluent from the nLC column was directly electrosprayed into the mass spectrometer.
The LTQ-Orbitrap Velos instrument was set in data dependent mode to automatically switch between full scan MS and MS/MS acquisition with a dynamic exclusion of 20 s turned on. Survey scans (350–2,000 m/z) were acquired in the Orbitrap system with a resolution of 60,000 at m/z 110. The ten most intense ions with charge states of 2+ or 3+ were sequentially isolated and fragmented in the HCD collision cell using a normalized collision energy of 40. The fragment ions were analyzed with a resolution of 7,500. The general mass spectrometric conditions were as follows: 2.30 kV spray voltage, 100 μA source current, no sheath and auxiliary gas flow, heated capillary temperature of 225°C, predictive automatic gain control (AGC) enabled, and an S-lens RF level of 64%. Mass spectrometer scan functions and nLC solvent gradients were controlled by the Xcalibur data system (Thermo, San Jose, CA, USA).
Peptide Spectrum Matching
Sequences from Homo sapiens were downloaded from the UniProt consortium. A target-decoy database was generated using PatternLab 4.0 (16) to include a reversed version of each sequence found in the database plus those from 127 common mass spectrometry contaminants. The ProLuCID search engine (v. 1.3.1) (17) was used for comparing experimental spectra against those theoretically generated from a sequence database. The search was limited to fully and semi-tryptic peptide candidates. The search parameters imposed carbamidomethylation of cysteine as a fixed modification and the iTRAQ-4 modification in the N-terminal, K, and Y residues as variable. The search engine accepted peptide candidates within a 40-ppm tolerance from the measured precursor m/z and used the XCorr as the primary search engine score.
Assessment of Peptide Sequence Matches and Profile Grouping
The Search Engine Processor (SEPro), built into PatternLab 4.0, was used for converging to a list of identifications with less than 1% of false discovery rate (FDR) at the protein level, as previously described (18). Briefly, the identifications were grouped by charge state (2+ and ≥3+), and then by tryptic status, resulting in four distinct subgroups. For each group, the XCorr, DeltaCN, DeltaPPM, and Peaks Matched values were used to generate a Bayesian discriminator. The identifications were sorted in non-decreasing order according to the discriminator score. A cutoff score was established to accept a false-discovery rate (FDR) of 1% at the peptide level based on the number of labeled decoys. This procedure was independently performed on each data subset, resulting in an FDR that was independent of charge state or tryptic status. Additionally, a minimum sequence length of six amino-acid residues was required. Results were post-processed to only accept peptide spectrum match (PSMs) with less than 6 ppm from the global identification average. One-hit wonders (i.e., proteins identified with only one mass spectrum) with the peptide having an XCorr of less than 2.5 were discarded. This last filter led to FDRs, now at the protein level, to be lower than 1% for all search results.
PatternLab’s TrendQuest module was used for grouping the proteomic profiles from each protein according the signals provided by the corresponding reporter ions as previously performed (19). PatternLab’s isobaric analyzer module was employed for pinpointing differentially abundant proteins when comparing the profound tissue samples from the first and second surgery as described in our bioinformatics protocol (16). PatternLab’s Gene Ontology Explorer module (20) and www.reactome.org (21) were used to help interpret the data.
Results and Discussion
Here we used iTRAQ to study the proteome diversity from three different areas of a recurrent GBM tumor i.e., profound, intermediary, and external, as described in the experimental section. We also compared proteomic profiles of tumor fragments from the same patient’s GBM profound area, but obtained from surgeries held a year apart. Our proteomic results identified 18,929 mass spectra providing sequences of 3,779 peptides (FDR = 0.29%) that map to 2,773 (FDR = 0.97%) protein sequences, of which 2,742 were successfully quantitated by iTRAQ; this list can be simplified to 768 proteins according to the bipartite-graph analysis for maximum parsimony (22). We employed the reactome software to obtain a birds-eye view of enriched pathways; for this, we provided as input all proteins quantitated by iTRAQ. The reactome pointed 21 enriched pathways (p < 0.01); a full list (enriched or not) is provided in Table S1 in Supplementary Material. Among the enriched pathway diagrams, we highlight the “RHO GTPases activate PKNs,” of which we identified 31 out of the 60 possible proteins from this pathway (Figure 2). PKNs, or protein kinase C-related kinases, feature a C-terminal serine/threonine kinase domain and three RHO-binding motifs at the N-terminus. PKNs play key roles in the regulation of cell cycle, receptor trafficking, vesicle transport, apoptosis, and mediating ligand-dependent transcriptional activation by the androgen receptor, to name a few. According to Fortin Ensign et al., in GBMs, Rho GTPases are usually deregulated, generally by hyperactivity or overexpression of their activators, Rho GEFs (Guanine Nucleotide Exchanging Factor); this ultimately promotes invasiveness and survival of the glioma cell (23).
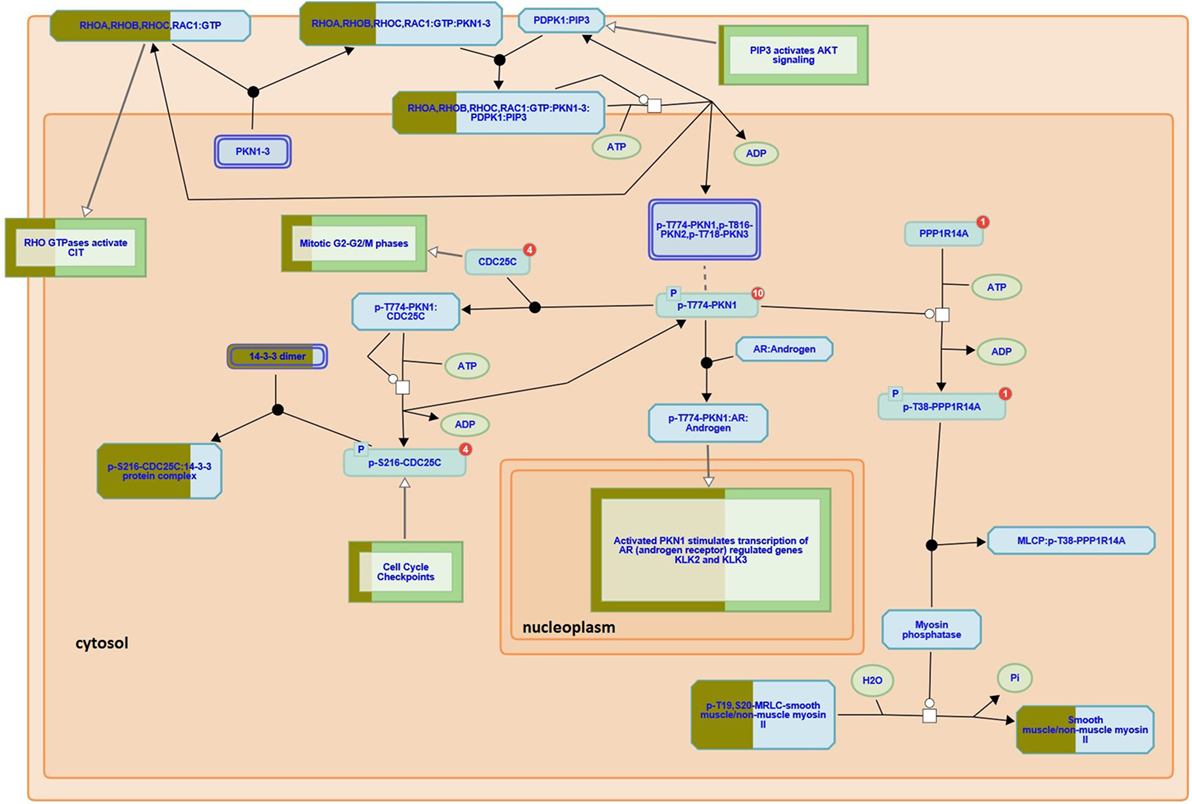
Figure 2. RHO GTPases activate PKNs pathway (reactome identifier: R-HSA-5625740). The diagram represents a curated pathway provided from www.reactome.org generated with our data. The circles and boxes represent small molecules and sets of proteins, respectively. Some protein sets are partially filled with dark green representing the percentage of the proteins we identified in that collection.
The TrendQuest module generated four major protein groups by clustering proteins according to their relative abundance in each of the four samples under consideration (Figure 3). We note that not all identifications belong into one of these four groups. The clusters 1, 2, 3, 4 are composed of 377, 103, 392, and 281 protein entries, respectively. A visual assessment in Figure 3 reveals that Cluster #1 relates to proteins with higher abundancy in the external tissue (second surgery), #2 high in the profound tissue (first surgery), #3 high in intermediary tissue (second surgery), and #4, high in the intermediary (second surgery) and slightly less in the external tissue (second surgery). TrendQuest’s unsupervised clustering provides a bird’s-eye view of the proteomic landscape throughout the four biological conditions. Figure 3 reveals that more changes occurred when comparing the different anatomical regions of the same tumor (i.e., surgery 2) versus the comparison of the profound region of surgery 1 (point 1) versus that of surgery 2 (point 2). This conclusion emerges as cluster 2, linking to differentially abundant proteins between profound from surgery 1 and 2, is only accountable for 103 proteins; the remaining clusters (1050 proteins), show major changes among the different anatomical regions from surgery 2 and, arguably, no changes between surgery 1 and 2.
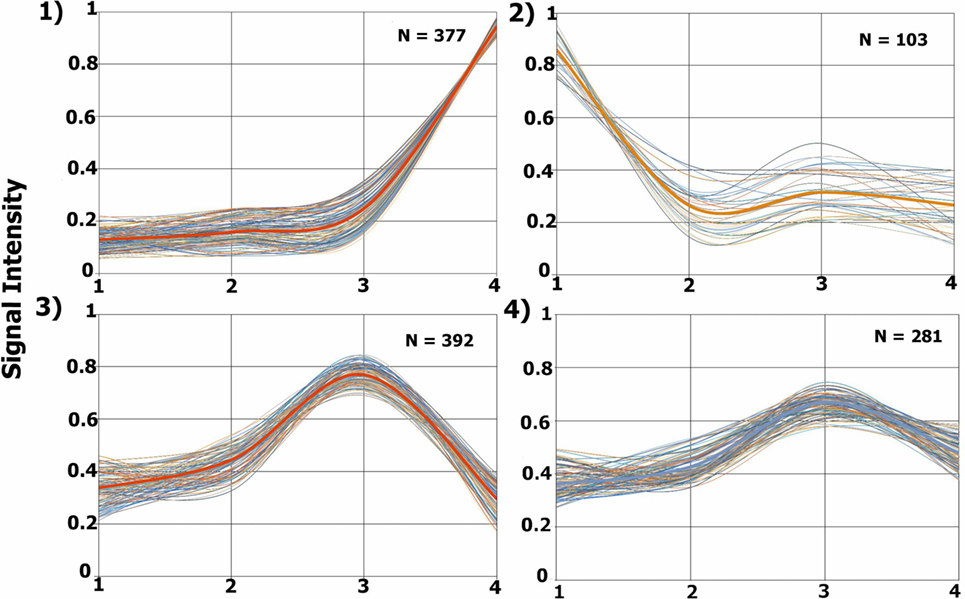
Figure 3. Proteomic profile clusters. Each panel displays the expression profiles of proteins that were grouped according to their abundance derived from each glioblastoma multiforme (GBM) condition. Each line represents a protein’s relative abundance. A thicker line is found in each cluster, this line is obtained by averaging the values at each point. The y-axis shows the normalized iTRAQ intensity. The x-axis represents the following conditions: 1, profound tissue area of a GBM from the first surgery (iTRAQ-114); 2, profound tissue area of a GBM from the second surgery (iTRAQ-115); 3, intermediary tissue area of a GBM from the second surgery (iTRAQ-116), and 4, external tissue area of a GBM from the second surgery (iTRAQ-117).
The list of the proteins from each cluster, together with their summed reporter ion signal, is provided in the Tables S2–S5 in Supplementary Material, respectively. Table S6 in Supplementary Material lists 27 proteins belonging to a (small) cluster that presented the least changes as in according to our visual inspection; we believe this cluster indirectly reflect the heterogeneity of the tumor. Quantitated proteins not belonging to one of these clusters are listed in Table S7 in Supplementary Material. A complete list of all identified proteins with their corresponding peptide identifications is available in Table S8 in Supplementary Material. We make all our raw mass spectrometry files, SEPro results and intermediary ProLuCID/PatternLab files available for downloading at http://proteomics.fiocruz.br/supplementaryfiles/oncology2016
Several reports corroborate with our results at the genomic and transcriptomic levels. Sottoriva et al. examined intratumoral heterogeneity of the external and profound areas of eleven GBMs at genomic and transcriptomic levels and concluded that fragments from the same patient could be categorized into distinct subclasses of GBM (10). Several groups propose that treatment failure and recurrence of this tumor type is a consequence of intratumoral heterogeneity (24–26). It is tempting to hypothesize that most changes would occur when comparing the GBM fragments from 1 year apart; yet, our results prove otherwise.
We used the PatternLab’s isobaric analyzer module to further pursue the differentially abundant proteins between the tissues of the profound regions obtained from different surgeries. We recall that this module employs a peptide-centric approach to assigned paired t-test p-values to each peptide and then converge to a final p-value, at the protein level, through the Stouffer’s method. We applied stringency filters to only consider the signal from unique peptides, proteins with p-value < 0.01, and presenting an average absolute peptide fold change greater than 1.5. Figure 4 shows a volcano plot of these results. Table 1 lists selected proteins satisfying these criteria. The complete list of the differentially abundant proteins is addressed in Table S9 in Supplementary Material. Figure 5 demonstrates the normalized iTRAQ signals from peptides mapping to the Metallothionein (P02795) and Lumican (P51884) proteins, upregulated in the first and second surgery, respectively.
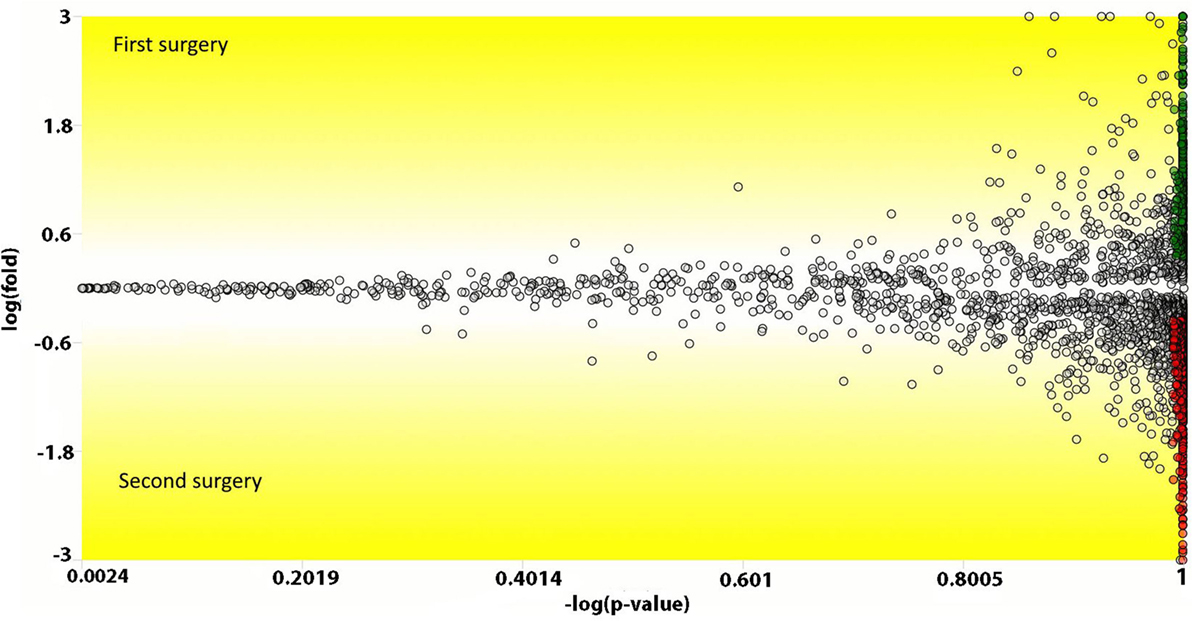
Figure 4. Volcano plot comparing peptides (the dots) from the profound glioblastoma multiforme (GBM) area derived from the first versus the second surgery. The y-axis represents the Loge fold change and the x-axis the −log of the paired t-test p-value. Peptides (dots) with a positive y-value had a higher abundancy in the first surgery; likewise, negative values, are peptides with higher abundancy in the second surgery. Green and red dots represent peptides that achieved a p-value lower than 0.01 and an absolute fold change in abundance greater than 1.5.
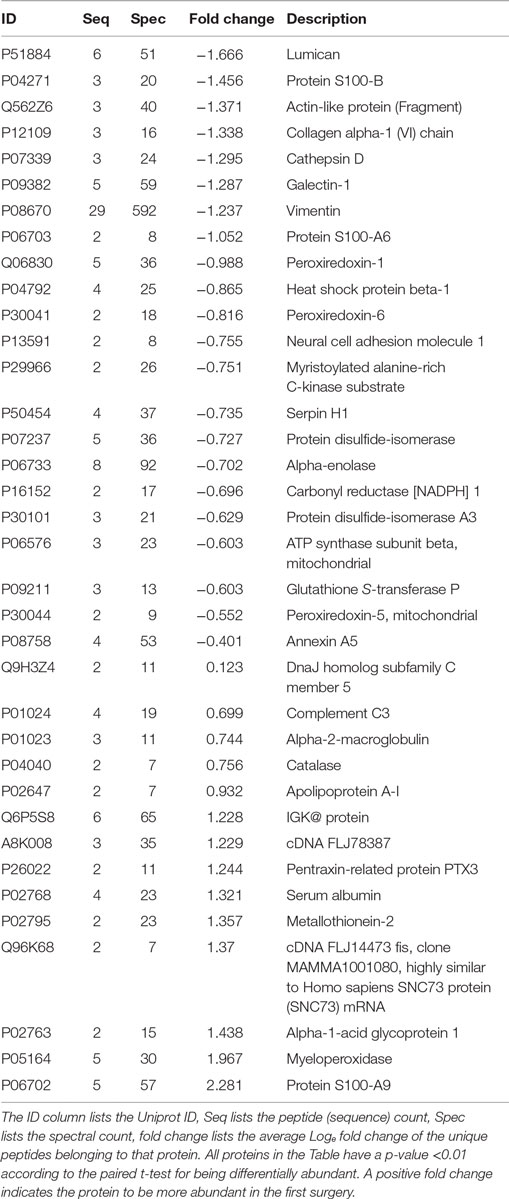
Table 1. Differentially abundant proteins obtained when comparing the profound glioblastoma multiforme tissues from the first versus the second surgery.
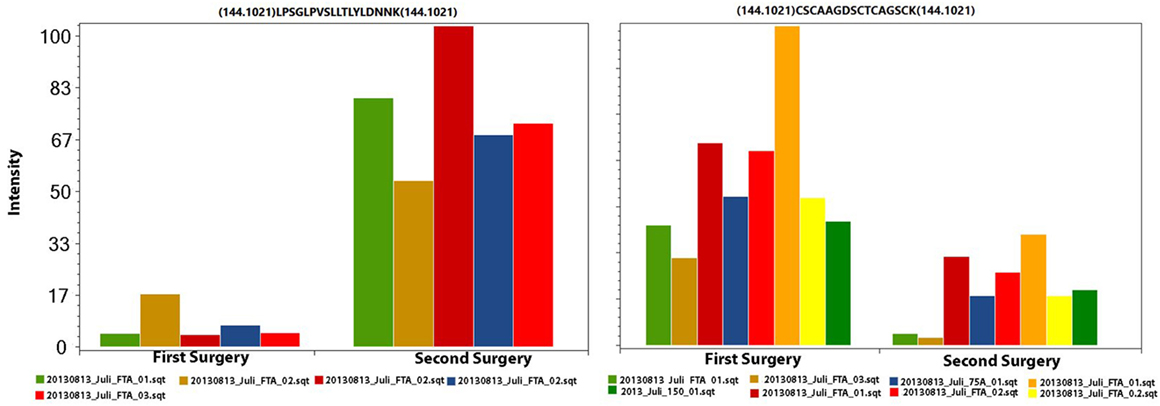
Figure 5. The iTRAQ normalized signals from peptides mapping to Lumican (left panel) and to Metallothionein (right panel). In each plot, each pair of columns with the same color are derived from the same spectrum (markers 114 and 115); this information is necessary for calculating the paired t-test. The left and right charts originate from five and eight spectra, respectively.
Proteins presenting differential abundance between the surgeries held 1 year apart could be linked to recurrence or resistance to anti-cancer agents. We now shortlist several proteins from Table 1 that presented the greatest changes in abundance (p < 0.01). S100-A9, myeloperoxidase, catalase and metallothionein-2 were upregulated in the sample from the first surgery and lumican, cathepsin D, galectin-1, and the S100-B protein in the second.
Proteins Upregulated in the First Surgery
S100 describes proteins from a family that play key roles in multiple stages of tumorigenesis and progression (27). According to Li et al., these proteins, at relatively low concentrations, promote angiogenesis by increasing proliferation, migration, and tube formation of vascular endothelial cells (28). Interestingly, Huang et al. reports S100-A9 to be upregulated in gliomas; however, treatments with NS-398 or aspirin lead to a downregulation of this protein (29). These facts, together with our results, pose the S100A9 as an interesting follow-up marker candidate for this type of tumor.
The myeloperoxidase is a lysosomal enzyme found in neutrophils and monocytes. Its atypical expression can lead to oxidative damage in normal tissues, contributing for the emergence of diseases such as atherosclerosis, Alzheimer, and cancer (30, 31). This protein has been correlated to ovarium (31), lung (32), and prostate cancer (33), to name a few. A recent study suggested that myeloperoxidase activity is essential during the tumoral development; in the later stages; its expression is independent of the progression of cancer cells (34), once again corroborating with our results.
The catalase is an antioxidant enzyme, which play a role in cell defense against oxidative stress (35). In a study with mammary cancer cells, Glorieux et al. observed that higher abundances of this protein decreases the cellular growth and proliferation (36). On the other hand, in a report with lung cancer cells, it was suggesting that catalase may regulate the activity of cathepsin, resulting in a high variation of migration and invasion ability for the cancer development (37). The mechanism of catalase in cancer tumors remains unclear.
The metallothionein-2 was recently reported to be a negative regulator of apoptosis (38). Some studies showed an increased abundance of this protein to be correlated to tumor grade and a proliferative activity in solid tumors, linked to poor survival; therefore, this protein could be a protagonist in carcinogenesis and drug resistance; our results reinforce what was previously demonstrated in some cancer cells, including GBMs (38–40).
Proteins Upregulated in the Second Surgery
Lumican is a small leucine-rich proteoglycan (SLRPs) that plays roles in cell adhesion and by serving as a regulatory molecule in cellular functions such as cell migration, proliferation, and apoptosis (41, 42). Studies in colorectal, pancreatic, and breast cancer correlated an increased abundance to tumoral growth and metastasis (42–44). Farace et al. noted that the presence of cancer stem cells (CSCs) or tumor-initialing cells, in neuroblastomas and gliomas, promotes the activation of high abundance of SLRPs, creating a cell-microenvironment to survival and possibly favoring cancer recurrence (45).
The cathepsin D is an aspartyl endoproteinase, its higher abundance has been correlated with poor prognosis in breast and glioma cancer patients (46–48). Studies associated its molecular functions with protein catabolism, tissue remodeling, and in multiple tumor progression steps such as proliferation, angiogenesis, and apoptosis (46, 49). According to Berchem et al., this protein stimulates cancer cell proliferation and tumor angiogenesis, independently of its proteolytic activity (49).
Galectin-1 belongs to the carbohydrate-binding proteins family, it is abundantly secreted by almost all types of malignant tumor cells and its expression is tightly linked to the tumor aggressiveness. In particular, this protein plays vital pro-tumorigenic roles within the tumor microenvironment as the suppression of immune responses, promotes the tumor angiogenesis, and others functions related to invasion and metastasis (50, 51). A study with GBM cells revealed that the diffuse gliomas demonstrated higher expression levels compared with pilocytic astrocytoma, which the galectin-1 may modulate the migration and invasion in these cells (52).
The S100-B protein has been used in clinical studies to evaluate the staging malignant melanoma and the treatment success, being considering an independent prognostic factor to predict the survival rate of the patients (53). The increasing S100-B concentrations indicate tumor progression and a worse prognosis for the patient (53); this is coherent with our results, which the patient presents in the second surgery, a high abundance of this protein. The patient deceased 1 year and 1 month after the second surgery.
Gene Ontology Enrichment Analysis
PatternLab’s Gene Ontology Explore module was employed to statistically pinpoint over-represented gene ontology terms according to the hypergeometric distribution. The completed list of the enriched terms is long, and made available as Table S10 in Supplementary Material. Among some of the most statistically enhanced terms (p << 0.01) many are related to the Ras pathway, frequently uncontrolled in gliomas (54). The Ras protein belongs to a familly of small GTPases that is ubiquitously expressed in all cell lineages and organs. This family is responsible for cellular signal transduction bringing to cell growth, differentiation, and survival. The clinically most notable members of the Ras subfamily are H-Ras, K-Ras, and N-Ras, mostly for being involved in many types of cancer (55–57). The enriched terms related to this pathway were: Ras protein signal transduction (GO: 0007265), regulation of Ras protein signal transduction (GO: 0046578) and positive regulation for cell development (GO: 0010720), growth (GO: 0030307), migration (GO: 0030335), and proliferation (GO: 0008284). Among these terms, protein members of the Ras family are frequently found; some examples are: Rab GDP dissociation inhibitor alpha (P31150), Ras-related protein Rap-1A (P62834), Rho GDP-dissociation inhibitor (J3QQX2), Rho GDP-dissociation inhibitor 1 (P52565), Rho GTPase-activating protein 1 (Q07960), Transforming protein RhoA (P61586), Importin subunit beta-1 (Q14974), Rho GDP-dissociation inhibitor 2 (P52566), Ras-related protein Rap-2c (Q9Y3L5), Ras-related protein Rap-2a (P10114). Some other key proteins related to tumors, identified in our dataset, and pertaining to these terms are: Cofilin-1 (P23528), 14-3-3 protein beta/alpha (P31946), Apolipoprotein A-I, E, C-III, Flotillin-1 (P35241) Radixin (P35241, A7YIJ8).
Final Considerations
Our strategy enabled us to peek behind a GBM’s heterogeneity smokescreen. Nevertheless, our glimpse remains elusive toward probing the real complexity of the cellular networks connecting a GBM’s core to its outer rims. We postulate that spatial comprehension is fundamental for paving the way toward effective treatments and have concentrated efforts in this direction. For example, one of our previous reports explored the proteomic landscape of a gastric cancer total resection (9); here, besides assessing the molecular topology, temporal changes were considered. As far as we know, this is the first work to accomplish such using an isobaric labeling approach. In the midst of so much heterogeneity, so many questions remain. Are the changes detected in the profound region a mechanism of survival? Or a causation from drug resistance? This scenario brings to forefront the discussion on how proteomic experimental design is carried as many reports do not consider spatial proteomics; how much will elevate numbers of “blended” tumors continue to shed light on our knowledge of this disease? We argue there is an entire universe to explore within a single tumor sample and that every tumor is unique. It is time to put into practice and pursue new paradigms devoted toward single-cell proteomics (58), these results could ultimately lead to a better comprehension on the cellular networks that drive tumors and demystify what appears to be a chaotic heterogeneity. Indeed, many say cancer is a loss of cellular control, chaos. Yet, according to José Saramago, a Portuguese writer and Nobel laureate in literature (1988), “chaos is merely order waiting to be deciphered.” Likewise, science argues that heterogeneity, by itself, could be a biomarker as more heterogeneous tumors have a higher chance of containing treatment-resistant subclones (59). So is this heterogeneity really chaos? A loss of order? Or is it a smokescreen camouflaging answers to the very basic questions such as what is the role of cancer in life. Be as it may, if life really emerged from chaos, let the words of Sun Tzu describe its origin: “In this midst of chaos, there is also opportunity.”
Author Contributions
PA, JF, FN, and GD performed sample preparation and design of experiment. CF, MC, and JS are medical doctors providing contributions related to the medical aspect. PC was responsible for data analysis; other authors that participated in this step were PA, FN, JF, NZ. PC, JF, and PC wrote the manuscript, and all authors reviewed it and made contributions.
Conflict of Interest Statement
The authors declare that the research was conducted in the absence of any commercial or financial relationships that could be construed as a potential conflict of interest.
The reviewers WF and AP and handling Editor declared their shared affiliation, and the handling Editor states that the process nevertheless met the standards of a fair and objective review.
Funding
The authors thank Fundação de Amparo à Pesquisa do Estado do Rio de Janeiro (FAPERJ), Coordenação de Aperfeiçoamento de Pesquisa e Ensino Superior (CAPES), Conselho Nacional de Desenvolvimento Científico e Tecnológico (CNPq), Fiocruz 30/2006-CAPES. PDTIS, and Fundação do Câncer for financial support.
Supplementary Material
The Supplementary Material for this article can be found online at http://journal.frontiersin.org/article/10.3389/fonc.2016.00183
Supporting Information
The raw mass spectra files, the PatternLab intermediary files, search database, the SEPro identification files and Excel spreadsheets listing the protein identification data, are available for download at http://proteomics.fiocruz.br/supplementaryfiles/oncology2016. PatternLab for proteomics is freely available for download at http://patternlabforproteomics.org
References
1. Park JK, Hodges T, Arko L, Shen M, Dello Iacono D, McNabb A, et al. Scale to predict survival after surgery for recurrent glioblastoma multiforme. J Clin Oncol (2010) 28:3838–43. doi:10.1200/JCO.2010.30.0582
2. Fadul C, Wood J, Thaler H, Galicich J, Patterson RH, Posner JB. Morbidity and mortality of craniotomy for excision of supratentorial gliomas. Neurology (1988) 38:1374–9. doi:10.1212/WNL.38.9.1374
3. Inda M-M, Bonavia R, Seoane J. Glioblastoma Multiforme: A Look Inside Its Heterogeneous Nature. Cancers (2014) 6:226–39. doi:10.3390/cancers6010226
4. Eder K, Kalman B. Molecular heterogeneity of glioblastoma and its clinical relevance. Pathol Oncol Res (2014) 20:777–87. doi:10.1007/s12253-014-9833-3
5. Fischer JSG, Carvalho PC, Canedo NHS, Goncalves KMS, Aquino PF, Almeida B, et al. Applications of formalin fixed paraffin-embedded tissue proteomics in the study of cancer. Austin Proteomics (2014) 1:1–7.
6. Fischer JSG, Canedo NHS, Goncalves KMS, Chimelli LMC, Franca M, Leprevost FV, et al. Proteome analysis of formalin-fixed paraffin-embedded tissues from a primary gastric melanoma and its meningeal metastasis: a case report. Curr Top Med Chem (2014) 14:382–7. doi:10.2174/1568026613666131204114218
7. Washburn MP, Ulaszek R, Deciu C, Schieltz DM, Yates JR. Analysis of quantitative proteomic data generated via multidimensional protein identification technology. Anal Chem (2002) 74:1650–7. doi:10.1021/ac015704l
8. Aquino PF, Fischer JSG, Neves-Ferreira AGC, Perales J, Domont GB, Araujo GDT, et al. Are gastric cancer resection margin proteomic profiles more similar to those from controls or tumors? J Proteome Res (2012) 11:5836–42. doi:10.1021/pr300612x
9. Aquino PF, Lima DB, de Saldanha da Gama Fischer J, Melani RD, Nogueira FCS, Chalub SRS, et al. Exploring the proteomic landscape of a gastric cancer biopsy with the shotgun imaging analyzer. J Proteome Res (2014) 13:314–20. doi:10.1021/pr400919k
10. Sottoriva A, Spiteri I, Piccirillo SGM, Touloumis A, Collins VP, Marioni JC, et al. Intratumor heterogeneity in human glioblastoma reflects cancer evolutionary dynamics. Proc Natl Acad Sci U S A (2013) 110:4009–14. doi:10.1073/pnas.1219747110
11. Ross PL, Huang YN, Marchese JN, Williamson B, Parker K, Hattan S, et al. Multiplexed protein quantitation in Saccharomyces cerevisiae using amine-reactive isobaric tagging reagents. Mol Cell Proteomics (2004) 3:1154–69. doi:10.1074/mcp.M400129-MCP200
12. da Fonseca CO, Schwartsmann G, Fischer J, Nagel J, Futuro D, Quirico-Santos T, et al. Preliminary results from a phase I/II study of perillyl alcohol intranasal administration in adults with recurrent malignant gliomas. Surg Neurol (2008) 70:259–67. doi:10.1016/j.surneu.2007.07.040
13. DA Fonseca CO, Teixeira RM, Silva JC, DE Saldanha DA, Gama Fischer J, Meirelles OC, et al. Long-term outcome in patients with recurrent malignant glioma treated with Perillyl alcohol inhalation. Anticancer Res (2013) 33:5625–31.
14. Fischer Jde S, Carvalho PC, Neves-Ferreira AG, da Fonseca CO, Perales J, Carvalho Mda G, et al. Anti-thrombin as a prognostic biomarker candidate for patients with recurrent glioblastoma multiform under treatment with perillyl alcohol. J Exp Ther Oncol (2008) 7:285–90.
15. Makarov A. Electrostatic axially harmonic orbital trapping: a high-performance technique of mass analysis. Anal Chem (2000) 72:1156–62. doi:10.1021/ac991131p
16. Carvalho PC, Lima DB, Leprevost FV, Santos MDM, Fischer JSG, Aquino PF, et al. Integrated analysis of shotgun proteomic data with PatternLab for proteomics 4.0. Nat Protoc (2015) 11:102–17. doi:10.1038/nprot.2015.133
17. Xu T, Park SK, Venable JD, Wohlschlegel JA, Diedrich JK, Cociorva D, et al. ProLuCID: an improved SEQUEST-like algorithm with enhanced sensitivity and specificity. J Proteomics (2015) 129:16–24. doi:10.1016/j.jprot.2015.07.001
18. Carvalho PC, Fischer JSG, Xu T, Cociorva D, Balbuena TS, Valente RH, et al. Search engine processor: filtering and organizing peptide spectrum matches. Proteomics (2012) 12:944–9. doi:10.1002/pmic.201100529
19. Fischer Jde S, Liao L, Carvalho PC, Barbosa VC, Domont GB, CarvalhoMda G, et al. Dynamic proteomic overview of glioblastoma cells (A172) exposed to perillyl alcohol. J Proteomics (2010) 73:1018–27. doi:10.1016/j.jprot.2010.01.003
20. Carvalho PC, Fischer JS, Chen EI, Domont GB, Carvalho MG, Degrave WM, et al. GO explorer: a gene-ontology tool to aid in the interpretation of shotgun proteomics data. Proteome Sci (2009) 7:6. doi:10.1186/1477-5956-7-6
21. Fabregat A, Sidiropoulos K, Garapati P, Gillespie M, Hausmann K, Haw R, et al. The Reactome pathway Knowledgebase. Nucleic Acids Res (2016) 44:D481–7. doi:10.1093/nar/gkv1351
22. Zhang B, Chambers MC, Tabb DL. Proteomic parsimony through bipartite graph analysis improves accuracy and transparency. J Proteome Res (2007) 6:3549–57. doi:10.1021/pr070230d
23. Fortin Ensign SP, Mathews IT, Symons MH, Berens ME, Tran NL. Implications of Rho GTPase signaling in glioma cell invasion and tumor progression. Front Oncol (2013) 3:241. doi:10.3389/fonc.2013.00241
24. Yap TA, Gerlinger M, Futreal PA, Pusztai L, Swanton C. Intratumor heterogeneity: seeing the wood for the trees. Sci Transl Med (2012) 4:127s10. doi:10.1126/scitranslmed.3003854
25. Gillies RJ, Verduzco D, Gatenby RA. Evolutionary dynamics of carcinogenesis and why targeted therapy does not work. Nat Rev Cancer (2012) 12:487–93. doi:10.1038/nrc3298
26. Parker NR, Khong P, Parkinson JF, Howell VM, Wheeler HR. Molecular heterogeneity in glioblastoma: potential clinical implications. Front Oncol (2015) 5:55. doi:10.3389/fonc.2015.00055
27. Chen H, Xu C, Jin Q, Liu Z. S100 protein family in human cancer. Am J Cancer Res (2014) 4:89–115.
28. Li C, Li S, Jia C, Yang L, Song Z, Wang Y. Low concentration of S100A8/9 promotes angiogenesis-related activity of vascular endothelial cells: bridges among inflammation, angiogenesis, and tumorigenesis? Mediators Inflamm (2012) 2012:248574. doi:10.1155/2012/248574
29. Huang N, Chen S, Deng J, Huang Q, Liao P, Wang F, et al. Overexpression of S100A9 in human glioma and in-vitro inhibition by aspirin. Eur J Cancer Prev (2013) 22:585–95. doi:10.1097/CEJ.0b013e328364f1c9
30. Li J, Fu Y, Zhao B, Xiao Y, Chen R. Myeloperoxidase G463A polymorphism and risk of lung cancer. Tumour Biol (2014) 35:821–9. doi:10.1007/s13277-013-1113-4
31. Castillo-Tong DC, Pils D, Heinze G, Braicu I, Sehouli J, Reinthaller A, et al. Association of myeloperoxidase with ovarian cancer. Tumour Biol (2014) 35:141–8. doi:10.1007/s13277-013-1017-3
32. London SJ, Lehman TA, Taylor JA. Myeloperoxidase genetic polymorphism and lung cancer risk. Cancer Res (1997) 57:5001–3.
33. Ding G, Liu F, Feng C, Xu J, Ding Q. [Association between the myeloperoxidase gene polymorphisms and the susceptibility to prostate cancer: a case-control study in a Chinese population]. Actas Urol Esp (2013) 37:79–82. doi:10.1016/j.acuro.2012.03.020
34. Rymaszewski AL, Tate E, Yimbesalu JP, Gelman AE, Jarzembowski JA, Zhang H, et al. The role of neutrophil myeloperoxidase in models of lung tumor development. Cancers (2014) 6:1111–27. doi:10.3390/cancers6021111
35. Glorieux C, Auquier J, Dejeans N, Sid B, Demoulin J-B, Bertrand L, et al. Catalase expression in MCF-7 breast cancer cells is mainly controlled by PI3K/Akt/mTor signaling pathway. Biochem Pharmacol (2014) 89:217–23. doi:10.1016/j.bcp.2014.02.025
36. Glorieux C, Dejeans N, Sid B, Beck R, Calderon PB, Verrax J. Catalase overexpression in mammary cancer cells leads to a less aggressive phenotype and an altered response to chemotherapy. Biochem Pharmacol (2011) 82:1384–90. doi:10.1016/j.bcp.2011.06.007
37. Tsai J-Y, Lee M-J, Dah-Tsyr Chang M, Huang H. The effect of catalase on migration and invasion of lung cancer cells by regulating the activities of cathepsin S, L, and K. Exp Cell Res (2014) 323:28–40. doi:10.1016/j.yexcr.2014.02.014
38. Eckschlager T, Adam V, Hrabeta J, Figova K, Kizek R. Metallothioneins and cancer. Curr Protein Pept Sci (2009) 10:360–75. doi:10.2174/138920309788922243
39. Mehrian-Shai R, Yalon M, Simon AJ, Eyal E, Pismenyuk T, Moshe I, et al. High metallothionein predicts poor survival in glioblastoma multiforme. BMC Med Genomics (2015) 8:68. doi:10.1186/s12920-015-0137-6
40. Takahashi S. Molecular functions of metallothionein and its role in hematological malignancies. J Hematol Oncol (2012) 5:41. doi:10.1186/1756-8722-5-41
41. Gu G, Cheng W, Yao C, Yin J, Tong C, Rao A, et al. Quantitative proteomics analysis by isobaric tags for relative and absolute quantitation identified Lumican as a potential marker for acute aortic dissection. J Biomed Biotechnol (2011) 2011:920763. doi:10.1155/2011/920763
42. Kao WW-Y, Funderburgh JL, Xia Y, Liu C-Y, Conrad GW. Focus on molecules: Lumican. Exp Eye Res (2006) 82:3–4. doi:10.1016/j.exer.2005.08.012
43. Kelemen LE, Couch FJ, Ahmed S, Dunning AM, Pharoah PD, Easton DF, et al. Genetic variation in stromal proteins decorin and lumican with breast cancer: investigations in two case-control studies. Breast Cancer Res (2008) 10:R98. doi:10.1186/bcr2201
44. Naito Z. Role of the small leucine-rich proteoglycan (SLRP) family in pathological lesions and cancer cell growth. J Nippon Med Sch (2005) 72:137–45. doi:10.1272/jnms.72.137
45. Farace C, Oliver JA, Melguizo C, Alvarez P, Bandiera P, Rama AR, et al. Microenvironmental modulation of decorin and lumican in temozolomide-resistant glioblastoma and neuroblastoma cancer stem-like cells. PLoS One (2015) 10:e0134111. doi:10.1371/journal.pone.0134111
46. Fukuda ME, Iwadate Y, Machida T, Hiwasa T, Nimura Y, Nagai Y, et al. Cathepsin D is a potential serum marker for poor prognosis in glioma patients. Cancer Res (2005) 65:5190–4. doi:10.1158/0008-5472.CAN-04-4134
47. Garcia M, Platet N, Liaudet E, Laurent V, Derocq D, Brouillet J-P, et al. Biological and clinical significance of Cathepsin D in breast cancer metastasis. Stem Cells (1996) 14:642–50. doi:10.1002/stem.140642
48. Johnson MD, Torri JA, Lippman ME, Dickson RB. The role of cathepsin d in the invasiveness of human breast cancer cells. Cancer Res (1993) 53:873–7.
49. Berchem G, Glondu M, Gleizes M, Brouillet J-P, Vignon F, Garcia M, et al. Cathepsin-D affects multiple tumor progression steps in vivo: proliferation, angiogenesis and apoptosis. Oncogene (2002) 21:5951–5. doi:10.1038/sj.onc.1205745
50. Astorgues-Xerri L, Riveiro ME, Tijeras-Raballand A, Serova M, Neuzillet C, Albert S, et al. Unraveling galectin-1 as a novel therapeutic target for cancer. Cancer Treat Rev (2014) 40:307–19. doi:10.1016/j.ctrv.2013.07.007
51. Ito K, Stannard K, Gabutero E, Clark AM, Neo S-Y, Onturk S, et al. Galectin-1 as a potent target for cancer therapy: role in the tumor microenvironment. Cancer Metastasis Rev (2012) 31:763–78. doi:10.1007/s10555-012-9388-2
52. Jung T-Y, Jung S, Ryu H-H, Jeong Y-I, Jin Y-H, Jin S-G, et al. Role of galectin-1 in migration and invasion of human glioblastoma multiforme cell lines. J Neurosurg (2008) 109:273–84. doi:10.3171/JNS/2008/109/8/0273
53. Harpio R, Einarsson R. S100 proteins as cancer biomarkers with focus on S100B in malignant melanoma. Clin Biochem (2004) 37:512–8. doi:10.1016/j.clinbiochem.2004.05.012
54. Nakada M, Kita D, Watanabe T, Hayashi Y, Teng L, Pyko IV, et al. Aberrant signaling pathways in glioma. Cancers (2011) 3:3242–78. doi:10.3390/cancers3033242
55. Downward J. Targeting RAS and PI3K in lung cancer. Nat Med (2008) 14:1315–6. doi:10.1038/nm1208-1315
56. Prior IA, Lewis PD, Mattos CA. Comprehensive survey of Ras mutations in cancer. Cancer Res (2012) 72:2457–67. doi:10.1158/0008-5472.CAN-11-2612
57. Thomas NE, Edmiston SN, Alexander A, Groben PA, Parrish E, Kricker A, et al. Association between NRAS and BRAF mutational status and melanoma-specific survival among patients with higher-risk primary melanoma. JAMA Oncol (2015) 1:359–68. doi:10.1001/jamaoncol.2015.0493
58. Albert FW, Treusch S, Shockley AH, Bloom JS, Kruglyak L. Genetics of single-cell protein abundance variation in large yeast populations. Nature (2014) 506:494–7. doi:10.1038/nature12904
Keywords: glioblastoma multiforme, molecular heterogeneity, quantitative proteomics, iTRAQ
Citation: de Aquino PF, Carvalho PC, Nogueira FCS, da Fonseca CO, Souza Silva JCT, Carvalho MGC, Domont GB, Zanchin NIT and Fischer JSG (2016) A Time-Based and Intratumoral Proteomic Assessment of a Recurrent Glioblastoma Multiforme. Front. Oncol. 6:183. doi: 10.3389/fonc.2016.00183
Received: 28 April 2016; Accepted: 02 August 2016;
Published: 22 August 2016
Edited by:
Aline Maria Araujo Martins, University of Brasília, BrazilReviewed by:
Jean-François Michel Rual, University of Michigan, USAArthur Henriques Pontes, University of Brasília, Brazil
Wagner Fontes, University of Brasília, Brazil
Copyright: © 2016 de Aquino, Carvalho, Nogueira, da Fonseca, Souza Silva, Carvalho, Domont, Zanchin and Fischer. This is an open-access article distributed under the terms of the Creative Commons Attribution License (CC BY). The use, distribution or reproduction in other forums is permitted, provided the original author(s) or licensor are credited and that the original publication in this journal is cited, in accordance with accepted academic practice. No use, distribution or reproduction is permitted which does not comply with these terms.
*Correspondence: Juliana de Saldanha da Gama Fischer, julifr@gmail.com
†Priscila F. de Aquino and Paulo Costa Carvalho contributed equally.