The non-lemniscal auditory cortex in ferrets: convergence of corticotectal inputs in the superior colliculus
- Department of Physiology, Anatomy and Genetics, University of Oxford, Oxford, UK
Descending cortical inputs to the superior colliculus (SC) contribute to the unisensory response properties of the neurons found there and are critical for multisensory integration. However, little is known about the relative contribution of different auditory cortical areas to this projection or the distribution of their terminals in the SC. We characterized this projection in the ferret by injecting tracers in the SC and auditory cortex. Large pyramidal neurons were labeled in layer V of different parts of the ectosylvian gyrus after tracer injections in the SC. Those cells were most numerous in the anterior ectosylvian gyrus (AEG), and particularly in the anterior ventral field, which receives both auditory and visual inputs. Labeling was also found in the posterior ectosylvian gyrus (PEG), predominantly in the tonotopically organized posterior suprasylvian field. Profuse anterograde labeling was present in the SC following tracer injections at the site of acoustically responsive neurons in the AEG or PEG, with terminal fields being both more prominent and clustered for inputs originating from the AEG. Terminals from both cortical areas were located throughout the intermediate and deep layers, but were most concentrated in the posterior half of the SC, where peripheral stimulus locations are represented. No inputs were identified from primary auditory cortical areas, although some labeling was found in the surrounding sulci. Our findings suggest that higher level auditory cortical areas, including those involved in multisensory processing, may modulate SC function via their projections into its deeper layers.
Introduction
The superior colliculus (SC) is a multisensory integration center located in the midbrain (reviewed in Stein, 1998 ; King, 2004 ), which is responsible for directing behavioral responses toward specific points in space (Sprague and Meikle, 1965 ). The SC is the only structure in the mammalian brain where a two-dimensional auditory spatial map has been described (Palmer and King, 1982 ; Middlebrooks and Knudsen, 1984 ; King and Hutchings, 1987 ). This auditory spatial representation, found in the deeper layers, is topographically aligned with the visual and somatosensory maps that are also present in the SC. Ascending auditory input to the SC comes from the inferior colliculus (IC), particularly the external cortex and the nucleus of the brachium (King et al., 1998 ; Nodal et al., 2005 ), where coarse topographic representations of sound azimuth have been described (Binns et al., 1992 ; Schnupp and King, 1997 ).
It is well established that the cortex can modulate signal processing in the SC via descending corticofugal connections (e.g. Diamond et al., 1969 ; Wallace et al., 1993 ). Early work in the cat suggested that cortical influences have a much greater influence on the visual responses of SC neurons than on their responses to other sensory modalities (Stein, 1978 ). However, subsequent studies showed that cortical deactivation can greatly reduce the responses of SC neurons to both somatosensory (Clemo and Stein, 1986 ) and auditory stimulation (Meredith and Clemo, 1989 ) too. The cortical areas in the cat that have been the focus of these studies are the anterior ectosylvian sulcus (AES) and the rostral aspect of the lateral suprasylvian sulcus (rLS), which both contain a mixture of visual, somatosensory, and auditory neurons. Deactivation of either of these cortical areas also compromises multisensory interactions at both single SC neuron (Jiang et al., 2001 ; Alvarado et al., 2007 ) and behavioral (Jiang et al., 2002 ) levels, even when responses to modality-specific stimuli are only slightly altered. These findings therefore suggest that the major role of descending cortical inputs to the SC is to enable different modality stimuli to be combined and integrated in a behaviorally-relevant fashion.
Damage or deactivation of the SC in the cat impairs both modality-specific (Lomber et al., 2001 ) and multisensory (Burnett et al., 2004 ) orientation behavior. Similar deficits in auditory spatial orienting in this species have been described after cooling several different cortical fields, including not only AES, but also the primary auditory cortex (A1), dorsal zone (DZ), and posterior auditory field (PAF) (Malhotra and Lomber, 2007 ; Lomber and Malhotra, 2008 ). This raises the possibility that auditory cortical areas other than AES might contribute to the orientation responses mediated by the SC. However, Meredith and Clemo (1989) showed that the auditory subregion of AES (referred to as FAES) provides the only robust projection to the SC and that activation of this cortical area can drive auditory SC neurons, whereas this is not the case for other parts of auditory cortex. Although there is also anatomical evidence in cats for sparser inputs to the SC from several other parts of non-primary auditory cortex (Meredith and Clemo, 1989 ; Winer et al., 1998 ), including the secondary auditory cortex (A2) and areas of multisensory affiliation, it is unknown what role these descending projections have in SC function. The sources and terminal distribution of descending auditory cortical inputs to the SC in other species have not so far been investigated, so it is presently unclear whether an area equivalent to AES dominates corticotectal influences in the same way as it does in the cat.
In this study, we used a combination of retrograde and anterograde tracing techniques to investigate auditory corticotectal projections in the ferret, a species that is becoming increasingly popular for investigations of sensory processing and, in particular, the neural basis of hearing. Ferrets are naturally curious, intelligent animals that are well suited for behavioral and physiological studies (e.g., Fritz et al., 2003 ; Kacelnik et al., 2006 ; Allman et al., 2009 ; Bajo et al., 2010 ). However, very limited information is available on the organization of the auditory cortex (Kelly et al., 1986 ; Kowalski et al., 1995 ; Wallace et al., 1997 ), and only recently have auditory cortical fields outside the primary areas have been described (Nelken et al., 2004 ; Bizley et al., 2005 ). Therefore, a description of the corticotectal projection in the ferret will contribute to our understanding of the organization and functions of the different auditory cortical fields in this species. Additionally, this will facilitate comparison with existing data from the cat, an animal model in which the different auditory cortical fields and their connections are well established.
Materials and Methods
Sixteen adult ferrets (Mustela putorius furo) of both sexes were used in this study. The experiments were approved by a local Ethical Review Committee at the University of Oxford, and performed under license from the UK Home Office in accordance with the Animal (Scientific Procedures) Act 1986.
Four animals received neuronal tracer injections in the SC and twelve animals at different locations within the auditory cortex. A summary of neuronal tracers and injection locations in each animal is provided in Table 1 . To minimize the number of animals used, many of the cases with injections in the cortex were also used for studying other descending corticofugal connections (Bajo et al., 2007 ) and the connectivity between the auditory and visual cortices (Bizley et al., 2007 ).
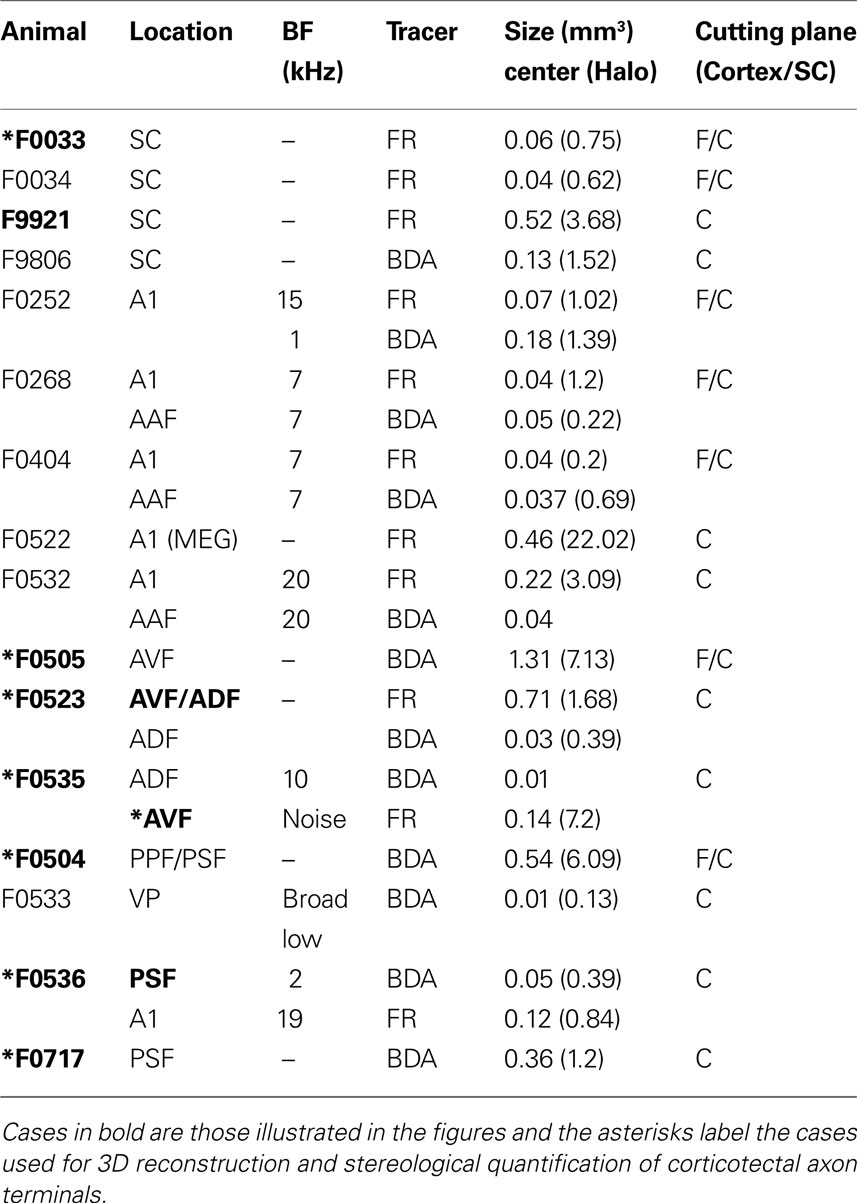
Table 1. Tracer injections in each animal used in this study.
The tracers used were dextran amine conjugated with biotin (dextran biotin fixable, BDA, 10,000 MW; Molecular Probes Inc, Eugene, OR, USA) or rhodamine (dextran tetramethylrhodamine lysine fixable, 3,000 and 10,000 MW Fluororuby, FR; Molecular Probes). Both tracer solutions (diluted 10% in 0.9% saline) were injected by iontophoresis (5 μA of positive current in 7 s pulses for 15 min) through a glass micropipette with a 15–30 μm tip diameter.
Surgical Protocol
All animals were examined otoscopically to ensure that both ears were clean and disease-free. After sedation with Domitor (0.1 mg/kg body weight i.m. medetomidine hydrochloride; Pfizer Ltd, Kent, UK), anesthesia was induced with Saffan (2 ml/kg body weight i.m. alfaxalone/alfadolone acetate; Schering-Plough Animal Health, Welwyn Garden City, UK) and maintained with an intravenous infusion of a mixture of Domitor (0.022 mg/kg/h) and Ketaset (5 mg/kg/h ketamine hydrochloride; Fort Dodge Animal Health, Southampton, UK) in saline solution. Dexadreson (0.5 mg/kg/h dexamethasone; Intervet UK Ltd, Milton Keynes, UK) and Atrocare (0.006 mg/kg/h atropine sulfate; Animalcare Ltd, York, UK) were added to the infusate to avoid cerebral edema and minimize pulmonary secretions, respectively. In each case, the animals received perioperative analgesia with Vetergesic (0.15 ml i.m. buprenorphine hydrochloride; Alstoe Animal Health, Melton Mowbray, UK) and Metacam (0.05 ml oral meloxicam; Boehringer Ingelheim, Rhein, Germany). The animals were intubated and artificially ventilated with oxygen. End-tidal CO2, the electrocardiogram and body temperature were monitored throughout the duration of the surgery. Temperature was maintained at 38°C using a rectal probe coupled to a heating blanket and by covering the animal with drapes during surgery.
Once these measures were stable, the animal was placed in a stereotaxic frame. A midline incision was then made in the scalp, the left temporal muscle retracted to expose the skull and the surgical wound infused with Marcain (bupivacaine hydrochloride, Astra Pharmaceuticals Ltd, Kings Langley, UK). In the cases of injections in the SC, the left occipital cortex was exposed by a craniotomy. The dura mater was removed, and the most posterior corner of the occipital cortex was carefully aspirated until the SC was visible. For injections in the auditory cortex, a craniotomy was made over the left ectosylvian gyrus, exposing the suprasylvian, and pseudosylvian sulci to provide landmarks. The animal was then transferred to a small Table inside an anechoic chamber (IAC Ltd, Winchester, UK). We recorded multi-unit activity with a glass pipette in response to contralateral ear stimulation before placing tracer injections. Acoustic stimuli were generated using TDT system 3 hardware (Tucker-Davis Technologies, Alachua, FL, USA) and were presented via a closed-field electrostatic speaker (EC1, Tucker-Davis Technologies) with a flat frequency output (±5dB) to ≤30 kHz. Closed-field calibrations of the sound-delivery system were performed using a 1/8th-inch condenser microphone (Brüel and Kjær, Naerum, Denmark) placed at the end of a model ferret ear canal. Frequency-response areas of cortical neurons were constructed from the responses to pure-tone stimuli presented pseudorandomly at frequencies from 500 Hz to 30 kHz, in one-third octave steps. Tones were 100 ms in duration (5 ms cosine ramped) and intensity levels were varied between 10 and 80 dB SPL in 10 dB increments. Broadband noise bursts (40 Hz–30 kHz bandwidth and cosine ramped with a 10-ms rise/fall time, 100 ms duration from 30 to 80 dB SPL) were also used as a search stimulus.
All the animals with SC injections (n = 4) and some of those with cortical injections (n = 5) received a single injection of either BDA or FR. In addition, a further seven cases received injections of both tracers at different locations in the auditory cortex (Table 1 ). In each case, after the injection was complete, the dura mater was replaced and small pieces of Surgicel were used to cover the exposed brain before the piece of cranium was put back in its previous position and the temporal muscles and the skin were sutured independently.
Histological Procedures
The animals were perfused transcardially 2–5 weeks after the initial surgery under terminal anesthesia with Euthatal (2 ml of 200 mg/ml of pentobarbital sodium; Merial Animal Health Ltd, Harlow, UK). The blood vessels were flushed with 300 ml of 0.9% saline followed by 1 l of fresh 4% paraformaldehyde in 0.1 M phosphate buffer (PB), pH 7.4. Each brain was dissected from the skull, maintained in the same fixative for several hours, and immersed in a 30% sucrose solution in 0.1 M PB for 3 days.
In five cases with injections in the auditory cortex and two cases with injections in the SC, both hemispheres were dissected and gently flattened between two glass slides. In those cases, the cortex was later sectioned in a flat tangential plane and the rest of the brain cut in the coronal plane. The other brains were sectioned in the standard coronal plane (Table 1 ); 50 μm sections were cut on a freezing microtome and six sets of serial sections were collected, with one section in every three (1/150 μm) being used to analyze the tracer labeling.
Fluororuby was visualized immunocytochemically (primary anti-tetramethylrhodamine, rabbit IgG, dilution 1:6000; Molecular Probes; followed by secondary biotinylated anti-rabbit IgG H + L, made in goat, dilution 1:200; Vector Laboratories), whereas BDA was incubated in ABC (avidin biotin peroxidase, Vectastain Elite ABC Kit; Vector Laboratories, Burlingame, CA, USA) only. After washing the sections several times in 10 mM phosphate buffer saline (PBS) with 0.1% Triton X100 (PBS-Tx), they were incubated under gentle agitation overnight at +5°C in the primary antibody. The sections were again rinsed several times in PBS-Tx and then incubated in the biotinylated secondary antibody for 2 h. After further rinsing, the sections were incubated for 90 min in avidin biotin peroxidase (Vectastain Elite ABC kit; Vector Laboratories). Rinsing in PBS was followed by incubation in the chromogen solution with 3,3′-Diaminobenzidine (DAB; Sigma-Aldrich Company Ltd, Dorset, UK). Sections were incubated in 0.4 mM DAB and 9.14 mM H2O2 in 0.1 M PB until the reaction product could be seen. When BDA and FR were present in the same tissue, the BDA was first visualized using ABC followed by DAB enhanced with 2.53 mM Nickel ammonium sulfate. Immunocytochemistry to reveal FR was then performed, as described above but without nickel enhancement of the DAB. Reactions were stopped by rinsing the sections several times in 0.1 M PB. Sections were mounted on gelatinized glass slides, air dried, dehydrated, and coverslipped.
To identify the different subdivisions of SC and auditory cortex (Bajo et al., 2007 ), one set of serial sections (1 every 300 μm) was counterstained with 0.2% cresyl violet, another set was selected to visualize cytochrome oxidase (CO) activity, and a third set was used to stain the non-phosphorylated form of neurofilament H protein SMI32. Other sections from our archive stained with AChEase and Gallyas were also used for cytoarchitectonic purposes. CO staining was obtained after 12 h incubation with 4% sucrose, 0.025% Cytochrome C (Sigma-Aldrich) and 0.05% DAB in 0.1 M PB at +37°C. Monoclonal mouse anti-SMI32 (Covance Research Products Inc., Emeryville, CA, USA) was used at a dilution of 1:4000. After immersion for 60 min in a blocking serum solution with 5% normal horse serum, the sections were incubated overnight at +5°C with the mouse antibody and 2% normal horse serum in 10 mM PBS. Anti-mouse biotinylated secondary antibody (mouse ABC kit, dilution 1:200 in PBS with 2% normal horse serum; Vector Laboratories) was used after brief washings in 10 mM PBS. Immunoreaction was followed by several more washings in PBS, incubation in ABC, and visualization using DAB with nickel–cobalt intensification (Adams, 1981 ; J. A. Winer, personal communication).
Data Analysis
Histological analysis was carried out and photomicrographs were taken with a Leica DMR microscope (Leica Microsystems, Heerbrugg, Switzerland) and a digital camera (Microfire™, Olympus America Inc, Center Valley, PA, USA). Histological reconstructions and unbiased stereological estimates were performed using Neurolucida and StereoInvestigator software (version 8, MBF Bioscience, MicroBrightField Inc., Williston, VT, USA). Three dimensional reconstructions from the sections were performed using the 3D module in Neuroexplorer (MBF Neuroscience). One set of serial sections (1 every 300 μm) at the level of the SC or at the level of the auditory cortex was plotted in StereoInvestigator using a Cartesian coordinate system. The sections were aligned using blood vessels and outlines of adjacent sections. Statistical analysis was carried out using SPSS software (SPSS Inc., Chicago, IL, USA).
To estimate the relationship between the labeled terminals and the different layers of the SC, we reconstructed the position of the terminals and of the intermediate and deep gray layers in this nucleus using the center of the fourth ventricle at the most posterior section in which the SC is present as a reference point, i.e., the point that marks the 0,0,0 origin of our Cartesian coordinate system. We used three independent metrics to compare the distribution of the terminals in the deep SC cellular layers across animals. The first metric compared the dispersion and the clustering indexes. The dispersion index was calculated as the ratio of the area of labeling in the SC layers normalized by the area of the injection site in the cortex. Those areas (A in the following equation) were calculated by drawing a polygon around the labeled terminals, within the limits of the SGI and SGP, and around the limits of the injection sites (x, y, and z represent the three spatial coordinates):
The clustering index (CI) is the mean distance between a terminal and its closest neighbor in the same layer
Therefore, larger values in the dispersion and clustering indexes indicate greater divergence in the projection and vice versa.
The second metric relates the distribution of the terminals to the spatial extent of each SC layer by comparing the locations of the centroids (Cx and Cy) for each in every section examined. The centroids were defined by the intersection of all the hyperplanes of symmetry of each terminal distribution or SC layer according to the following equations. This comparison provides a measure of how homogenous the terminal labeling is within each layer.

To further analyze the distribution of the cortical terminals within the SC, the intermediate and deep layers were divided into four equal quadrants based on their centroid coordinates and the anteroposterior axis. The number of terminals in each quadrant was compared across animals. The density of terminals in the SC was calculated by dividing the total number of terminals (estimated using the fractionator after counting one in every six sections without employing counting frames) by the volume of each layer. The volumes of the SGI and SGP were calculated by the Cavalieri method (Gundersen, 1988 ). This involved multiplying the area of one in every six sections along the anteroposterior axis of the SC by the distance between them. The small size of the terminals relative to the thickness of the sections prevented any possible double counting.
Analysis of the morphological features of the labeled terminals was performed using optical microscopy. We considered every swelling in a labeled fiber as an “en passant” bouton and every swelling at the end of a labeled fiber as an end-terminal bouton. Terminals were classified according to their morphology following the same criteria used by Fuentes-Santamaria et al. (2009) in the cat SC.
Nomenclature and Criteria for Subdivisions in the Superior Colliculus and in the Auditory Cortex
The nomenclature and limits used for the different areas in the auditory cortex or layers in the SC are shown in Figure 1 . The different layers of the SC were defined as in previous studies in the ferret (King and Hutchings, 1987 ; Meredith et al., 2001 ; Nodal et al., 2005 ), which are based on an earlier description of the SC in the cat (Kanaseki and Sprague, 1974 ). Briefly, the SC has a laminar structure with alternating gray and white layers formed predominantly of cells or fibers, respectively (Figures 1 C,D). Superficial SC is primarily involved in visual functions (reviewed by Stein and Meredith, 1991 ), and comprises the three most superficial layers: the stratum zonale (SZ), the stratum griseum superficiale (SGS), and the stratum opticum (SO). The deeper SC layers comprise the intermediate layers, the stratum griseum intermediale (SGI) and the stratum album intermediale (SAI), and the deep layers, the stratum griseum profundum (SGP) and the stratum album profundum (SAP) (Figure 1 D). This region is involved primarily in multisensory integration and in generating premotor commands for orientation behavior (reviewed by King, 1993 ).
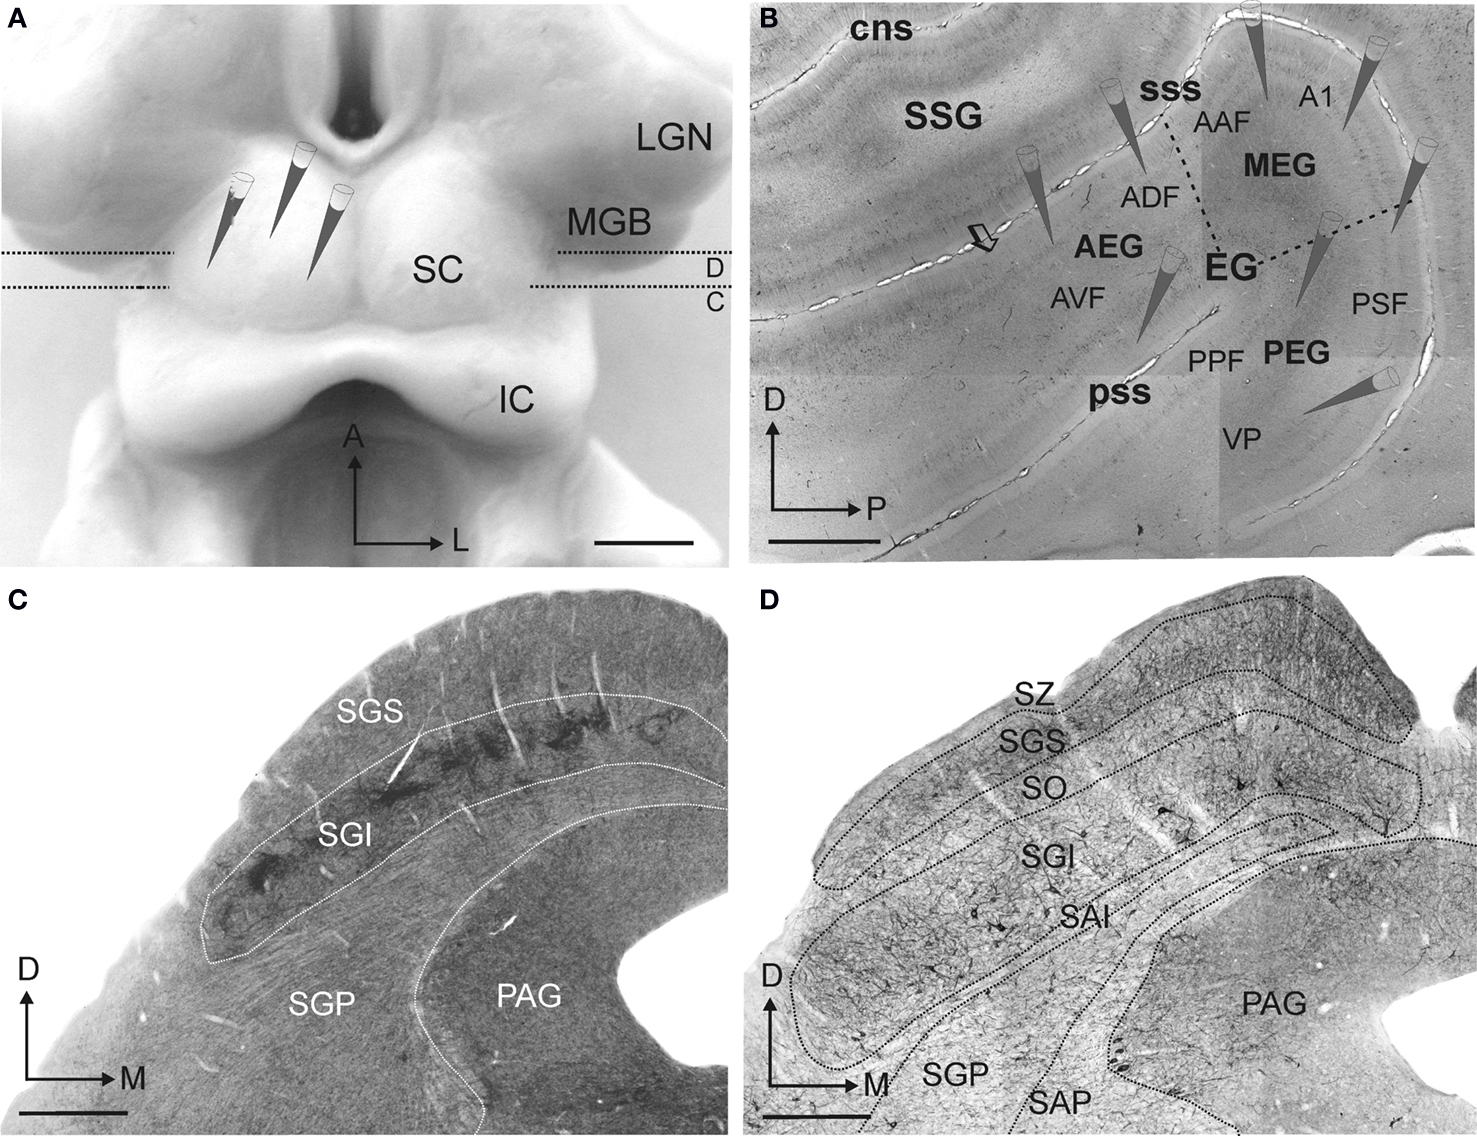
Figure 1. The experimental design. Neural tracer injections in the superior colliculus (SC) and in the auditory cortex were made to label corticotectal cells retrogradely and their terminals in the SC anterogradely. (A) Dorsal view of the SC after the cortical hemispheres have been removed, showing the location of the tracer injections. Dotted lines and small C and D letters indicate the anteroposterior level of the coronal sections shown in panels (C) and (D), respectively, in which the laminar organization of the SC can be observed. (B) Lateral view at the level of the ectosylvian gyrus taken from a flattened, tangential section stained with SMI32 monoclonal antibody. Tracer injections were placed in the different auditory fields (see Table 1 ), as indicated. The limits between the different layers in the SC were identified primarily on the basis of acetycholinesterase staining (C) and SMI32 immunocytochemistry (D). Calibration bars are 2 mm in (A) and (B) and 0.5 mm in (C) and (D).
Ferret auditory cortex is located in the ectosylvian gyrus (EG) and its middle, anterior and posterior regions (MEG, AEG, and PEG, respectively) can be distinguished according to the distribution pattern of SMI32 immunostaining (Figure 1 B, dashed lines) and also by Nissl and CO staining patterns (Bajo et al., 2007 ). Four tonotopic areas have been described electrophysiologically (Kowalski et al., 1995 ; Bizley et al., 2005 ): A1 and the anterior auditory field (AAF) in the MEG, and the posterior suprasylvian field (PSF) and posterior pseudosylvian field (PPF) in the PEG. The tonotopic axes in A1 and AAF have a dorso-ventral orientation with low frequency areas in the most ventral part of MEG. A reversal in the tonotopic organization occurs between PPF and PSF, which share a region of low frequency sensitivity that extends up to the low frequency border of A1. High frequencies are represented in PPF and PSF close to the pss and sss, respectively. In addition, a third ventroposterior area (VP) has been described anatomically in the PEG (Pallas and Sur, 1993 ; Bajo et al., 2007 ). In the AEG, at least two non-tonotopic areas have been characterized, the anterodorsal field (ADF) and, ventral to it, the anteroventral field (AVF) (Bizley et al., 2005 ). AVF is the most ventral and anterior area in AEG defined as part of the auditory cortex on the basis of the vigorous responses of the neurons found there to broadband noise (Bizley et al., 2005 ). Anatomically, at the anterior limit of AVF a change in SMI32 pattern is observed (arrow in Figure 1 B), with more intense staining found in layer II/III outside the auditory cortex.
Results
In initial experiments, tracer injections were placed in the SC to label neurons retrogradely in the auditory cortex. The distribution of labeled cortical neurons in the EG was then used to guide tracer injections into different areas of the auditory cortex, in order to study the pattern of organization of their terminal fields in the SC.
Retrograde Labeling after Tracer Injections in the Superior Colliculus is found in Specific Cortical Areas
Figure 2 shows an example of an injection of FR into the SC; the injection site was centered in the SGP, although its halo extended dorsally into the SGI and medially so that it just included the edge of the periaqueductal gray (PAG, Figure 2 A). Retrogradely labeled neurons were numerous in the ipsilateral EG (Figures 2 B,C). However, the labeling was not uniformly distributed across the gyrus. Labeling was most prominent in the AEG, particularly in the AVF and non-auditory areas located more anterior to the AVF, but was also present on the posterior EG (PEG), especially in its most posterior and dorsal part, where PSF is located. Labeled neurons in the MEG, where the primary areas A1 and AAF are located, were relatively scarce (Figures 2 B,C). Moreover, where labeling was present in this region, it was found in peripheral locations consistent with these cells being located within the sulci. Such labeling is evident when the cortex was cut in the coronal plane (e.g., in Figure 3 ). Labeled cells were found deep in the dorsal part of suprasylvian sulcus (sss, Figure 3 C) and also in the dorsal wall of the suprasylvian gyrus (Figure 3 C).
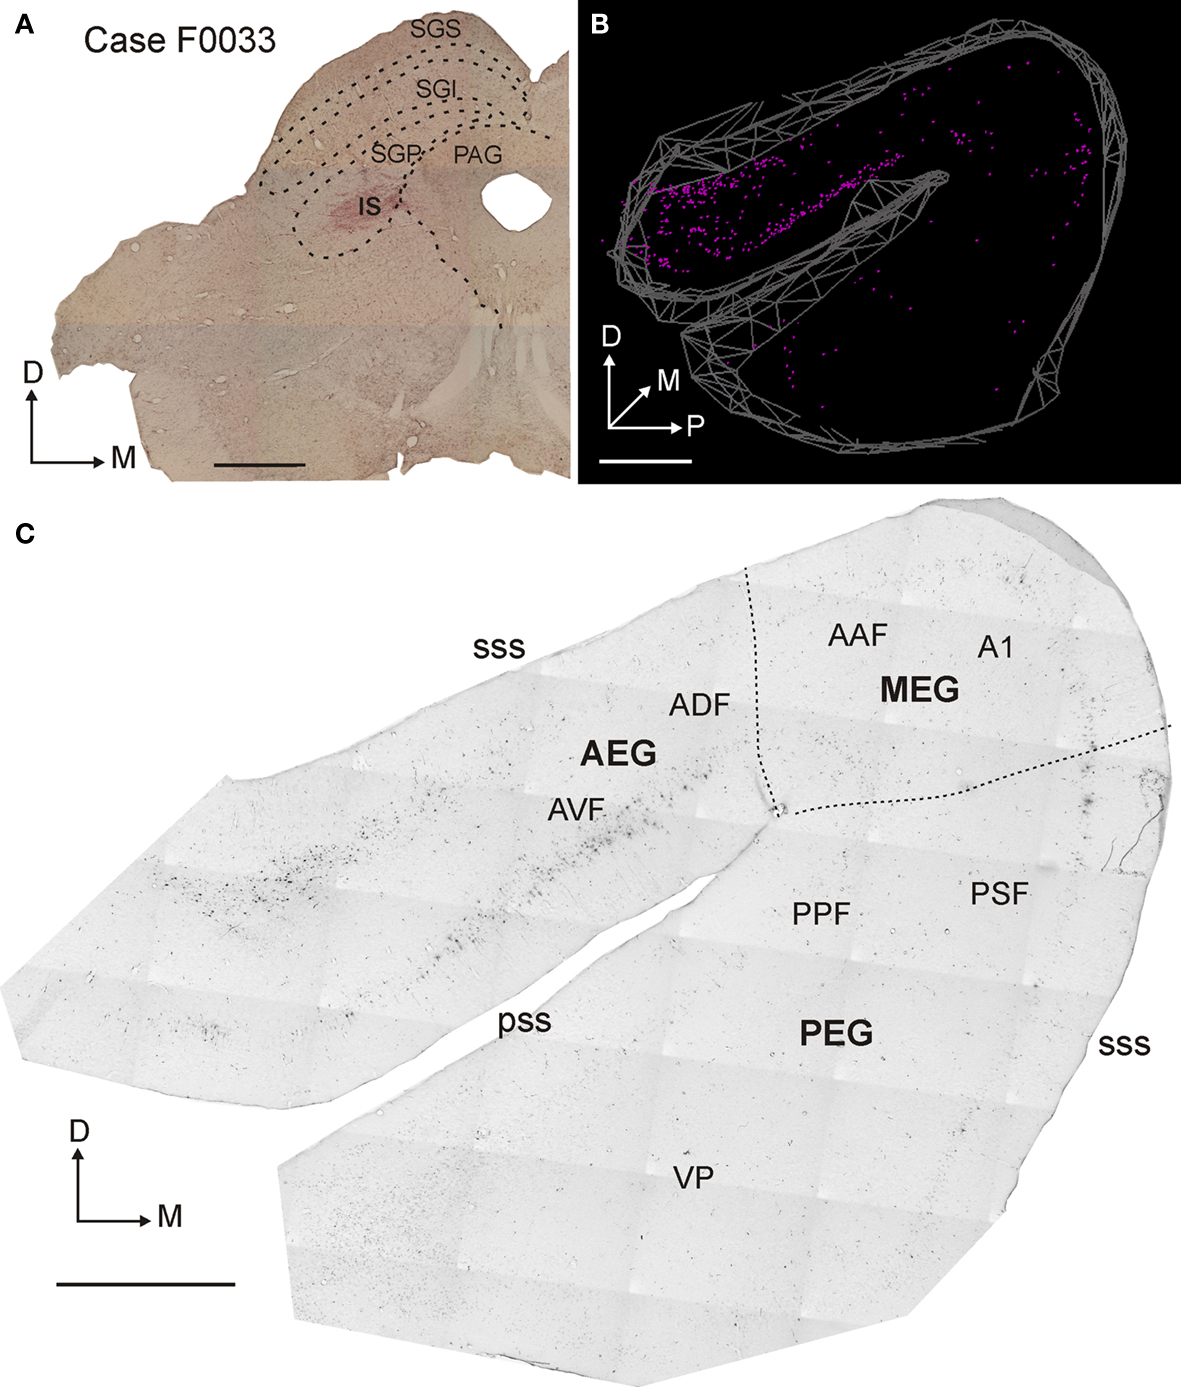
Figure 2. Distribution of retrogradely labeled cells in the auditory cortex after rhodamine (FR) injection in the superior colliculus. (A) Coronal section at the level of the left SC showing the injection site in the deep SC (SGP). (B) 3D reconstruction of auditory cortex showing the location of retrogradely labeled neurons. (C) Photomicrograph of a flattened, tangential section at the level of the ipsilateral auditory cortex. The retrogradely labeled cells are numerous, especially in the anterior part of the ectosylvian gyrus (AEG). Calibration bars are 1 mm in (A) and 2 mm in (B) and (C).
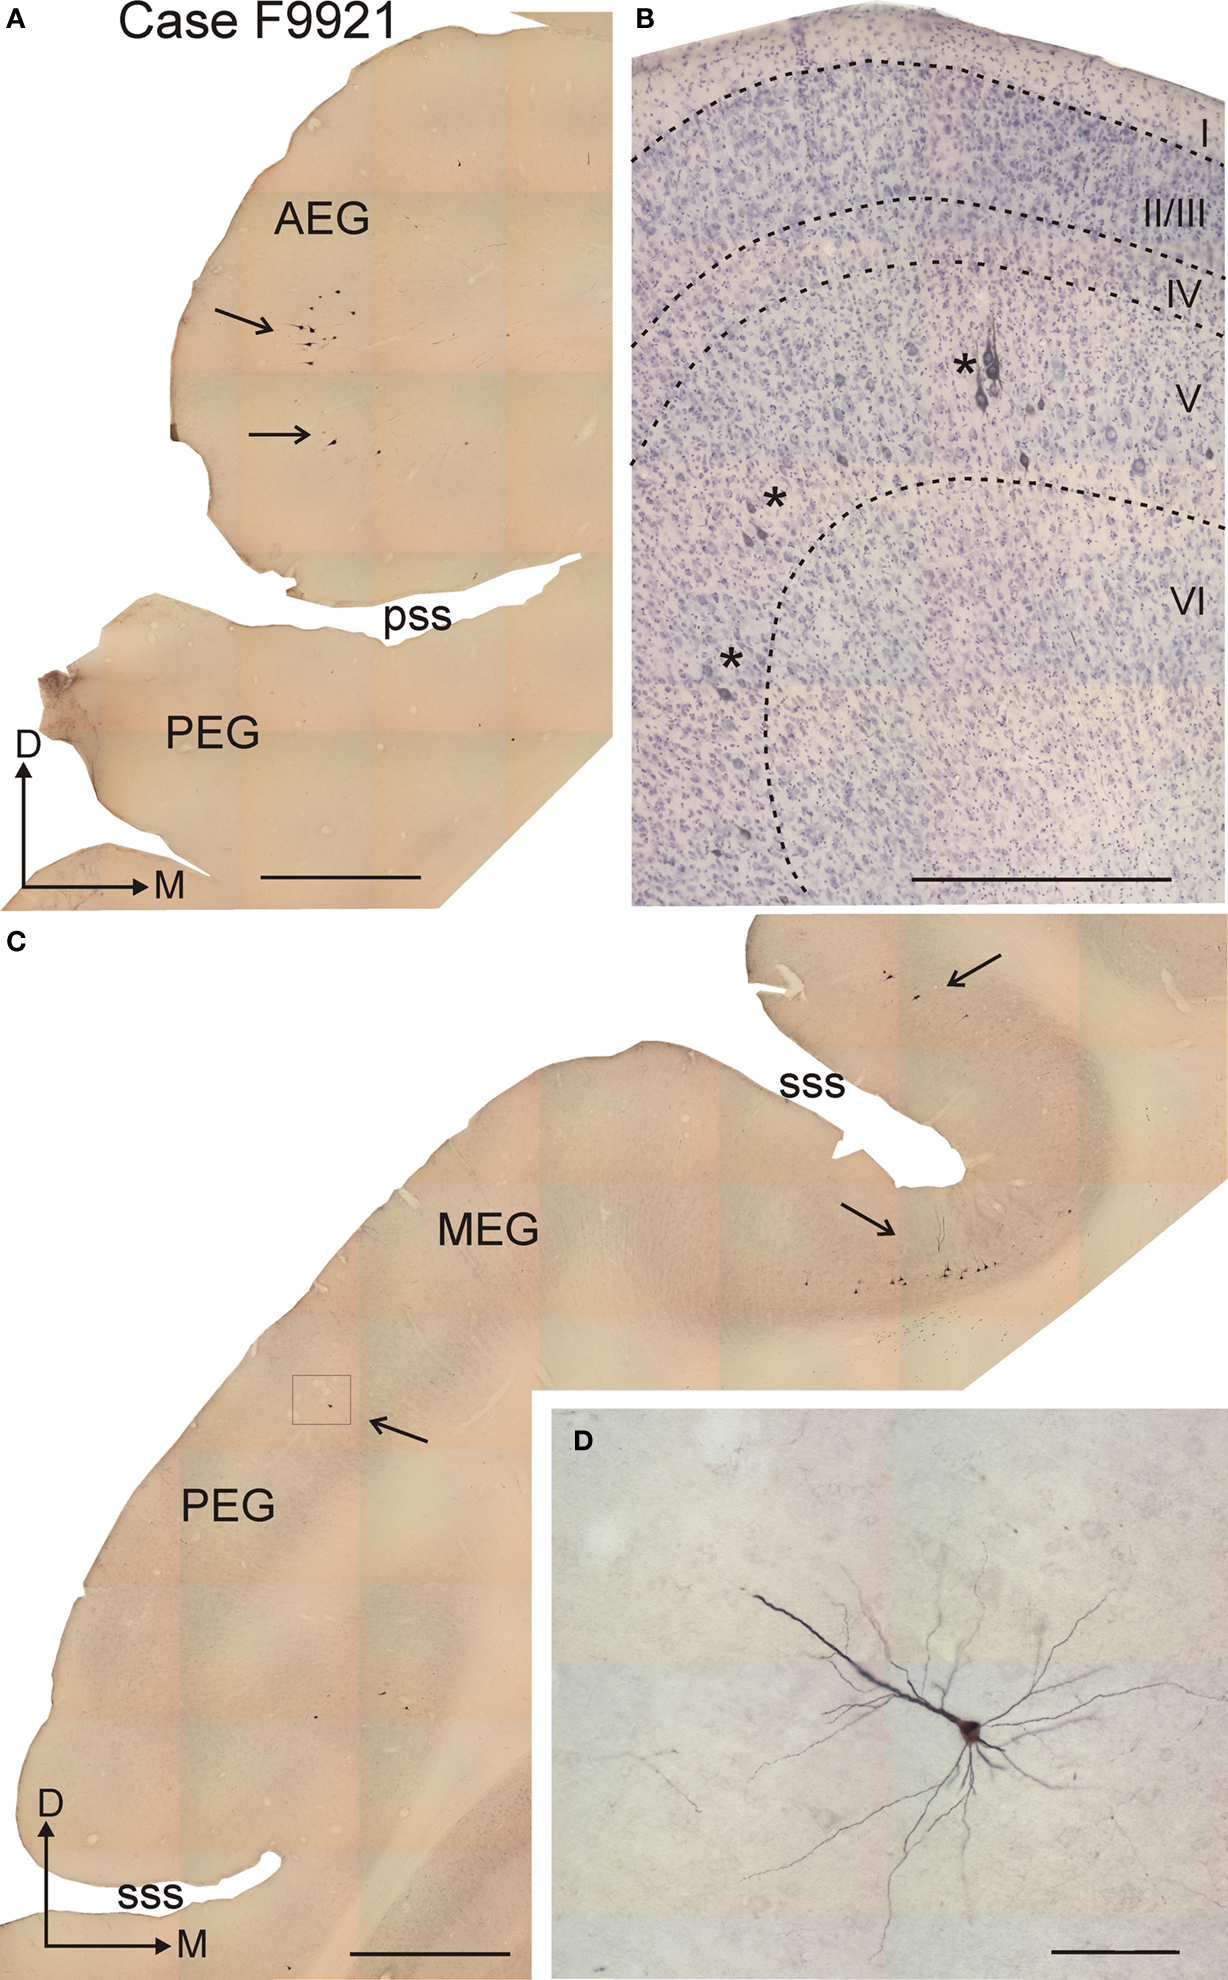
Figure 3. Morphology of retrogradely labeled corticotectal neurons in layer V after rhodamine (FR) injection in the superior colliculus. (A,C) Coronal sections at the level of the anterior and middle part of the ectosylvian gyrus, respectively, showing labeled neurons that were mainly located in the AEG (A), the deep part of the suprasylvian sulcus and the dorsal part of the PEG (arrows) (C). (B) Higher-magnification photomicrograph of a Nissl-counter-stained section at the level of the AEG; sets of two to three labeled neurons can be observed in layer V (asterisks). (D) Higher-magnification photomicrograph showing the pyramidal morphology of a labeled neuron in layer V, whose thick apical dendrite runs orthogonal to the cortical layers. This photomicrograph was taken at the location shown by the frame in (C). Calibration bars are 1 mm in (A) and (C), 0.5 mm in (B) and 0.1 mm in (D).
The cortical cells that were labeled after tracer injections in the SC were large pyramidal neurons in layer V. Labeled neurons were always located in the ventral half of the layer V, and were often observed in clustered groups of two to three neurons (Figure 3 B, asterisks). Labeled neurons had a characteristic triangular cell body, a thick apical dendrite oriented toward the pial surface and perpendicular to the cortical layers, and several basal dendrites oriented parallel to the cortical lamination (Figure 3 D).
We performed a morphometric analysis in order to explore whether labeled cells in different areas of the EG share a common morphology. To avoid bias due to the cutting plane, only the two cases with injections in the SC and cut in the coronal plane (F9921 and F9806) were analyzed. Cells were only considered if the whole cell body, as judged by the presence of the beginning of the apical dendrite or the beginning of at least two basal dendrites, was present in the same section. This selection criterion was imposed in order to avoid any bias that might result from sectioning artifacts. The size and shape of the selected cell bodies were analyzed by measuring the perimeter and form factor ( ). The mean perimeters were 64.8 ± 6.1 μm for neurons located in PEG, 67.3 ± 11.2 μm for neurons in MEG and 75.5 ± 16.6 μm for neurons in AEG, with form factors of 0.79 ± 0.07, 0.84 ± 0.05, and 0.78 ± 0.06, respectively (mean ± standard deviation). No significant differences were found either in neuronal size or shape across the different cortical regions (ANOVA, F(3,63) = 2.7, p = 0.053) suggesting that, irrespective of cortical location, a common neuronal subtype of layer V neurons forms the corticotectal projection.
The Distribution of Labeled Terminals within the Superior Colliculus Varies with Injection Site Location in the Auditory Cortex
As expected from the analysis of retrogradely labeled cells in the EG after injections in the SC, the largest number of labeled terminals were found in the SC after injections of neuronal tracer into AVF in the AEG and into PSF in the PEG. Figure 4 shows a typical example of labeling following injections into each of these two locations (Cases F0505 and F0536, Table 1 ).
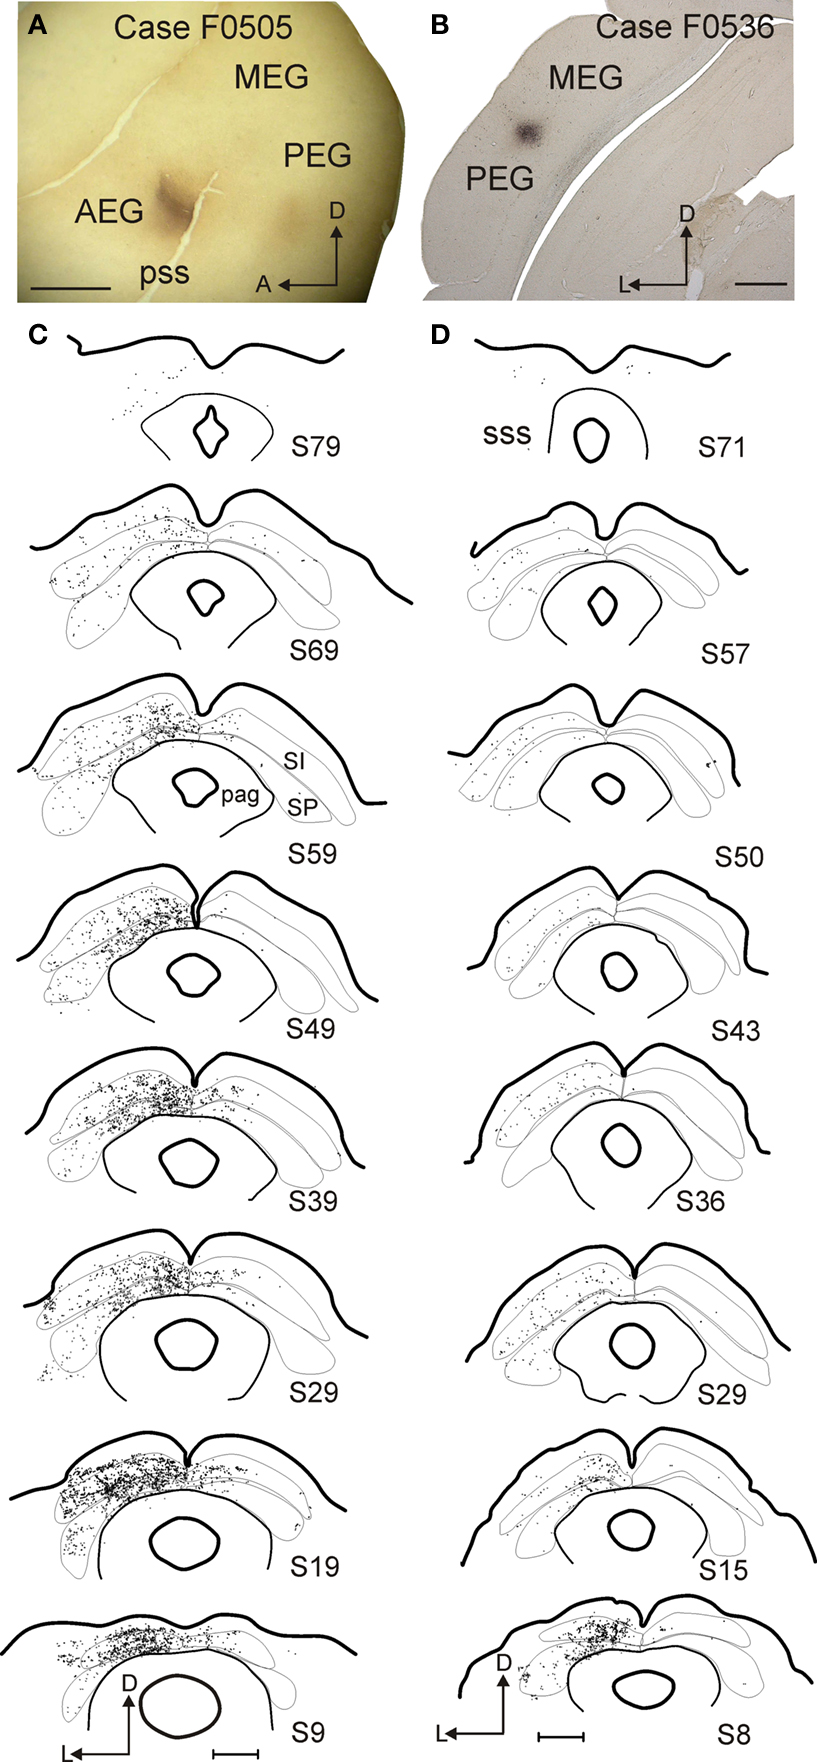
Figure 4. Examples of two cases with BDA tracer injections in the auditory cortex. (A,B) Photomicrographs showing the location of the injection sites in AVF (A, flattened tangential section) and PEG (B, coronal section). (C,D) Drawings of coronal sections at the level of the SC with each dot representing a terminal. Gray and white layers were combined for the intermediate (stratum intermediale, SI) and deep (stratum profundum, SP) SC. The number of the section in each drawing indicates its anteroposterior position, with zero indicating the most posterior corner of the SC. Calibration bars are 2 mm for (A) and 1 mm for (B–D).
Injections placed in either cortical field result in a similar pattern of labeling (Figures 4 and 5 ). Terminals were located mostly ipsilateral to the injection sites in both the intermediate and deep layers and were most numerous in the posterior-medial quadrant of the SC (Figures 4 and 6 ). Moreover, both injection locations labeled single en passant and terminal boutons in the SC as well as more complicated arrangements of terminals (Figure 7 ). There are, however, differences between the projections originating from these cortical fields; the density of terminals in the SC was larger and the pattern of terminals in the ipsilateral SGI was more patchy after injections in the AVF, whereas the SGI projection appears to be more targeted when the tracer was placed in the PSF (Figure 4 ).
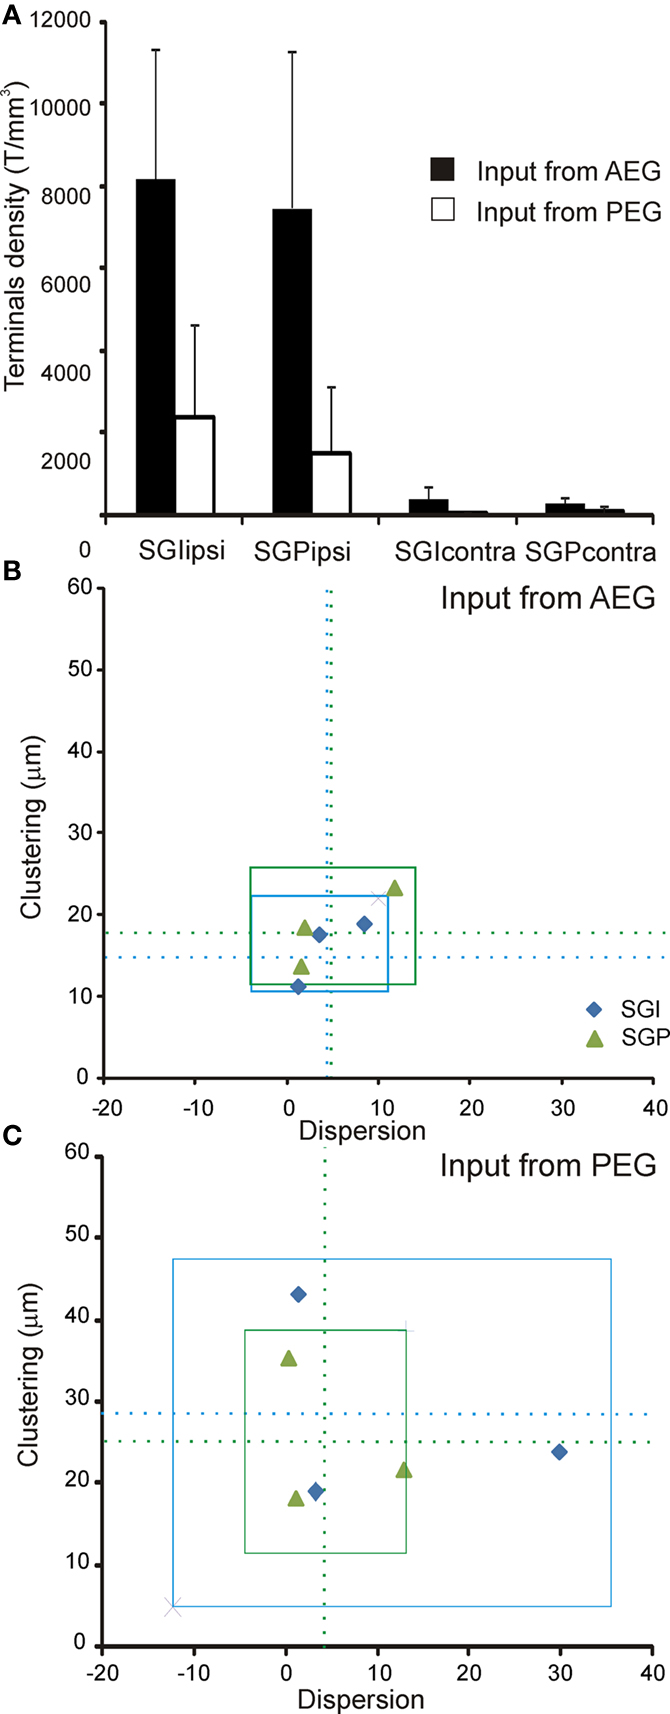
Figure 5. Quantification of the corticotectal inputs to the SC. Six cases with injection sites in the AEG (n = 3) and PEG (n = 3) were used for quantification. (A) The normalized density of terminals (see Materials and Methods for details) is plotted in different layers of the left and right SC. The projection is predominantly uncrossed with a very minor contralateral component. No differences between the intermediate and deep layers of the SC (SGI and SGP) were found. The density of terminals was higher when input came from the AEG than from the PEG, but this difference was not significant (ANOVA, F(7,23) = 1.01, p = 0.46). For each individual case, the clustering index is plotted against dispersion (measured as the ratio between the area of labeling in the SC and the area of the injection site in the cortex). These measures show that terminals from AEG (B) tend to be more clustered and less dispersed than terminals from PEG (C). Dotted lines in (B) and (C) represent the mean and the squares represent three times the standard deviation of the mean; terminals in SGI are shown in blue and terminals in SGP in green.
To quantify any differences in the projections from these two cortical regions, we measured the density, clustering index and dispersion of the labeled terminals in the SC in three animals where the injection sites were located in the AEG and in three animals where injections were located in the PEG (Table 1 , asterisks). We conservatively refer to injections centered in the AVF and PSF as being located in the AEG and PEG, respectively, because, as indicated in Table 1 , the size of the injection sites varied and, in some cases (for example F0523 and F0504), they were not restricted to those fields. However, if the tracer injection was centered in ADF (as in animal F0535 with BDA), very little labeling was found in the SC, while injection sites centered in the VP (animal F0533) resulted in virtually no SC terminal labeling. Consequently, these data indicate that AVF and PSF are the primary sources of input to the SC from ferret auditory cortex.
The density of terminals in the SC varied with the location and the size of the injection sites in the cortex (Figure 5 A). After normalizing for the size of the cortical injection site, there appeared to be clear differences in the terminal field labeling in the SC after injections into the AEG and PEG, with labeling being far denser in the former case (Figure 5 A). Whilst there appears to be a clear trend in the data, as indicated by the relative height of the histogram bars, these differences were not statistically significant (ANOVA, F(7,23) = 1.01, p = 0.46). Terminals from AEG tended to be more clustered and less dispersed than terminals from PEG, especially those ending in the SGI (Figures 5 B,C). However, only differences in clustering were significant (ANOVA, F(2,7) = 5.25, p = 0.04), with mean distances between terminals in the SGP being 18.5 ± 4.8 μm and 24.9 ± 9.2 μm after injections in the AEG and PEG, respectively. In the SGI distances between terminals were 15.9 ± 4.1 μm for AEG injections and 28.63 ± 12.8 μm for injections in PEG.
Corticotectal Terminal Distributions in the Superior Colliculus
Consistent with the region-specific pattern of retrograde labeling in the auditory cortex after SC tracer injections (Figures 2 B,C), the distribution of terminal field labeling in the SC varied with injection site location in the cortex (Figure 4 ). To quantify the distribution of terminals observed within the SC, we subdivided the SGI and SGP into four quadrants (Figure 6 ). To account for the mediolateral curvature of the SC, we determined the borders of the quadrants from the position of the centroids for each layer in each section, while the anteroposterior border was defined by dividing in two the number of coronal sections that spanned the full length of the SC.
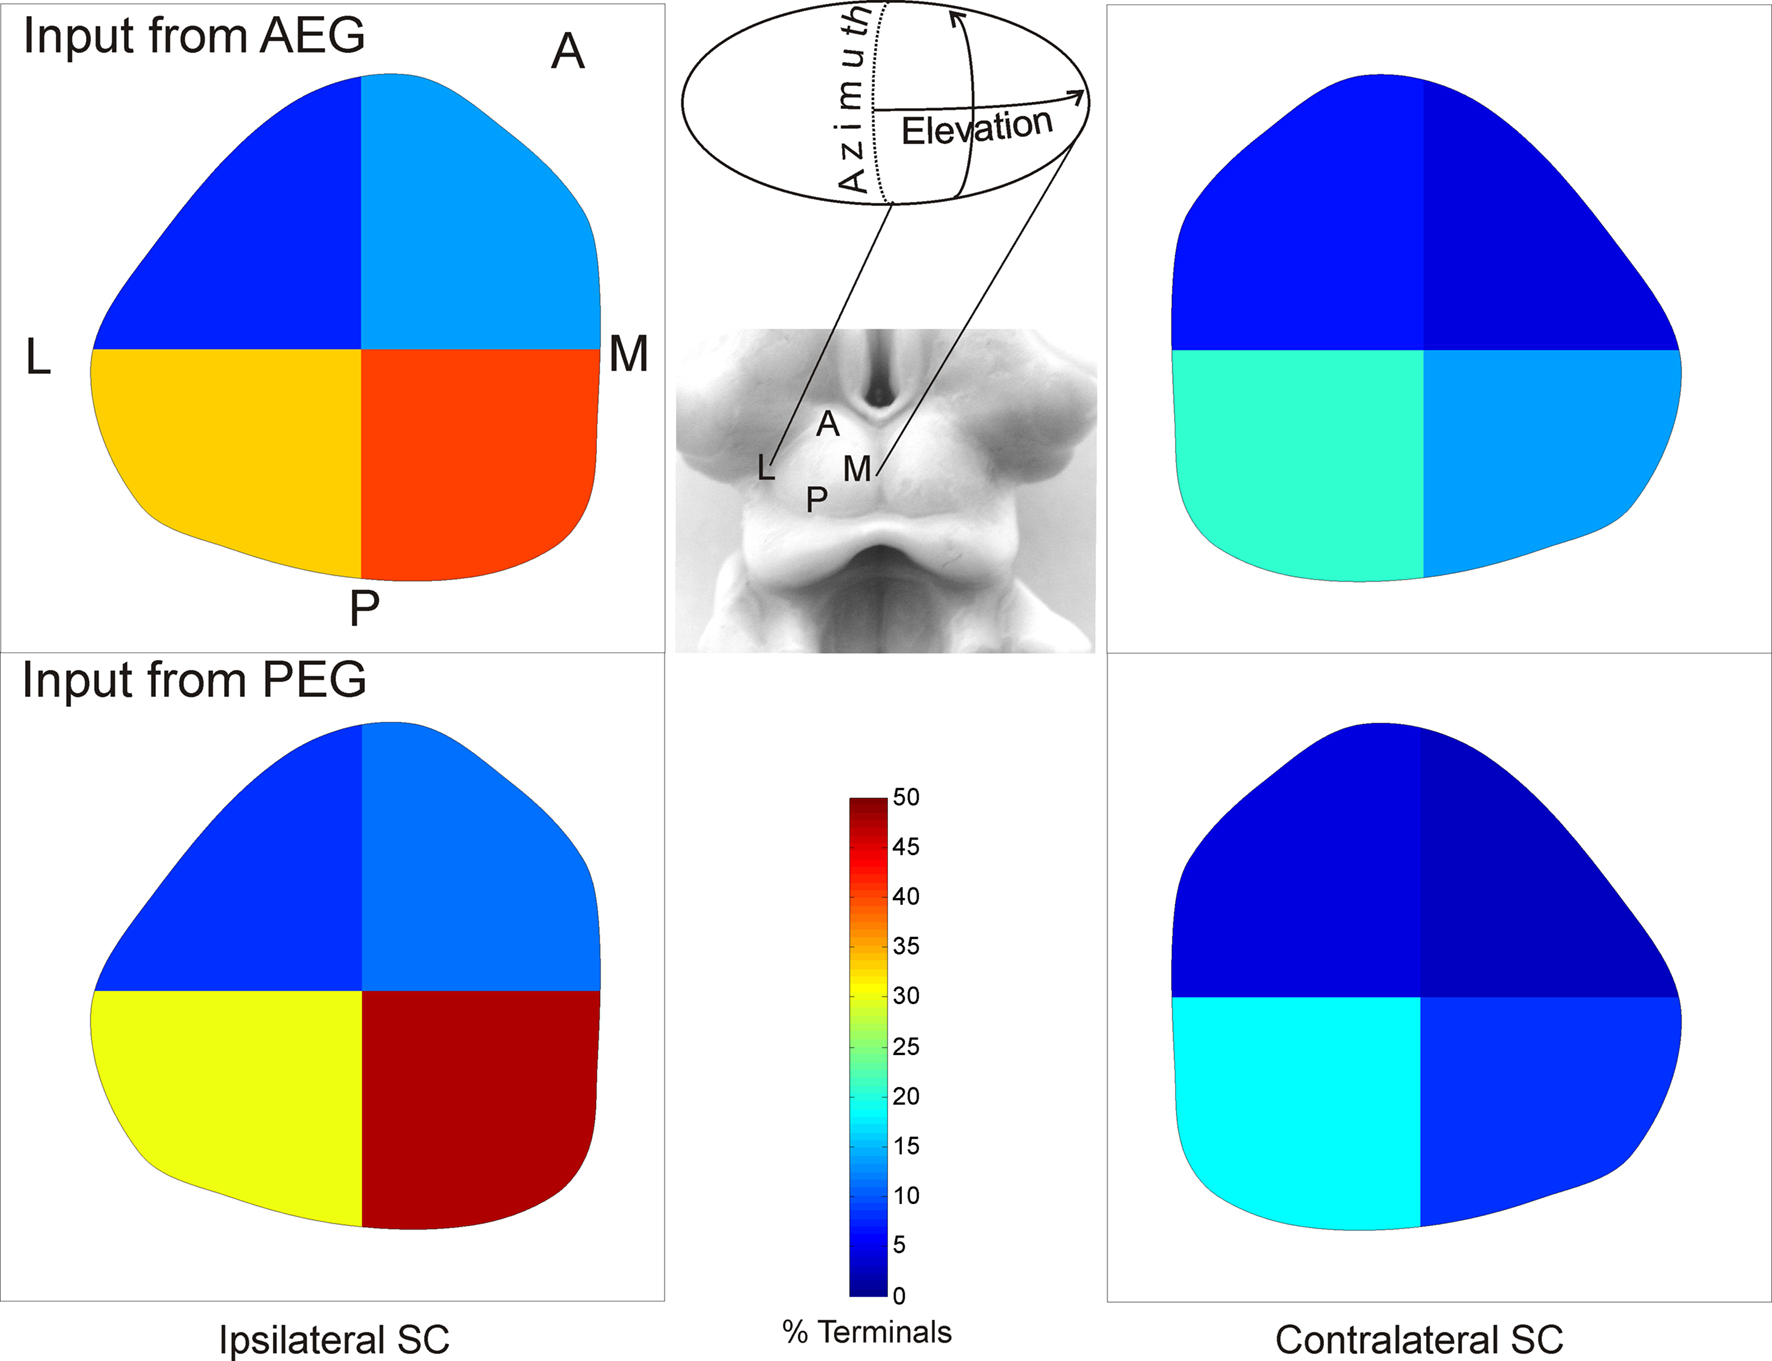
Figure 6. Distribution of cortical terminals in the SC. The proportion of terminals is plotted after dividing the SC into quadrants. The highest proportion was found in the posterior half of the SC, especially in the medial quadrant (ANOVA, F(3,3) = 9.865, p = 0.001), and no differences in this distribution were found with injection site location in the cortex (ANOVA, F(1,3) = 0.008, p = 0.93).
The quantity of labeled terminals in each quadrant was compared across animals and quadrant locations. Examination of the labeling in Figure 4 suggests that the terminals were not uniformly distributed along the mediolateral and anteroposterior dimensions of the SC. This is confirmed by the differences in the percentage of labeled terminals in each quadrant (Figure 6 ). The proportion of terminals was higher in the posterior half of the SC, and especially in the medial quadrant (ANOVA, F(3,3) = 9.865, p = 0.001). This difference was observed irrespective of the injection site location in the auditory cortex (ANOVA, F(1,3) = 0.008, p = 0.93).
Whilst the proportion of terminal labeling in the contralateral SC was much smaller, constituting only 6% of the total projection, the distribution of terminals was similar to that of the uncrossed projection, with the highest density also found in the posteromedial quadrant (Figure 6 ).
Predominance of En Passant Terminals in the Corticotectal Projection
The proportions of different terminal morphologies in the SC were measured in a single coronal section for each animal at the level where the densest terminal fields were observed. In all cases, the selected sections were located in the posterior half of the SC. Labeled terminals were classified as either en passant or end-terminal boutons, with the latter also including those described as “on short stalks” by Fuentes-Santamaria et al. (2009) . Examples of labeled fibers and terminals are shown in Figure 7 , with arrows and asterisks indicating en passant and end-terminal boutons, respectively (Figures 7 A,B,D,E). We also use the term complex terminals to differentiate those terminals with a more intricate morphology, although in our material the number of such terminals was very small (data not shown).
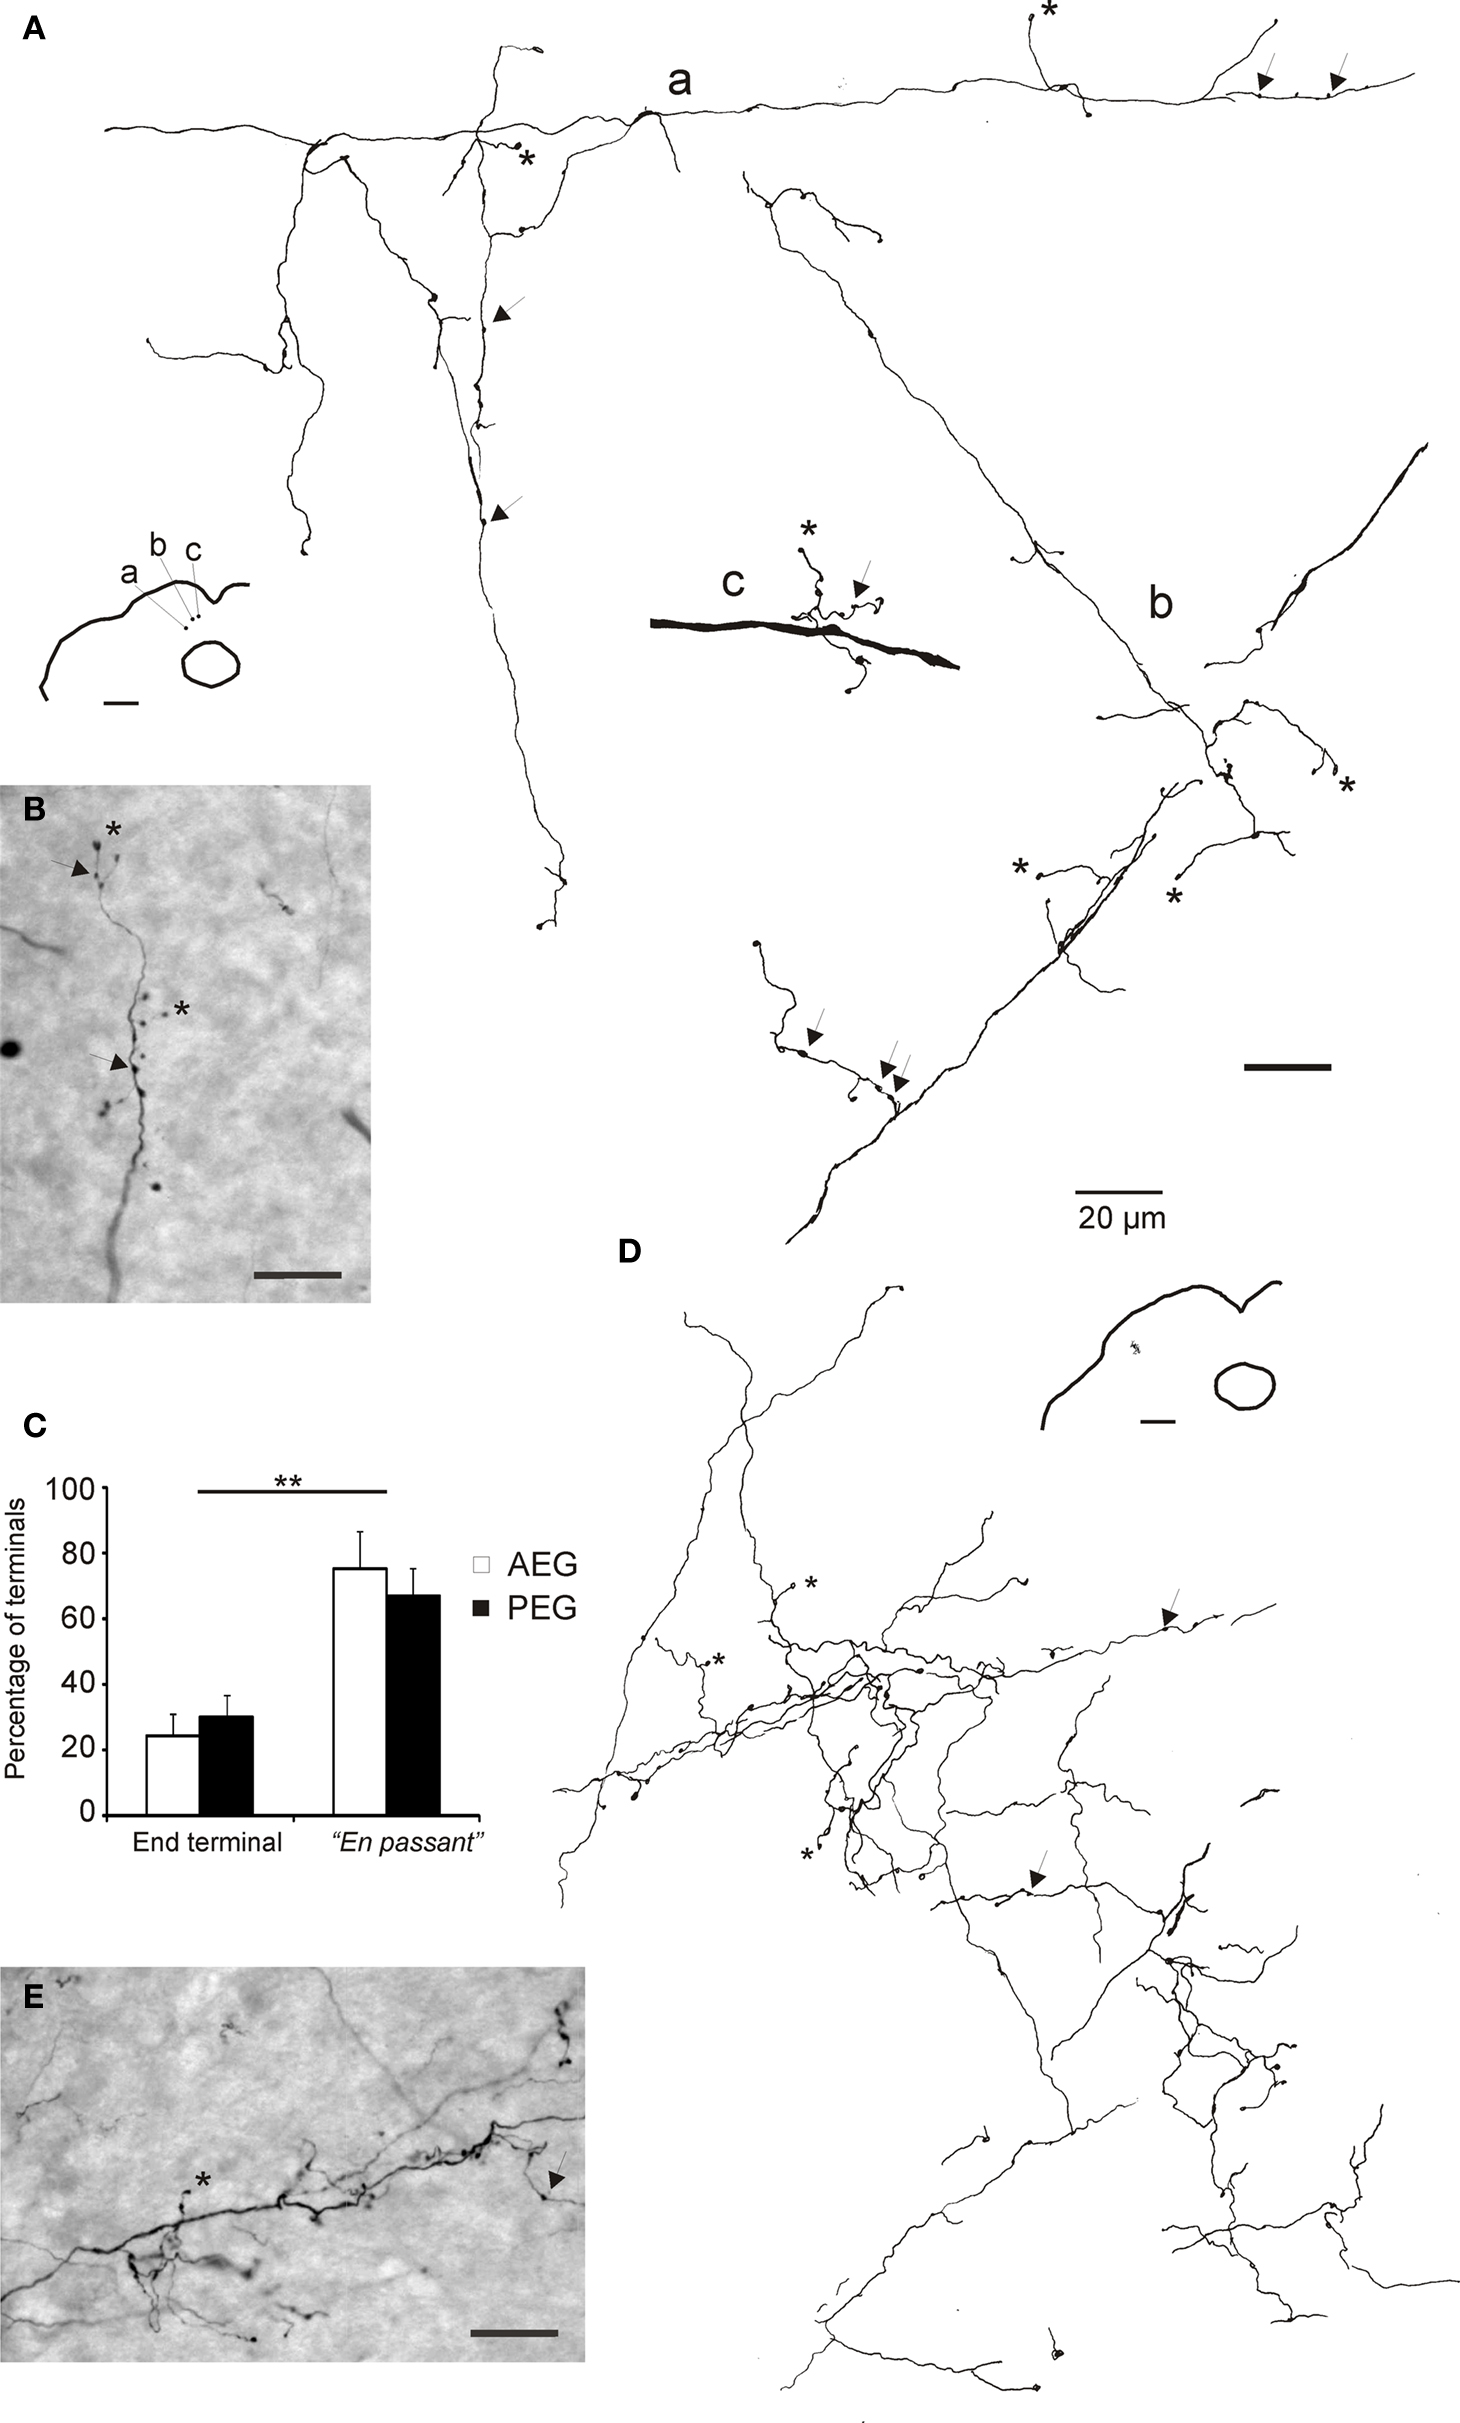
Figure 7. Morphology of terminals in the superior colliculus. Camera lucida drawings (A,D) and photomicrographs (B,E) of terminal fields in the SC after tracer injections in the AEG (A and B, case F0505) and in the PEG (D and E, case 0536). Locations of the terminal fields in the SC are shown in the lower magnification drawings. Some end-terminals are labeled with asterisks and en passant terminals with arrows. Calibration bars are 20 μm. (C) Histogram showing the percentage of the different types of terminals in the SC. En passant terminals were significantly more numerous (**p < 0.001) than the end-terminals, irrespective of the location of the injection sites in the cortex.
No differences between AEG and PEG tracer injection groups were found in the proportion of different terminal morphologies in the SC (ANOVA, F(1,11) = 0.063, p = 0.0809). In all cases, the great majority of the terminals were small en passant or end-terminal boutons (93–99%), with large or complex terminals representing only a small percentage of the total. En passant boutons were considerably more common than end-terminals, with the proportion of small boutons classified as en passant being 75.1 ± 6.7% and 66.8 ± 8.5% after injections in AEG and PEG, respectively (ANOVA F(1,11) = 75.162, p < 0.001, Figure 7 C). Both types of terminals were found along the length of the fibers running in the SC (Figure 7 B). En passant terminals were observed as round thickenings along the axons, whereas end-terminals were typically found at the end of short thin stalks that branched out from the parent axon at small intervals (Figure 7 B). The distribution of terminals along the axons did not result in a continuous and homogeneous terminal field within the SC layers. Rather, terminals appeared in clusters along the length of the axons in which both types of terminals were found (Figures 7 D,E). Additionally, orthogonal branches were observed at such terminal clusters.
Discussion
We have shown that inputs from non-primary and higher associative cortical areas, which form part of the non-lemniscal auditory cortex, converge in the intermediate and deep layers of the ferret SC. The cortical areas that contribute most to the corticotectal input are AVF, together with the tonotopically organized PSF. Large pyramidal cells located in the lower part of layer V in each of these regions are responsible for the projections to the SC. Terminals in the SC are arranged in clusters with a high number of en passant boutons. Corticotectal inputs from both AVF and PSF are most extensive in the posteromedial quadrant of the SC, where lateral and posterior stimulus locations are represented.
Corticotectal Projections in Different Species
Previous studies of corticofugal input to the SC in different species have focused mainly on inputs from different parts of the visual cortex (e.g., Swadlow and Weyand, 1981 ; Tigges and Tigges, 1981 ; Harting et al., 1992 ; Serizawa et al., 1994 ). The organization of corticotectal inputs has been studied most extensively in the cat (e.g., Harting et al., 1992 ; Fuentes-Santamaria et al., 2008 ), where their functions have also been examined at both physiological and behavioral levels by reversible inactivation (Stein, 1978 ; Clemo and Stein, 1986 ; Meredith and Clemo, 1989 ; Wallace et al., 1993 ; Jiang et al., 2002 ; Alvarado et al., 2007 ). The presence of robust inputs from AES and rLS in this species suggests that auditory, as well as other sensory, signals can reach the SC from multisensory cortical areas. In addition, there is evidence in cats for inputs to the SC from A2 as well as from multisensory areas that are designated as part of auditory cortex (Winer et al., 1998 ).
Cat AES is an area of association cortex that has been shown to project heavily to the SC and to play a particularly important role in multisensory integration (reviewed by Stein, 1998 ). It is divided into three largely unisensory regions, the anterior ectosylvian visual region (AEV) (Mucke et al., 1982 ; Olson and Graybiel, 1987 ; Scannell et al., 1996 ), the fourth somatosensory cortex (S4, Clemo and Stein, 1982 , 1983 ), and an auditory field (FAES) (Clarey and Irvine, 1986 ; Meredith and Clemo, 1989 ). Although multisensory neurons are found in cat AES, mainly at the borders of each of these areas, inputs to the SC originate from the unisensory regions (Wallace et al., 1993 ; Alvarado et al., 2009 ).
Anatomically, the ferret does not have an AES, but Ramsay and Meredith (2004) suggested that the region surrounding the pseudosylvian sulcus (pss), and named by them as pseudosylvian sulcal cortex (PSSC), might be the functional homolog of cat AES. Their proposal is based on the organization of visual and somatosensory cortical projections to the PSSC, with visual terminals being restricted to its posterior dorsal bank and somatosensory terminals having a more extensive distribution that included anterior regions of the PSSC. Ramsay and Meredith (2004) also noted that neurons responsive to auditory stimuli are found in the most posterior corner of the pss, highlighting the multisensory character of the PSSC. Manger et al. (2005) described a visually responsive area running parallel to the pss on the postero-lateral half of the ferret AEG, which also contained bisensory neurons that were segregated according to whether they responded to both visual and tactile stimulation or to visual and auditory stimulation. They called this area AEV following the terminology used for the visual part of the cat’s AES. The location of this region overlaps with the two regions on the AEG, the ADF, and AVF, which we have distinguished on the basis of the neurons’ auditory response properties (Bizley et al., 2005 ) and sensitivity to visual stimulation (Bizley et al., 2007 ; Bizley and King, 2009 ), and now in terms of their relative contributions to the corticotectal projection.
The presence of multisensory inputs to different parts of the AEG is consistent with the possibility that this part of ferret cortex includes a region homologous to cat AES. Further evidence for this possibility is provided by our finding in the present study that the AEG is the source of a robust projection to the SC. The heaviest retrograde labeling was located in the ventral and anterior part of the AEG, which includes AVF, where many neurons respond to both auditory and visual stimulation (Bizley et al., 2007 ; Bizley and King, 2009 ), as well as non-auditory areas located anterior to the AVF. Accordingly, relative to other parts of auditory cortex, tracer injections centered in the AVF resulted in the heaviest labeling in the SC. AVF receives inputs from the dorsal division of the medial geniculate body and the suprageniculate nucleus (F. R. Nodal, V. M. Bajo, J. K. Bizley, and A. J. King, unpublished observation), and we have shown that about two-thirds of the neurons recorded there respond to broadband auditory stimuli, half of which were also visually responsive (Bizley et al., 2007 ). We have not, however, found any evidence for segregation of neurons according to their modality sensitivity within the area in which retrograde labeling was found in the present study. Cat AES is organized into three distinct unisensory regions, and whilst our recordings on the gyrus of the anterior bank show intermingled modality sensitivity, further mapping within the pss, along the dorsal lip and fundus, with different sensory stimuli is required to unequivocally define in ferret an area equivalent to the cat auditory region FAES.
In the cat, tracer injections in the PEG result in anterograde labeling in the IC, as well as in neighboring structures, including the deeper layers of the SC (Winer et al., 1998 ). The projection from the PEG to the SC originates from the dorsal part of the posterior ectosylvian gyrus (EPD), and possibly also from the intermediate part (EPI), which are multisensory in nature (Bowman and Olson, 1988a ,b ). We also found that the PEG projects to the SC in the ferret, but, in this species, PSF is the source of this pathway. PSF is a tonotopically organized auditory area (Bizley et al., 2005 ), which, like other parts of auditory cortex, contains a number of visually responsive neurons (Bizley et al., 2007 ). We have previously shown that PSF receives inputs from visual areas 20a and 20b (Bizley et al., 2007 ), which are thought to be concerned with non-spatial visual processing (Manger et al., 2004 ). However, relative to the other auditory cortical fields, PSF contains a particularly large number of neurons in which the presence of a spatially-coincident visual stimulus increases the amount of location-related information they convey compared to their responses to sound alone (Bizley and King, 2009 ).
We also observed inputs to the SC from deep sulcal regions surrounding the MEG. In the ferret, the cortical region within the dorsal edge of the suprasylvian sulcus at the level of the primary auditory fields appears to be equivalent to the anteromedial lateral suprasylvian visual area (AMLS) in the cat (Manger et al., 2008 ). The lateral or ventral edge of this sulcus has been referred to as a putative anterolateral lateral suprasylvian area (ALLS; Manger et al., 2008) , but might also be equivalent to cat DZ, which projects to the SC (Winer et al., 1998 ). AMLS and the neighboring posteromedial suprasylvian visual area (PMLS, also termed the suprasylvian visual area or posterior suprasylvian area), have been implicated in visual motion (Cantone et al., 2006 ; Philipp et al., 2006 ; Manger et al., 2008 ), whereas DZ plays an important role in auditory spatial processing (Stecker et al., 2005 ). Although speculative at this time, since these sulcal areas in the ferret cortex require further anatomical and physiological investigation and their auditory and/or multisensory properties have yet to be established, the presence of a descending projection to the SC implies that this part of the cortex participates in orienting behaviors and multisensory integration.
Together, these data indicate that there are similarities between cats and ferrets in the organization of their auditory corticotectal projections, with an anterior multisensory region dominating this pathway in both cases. However, the additional projection from the PSF, as well as the concentration of corticotectal terminals in the most posteromedial quadrant of the SC in the ferret compared to the more lateral distribution in the cat (Meredith and Clemo, 1989 ), indicate that some differences exist between these species.
Role of Corticotectal Input in Modulating Auditory Orienting Behaviors
In cats, cortical deactivation of A1 (including DZ), PAF and FAES all result in sound localization deficits in the contralateral hemifield (Malhotra et al., 2004 ; Malhotra and Lomber, 2007 ). Lomber et al. (2007a) proposed that neurons in the superficial layers of A1, DZ, and PAF feed forward to AES and that neurons in AES are responsible for transmitting spatial information to the SC. While there is no doubt that AVF in the ferret auditory cortex provides the largest corticotectal projection, our results show that PSF also projects directly to the SC. Thus, parallel routes may exist for conveying signals to the SC that are important for orientation behaviors.
Deficits in auditory localization behavior have been observed following damage to or inactivation of both the auditory cortex (e.g., Jenkins and Merzenich, 1984 ; Kavanagh and Kelly, 1987 ; Heffner and Heffner, 1990 ; Nodal et al., 2010 ) and the SC (Tunkl, 1980 ; Lomber et al., 2001 ). However, it seems likely that different aspects of spatial hearing are mediated by these different brain regions. Thus, Nodal et al. (2010) found that bilateral lesions of A1 impair the localization of brief sounds in ferrets when the animals have to approach the sound source in order to receive a reward, whereas their ability to orient toward the appropriate region of space is unaffected. Deficits in acoustic orientation behavior were observed, however, if the lesions covered a more extensive region of auditory cortex, including the areas shown here to project to the SC. In keeping with this, it has been proposed that the head orienting deficits produced by cortical lesions in cats might reflect a loss of descending corticofugal neurons (Thompson and Masterton, 1978 ; Beitel and Kaas, 1993 ). Further evidence for a complex relationship between the cortex and the SC in the control of auditory localization behavior has been provided by the “auditory Sprague effect,” whereby the contralateral deficits produced in cats by unilateral ablation of the auditory cortex disappear if the contralesional SC is then deactivated (Lomber et al., 2007b ). While the circuitry responsible for this recovery of function is unknown, it is possible that activity in the other SC is increased as a result of the loss of inhibition provided by the crossed nigro-collicular connection (Wallace et al., 1990 ) or by the commissural inputs from the inactivated SC (Behan, 1985 ; Jiang et al., 1997 ). It is also conceivable that the small crossed component of the corticotectal projection here described could be involved.
Multisensory Integration in the SC and Corticotectal Input
Inputs from the cortex are essential for multisensory integration in the SC of the cat (Stein, 1998 ). However, unisensory areas in different parts of AES project to the SC in this species (Wallace et al., 1993 ), and it is their convergence onto individual SC neurons that appears to synergistically create multisensory enhancement or depression depending on the proximity of stimuli in different sensory modalities (Alvarado et al., 2007 , 2009 ). Axons conveying modality-specific information have been shown to terminate on the same SMI32-positive SC projection neurons (Fuentes-Santamaria et al., 2009 ), but no differences in their terminal distribution across the SC have been reported.
Our results show that descending inputs from different parts of auditory cortex predominantly target the posterior half of the SC, where peripheral stimulus locations are represented. The influence of these cortical neurons on SC responses is therefore likely to be greatest for this region of space, where, because auditory receptive fields tend to extend beyond visual receptive fields (King and Hutchings, 1987 ), acoustic cues may be more relevant in guiding orienting behaviors. Although we showed that acoustically responsive neurons were present at each injection site in the cortex, we cannot, of course, rule out the possibility that the labeled axons convey non-auditory signals as well. This applies particularly to AVF, where the neurons recorded by Bizley et al. (2007) were equally likely to be unisensory visual, unisensory auditory or sensitive to both modalities. Identifying the modality specificity of individual corticotectal neurons would require the use of intracellular recording and tracer injection techniques. The significance for multisensory processing of the non-uniform innervation of the SC by these higher levels areas of the auditory cortex is unclear, but it is interesting to note that, in cats, the influence of a spatially discordant auditory stimulus on the accuracy of visual localization varies with stimulus eccentricity (Jiang et al., 2002 ).
Multisensory integration is a particularly prominent feature of the intermediate layers of the SC, where a patchy or honeycomb-like pattern of acetylcholinesterase staining aligns with some of the afferent and efferent connections of this region (Chevalier and Mana, 2000 ; Mana and Chevalier, 2001 ). We also saw some evidence for a patchy distribution of auditory corticotectal inputs in the SGI. This pattern of terminal labeling was not always observed, however, although that may reflect the sectioning plane used and the restricted size of the tracer injections in the cortex. It remains to be seen whether a similar modular arrangement of inputs is found for inputs from auditory subcortical structures (King et al., 1998 ; Nodal et al., 2005 ), or how this relates to the organization of afferent connections for other sensory modalities.
Concluding Remarks and Future Directions
Previous work on the auditory corticotectal pathway in the cat has been based on the assumption that only FAES provides a direct input to the SC, and that any involvement of other auditory fields would be mediated through AES via cortico-cortical connections (Lomber et al., 2007a ). The present results in the ferret show the direct contribution not only of AVF and adjoining regions on the anterior bank of the EG, but also of both the PSF on the posterior bank and of sulcal regions surrounding the primary areas on the MEG. Thus, the corticotectal projection should be seen as a convergence of information from different cortical areas, most likely conveying multisensory rather than exclusively auditory information, which are all likely to be involved in modulating orientation behavior via their inputs to the SC. In accordance with this, it has been shown that inactivation of the SC or the combined inactivation of multiple regions of auditory cortex has a far more profound impairment on orienting behavior than inactivation of any individual cortical area (Malhotra et al., 2004 ). In order to distinguish the role of direct corticotectal input from cortico-cortical circuits, it will be necessary to test the behavioral consequences of selectively inactivating specific descending pathways, as we have done for the projection from A1 to the IC (Bajo et al., 2010 ), whilst leaving intact the neurons in other cortical areas.
Elimination of the descending projection from A1 to the IC impairs learning-induced auditory plasticity in adult ferrets, without having any effect on the accuracy of sound localization behavior in the presence of normal acoustic inputs (Bajo et al., 2010 ). On the basis of the present results and the orienting deficits produced by large lesions of the auditory cortex (Nodal et al., 2010 ), we would predict that the loss of descending projections to the SC will disrupt acoustic orientation behavior. A recent study in monkeys has found that inactivation of the SC impairs the selection of which signals to use for a visual motion discrimination task, implying a role in making perceptual judgments (Lovejoy and Krauzlis, 2010 ), a function that is normally thought to be the preserve of the cerebral cortex. This may highlight another role of descending corticofugal projections to the SC. Similarly, the capacity of adult SC neurons to adjust their response properties following repeated exposure to particular visual–auditory cue combinations (Yu et al., 2009 ) may rely on descending modulatory influences. In each case, the selective inactivation of appropriate corticofugal pathways will help to identify the neural circuitry involved.
Conflict of Interest Statement
The authors declare that the research was conducted in the absence of any commercial or financial relationship that could be construed as a potential conflict of interest.
Acknowledgment
This work was supported by the Wellcome Trust through a Principal Research Fellowship to Andrew J. King (WT076508AIA).
References
Adams, J. C. (1981). Heavy metal intensification of DAB-based HRP reaction product. J. Histochem. Cytochem. 29, 775.
Allman, B. L., Keniston, L. P., and Meredith, M. A. (2009). Adult deafness induces somatosensory conversion of ferret auditory cortex. Proc. Natl. Acad. Sci. U.S.A. 106, 5925–5930.
Alvarado, J. C., Stanford, T. R., Rowland, B. A., Vaughan, J. W., and Stein, B. E. (2009). Multisensory integration in the superior colliculus requires synergy among corticocollicular inputs. J. Neurosci. 29, 6580–6592.
Alvarado, J. C., Stanford, T. R., Vaughan, J. W., and Stein, B. E. (2007). Cortex mediates multisensory but not unisensory integration in superior colliculus. J. Neurosci. 27, 12775–12786.
Bajo, V. M., Nodal, F. R., Bizley, J. K., Moore, D. R., and King, A. J. (2007). The ferret auditory cortex: descending projections to the inferior colliculus. Cereb. Cortex 17, 475–491.
Bajo, V. M., Nodal, F. R., Moore, D. R., and King, A. J. (2010). The descending corticocollicular pathway mediates learning-induced auditory plasticity. Nat. Neurosci. 13, 253–260.
Behan, M. (1985). An EM-autoradiographic and EM-HRP study of the commissural projection of the superior colliculus in the cat. J. Comp. Neurol. 234, 105–116.
Beitel, R. E., and Kaas, J. H. (1993). Effects of bilateral and unilateral ablation of auditory cortex in cats on the unconditioned head orienting response to acoustic stimuli. J. Neurophysiol. 70, 351–369.
Binns, K. E., Grant, S., Withington, D. J., and Keating, M. J. (1992). A topographic representation of auditory space in the external nucleus of the inferior colliculus of the guinea-pig. Brain Res. 589, 231–242.
Bizley, J. K., and King, A. J. (2009). Visual influences on ferret auditory cortex. Hear. Res. 258, 55–63.
Bizley, J. K., Nodal, F. R., Bajo, V. M., Nelken, I., and King, A. J. (2007). Physiological and anatomical evidence for multisensory interactions in auditory cortex. Cereb. Cortex 17, 2172–2189.
Bizley, J. K., Nodal, F. R., Nelken, I., and King, A. J. (2005). Functional organization of ferret auditory cortex. Cereb. Cortex 15, 1637–1653.
Bowman, E. M., and Olson, C. R. (1988a). Visual and auditory association areas of the cat’s posterior ectosylvian gyrus: thalamic afferents. J. Comp. Neurol. 272, 15–29.
Bowman, E. M., and Olson, C. R. (1988b). Visual and auditory association areas of the cat’s posterior ectosylvian gyrus: cortical afferents. J. Comp. Neurol. 272, 30–42.
Burnett, L. R., Stein, B. E., Chaponis, D., and Wallace, M. T. (2004). Superior colliculus lesions preferentially disrupt multisensory orientation. Neuroscience 124, 535–547.
Cantone, G., Xiao, J., and Levitt, J. B. (2006). Retinotopic organization of ferret suprasylvian cortex. Vis. Neurosci. 23, 61–77.
Chevalier, G., and Mana, S. (2000). Honeycomb-like structure of the intermediate layers of the rat superior colliculus, with additional observations in several other mammals: AChE patterning. J. Comp. Neurol. 419,137–153.
Clarey, J. C., and Irvine, D. R. (1986). Auditory response properties of neurons in the anterior ectosylvian sulcus of the cat. Brain Res. 386, 12–19.
Clemo, H. R., and Stein, B. E. (1982). Somatosensory cortex: a ‘new’ somatotopic representation. Brain Res. 235, 162–168.
Clemo, H. R., and Stein, B. E. (1983). Organization of a fourth somatosensory area of cortex in cat. J. Neurophysiol. 50, 910–925.
Clemo, H. R., and Stein, B. E. (1986). Effects of cooling somatosensory cortex on response properties of tactile cells in the superior colliculus. J. Neurophysiol. 55, 1342–1368.
Diamond, I. T., Jones, E. G., and Powell, T. P. (1969). The projection of the auditory cortex upon the diencephalons and brain stem in the cat. Brain Res. 15, 305–340.
Fritz, J., Shamma, S., Elhilali, M., and Klein, D. (2003). Rapid task-related plasticity of spectrotemporal receptive fields in primary auditory cortex. Nat. Neurosci. 6, 1216–1223.
Fuentes-Santamaria, V., Alvarado, J. C., McHaffie, J. G., and Stein, B. E. (2009). Axon morphologies and convergence patterns of projections from different sensory-specific cortices of the anterior ectosylvian sulcus onto multisensory neurons in the cat superior colliculus. Cereb. Cortex 19, 2902–2915.
Fuentes-Santamaria, V., Alvarado, J. C., Stein, B. E., and McHaffie, J. G. (2008). Cortex contacts both output neurons and nitrergic interneurons in the superior colliculus: direct and indirect routes for multisensory integration. Cereb. Cortex 18, 1640–1652.
Harting, J. K., Updyke, B. V., and van Lieshout, D. P. (1992). Corticotectal projections in the cat: anterograde transport studies of twenty-five cortical areas. J. Comp. Neurol. 324, 379–414.
Heffner, H. E., and Heffner, R. S. (1990). Effect of bilateral auditory cortex lesions on sound localization in Japanese macaques. J. Neurophysiol. 64, 915–931.
Jenkins, W. M., and Merzenich, M. M. (1984). Role of cat primary auditory cortex for sound-localization behavior. J. Neurophysiol. 52, 819–847.
Jiang, W., Jiang, H., and Stein, B. E. (2002). Two cortical areas facilitate multisensory orientation behavior. J. Cogn. Neurosci. 14, 1240–1255.
Jiang, W., Wallace, M. T., Jiang, H., Vaughan, J. W., and Stein, B. E. (2001). Two cortical areas mediate multisensory integration in superior colliculus neurons. J. Neurophysiol. 85, 506–522.
Jiang, Z. D., Moore, D. R., and King, A. J. (1997). Sources of subcortical projections to the superior colliculus in the ferret. Brain Res. 755, 279–292.
Kacelnik, O., Nodal, F. R., Parsons, C. H., and King, A. J. (2006). Training-induced plasticity of auditory localization in adult mammals. PLoS Biol. 4, e71. doi:10.1371/journal.pbio.0040071
Kanaseki, T., and Sprague, J. M. (1974). Anatomical organization of pretectal nuclei and tectal laminae in the cat. J. Comp. Neurol. 158, 319–337.
Kavanagh, G. L., and Kelly, J. B. (1987). Contribution of auditory cortex to sound localization by the ferret (Mustela putorius). J. Neurophysiol. 57, 1746–1766.
Kelly, J. B., Judge, P. W., and Phillips, D. P. (1986). Representation of the cochlea in primary auditory cortex of the ferret (Mustela putorius). Hear. Res. 24, 111–115.
King, A. J. (1993). The Wellcome Prize Lecture. A map of auditory space in the mammalian brain: neural computation and development. Exp. Physiol. 78, 559–590.
King, A. J., and Hutchings, M. E. (1987). Spatial response properties of acoustically responsive neurons in the superior colliculus of the ferret: a map of auditory space. J. Neurophysiol. 57, 596–624.
King, A. J., Jiang, Z. D., and Moore, D. R. (1998). Auditory brainstem projections to the ferret superior colliculus: anatomical contribution to the neural coding of sound azimuth. J. Comp. Neurol. 390, 342–365.
Kowalski, N., Versnel, H., and Shamma, S. A. (1995). Comparison of responses in the anterior and primary auditory fields of the ferret cortex. J. Neurophysiol. 73, 1513–1523.
Lomber, S. G., and Malhotra, S. (2008). Double dissociation of ‘what’ and ‘where’ processing in auditory cortex. Nat. Neurosci. 11, 609–616.
Lomber, S. G., Malhotra, S., and Hall, A. J. (2007a). Functional specialization in non-primary auditory cortex of the cat: areal and laminar contributions to sound localization. Hear. Res. 229, 31–45.
Lomber, S. G., Malhotra, S., and Sprague, J. M. (2007b). Restoration of acoustic orienting into a cortically deaf hemifield by reversible deactivation of the contralesional superior colliculus: the acoustic “Sprague Effect.” J. Neurophysiol. 97, 979–993.
Lomber, S. G., Payne, B. R., and Cornwell, P. (2001). Role of the superior colliculus in analyses of space: superficial and intermediate layer contributions to visual orienting, auditory orienting, and visuospatial discriminations during unilateral and bilateral deactivations. J. Comp. Neurol. 441, 44–57.
Lovejoy, L. P., and Krauzlis, R. J. (2010). Inactivation of primate superior colliculus impairs covert selection of signals for perceptual judgments. Nat. Neurosci. 13, 261–266.
Malhotra, S., Hall, A. J., and Lomber, S. G. (2004). Cortical control of sound localization in the cat: unilateral cooling deactivation of 19 cerebral areas. J. Neurophysiol. 92, 1625–1643.
Malhotra, S., and Lomber, S. G. (2007). Sound localization during homotopic and heterotopic bilateral cooling deactivation of primary and nonprimary auditory cortical areas in the cat. J. Neurophysiol. 97, 26–43.
Mana, S., and Chevalier, G. (2001). Honeycomb-like structure of the intermediate layers of the rat superior colliculus: afferent and efferent connections. Neuroscience 103, 673–693.
Manger, P. R., Engler, G., Moll, C. K., and Engel, A. K. (2005). The anterior ectosylvian visual area of the ferret: a homologue for an enigmatic visual cortical area of the cat? Eur. J. Neurosci. 22, 706–714.
Manger, P. R., Engler, G., Moll, C. K., and Engel, A. K. (2008). Location, architecture, and retinotopy of the anteromedial lateral suprasylvian visual area (AMLS) of the ferret (Mustela putorius). Vis. Neurosci. 25, 27–37.
Manger, P. R., Nakamura, H., Valentiniene, S., and Innocenti, G. M. (2004). Visual areas in the lateral temporal cortex of the ferret (Mustela putorius). Cereb. Cortex 14, 676–689.
Meredith, M. A., and Clemo, H. R. (1989). Auditory cortical projection from the anterior ectosylvian sulcus (Field AES) to the superior colliculus in the cat: an anatomical and electrophysiological study. J. Comp. Neurol. 289, 687–707.
Meredith, M. A., Miller, L. K., Ramoa, A. S., Clemo, H. R., and Behan, M. (2001). Organization of the neurons of origin of the descending pathways from the ferret superior colliculus. Neurosci. Res. 40, 301–313.
Middlebrooks, J. C., and Knudsen, E. I. (1984). A neural code for auditory space in the cat’s superior colliculus. J. Neurosci. 4, 2621–2634.
Mucke, L., Norita, M., Benedek, G., and Creutzfeldt, O. (1982). Physiologic and anatomic investigation of a visual cortical area situated in the ventral bank of the anterior ectosylvian sulcus of the cat. Exp. Brain Res. 46, 1–11.
Nelken, I., Bizley, J. K., Nodal, F. R., Ahmed, B., Schnupp, J. W., and King, A. J. (2004). Large-scale organization of ferret auditory cortex revealed using continuous acquisition of intrinsic optical signals. J. Neurophysiol. 92, 2574–2588.
Nodal, F. R., Doubell, T. P., Jiang, Z. D., Thompson, I. D., and King, A. J. (2005). Development of the projection from the nucleus of the brachium of the inferior colliculus to the superior colliculus in the ferret. J. Comp. Neurol. 485, 202–217.
Nodal, F. R., Kacelnik, O., Bajo, V. M., Bizley, J. K., Moore, D. R., and King, A. J. (2010). Lesions of the auditory cortex impair azimuthal sound localization and its recalibration in ferrets. J. Neurophysiol. 103, 1209–1225.
Olson, C. R., and Graybiel, A. M. (1987). Ectosylvian visual area of the cat: location, retinotopic organization, and connections. J. Comp. Neurol. 261, 277–294.
Pallas, S. L., and Sur, M. (1993). Visual projections induced into the auditory pathway of ferrets: II. Corticocortical connections of primary auditory cortex. J. Comp. Neurol. 337, 317–333.
Palmer, A. R., and King, A. J. (1982). The representation of auditory space in the mammalian superior colliculus. Nature 299, 248–249.
Philipp, R., Distler, C., and Hoffmann, K. P. (2006). A motion-sensitive area in ferret extrastriate visual cortex: an analysis in pigmented and albino animals. Cereb. Cortex 16, 779–790.
Ramsay, A. M., and Meredith, M. A. (2004). Multiple sensory afferents to ferret pseudosylviansulcal cortex. Neuroreport 15, 461–465.
Scannell, J. W., Sengpiel, F., Tovée, M. J., Benson, P. J., Blakemore, C., and Young, M. P. (1996). Visual motion processing in the anterior ectosylvian sulcus of the cat. J. Neurophysiol. 76, 895–907.
Schnupp, J. W. H., and King, A. J. (1997). Coding for auditory space in the nucleus of the brachium of the inferior colliculus in the ferret. J. Neurophysiol. 78, 2717–2731.
Serizawa, M., McHaffie, J. G., Hoshino, K., and Norita, M. (1994). Corticostriatal and corticotectal projections from visual cortical areas 17, 18 and 18a in the pigmented rat. Arch. Histol. Cytol. 57, 493–507.
Sprague, J. M., and Meikle, Th. Jr. (1965). The role of the superior colliculus in visually guided behavior. Exp. Neurol. 11, 115–146.
Stecker, G. C., Harrington, I. A., Macpherson, E. A., and Middlebrooks, J. C. (2005). Spatial sensitivity in the dorsal zone (area DZ) of cat auditory cortex. J. Neurophysiol. 94, 1267–1280.
Stein, B. E. (1978). Nonequivalent visual, auditory, and somatic corticotectal influences in cat. J. Neurophysiol. 41, 55–64.
Stein, B. E. (1998). Neural mechanisms for synthesizing sensory information and producing adaptive behaviors. Exp. Brain Res. 123, 124–135.
Stein, B. E., and Meredith, M. A. (1991). “Functional organization of the superior colliculus,” in The Neural Basis of Visual Function, ed. A. G. Leventhal (Hampshire: Macmillan), 85–110.
Swadlow, H. A., and Weyand, T. G. (1981). Efferent systems of the rabbit visual cortex: laminar distribution of the cells of origin, axonal conduction velocities, and identification of axonal branches. J. Comp. Neurol. 203, 799–822.
Thompson, G. C., and Masterton, R. B. (1978). Brain stem auditory pathways involved in reflexive head orientation to sound. J. Neurophysiol. 41, 1183–1202.
Tigges, J., and Tigges, M. (1981). Distribution of retinofugal and corticofugal axon terminals in the superior colliculus of squirrel monkey. Invest. Ophthalmol. Vis. Sci. 20, 149–158.
Tunkl, J. E. (1980). Location of auditory and visual stimuli in cats with superior colliculus ablations. Exp. Neurol. 68, 395–402.
Wallace, M. N., Roeda, D., and Harper, M. S. (1997). Deoxyglucose uptake in the ferret auditory cortex. Exp. Brain Res. 117, 488–500.
Wallace, M. T., Meredith, M. A., and Stein, B. E. (1993). Converging influences from visual, auditory, and somatosensory cortices onto output neurons of the superior colliculus. J. Neurophysiol. 69, 1797–1809.
Wallace, S. F., Rosenquist, A. C., and Sprague, J. M. (1990). Ibotenic acid lesions of the lateral substantia nigra restore visual orientation behavior in the hemianopic cat. J. Comp. Neurol. 296, 222–252.
Winer, J. A., Larue, D. T., Diehl, J. J., and Hefti, B. J. (1998). Auditory cortical projections to the cat inferior colliculus. J. Comp. Neurol. 400, 147–174.
Keywords: sound localization, multisensory integration, orientation behavior, auditory cortical fields, neural tracers, corticofugal input
Citation: Bajo VM, Nodal FR, Bizley JK and King AJ (2010) The non-lemniscal auditory cortex in ferrets: convergence of corticotectal inputs in the superior colliculus. Front. Neuroanat. 4:18. doi: 10.3389/fnana.2010.00018
Received: 15 January 2010;
Paper pending published: 15 February 2010;
Accepted: 23 April 2010;
Published online: 21 May 2010
Edited by:
Miguel A. Merchàn, Universidad de Salamanca, SpainReviewed by:
M. Alex Meredith, Virginia Commonwealth University, USACraig K. Henkel, Wake Forest University School of Medicine, USA
Copyright: © 2010 Bajo, Nodal, Bizley and King. This is an open-access article subject to an exclusive license agreement between the authors and the Frontiers Research Foundation, which permits unrestricted use, distribution, and reproduction in any medium, provided the original authors and source are credited.
*Correspondence: Victoria M. Bajo, Department of Physiology, Anatomy and Genetics, University of Oxford, Sherrington Building, Parks Road, Oxford OX1 3PT, UK. e-mail: victoria.bajo@dpag.ox.ac.uk
Abbreviations: I, II, III, IV, V, VI, cortical layers I–VI; A, anterior; A1, primary auditory cortex; AAF, anterior auditory field; ADF, anterior dorsal field; AEG, anterior ectosylvian gyrus; AES, anterior ectosylvian sulcus; AEV, anterior ectosylvian visual region; ALLS, anterolateral lateral suprasylvian area; AMLS, anteromedial lateral suprasylvian area; AVF, anterior ventral field; BDA, dextran biotin fixable; cns, coronal sulcus; CO, cytochrome oxidase; D, dorsal; DZ, dorsal auditory zone (equivalent to SF); EG, ectosylvian gyrus; FAES, anterior ectosylvian sulcal field (auditory); FR, Fluororuby (dextran tetramethylrhodamine lysine fixable); IC, inferior colliculus; L, lateral; LGN, lateral geniculate nucleus; M, medial; MEG, middle ectosylvian gyrus; MGB. medial geniculate body; P, posterior; PAF, posterior auditory field; PAG, periaqueductal gray; PEG, posterior ectosylvian gyrus; PMLS, posteromedial lateral suprasylvian area; PPF, posterior pseudosylvian field; PSF, posterior suprasylvian field; pss, pseudosylvian sulcus; rLS, rostral aspect of the lateral suprasylvian sulcus; S, section; SC, superior colliculus; SAI, stratum album intermediale; SAP, stratum album profundum; SF, suprasylvian fringe (equivalent to DZ); SGI, stratum griseum intermediale; SGP, stratum griseum profundum; SGS, stratum griseum superficiale; SO, stratum opticum; SSG, suprasylvian gyrus; sss, suprasylvian sulcus; SZ, stratum zonale; VP, ventro-posterior area.