Characterization of Firebrands Released From Different Burning Tree Species
 Miguel Almeida
 Leonardo Porto2
  Domingos Viegas
- 1ADAI, Department of Mechanical Engineering, University of Coimbra, Coimbra, Portugal
- 2Department of Mechanical Engineering, University of Coimbra, Coimbra, Portugal
The number, dimensions, and initial velocity of the firebrands released from burning Quercus suber, Eucalyptus globulus, Quercus robur, and Pinus pinaster trees were analyzed in laboratory experiments using a particle image velocimetry system. Additionally, the flame height, tree mass decay, vertical flow velocity, and temperature at the top of the trees were measured during the experiments. The relationship between the various parameters was analyzed and a good connection was found. The specimens burnt were mostly young trees, so large particles (e.g., pine cones, thick trunk barks, branches) were not included in this study as they were not present. Actually, the firebrands produced in the laboratory tests, mainly burning leaves, had a cross-sectional area of <1,600 mm2, having the potential to cause short distance spotting (up to tens of meters). Quercus trees are often considered to have a lower fire risk than eucalyptus or pine trees. However, in this study, Quercus suber and Quercus robur were the species that produced more firebrands, both in terms of number and total volume. The tests with Quercus suber were the only ones using specimens from an adult tree, confirming the great importance of the age of trees in the propensity to release firebrands. The results obtained with Quercus robur confirmed the high tendency of this species to originate spot fires at a short distance. Thus, these results are of great relevance to afforestation plans and to evaluating the risk of the presence of these species in wildland–urban interface areas.
Introduction
Spotting is one of the most relevant and common mechanisms of fire spread in wildfires, especially in extreme burning conditions. Its importance derives from the increased difficulty in firefighting caused by spotting; the serious consequences in terms of accidents, infrastructures, and other economic losses caused; and the great difficulty with regard to the prediction of this phenomenon. Moreover, spotting can dramatically increase the fire spread rate, being in some circumstances the main factor affecting it (Rothermel, 1983). Indeed, despite the several studies performed on this topic, the prediction of spotting is still very basic, which clearly jeopardizes the firefighting operations and threatens fire safety.
The analysis of the spot fires mechanism is frequently divided into four stages (Almeida et al., 2013): (1) release of firebrands, (2) lofting of the firebrands in the thermal plume, (3) downwind transport of the firebrands, and (4) ignition of the fuel recipient where the firebrands land. Most of the work seeking the determination of the maximum spotting distance is carried out in the second and third phases (e.g., Tarifa et al., 1967; Albini, 1979; Ellis, 2000; Hall et al., 2015) considering that firebrands, after leaving the thermal plume, travel at a velocity defined by the terminal velocity and the wind speed. The determination of the probability of ignition of landing firebrands was also the focus of some experimental studies. Statistical analysis based on tests with different combinations of firebrand types and fuel bed recipients (e.g., Ganteaume et al., 2009; Viegas et al., 2014; Ellis, 2015) or in a shower of firebrands artificially generated that hit building façades or other relevant structures (e.g., Manzello et al., 2011; Manzello and Suzuki, 2014; Oliveira et al., 2014) was produced.
The work performed on the release of firebrands is less frequent, and consequently, there is a great lack of knowledge on this phase of the process. The release of firebrands depends on several factors, the most important ones being the fire intensity, the airflow direction, velocity and turbulence, the characteristics of the source of the firebrands (e.g., tree type, species, age, etc.), and the characteristics of the firebrands (type, shape and dimensions, terminal velocity, moisture content, rate of combustion, etc.). Research on the firebrand generation can be divided into two areas, namely (1) firebrands generated by burning structures, which was initially investigated by Waterman (1969), paving the way for more recent research such as Suzuki et al. (2012) or Foote et al. (2011); and (2) firebrands generated by vegetation, which is the main topic of this work and is an even less investigated problem.
Six relevant works addressing this topic are as follows:
(1) Gould et al. (2008) performed four field experiments in plots with the size of 200 × 200 m and, among other analyses, studied the firebrand generation and spotting behavior resulting from a fire front spreading in a eucalyptus forest. Besides the successful validation of the model developed by Ellis (2000) to predicting maximum spotting distance of fibrous firebrands, these authors confirmed the importance of the fire intensity, and consequently of the convection column, in the release of the firebrands. It was also stated that younger fuels, including young trees, produce fewer firebrands than mature specimens.
(2 and 3) Manzello et al. (2007) analyzed the size and mass distribution of firebrands generated from burning Douglas-fir (Pseudotsuga menziesii) trees with heights of 2.6 and 5.2 m by collecting the firebrands in pans methodically distributed on the ground. The average firebrand size reported was 3 and 4 mm in diameter and 40 and 53 mm in length for the 2.6-m tall and 5.2-m tall trees, respectively. Later, Manzello et al. (2008) carried out similar tests with 3.6-m high Korean pine trees, which did not result in a significant number of firebrands produced. However, the dominant firebrands collected had a cylindrical shape with a diameter of 5 mm and a length of 40 mm, on average.
(4) Almeida et al. (2014) used a methodology based on particle image velocimetry (PIV) to analyze the firebrands lofted during the burning of pieces of the bark of eucalyptus trees in several scenarios with different arrangements of the barks tested. The methodology then used was quite similar to the one described herein.
(5) Tohidi et al. (2015) presented a mechanical firebrand break-off model for determining the formation of cylindrical firebrands produced during the burning of coniferous trees, stating the importance of the limb break-off process on the release of the particles. For validation, the laboratory data presented in Manzello et al. (2007) and Manzello et al. (2008), previously mentioned, were used.
(6) Filkov et al. (2017) studied the firebrand production in a prescribed fire in a pine forest by following a methodology described in Houssaimi et al. (2015). Around 80% of the firebrands collected in pans distributed on the ground, mostly from bark fragments (≈70%) and twigs (≈30%), had a cross-sectional area between 50 and 200 mm2.
The present work intends to contribute to mitigating these knowledge gaps. The main focus is studying the release of firebrands by typical tree species in the Mediterranean area, namely cork trees (Quercus suber), oak trees (Quercus robur), pine trees (Pinus pinaster), and eucalyptus trees (Eucalyptus globulus). These species were chosen among the other tree species with major representation in the Mediterranean forests (San-Miguel-Ayanz et al., 2016) for their role in the spotting mechanisms.
The eucalyptus species is by far the most associated one to spotting in several fire events such as the Black Saturday Australian Fires (Cruz et al., 2012) or the fires on October 15, 2017 that occurred in Central Portugal (Viegas et al., 2019). Spot fires driven from pine species also have some references, such as the 2010 Mount Carmel Forest Fire (Israel) described by Kutiel (2012). The role of the oak and cork trees is not as recognized. However, its potential has been well-established in several fire events, for example:
(a) Fire of Cicouro—Portugal (Viegas et al., 2013), in 2013, where an episode of oak leaves spotting drastically increased the rate of fire spread, surprising a group of firefighters, causing two fatalities;
(b) Fire of Pedrógão Grande of June 2017, in Central Portugal (Viegas et al., 2017), where the control of the fire in Regadas was lost due to spotting of cork oak leaves across a 10-m wide road.
The main aim of this work is to understand the relative role of the mentioned tree species in the short-distance spotting process. Spotting by large firebrands is not addressed in this work since the intense airflow convection column required to naturally produce such particles (Gould et al., 2008) was not achieved in the laboratory experiments. On the other hand, the trees tested did not have large particles such as thick barks or cones available to burn and potentially produce medium- to long-distance spotting, but, given the large number of particles produced, they have a great potential to produce a large number of spot fires.
The most common firebrands observed in the laboratory tests carried out were burning leaves released from the trees. Many reports (e.g., Viegas et al., 2013, 2019; Ribeiro et al., 2014) on large forest fires mention spotting by leaves as an essential mechanism of the fire spread. However, the majority of the research on spot fires addresses rigid artificial shapes (like spheres, cylinders, and disks) or natural shapes (cones, barks, and twigs) and usually neglect other potential firebrands like leaves. Clements (1977) is one of the rare exceptions where the terminal velocity of leaves from 17 different species were determined. This author found terminal velocities values of 1.54, 1.57, and 1.80 m·s−1 for the leaves of Quercus species (Q. phellos, Q. nigra, and Q. falcata, respectively) and 2.90, 4.00, and 4.14 m·s−1 for Pinus trees needles (P. echinate, P. elliottii, and P. taeda, respectively).
Methodology
General Conditions and Characterization of Fuels
The experimental work presented herein was carried out at the Forest Fires Research Laboratory (LEIF: Laboratório de Estudos sobre Incêndios Florestais), located in Lousã (Coimbra—Portugal), of Association for the Development of Industrial Aerodynamics (ADAI: Associação para o Desenvolvimento da Aerodinâmica Industrial).
The young trees were collected from forests close to the LEIF in the early hours on the day of the experiments. The samples of Quercus suber were collected 2 days before the experiments. Quercus suber is a protected species in Portugal, but a license (reference 53521/2014/DCNF-C/DLAP) for cutting a mature specimen that was about to fall on a road was obtained. Due to the impossibility of cutting young specimens, the branches of this mature tree were used as samples of Quercus suber. For simplicity, the authors will mention each Quercus suber branch as a tree and use this differentiation during the discussion of results.
The tests were performed on a single day. The 10 previous days were normally sunny with an average temperature of 19.7°C (from 12 to 31°C), an average wind velocity of 6.2 km·h−1 (from 0 to 22 km.h−1), and an accumulated precipitation of 1.0 mm (data from www.wunderground.com). So, the trees collected presented a moisture content value that allowed a sustained burning. On the day of the experiments, the fuels were stored in the laboratory and protected from the sun with the indoor environmental conditions mentioned in Table 1. The air temperature and relative humidity values are the average values registered at a portable weather station located inside the LEIF. Table 1 shows the moisture content values of the different trees used. The moisture content was determined immediately before each burning test by using a moisture analyzer (AnD ML-50 0.1%) using samples composed of leaves and branches (<3 mm in diameter) in a percentage distribution representative of each species.
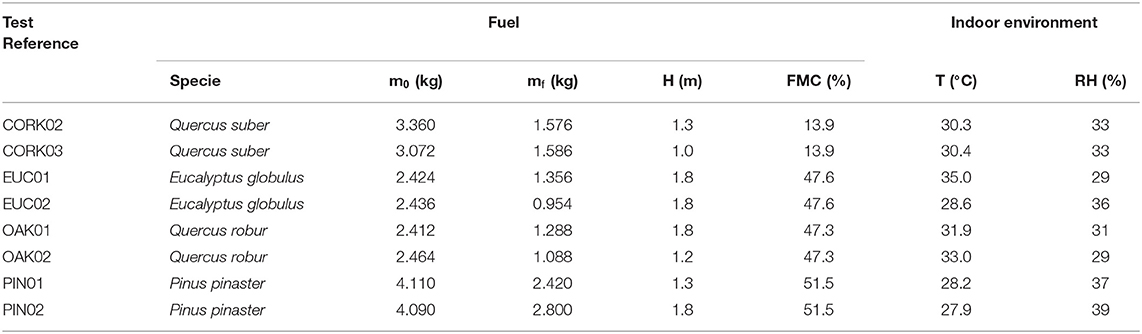
Table 1. Main data related to the experimental conditions (m0–initial mass of the trees; mf–residual mass of the trees after the burning tests; H—tree height; FMC—fuel moisture content in wet basis; T—air temperature; RH—air relative humidity).
A brief characterization of the structure of the trees used is presented in Table 2. This determination was carried out by detaching the leaves and branches of one representative tree (i.e., roughly medium dimensions) from each species. The main trunk of the trees was not considered in the analysis. The images of the trees used in the experiments are presented in Figure 1.
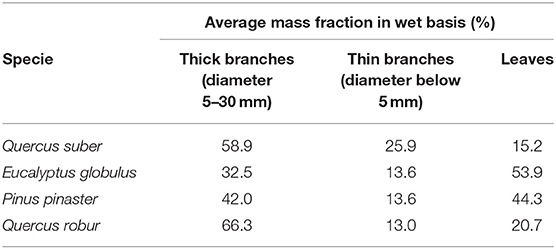
Table 2. Representative mass distribution of the trees used in the tests.
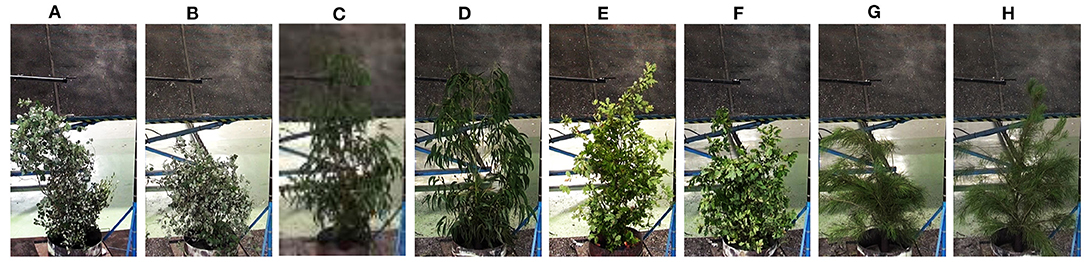
Figure 1. Photography of the experimental set up: (A) CORK02; (B) CORK03; (C) EUC01; (D) EUC02; (E) OAK01; (F) OAK02; (G) PIN01; and (H) PIN02.
Experimental Apparatus and Procedures
The experimental apparatus can be seen in Figure 2. The tests were carried out in a burning trees platform with an area of 1.5 × 1.5 m and a height of 0.15 m, supported by three load cells with 0.1 g of precision each, connected to a computer for automatic mass recording.
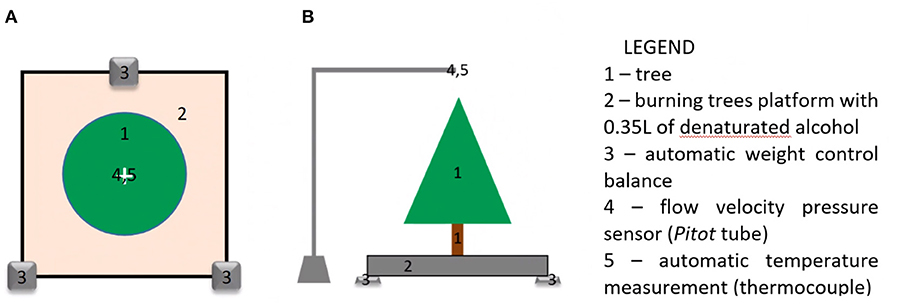
Figure 2. Design of the experimental apparatus: (A) top view; (B) profile view.
The burning of the trees was only sustainable through the addition of a complementary fuel under the canopy. Since the use of bushes or other wild fuels as an ignition fuel would produce firebrands that would disturb the final analysis, denatured alcohol (DA) was used as a complementary fuel. Thus, in each burning test, a container with a diameter of 0.75 cm filled with 0.35 L of DA (ethanol 90% v/v) was placed under the tree. In order to check the eventual effect of the DA on the final results and to correct the mass loss, the authors carried out some experiments with a similar methodology but with no trees, thus exclusively burning 0.35 L of DA. As expected, these tests did not produce any firebrand and allowed for the determination of the constant mass-loss rate of the burning alcohol, which was found to be equal to 2.8 g/s.
Using a supporting structure, an S-Pitot tube (6 mm of internal diameter) and a thermocouple (1-mm thick) were placed over the platform, 1.8 m above the ground. This equipment was connected to a computer in order to record the vertical velocity and temperature of the convective airflow. Consistently, the mass, the temperature, and the pressure were registered at a frequency of 2 Hz during the experiments.
For each test, the tree specimen was placed vertically on the platform after measuring the fuel moisture content (FMC) of the samples of leaves and branches <3 mm in diameter. Ignition was achieved by dropping a match on the DA, which immediately started to burn, spreading the flames to the tree canopy. The DA continued to burn with a constant intensity/flame height until after the test was over.
Characterization of the Particles Released Using the PIV System
For determining the particles released by the trees, a system of PIV was used. The software used was DynamicStudio, version 15, from Dantec. A Speedsense 1,040 camera and a Frame Grabber 1,031 from National Instruments (National Instruments Corp., Switzerland)1 were used.
The PIV device was located 5.8 m away from the tree and the platform and 3.3 m above the ground, so as to minimize parallax errors, and horizontally oriented to the smoke plume. The image selected for analysis had an area of 0.7 × 0.7 m, thus capturing images in the height range of 2.95–3.65 m (Figure 3). The height of the PIV capturing area was chosen considering an expected maximum flame height of about 2.5 m, according to previous tests performed by Almeida et al. (2014), thus avoiding the interference of the flame in the analysis of the PIV images. Since there were no predominant horizontal airflows, the flames observed tended to be vertical. Therefore, the flame height coincided with the flame length and consisted of the vertical distance between the DA level and the top of the flame. Eventual detached flames were not considered.
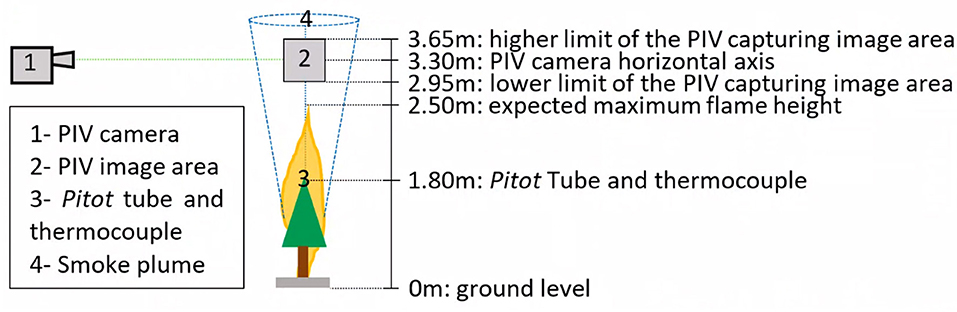
Figure 3. Profile view of the experimental apparatus. For convenience, the figure is not to scale.
As can be seen in Figure 3, the PIV image-capturing system targeted the central axis of the smoke column at a height of 3.3 m. In the middle of the smoke column, the firebrands have a strong vertical upward component (Figure 4). After being lofted, the firebrands, commonly extinct or less glowing, start a descending movement out of the smoke column and thus were not able to be captured by the PIV system. Thus, almost all the particles captured in the PIV images are glowing and being lofted in the convective column of smoke.
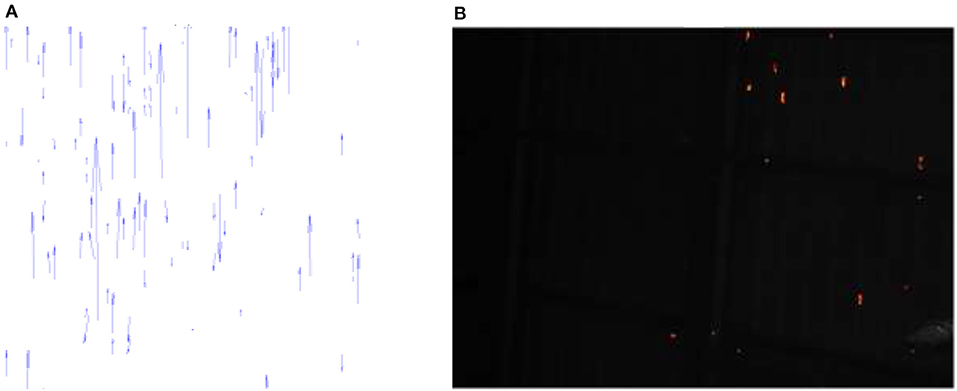
Figure 4. Images from the PIV system: (A) velocity vectors of the firebrands; (B) firebrands identified using the shadow processing tool.
The authors assumed a radial symmetry of the tree and of the characteristics of the smoke plume. The PIV images were acquired at a frequency of 143 Hz, in double frame, using the Shadow Processing tool to identify the firebrands (Figure 4). The domain of interest in the PIV images was the analysis area of size 0.7 × 0.7 m (square 2 of Figure 3). This methodology was previously tested with good results, allowing for an accurate particle velocity determination through the comparison of two consecutive frames, thus reducing the likelihood of firebrands being incorrectly identified. Since the brightness of the incandescent particles highlights them in the images taken, the process of tracking is facilitated without the need for complementary illumination systems (laser or other). Thus, not only the number and area of the firebrands but also their velocity can be accurately determined using the double frame in the Cross-Correlation tool.
Due to the limitation of the computer storage capacity, and because of the large number of images being captured, the PIV images were acquired during 44 s in each test. Thus, the capture of images by the PIV system was initiated only when the first release of firebrands was observed. This process was started typically by an initial increase in the release rate of the firebrands and, after reaching a maximum value at time tM, the number of firebrands produced started to decrease. In order to increase the accuracy of the method, the authors used the data of the time interval tM±5 s, which was designated as the “10 s-peak period.” Thus, the authors ensured that the comparison between the various burning tests was made at the same stage of the process around the maximum release period. Since the period of 10 s provided in this method is limited in duration and consequently in sample size, when appropriate, the entire PIV image acquisition period of 44 s was used in the analysis of the results.
In Figure 5, on the right of the burning tree, it is possible to see a vertical pole with 25-cm markers that were used as a scale to estimate the flame height, using frames captured from the video recordings. The same scale was used to calibrate the PIV images.
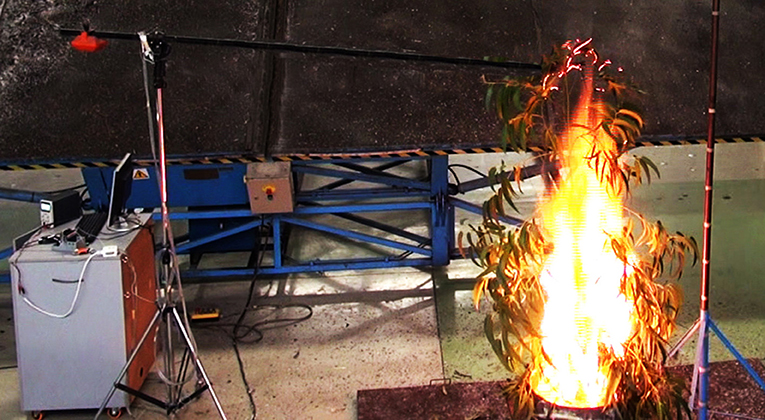
Figure 5. Image of a burning test captured just before the start of the acquisition of the PIV images (test EUC02).
The firebrands released were divided into five classes based on average cross-sectional area Aav: 10< Aav≤50 mm2; 50<Aav≤100 mm2; 100<Aav≤500 mm2; 500<Aav≤1,000 mm2; Aav>1,000 mm2. Firebrands with Aav≤10 mm2 were not considered in this analysis since their potential to cause new ignitions is very low.
It was observed that the majority of firebrands released were the leaves of the burning trees. Thus, since the authors did not find in the literature typical values of the terminal velocity for the leaves of the species used in these tests, a set of tests with that purpose was performed using a methodology very similar to that used by Clements (1977). Ten leaves of each species, randomly collected, were dropped from a height of 9 m in the absence of wind. The time tfall that each leaf took to fall in the last 5 m, when the falling velocity is practically constant, was found using video footage. The terminal velocity Vtwas determined by the quotient between the 5 m distance and the time tfall elapsed on this final 5 m. The resulting Vt values (Table 3) were not significantly different from those found by Clements (1977) for the species of the same taxonomic genre.
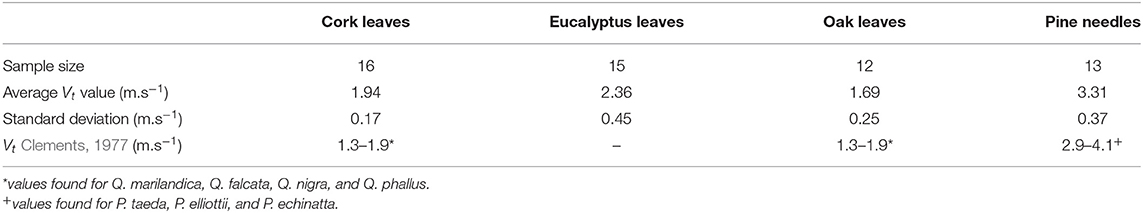
Table 3. Terminal velocity results from the experimental tests.
Results and their Interpretation
Number and Cross-Sectional Area of the Firebrands Released
The total number of firebrands released during the capture period of the PIV images is presented in Figure 6. In order to allow for the extension of the use of these data in future works, the number of particles released is denoted as those released per unit of area (N·m−2). Once again, due to data storage limitations of the system, the capture of PIV images was started after fire ignition, when the operators considered the burning process to already be in sustained development. Therefore, the first point of the graph in Figure 6 does not initiate at t = 0 s, when the ignition occurred.
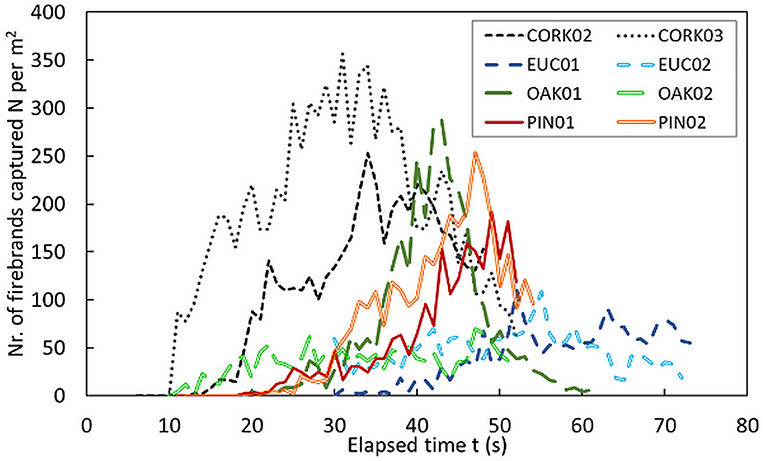
Figure 6. Number of firebrands released per m2 captured in the PIV images. Time “0 s” corresponds to the beginning of the burning test, which is different from the beginning of PIV image capture.
The distribution of the total number of firebrands released during the capture period of the PIV images, grouped in classes based on their cross-sectional area Aav, is presented in Figure 7. As previously mentioned, the analysis was limited to the 10 s-peak period, allowing for a fair comparison among the different species used.
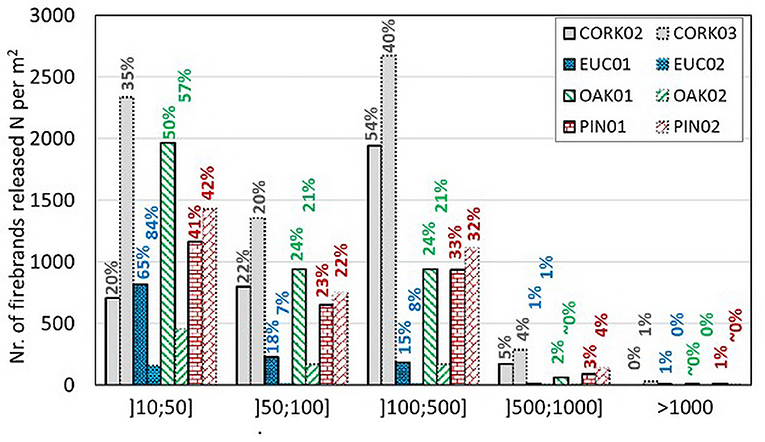
Figure 7. Distribution of firebrands released per m2, captured in the PIV images, by classes of cross-sectional area during the 10 s-peak period. Above the vertical bars is the percentage values of the firebrands for the respective classes.
Each pair of tests on the same species showed a very similar tendency in terms of the number of firebrands released, except in the oak trees tests, where, for test OAK01, the number of firebrands counted was much higher than that for OAK02. By observing the OAK02 test video, it was possible to notice that during the capture period of the PIV images, this tree burned mostly on one side of the canopy unlike the other tests, where the burning was more comprehensive. Therefore, the release of firebrands in the OAK02 test may have been affected. Regarding the distribution of firebrands by the classes based on the cross-sectional area Aav, the results show a satisfactory reproducibility in the tendency obtained for each pair of tests, even for both the oak trees tests.
It is possible to state that the maximum number of firebrands was released by the cork trees and by the oak trees (excluding OAK02), followed by the pine trees and finally the eucalyptus trees. On the other side, the most represented area classes Aav in terms of the number of firebrands released are [10, 50] mm2 and [100, 500] mm2. This figure also shows that Cork tree tests have a higher tendency to produce larger firebrands, while tests with the other species drove mainly toward the production of smaller particles within the range of 10<Aav≤50 mm2. It is worth noting that the cork trees were collected 2 days before the tests while the other trees were cut on the day of the experiments. Although the storage of the cork trees occurred under controlled conditions and these trees did not show visible degradation, the decay of FMC (Table 2, above) may have affected the results, thus contributing to the change in the number and dimensions of the firebrands released.
Temperature and Vertical Airflow Velocity
In the graphs in Figure 8, the values of temperature T and vertical airflow velocity Vf, measured at a height of 1.8 m and the values of the velocity of the particles Vp determined using the PIV images at the heights of 2.95–3.65 m are represented as a function of the time elapsed since the ignition up to 75 saver. The number of firebrands released is represented in the same figure to facilitate the establishment of relationships. The velocity and temperature values of the CORK02 test were not obtained as the Pitot tube did not work properly during this experiment. The sampling of the values of the velocity of the firebrands is limited to the 44-s acquisition time period for the PIV images for all tests. This period is marked in the figure by the two vertical solid lines. The dotted vertical lines in the graphs limit the 10 s-peak period of the particles released.
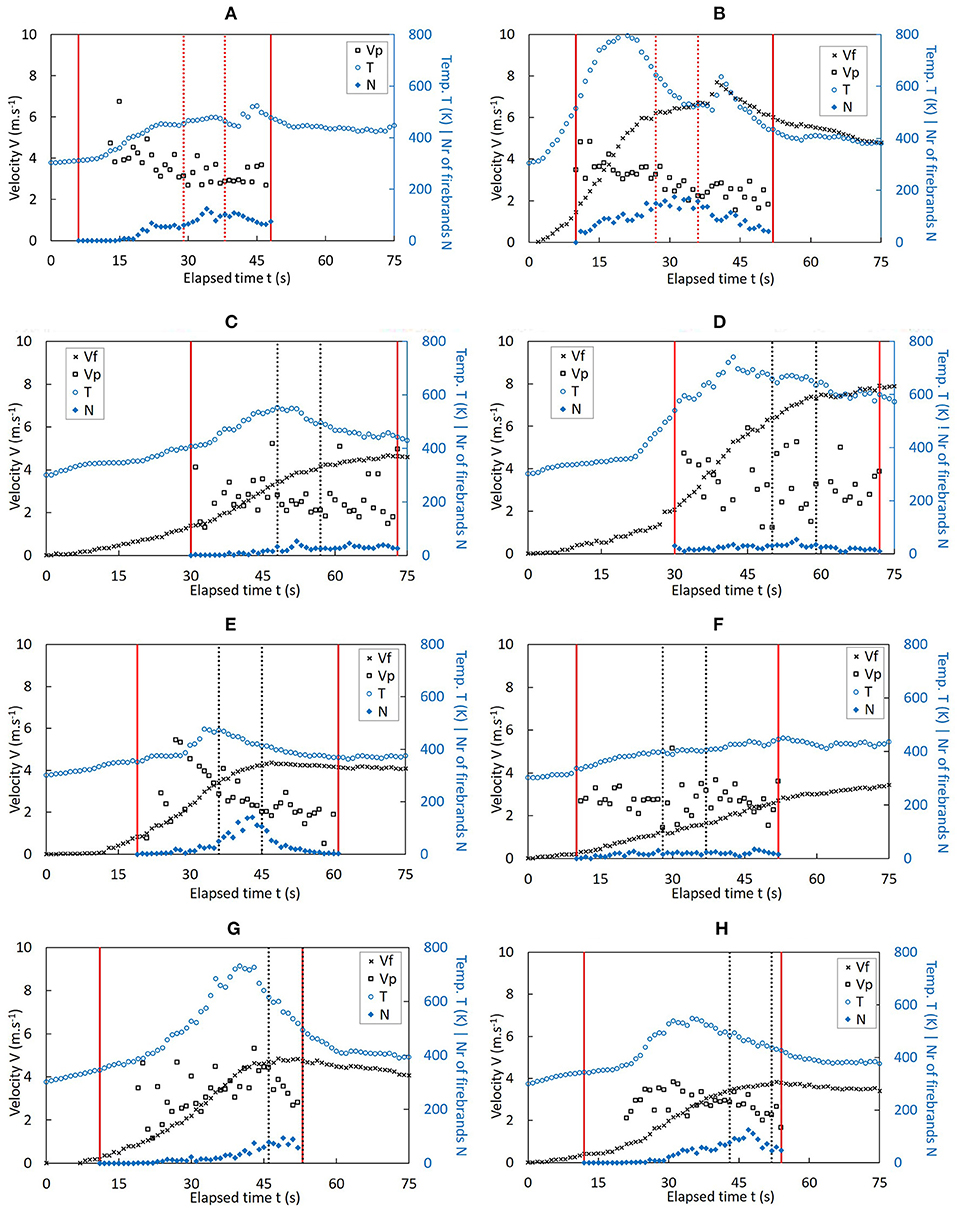
Figure 8. Values of up-flow velocity Vf, velocity of the firebrands Vp, temperature T, and the number of firebrands N as a function of the elapsed time t for each test. The two vertical solid lines limit the period of PIV image acquisition. The two vertical dotted lines limit the 10 s-peak period. The color of the markers corresponds to the color of the axes to which they refer. (A) CORK02; (B) CORK03; (C) EUC01; (D) EUC02; (E) OAK01; (F) OAK02; (G) PIN01; and (H) PIN02.
As can be verified, the values of the velocity of the firebrands do not differ considerably from the values of airflow velocity registered at the same time, following an approximate trend as the number of firebrands released. It would be expected that the Vp values were consistently smaller than the Vf values because of gravity and drag effects. It is worth noting that the values of Vf at a height of 1.8 m were not measured exactly at the same position as that of the firebrands (2.95–3.65 m high). Besides, the values of Vf correspond only to the vertical component of the flow velocity, while Vp is the modulus of the two-dimensional velocity of the particle and is limited to the PIV image-capturing area. This could be the reason why occasionally the values of Vp are larger than Vf.
The average velocity of the particles in the smoke plume should be given by the difference between the airflow velocity and the terminal velocity of the particle Vt (Equation 1).
During the burning tests, the authors observed that most of the firebrands released were leaves or parts of leaves. Some twigs were also released but in much smaller quantities. Therefore, the authors used the terminal velocity values measured for the leaves of each species (Table 3) to make a comparison with the results obtained with the PIV system. The results given in Table 4 show that the values of Vt obtained in the PIV tests are of the same order of magnitude as those measured in the free fall tests. The small discrepancies can be justified by the differences in the relative measurement positions of Vf and Vf, as explained above. In the case of OAK2 test, a negative value of Vt was obtained possibly because the tree did not burn with radial symmetry. Thus, the central axis of the smoke plume did not coincide with the central vertical axis of the tree where the Pitot tube was located. Therefore, the Vf value determined was not the highest flow value in the smoke plume, leading to apparent negative Vp values.
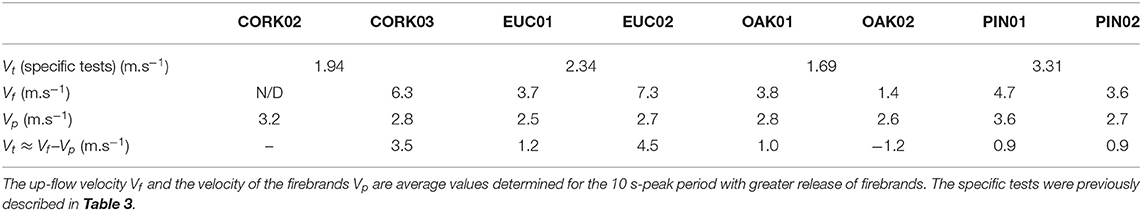
Table 4. Terminal velocity Vt of the leaves of the species used in the tests.
Mass Decay
In order to estimate the mass loss of each tree during the burning test, the authors considered the mass loss of the DA, which was also placed in a pan on the weighing platform. A reference test was made using only the alcohol container under the same conditions as those of the burning tests. Assuming that the burning conditions of the alcohol in the pan were not affected by the presence of the tree, in all tests, the authors estimated the mass m of the tree by subtracting to the total mass mT the mass mDA of the alcohol, which decreased linearly with a rate of 2.8g·s−1 (r2 = 0.99).
In order to make a fair comparison of the mass loss among all tests, the mass values were normalized using the initial value of the tree mass m0 and its value after the burning test mf, as given in Equation (2) for the determination of the relative mass α. The relative mass α as a function of the elapsed time for all tests performed is presented in Figure 9.
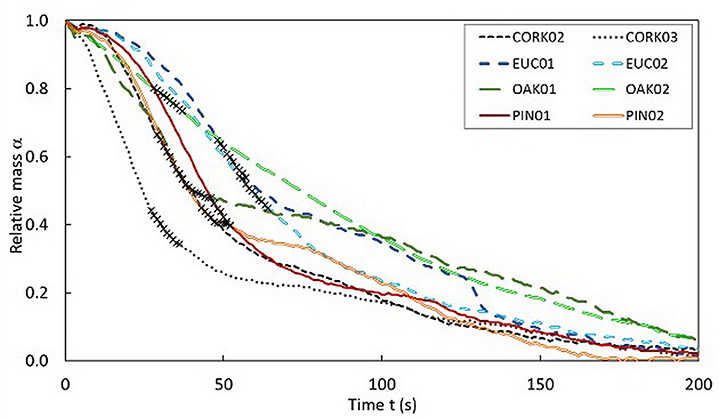
Figure 9. Relative mass α as a function of the elapsed time t for each entire test. The cross marks (x) correspond to the values determined for the 10 s-peak period.
During the 10 s-peak period presented in Figure 9, the relative mass decay curves can be fitted to an exponential function as indicated by Equation (3) and as shown in Figure 10.
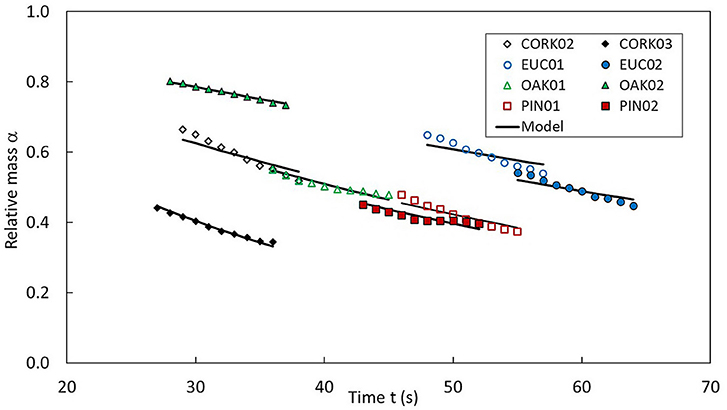
Figure 10. Fractions of the curves presented in depicting the values of the 10 s-peak period to fit the model of Equation (4).
In Equation (4), the relative mass decay coefficient “a” allows for the comparison among the several tests. As can be seen in Table 5, the OAK02 test, which was not a conventional one, and the eucalyptus trees tests were those in which the relative mass consumption was slower.
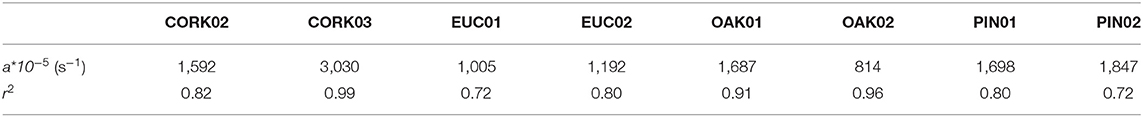
Table 5. Exponential relative mass decay coefficient “a” (s−1) and correlation coefficient achieved in the fitting of the relative mass α of the trees by the elapsed time t during the 10 s-peak period (Figure 10), according to Equation (4).
The relative mass loss rate , which is used to estimate the relative mass decay per unit of time, is defined by Equation (4). The variation in relative mass loss rate during the 44 s of the capture period of the PIV images is shown in Figure 11. This representation of the relative mass loss rate α indicates a faster mass consumption for cork tests, OAK01, and pine tests.
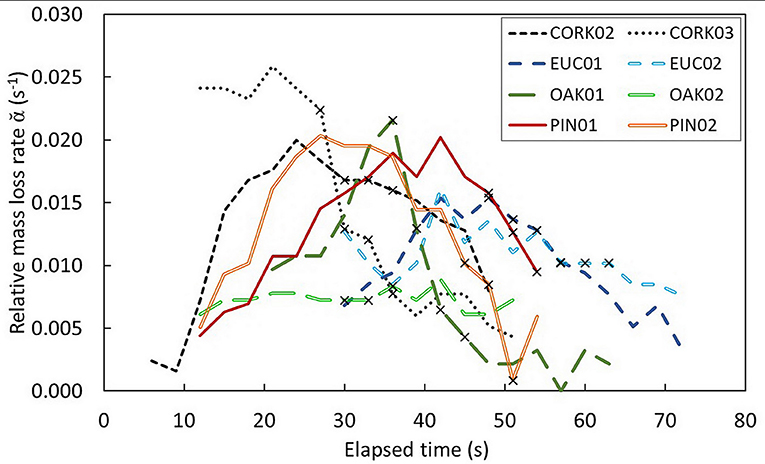
Figure 11. Relative mass loss rate as a function of the elapsed time t for the period of PIV image acquisition in each test. The cross marks (x) correspond to the values determined for the 10 s-peak period.
Correlation Between Parameters
The mass and the volume of the firebrands released were not determined since only one PIV camera was used and consequently only a two-dimensional analysis was carried out. However, a rough association between the cross-sectional area can be made with the volume and mass of the particles. The accumulated values of the total cross-sectional area Aac (Equation 5) of the firebrands released since the beginning of image acquisition up to a certain moment t were related with the relative mass α of the trees, as presented in Figure 12.
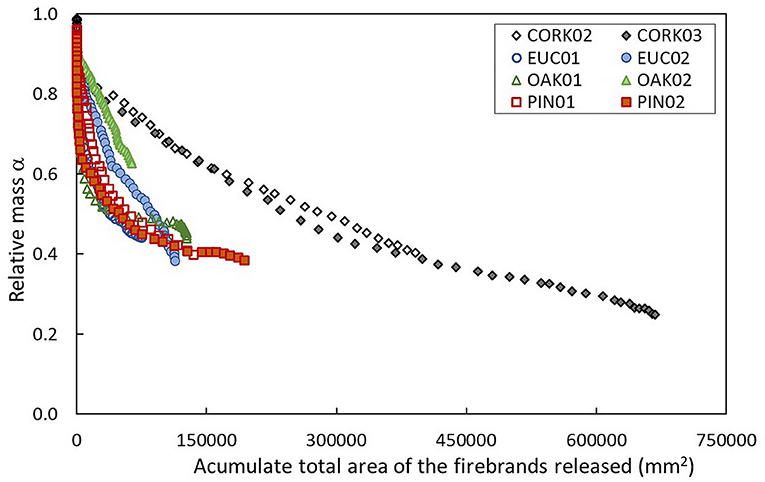
Figure 12. Variation of the relative mass of the trees α as a function of the accumulated total cross-section area Aac of the released firebrands captured in the PIV images.
As expected, the accumulated total cross-sectional area Aac of the firebrands released increases with the decrease in tree mass (Figure 12). The tree mass decay is dependent on three parameters: (1) the mass transferred to the firebrands released, (2) the mass lost in the water volatilization process, and (3) the mass lost to the formation of volatile gases. The relationship given in Figure 12 deals with that between the mass transferred and the firebrands released.
Making the same relationship for the 10 s-peak period (Figure 13), the slope m of the tendency lines formed by each data set (Table 6) can be analyzed. Larger values of the slope m mean less mass reduction dependency on the mass associated with the Aac of the firebrands released.
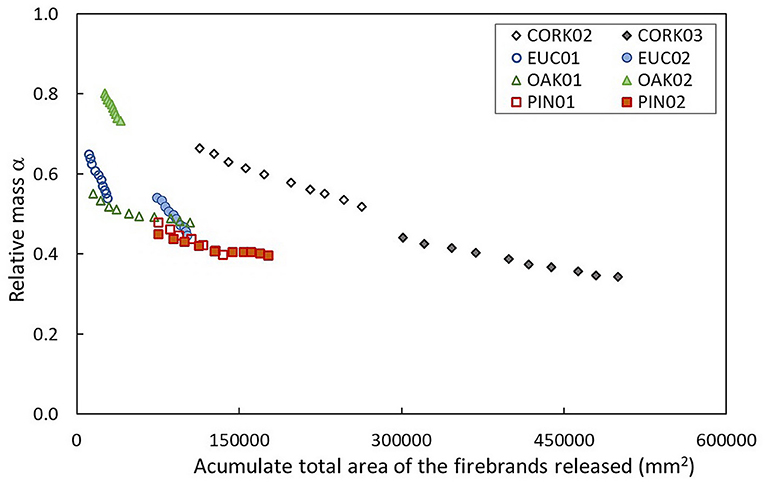
Figure 13. Variation of the relative mass of the trees α as a function of the accumulated total cross-section area Aac of the released firebrands captured in the PIV images during the 10 s-peak period.
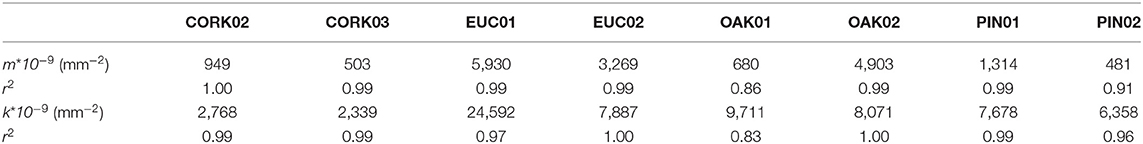
Table 6. Linear coefficient m (mm−2) and exponential coefficient k (mm−2) and respective correlation coefficients achieved in the fitting of the mass of the trees by the estimated values of firebrands released (Figure 11) using Equation (6).
Using the same relationship in Figure 13, the exponential coefficient k obtained from Equation (6) was determined as presented in Table 6.
The results show that the mass loss of burning eucalyptus trees is less driven by the production of firebrands than for other trees. This is consistent with Figure 7, where it is shown that the small firebrands were the most represented in the EUC experiments. On the opposite side, the variation of α vs. Ac for the cork trees was very strong as denoted by the lowest k value, which is consistent with the larger number of firebrands released (Figure 6, above) and with the lowest values of moisture content (Table 1).
When equations 3 and 6 are combined using the common parameter α, Equation (7) is obtained.
In Figure 14, the evolution of Aac as a function of t is represented using the data from all tests. The dotted line presented, characterized by the linear function shown in the figure, was achieved by the overall tendency of the values. The slope of this function is close to 1, showing the close similarity between both members of Equation (7). Therefore, the relationship between the parameters “a” and k, derived from the relative mass α, and the accumulated total area of the firebrands Aac is well-established.
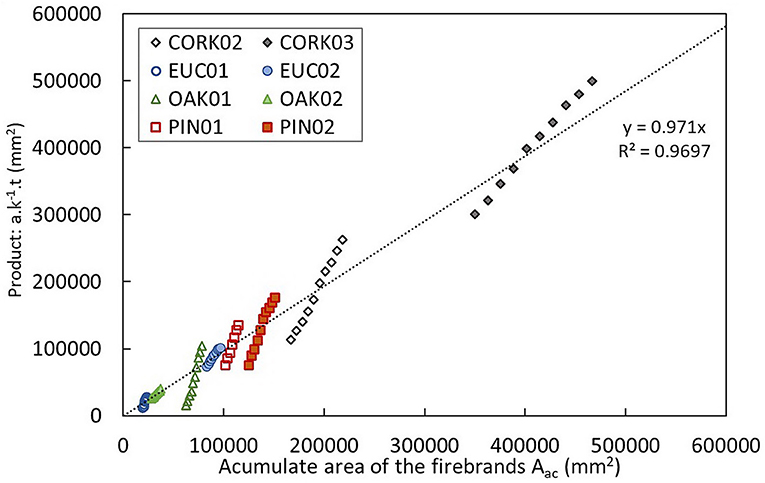
Figure 14. Variation of Aac as a function of the second term of Equation (7). The dotted line represents the linear tendency of all the values, which is characterized by the linear function presented in the graph.
The flame height Hf variation was also analyzed and compared with the other parameters described above. As can be seen in Figure 15, the flame height follows a trend comparable to the relative mass loss decay .
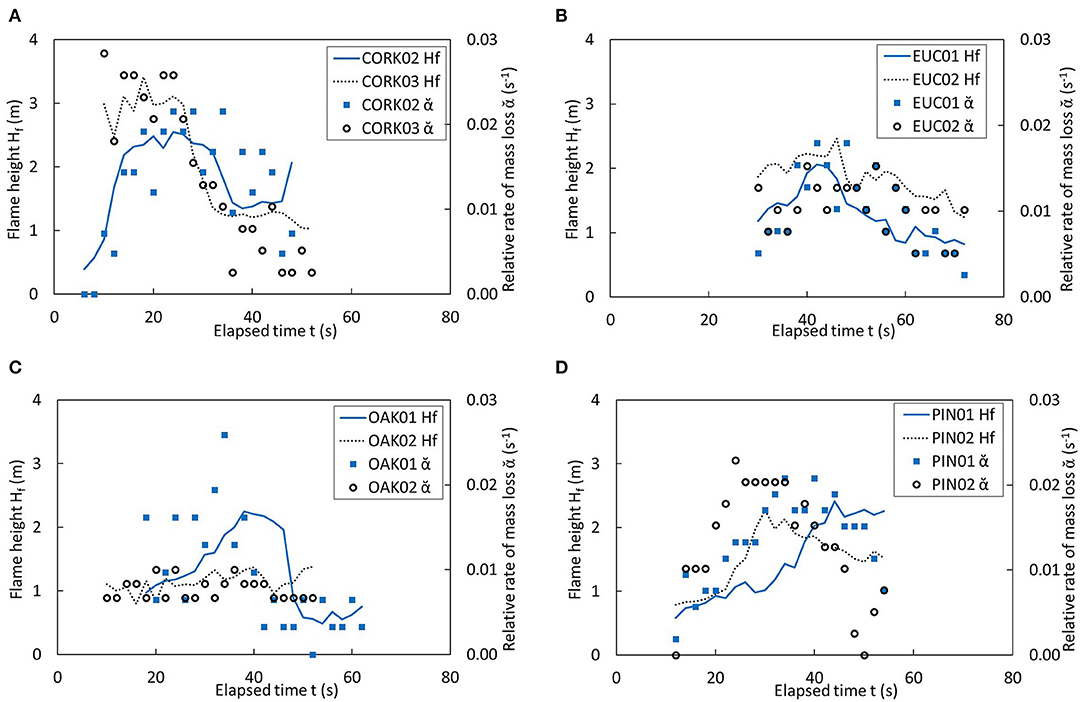
Figure 15. Comparison between the flame height Hf and relative rate of mass loss variations during the PIV image-capturing period of the tests. (A) Tests on cork trees; (B) tests on eucalyptus trees; (C) tests on oak trees; (D) tests on pine trees.
The variations in the flame height and in the total cross-sectional area of the firebrands released are presented in Figure 16. The total cross-sectional area At represents the sum of the areas of all the firebrands captured at each instant. It is possible to see that both parameters follow the same tendency; however, the At peaks show a delay of some seconds when compared with the Hf peaks. The time difference between At and Hf peaks is hereby denoted by “delay time.”
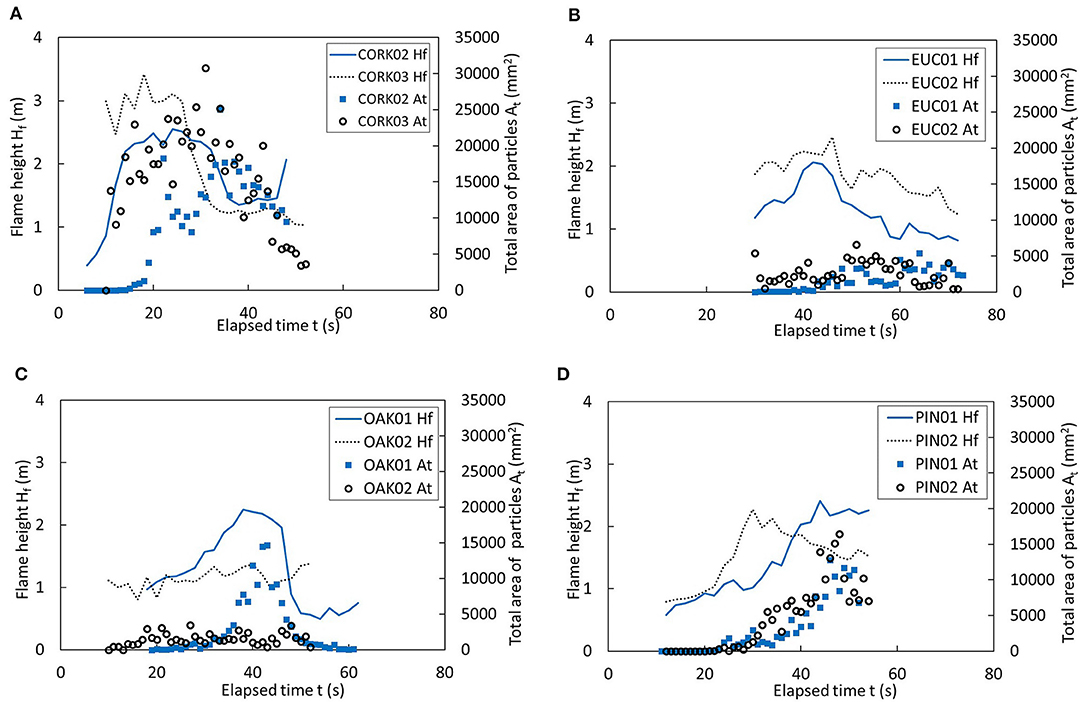
Figure 16. Comparison between the flame height Hf variation and total cross-sectional area of the firebrands released At during the PIV image-capturing period of the tests. (A) Tests on cork trees; (B) tests on eucalyptus trees; (C) tests on oak trees; (D) tests on pine trees.
In Table 7, the delay times determined for each test are presented. One of the factors affecting the delay time is the period required for the particles to take off from the tree by detachment as a consequence of fire; this time is hereby denoted by “reaction time.” On the other hand, the firebrands were separated from the tree at approximately the height of its canopy (Table 1), but the particles were captured in the PIV images at an average height of 3.30 m (2.95–3.65 m). The time taken for uplifting firebrands from the canopy to the average height of the PIV image capture was determined by dividing the average velocity of the firebrands Vp (Table 4) and the vertical distance between the canopy and the PIV image center. The reaction time was determined by calculating the difference between the delay time and the uplift time (Table 7).
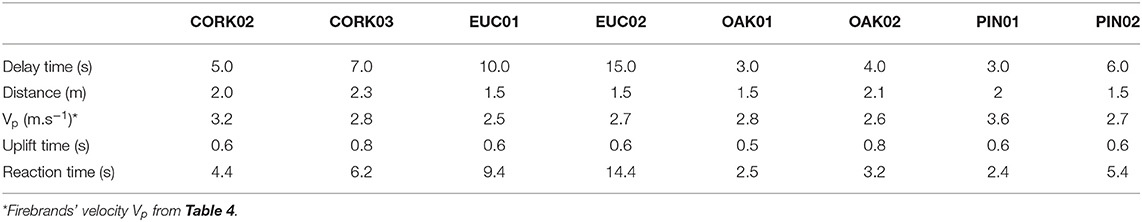
Table 7. Values of the reaction times for the different experiments seen as the average time required to detach the particles from the tree as a consequence of the burning.
The reaction times found for the several species were very similar except for the eucalyptus trees, which require more time to release firebrands due to a change in the fire intensity. On the other hand, the reaction time of the oak trees and the pine trees was about four times lower than that of the eucalyptus trees, and about two times smaller than that of the cork trees (except for the PIN02). The authors believe that these differences are much related to the thickness and robustness of the petiole that links the leaves to the branches. However, specific tests are required to better explore these observations.
Final Discussion of Results
The results of several tests aiming at the analysis of the firebrands released during the burning of different trees common in the Mediterranean forests were presented and preliminarily discussed. A compilation of the main results (Table 8) and an integrated discussion are carried out in this section.
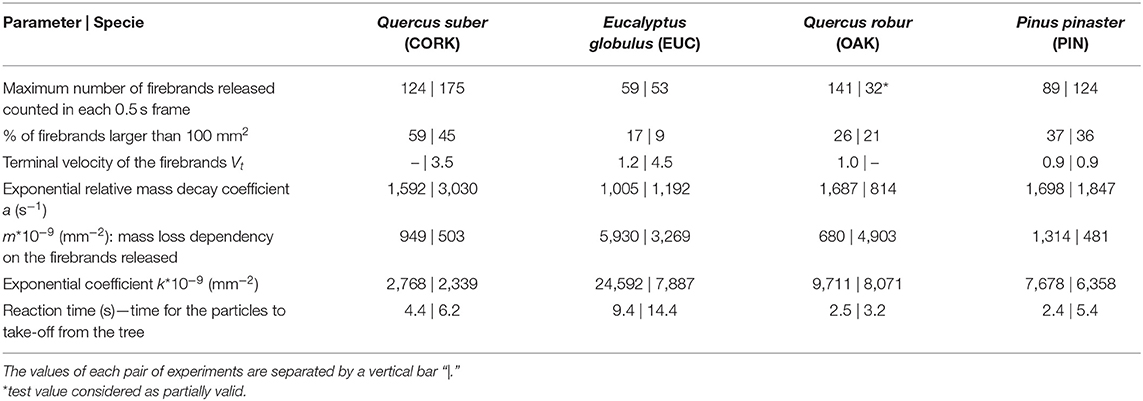
Table 8. Compilation of the main results previously presented and discussed.
Contrary to what is usually assumed, the eucalyptus trees were found to be the species releasing fewer firebrands, while cork and oak trees produced more firebrands. In many situations of fuel management in the wildland–urban interface, the oak and cork trees are used to reduce the fire risk propensity, but the results of these tests and other observations show that their predisposition to produce firebrands able to cause spot fires at a shorter distance (tens of meters) cannot be neglected. These results are corroborated by the analysis that was carried out in order to understand the dependence of the mass loss on the release of firebrands. Once again, the loss of mass recorded during the burning of the cork trees was the one that proved to be most influenced by the release of particles. Eucalyptus was the species in which this dependence was the lowest.
On the other hand, the terminal velocity of the firebrands released by the cork trees was shown to be higher than that of the trees in the OAK tests, and so a larger spotting distance is expected for the firebrands produced by oak trees.
It is worth highlighting that in these experiments, with the exception of the cork trees, only young trees were tested and these results are not extended to mature trees. For example, the thicker barks of eucalyptus trees or pine cones were not available in these tests, and their relevant role in the development of spot fires in real fire events was not addressed. On the other hand, these results must be interpreted considering the limited fire intensity achieved in these experiments. In real fire events, not only would several episodes with higher intensity and thus more convective airflow velocity be expected but also the existence of meteorological wind, which would lead to the production of more and larger firebrands, would be anticipated. Still, this study allows a comparative analysis of the species with higher potential to produce firebrands that are able to originate spot fires at a distance up to some tens of meters.
It was observed that most of the firebrands released were the leaves of the trees. Since the eucalyptus trees used were the species with a larger mass percentage of leaves (Table 2) and a lower mass percentage of thick branches, a greater release of firebrands would be expected in these trees. However, it was also noted that the eucalyptus leaves require a high energy value to release firebrands, which is shown by the larger reaction time (Table 8) and by a higher value (52 and 56%, respectively) of final mass mf of fuel to burn after the tests (Table 1).
Conclusions
In this work, the number and characteristics of the firebrands produced during the burning of four different trees were analyzed. The authors observed that a young tree belonging to Eucalyptus globulus had a lower potential to produce spot fires, followed by Pinus pinaster, Quercus robur, and Quercus suber. These trees released mostly leaves and twigs capable of producing spot fires at a short distance.
The results presented are relevant when used in fire behavior prediction models that consider the mechanism of spotting. However, the results obtained for cork, oak, and pine trees are related to young specimens and cannot be directly transposed to adult trees.
The methodology based on PIV images proved to be useful in this analysis. However, since the analysis was made on a two-dimension basis, it is expected that the number and mass of firebrands determined are underestimated since firebrands can be hidden behind each other. Moreover, some firebrands may have had an early abandonment of the smoke plume and so might not have been captured by the PIV images and considered in the analysis. Thus, the previously mentioned sequence of the potential for those trees to cause spot fires is valid.
The authors of this study intend to perform additional tests with other species commonly found in the Mediterranean and non-Mediterranean forests of not only trees but also shrubs and herbaceous plants that have the potential to cause spot fires. Moreover, the authors aim to analyze the effect of the age of the tree and the effect of wind on the firebrands released during the burning of several forest species. The test results like the ones presented herein will be used as a reference to harmonize the results of tests performed in different conditions.
Data Availability Statement
The original contributions presented in the study are included in the article/supplementary material, further inquiries can be directed to the corresponding author/s.
Author Contributions
MA: coordinated the study, designed, supervised and participated in laboratory tests, analyzed data, led the writing of the manuscript. LP: participated in the laboratory tests, performed PIV data processing, revised the manuscript. DV: supervised the study, discussed the results, revised and contributed to the writing of the manuscript. All authors contributed to the article and approved the submitted version.
Funding
This research was funded by the Project Firestorm (www.adai.pt/firestorm) and House Refuge (www.adai.pt/houserefuge) with the references PCIF/GFC/0109/2017 and PCIF/AGT/0109/2018, respectively. Both projects are funded by the Portuguese Foundation for Science and Technology (http://www.fct.pt).
Conflict of Interest
The authors declare that the research was conducted in the absence of any commercial or financial relationships that could be construed as a potential conflict of interest.
Acknowledgments
The authors acknowledge the contributions in the laboratory tests of several members of the ADAI, namely Jorge Raposo, Cláudia Pinto, Joel Teixeira, Nuno Luís, and Ana Beatriz. The authors would also like to thank Ana Albuquerque and Millo Magnocavallo for their help in reviewing the English writing.
Footnote
References
Albini, F. A. (1979). Spot Fire Distance From Burning Trees: A Predictive Model. USDA Forest Service, Intermountain Forest and Range Experiment Station, Technical Report INT-56. (Ogden, UT). Available online at: https://www.frames.gov/catalog/8153
Almeida, M., Viegas, D. X, and Miranda, A. I. (2013). Combustion of eucalyptus bark firebrands in varying flow incidence and velocity conditions. Int. J. Wildl. Fire 22, 980–991. doi: 10.1071/WF12210
Almeida, M., Viegas, D. X., and Raposo, J. R. (2014). “Analysis of firebrand release on the spot fire mechanism,” in Advances in Forest Fire Research, ed D. X. Viegas (Coimbra: Imprensa da Universidade de Coimbra). doi: 10.14195/978-989-26-0884-6_6
Clements, H. B. (1977). Lift-Off of Forest Firebrands. USDA Forest Service South-Eastern Forest Experiment Station, SE-159 (Asheville, NC). Available online at: https://books.google.pt/books/about/Lift_off_of_Forest_Firebrands.html?id=jSnBMQEACAAJ&redir_esc=y
Cruz, M. G., Sullivan, A. L., Gould, J. S., Sims, N. C., Bannister, A. J., Hollis, J. J., et al. (2012). Anatomy of a catastrophic wildfire: the black saturday kilmore east fire in Victoria, Australia. For. Ecol. Manag. 284, 269–285. doi: 10.1016/j.foreco.2012.02.035
Ellis, P. F. (2000). The Aerodynamic and Combustion Characteristics of Eucalypt Bark – A Firebrand Study (PhD thesis). Australian National University, Canberra, ACT. Available online at: https://openresearch-repository.anu.edu.au/handle/1885/49422
Ellis, P. F. M. (2015). The likelihood of ignition of dry-eucalypt forest litter by firebrands. Int. J. Wildl. Fire 24, 225–235. doi: 10.1071/WF14048
Filkov, A. I., Prohanov, S., Mueller, E., Kasymov, D., Martynov, P., ElHoussami, M., et al. (2017). “Investigation of firebrand production during prescribed fires conducted in a pine forest,” in Proceedings of the Combustion Institute, Vol. 36, 3263–3270. doi: 10.1016/j.proci.2016.06.125
Foote, E. I., Liu, J., and Manzello, S. L. (2011). “Characterizing firebrand exposure during wildland urban interface fires,” in Proceedings of Fire and Materials 2011 Conference, Interscience Communications (London). Available online at: https://tsapps.nist.gov/publication/get_pdf.cfm?pub_id=907530
Ganteaume, A., Lampin-Maillet, C., Guijarro, M., Hernando, C., Jappiot, M., Fonturbel, T., et al. (2009). Spot fires: fuel bed flammability and capability of firebrands to ignite fuel beds. Int. J. Wildl. Fire 18, 951–969. doi: 10.1071/WF07111
Gould, J. S., McCaw, W. L., Cheney, N. P., Ellis, P. F., Knight, I. K., and Sullivan, A. L., (eds.). (2008). Project Vesta - Fire in Dry Eucalypt Forest: Fuel Structure, Fuel Dynamics and Fire Behaviour. Canberra, ACT; Perth, WA: CSIRO Publishing and Department of Environment and Conservation. doi: 10.1071/9780643101296
Hall, J., Ellis, P. F., Cary, G. J., Bishop, G., and Sullivan, A. L. (2015). Long-distance spotting potential of bark strips of a ribbon gum (Eucalyptus viminalis). Int. J. Wildl. Fire 24, 1109–1117. doi: 10.1071/WF15031
Houssaimi, E. M., Mueller,. E Filkov, A. I., and Simeoni, A. (2015). Experimental procedures characterising firebrand generation in wildland fires. https://www.researchgate.net/journal/0015-2684_Fire_Technology Fire Technol. 52, 731–751. doi: 10.1007/s10694-015-0492-z
Kutiel, H. (2012). Weather conditions and forest fire propagation—The case of the carmel fire, december 2010. Isr. J. Ecol. Evol. 58, 113–122. doi: 10.1560/IJEE.58.2-3.113
Manzello, S. L., Maranghides, A., and Mell, W. E. (2007). Firebrand generation from burning vegetation. Int. J. Wildl. Fire 16, 458–462. doi: 10.1071/WF06079
Manzello, S. L., Maranghides, A., Shields, J. R., and Mell, W. E. (2008). Mass and size distribution of firebrands generated from burning Korean pine (Pinus koraiensis) trees. Fire Mater. 33, 21–31. doi: 10.1002/fam.977
Manzello, S. L., Park, S. H., Suzuki, S., Shields, J. R., and Hayashi, Y. (2011). Experimental investigation of structure vulnerabilities to firebrand showers. Fire Saf. J. 46, 568–578. doi: 10.1016/j.firesaf.2011.09.003
Manzello, S. L., and Suzuki, S. (2014). Exposing decking assemblies to continuous wind-driven firebrand showers. Fire Saf. Sci. 11, 1339–1352. doi: 10.3801/IAFSS.FSS.11-1339
Oliveira, R. F. S., Quesada-Fernández, C., Viegas, D. X., Freitas, E. I., and Raposo, J. R. N. (2014). “Firebrand generator system applied to wildland-urban interface research,” in Advances in Forest Fire Research, ed D. X. Viegas (Coimbra: Imprensa da Universidade de Coimbra). doi: 10.14195/978-989-26-0884-6_84
Ribeiro, L. M., Oliveira, R., and Viegas, D. X. (2014). “The history of a large fire or how a series of events lead to 14000 Hectares burned in 3 days,” in Advances in Forest Fire Research, ed D. X. Viegas (Coimbra: Imprensa da Universidade de Coimbra). doi: 10.14195/978-989-26-0884-6_109
Rothermel, R. C. (1983). How to predict the spread and intensity of forest and range fires. USDA Forest Service, Intermountain Forest and Range Experiment Station, General Technical Report INT-143 (Ogden, UT). Available online at: http://www.fs.fed.us/rm/pubs_int/int_gtr143.pdf doi: 10.2737/INT-GTR-143
San-Miguel-Ayanz, J., de Rigo, D., Caudullo, G., Houston Durrant, T., and Mauri, A. (2016). European Atlas of Forest Tree Species. Publication Office of the European Union, Luxembourg. Available online at: http://forest.jrc.ec.europa.eu/european-atlas-of-forest-tree-species/atlas-download-page
Suzuki, S., Manzello, S. L., Lage, M., and Laing, G. (2012). Firebrand generation data obtained from a full-scale structure burn. Int. J. Wildl. Fire 21, 961–968. doi: 10.1071/WF11133
Tarifa, C. S., del Notario, P. P., Moreno, F. G., and Villa, A. R. (1967). Transport and Combustion of Firebrands. Instituto Nacional de Tecnica Aeroespacial, Report no. Grants FG-SP-114, FG-SP-146.
Tohidi, A., Kaye, N., and Bridges, W. (2015). Statistical description of firebrand size and shape distribution from coniferous trees for use in Metropolis Monte Carlo simulations of firebrand flight distance. Fire Saf. J. 77, 21–35. doi: 10.1016/j.firesaf.2015.07.008
Viegas, D. X., Almeida, M., Raposo, J., Oliveira, R., and Viegas, C. X. (2014). Ignition of mediterranean fuel beds by several types of firebrands. Fire Technol. 50, 61–77. doi: 10.1007/s10694-012-0267-8
Viegas, D. X., Almeida, M. F., Ribeiro, L. M., et al. (2017). O Complexo dos Incêndios de Pedrógão Grande e Concelhos Limítrofes, iniciado a 17 de Junho de 2017 [The Pedrógão Grande and Border Councils Fire Complex, started on June 17, 2017]. Available online at: https://www.portugal.gov.pt/download-ficheiros/ficheiro.aspx?v=3bb9773b-59fb-4099-9de5-a22fdcad1e3b
Viegas, D. X., Almeida, M. F., Ribeiro, L. M., et al. (2019). Análise dos Incêndios Florestais Ocorridos a 15 de Outubro de 2017 [Analysis of Forest Fires Occurring on October 15, 2017]. Available online at: https://www.portugal.gov.pt/download-ficheiros/ficheiro.aspx?v=c2da3d7e-dcdb-41cb-b6ae-f72123a1c47d
Viegas, D. X., Ribeiro, L. M., Almeida, M. A., et al. (2013). Relatório sobre os Dois Grandes Incêndios Florestais e os Acidentes Mortais ocorridos em 2013 [Report on the two major forest fires and fatal accidents in 2013]. Available online at: https://www.portugal.gov.pt/media/1281135/Relatório_IF2013_parte1.pdf
Waterman, T. E. (1969). Experimental Study of Firebrand Generation. IIT Research Institute, Project J6130 (Chicago, IL). Available online at: https://apps.dtic.mil/dtic/tr/fulltext/u2/695640.pdf
Keywords: spotting, spot fires, firebrands, wildfires, extreme fire behavior, fire modeling, fire spread, trees
Citation: Almeida M, Porto L and Viegas D (2021) Characterization of Firebrands Released From Different Burning Tree Species. Front. Mech. Eng. 7:651135. doi: 10.3389/fmech.2021.651135
Received: 15 January 2021; Accepted: 22 April 2021;
Published: 24 May 2021.
Edited by:
Melanie C. Rochoux, Centre Europeen de Recherche et de Formation Avancee en Calcul Scientifique, FranceReviewed by:
Ali Tohidi, San Jose State University, United StatesWei Tang, National Institute for Occupational Safety and Health (NIOSH), United States
Copyright © 2021 Almeida, Porto and Viegas. This is an open-access article distributed under the terms of the Creative Commons Attribution License (CC BY). The use, distribution or reproduction in other forums is permitted, provided the original author(s) and the copyright owner(s) are credited and that the original publication in this journal is cited, in accordance with accepted academic practice. No use, distribution or reproduction is permitted which does not comply with these terms.
*Correspondence: Miguel Almeida, miguelalmeida@adai.pt