Antarctic sonobuoy surveys for blue whales from 2006-2021 reveal contemporary distribution, changes over time, and paths to further our understanding of their distribution and biology
 Brian S. Miller1*
  Virginia Andrews-Goff1
  Jay Barlow2
  Elanor Bell1
  Susannah Calderan1,3
  Michael C. Double1 Jason Gedamke1,4
  Nat Kelly1
  Sarah Laverick1,5
  Russell Leaper1,6 Elanor J. Miller1,7 Kym Reeve1,8 Ana Širović9
  Kathleen M. Stafford2
- 1Australian Antarctic Division, Kingston, TAS, Australia
- 2Marine Mammal Institute, Oregon State University, Newport, OR, United States
- 3Scottish Association for Marine Science, Oban, United Kingdom
- 4Office of Science and Technology, National Oceanic and Atmospheric Administration (NOAA) Fisheries, Silver Spring, MD, United States
- 5Blue Planet Marine, Canberra, ACT, Australia
- 6International Fund for Animal Welfare, London, United Kingdom
- 7Independent Researcher, Hobart, TAS, Australia
- 8Independent Researcher, Nelson, New Zealand
- 9Trondhjem Biological Station, Department of Biology, Norwegian University of Science and Technology, (NTNU), Trondheim, Norway
Seven passive acoustic surveys for marine mammal sounds were conducted by deploying sonobuoys along ship tracks during Antarctic voyages spanning years 2006-2021. These surveys included nearly 330° of longitude throughout Antarctic (south of 60°S) and sub-Antarctic (between 50-60°S) latitudes. Here, we summarise the presence of calls from critically endangered Antarctic blue whales (Balaenoptera musculus intermedia) detected on all seven of these surveys. We describe and compare the spatial distribution of detections of three different types of Antarctic blue whale calls: unit-A, Z-calls, and D-calls. Three sets of voyages partially overlapped spatially but in different years, providing three regions (Indian Sector, Dumont d’Urville Sea, Ross Sea) to investigate differences over time for these three different call types. The proportion of sonobuoys with calls present was significantly higher in the more recent years for seven of the 15 combinations of years, regions, and call type. The proportion of sonobuoys with calls present was significantly lower only for one of the 15 combinations (unit A in the Ross Sea between 2015 vs 2017), and not significantly different for the remaining seven pairwise comparisons. We discuss possible explanations for these observations including: differences in probability of detection, whale behaviour, whale distribution, and abundance. These explanations are not mutually exclusive and cannot yet be resolved without application of complex analytical methods and collection of additional data. Lastly, we discuss future work that could help clarify the contributions of each of these potential drivers of acoustic detection. We propose continued acoustic data collection, application of new analytical methods, and collection of other synergistic data from Antarctic blue whales on their feeding grounds as a basis for future work on this species. This could provide a cost effective and holistic means of monitoring their status after the effects of 20th century industrial whaling, as well as their responses to natural and anthropogenic changes to their main prey, Antarctic krill, and a changing climate.
Introduction
Antarctic blue whales (Balaenoptera musculus intermedia; henceforth ABWs) are the largest animals on the planet and were nearly extirpated during 20th century industrial whaling (Rocha et al., 2015). In 1966 in the face of severe population decline, the International Whaling Commission (IWC) prohibited the take of blue whales, and in 1982 agreed a moratorium on commercial whaling for all whale species and populations, including ABWs, starting from the 1985/1986 season onwards. Presently, the IUCN conservation status of ABWs is ‘critically endangered’ (Cooke, 2018), and there remain large knowledge gaps surrounding their modern-day distribution and abundance. In the absence of human-driven mortality from hunting, some Antarctic cetacean populations, such as Eastern Australian and southwest Atlantic humpback whales (Megaptera novaeangliae), have recovered rapidly (Noad et al., 2019; Zerbini et al., 2019; Baines et al., 2021). However, studies of some other species, such as sperm whales (Branch and Butterworth, 2001; Carroll et al., 2014) have not detected evidence of recovery. The most recent circumpolar population abundance estimate for ABWs had a mid-point of 1997/98, so is now more than 25 years out of date. Moreover, there were large uncertainties around the population trend from these surveys; the 95% confidence intervals on the estimated annual population growth rate spanned 1.6-14.8% (Branch, 2007). Thus, contemporary knowledge of the recovery of this subspecies is required by management organisations such as the International Whaling Commission (IWC).
Like other Antarctic rorquals (humpback whales, Antarctic minke whales, B. bonaerensis, and fin whales, B. physalus), ABWs primarily feed on Antarctic krill, Euphausia superba (Mackintosh et al., 1929; Mackintosh, 1966; Gaskin, 1976; Kawamura, 1980). There is also a fishery for Antarctic krill, managed by the Commission for the Conservation of Antarctic Marine Living Resources (CCAMLR), a 27-member international body (CCAMLR, 1980). In order to manage the existing, and potentially expanding krill fishery (Kawaguchi and Nicol, 2020) in a sustainable manner, CCAMLR requires information about the distribution, abundance, and krill consumption rates of ABWs, all of which presently represent substantial gaps in our knowledge of their life history. Article II of CCAMLR states that any harvesting activities shall be conducted following conservation principles that include the maintenance of ecological relationships. This ecosystem-based management approach is designed to afford protection to populations of whales, seals, and seabirds who are dependent on harvested species, such as Antarctic krill, as their primary food source. Ecosystem-based management not only aims to protect against reduction of harvested and dependent populations, but also to protect against situations that might interfere with restoration of depleted populations, such as ABWs (CCAMLR, 1980 Article II.3.b).
Since the early 2000s, a substantial amount of data collection on ABWs has relied upon passive acoustics e.g (Ljungblad et al., 1998; Širović et al., 2004; Rankin et al., 2005; Sirovic et al., 2006; Širović et al., 2009; Širović and Hildebrand, 2011; Gavrilov et al., 2012; Balcazar et al., 2015; Miller et al., 2015; Tripovich et al., 2015; Leroy et al., 2016; Miller et al., 2017; Shabangu et al., 2017; Thomisch, 2017; Shabangu et al., 2019; Miller et al., 2019a; Shabangu et al., 2020; Miller et al., 2021c; Letsheleha et al., 2022). ABWs produce only a few different types of sound, but most of these are distinctive to the subspecies, and are very low in frequency (i.e. <100Hz), and detectable over very large areas (Širović et al., 2007; Samaran et al., 2010; Miller et al., 2015; Shabangu et al., 2020). ABW sounds can be classified as either song or non-song, with the former category consisting of highly stereotyped units and calls often repeated at regular intervals (Figure 1). The song of ABWs is typically described as a 3-unit vocalisation (Rankin et al., 2005), and in the literature these three components are often referred to as units A, B, and C, with the full call (comprising all three units) often referred to as a Z-call e.g. see Miller et al. (2021c). In many studies, often only the first song unit, unit-A, is detected, and this is sometimes treated as a separate category from full Z-calls, though more often no distinction is made. When detected without units B and C, unit-A has been found to be produced with lower mean source level than it is when detected within Z-calls (Miller et al., 2021a).
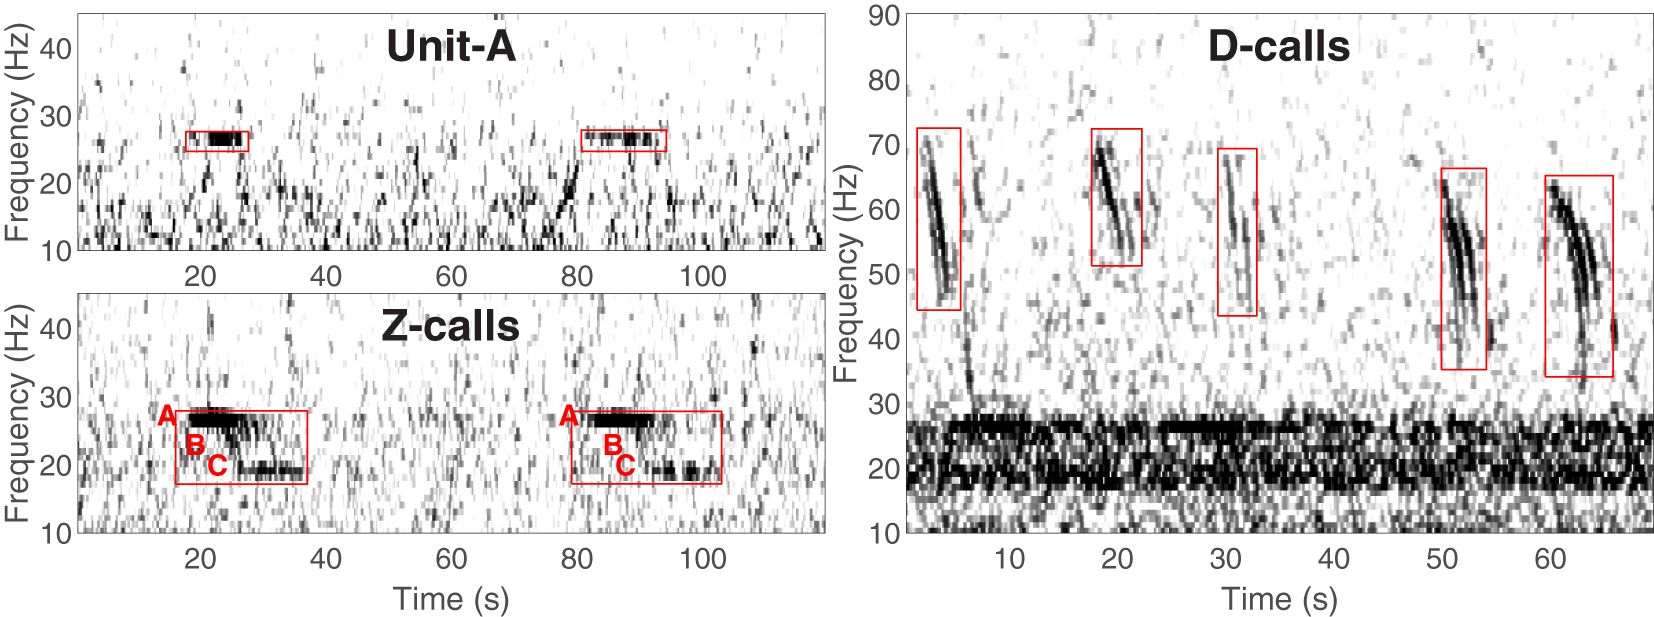
Figure 1 Spectrograms illustrating the different calls of Antarctic blue whales: song unit-A (top-left), non-song D-calls (right), and Z-calls with units A, B and C labelled with red text preceding the start of each unit (bottom left). Red boxes indicate the portions of the spectrogram that contains the calls. Figure adapted from (Miller et al., 2021c original figure licensed under creative commons).
The bulk of passive acoustic studies of ABWs have focused predominantly on song calls, which are distinctive from the songs of other populations of blue whales. This distinction allows for a straightforward means to differentiate ABW song from nearby populations of pygmy blue whales (B. m. brevicauda) that may share sub-Antarctic feeding grounds (Samaran et al., 2013). In other populations song has been found to be produced only by male blue whales (Oleson et al., 2007b; Lewis et al., 2018), and it is widely assumed that ABW songs are also only produced by males.
Non-song calls (Figure 1; D-calls) are produced by all populations of blue whales globally, including ABWs. Furthermore, non-song calls of blue whales may be of greater interest and relevance in the context of ecosystem-based management because they have been found to be produced by both sexes, are believed to be associated with feeding/foraging/groups of whales (McDonald et al., 2001; Oleson et al., 2007b; Lewis et al., 2018; Schall et al., 2020), and the number of callers has been found to be correlated with the number of sightings (Oleson et al., 2007a). Non-song calls of blue whales globally include calls known as D-calls (sometimes referred to as downswept calls or FM calls), as well as variable AM/FM calls (Thompson et al., 1996; Rankin et al., 2005; Berchok et al., 2006; Oleson et al., 2007b). Unlike song, the non-song calls of blue whales do not appear to be distinctive to particular populations. Thus, in areas such as the sub-Antarctic where ABW and pygmy blue whales are sympatric, the detection of non-song calls does not lead to an easy attribution to a particular population.
Taken together, song and non-song calls appear to be produced globally by blue whales throughout the year (Torterotot et al., 2020; Miller et al., 2021c; Torterotot et al., 2022; Wingfield et al., 2022). Due to low spatial coverage of high-latitude, year-round recording sites and limited understanding of seasonal distribution and migratory behaviour of ABWs, it remains an open question as to how call production rates (in contrast to call detection rates) of ABWs in particular, change over time.
The majority of contemporary passive acoustic studies of blue whales have been conducted using fixed (moored) recording devices. These devices typically have good temporal resolution and coverage (Van Parijs et al., 2009) often recording continuously over many years. However, the spatial coverage of these devices in the Southern Hemisphere has been uneven, and too sparse for most regions of the Antarctic to describe blue whale distribution with much fidelity and precision (Opzeeland et al., 2013).
In contrast to moored acoustic recorders used to obtain long time series of recordings, sonobuoy surveys from ships have been used to obtain short time series (hours) of recordings across broad spatial scales during Antarctic voyages. Over the past two decades, in-situ passive acoustic monitoring from sonobuoys has been conducted by the Australian Antarctic Division (AAD) on seven Antarctic voyages. The results from some of these sonobuoy surveys have been reported previously in peer reviewed literature (Gedamke and Robinson, 2010; Miller et al., 2015, 2016; Miller et al., 2019a). Others have only been included in institutional reports or multinational fora (Gales, 2010; Double et al., 2015; Miller et al., 2017), and the latest results from the TEMPO voyage in 2021 (Kelly et al., 2021) are presented here for the first time. This type of acoustic monitoring has been conducted for various purposes on each voyage, but typically with one of the goals being to obtain a synoptic view of blue whale distribution along the voyage track.
Taken together, these seven AAD sonobuoy surveys span approximately 330 degrees of longitude throughout sub-Antarctic and Antarctic latitudes (which we define here as 50-60°S and >60°S respectively). These short duration passive acoustic recordings (typically 1-3 h long) were conducted with a sampling interval of around 30 nmi, predominantly from late January through mid-March. Thus, these sonobuoy surveys comprise a synoptic source of information about Antarctic blue whale distribution in the summer on the feeding grounds. Furthermore, this information is considerably more up-to-date, than other data sources on ABWs, such as industrial whaling catches (spanning 1930-1965), IDCR-SOWER visual surveys (spanning 1978-2004) (Branch, 2007) and SOWER passive acoustic surveys (spanning 1997-2009) (Shabangu et al., 2017; Shabangu, 2020). Contemporary sonobuoy data may be useful for understanding the present-day distribution of ABWs in a changing climate (Read, 2023; Stewart et al., 2023), or in the context of changing krill abundance, distribution, and fishing practices in the Southern Ocean (Jefferies, 2018; Kawaguchi and Nicol, 2020; Pallin et al., 2023; Trathan, 2023a, b).
Methods
Sonobuoy deployments and recording
Sonobuoys on AAD surveys were deployed under roughly the same spatial and temporal sampling regimes on research voyages in 2006, 2010, 2013, 2015, 2017, 2019, and 2021. The spatial sampling regime was roughly every 30 nmi along the voyage track in order to acoustically cover the entire trackline. The temporal sampling regime was roughly every 3-6 hours around the clock. Sonobuoy deployments were weather dependent with deployments ceasing in heavy ice, when Beaufort Sea State was 7 or greater, or when wind speeds exceeded 30 knots as these conditions exceeded the limits at which sonobuoys can function reliably.
Two different calibrated recording setups were used to monitor radio signals transmitted from the sonobuoys (Miller et al., 2014c). The first setup was used in 2006 and 2010. This setup used a National Instruments data acquisition board with modified ICOM radio receivers, and is described in detail by Gedamke and Robinson (2010). The second set of recording equipment was in operation from 2013-2021. This included WinRadio radio receivers and Fireface UFX sound board for acoustic data acquisition and is described in detail by Miller et al (Miller et al., 2015, 2017; Miller et al., 2019a).
The make and model of sonobuoys varied across and within voyages, with four models being used in total: Omnidirectional 57A/B, and DIFAR 53D, 53F, and HIDAR 955. However, all of these models follow very similar, if not the same, military specifications and have hydrophones with the nominal frequency response all calibrated to within ± 3 dB (MIL-S-81487, 1996; Maranda, 2001). Nearly all sonobuoys deployed (>99.3%) were directional sonobuoys operating in analog directional analysis and frequency recording (DIFAR) mode which has a shaped frequency response that increases logarithmically in frequency by 20 dB per decade from 10-1000 Hz, and with a reference pressure of 122 ± 3 dB re 1 uPa at 100 Hz (Maranda, 2001; Greene et al., 2004; Rankin et al., 2019).
Monitoring for blue whale calls
For all voyages except the TEMPO voyage in 2021, acoustic data received from sonobuoys were monitored in real-time by an acoustician and the results of this real-time in-situ monitoring during the voyage are what have been analysed and presented (Gales, 2010; Double et al., 2015; Miller et al., 2015, 2017; Miller et al., 2019a). However, recordings from 2006 were previously re-inspected systematically after the voyage by co-author JG and have been presented in (Gedamke and Robinson, 2010), so we have opted to use these observations instead of those collected in real time for that voyage. Recordings from the 2021 voyage were not monitored in real-time during the voyage and were only inspected after the voyage by co-author KR (Kelly et al., 2023). During monitoring and inspection acousticians both listened and looked at spectrograms of incoming data with the aim of detecting calls from blue whales and other species. Here we focus exclusively on ABW calls at latitudes higher than 50°S.
Calls from blue whales were classified into three categories: song unit-A, Z-calls, and D-calls as per Miller et al. (2021c). Accordingly, song unit-A consisted of only the first tonal unit of ABW song; Z-calls consisted of the full three unit call of ABW song (including unit-A); and D-calls included downswept calls as well as AM/FM calls that were believed to be from blue whales (Figure 1). D-calls that were detected south of 50°S were assumed to be produced by ABWs, whilst D-calls north of 50°S were assumed to be from pygmy blue whales. While this simple criterion may not perfectly resolve the ambiguity about which population produced D-calls in sympatric areas, it is in accord with boundaries suggested by results from prior sonobuoy and visual surveys (Branch et al., 2007; Miller et al., 2014b; Double et al., 2015; Miller et al., 2015), and tagging data (Double et al., 2014; Buchan and Quiñones, 2016; Möller et al., 2020; Andrews-Goff et al., 2022).
The presence or absence of each call type was summarised independently for each sonobuoy and the summarised results were also mapped to facilitate qualitative analysis of spatial trends. Additionally, the proportion of sonobuoys with detections were plotted as histograms in latitude, longitude, week of the year, and recording duration. Since spatial and temporal coverage was often opportunistic and uneven, we chose wide bin widths of 3 degrees in latitude, 30 degrees in longitude, 1 week in time since start of year, and 30 minutes in duration for these histograms. These choices aimed to focus the results on broad-scale spatial and temporal trends.
For all analyses we excluded sonobuoys deployed north of 50°S, and deployed during periods of acoustic targeting of whales which were conducted during the 2010, 2013, 2015, and 2019 voyages. This latter exclusion was applied because targeting of whales typically involves higher rates of deployment of sonobuoys in the vicinity of calling animals which would bias our results. These exclusions removed 13 sonobuoys from the 2010 voyage; the entirety of the 2013 voyage; recordings from 143 sonobuoys deployed predominantly in the Ross Sea from 8-14 Feb and 24 Feb - 2 Mar from the 2015 voyage; and a total of 100 sonobuoy recordings in 2019. Analyses were then conducted on the remaining 952 deployments. The acoustic recordings, summarised detections, and metadata for sonobuoy surveys from these voyages are all publicly available from the Australian Antarctic Data Centre (Table 1). The collated table of these data used for the analyses here is presented in the Supplementary Material.
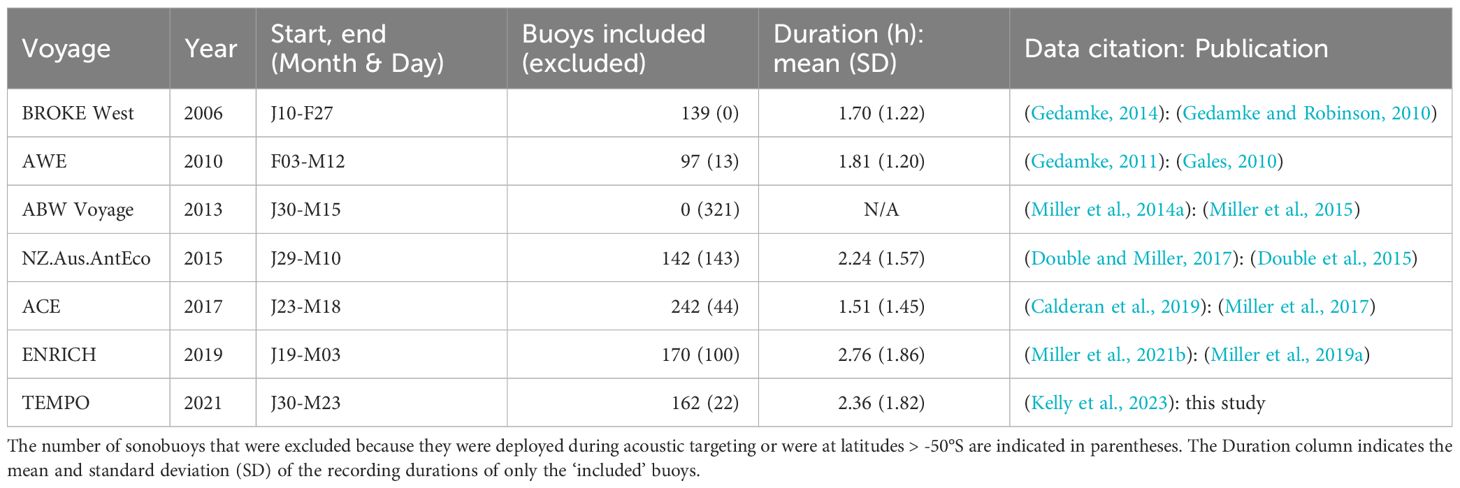
Table 1 Sonobuoy datasets from 2006-2021 used in this study.
Regional comparison of presence of detections over time
Three sets of voyages had spatial, but not temporal, overlap in the areas that were monitored. The three regions of comparison were 50-80°E (2006 vs. 2021); Dumont D’Urville (DDU) Sea (2017 vs. 2019); and Ross Sea (2010 vs. 2015 vs. 2017). As this spatial overlap occurred in different years, each set of voyages potentially offered an opportunity to look for changes in the presence of blue whale calls in those regions over time. For this very high level and simple, qualitative comparison, we used as our metric of presence the proportion of sonobuoys with detections for each category of call. Since these were all Antarctic surveys, the 60°S parallel was used as the northernmost boundary for all regional comparisons. For each site, planned pairwise comparisons of the proportions of buoys with detections across years were performed using the test for equality of proportions implemented in the R function prop.test from the stats package (R Core Team, 2022).
Results
Spatial and temporal distribution of calls
During the Austral summer, the stand-alone unit-A calls of ABWs were the most detected call type, and these were detected throughout most longitudes in the Antarctic and sub-Antarctic Southern Ocean. Z-calls, which include unit-A as well as units B & C, were the least detected calls from ABWs. These were observed mostly at high latitudes (Figures 2, 3). Blue whale D-calls were detected on more sonobuoys than Z-calls, but on fewer sonobuoys than unit-A (Figures 2, 3). These relative trends among call types were sustained across regions.
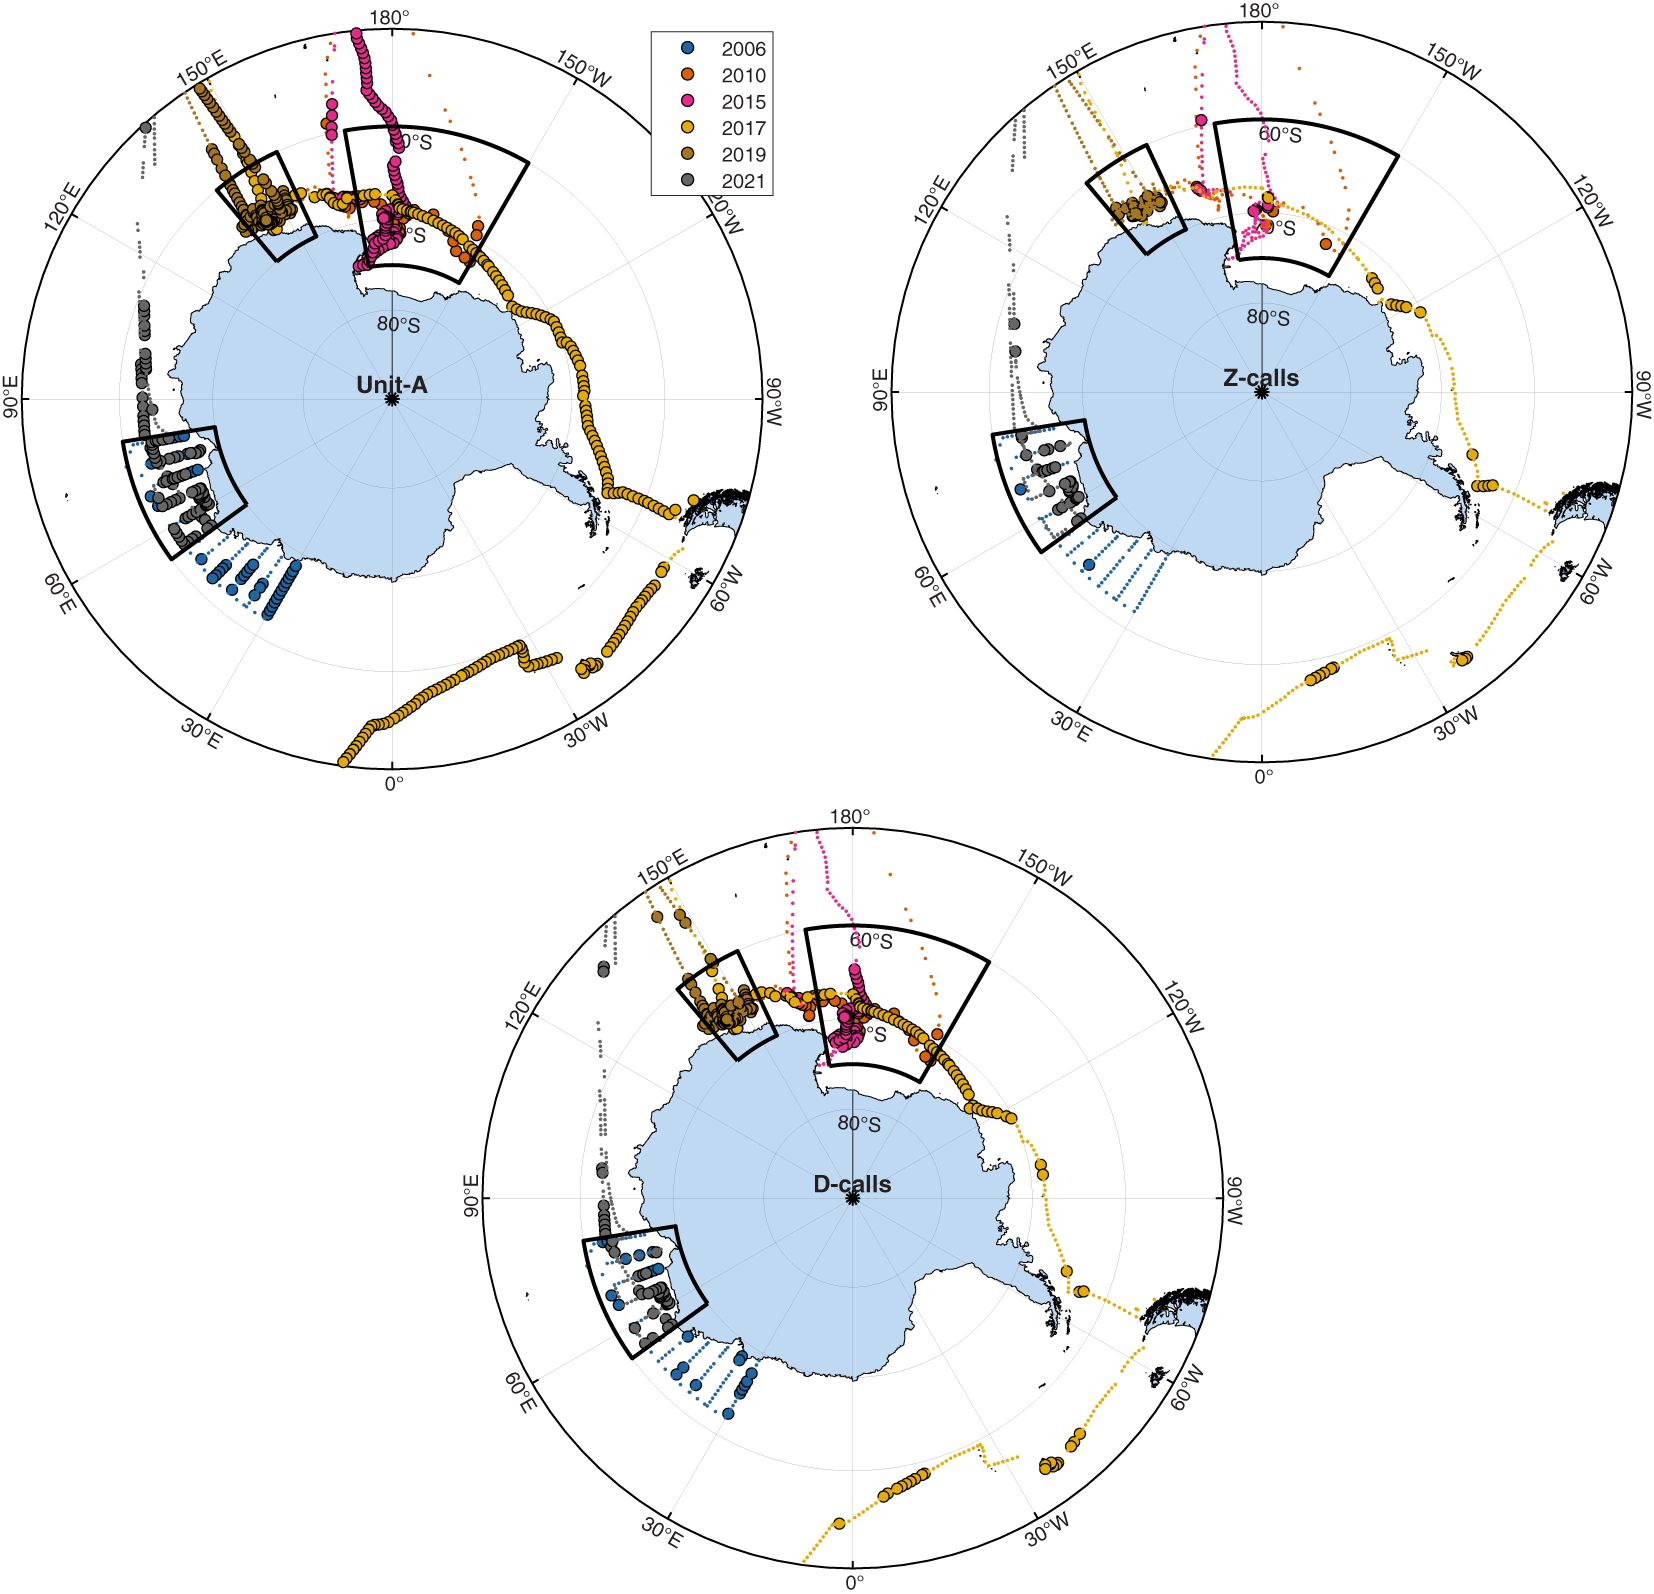
Figure 2 Maps illustrating sonobuoy deployment locations (small dots) and sonobuoys with detections present (circles with black outlines). Black boxes indicate areas used for regional comparisons over time. Panels from top-to-bottom indicate unit-A, Z-calls, and D-calls respectively. Maps created using M_Map software (Pawlowicz, 2019) with coastline data from the Global Self-consistent, Hierarchical, High-resolution Geography Database (Wessel and Smith, 1996).
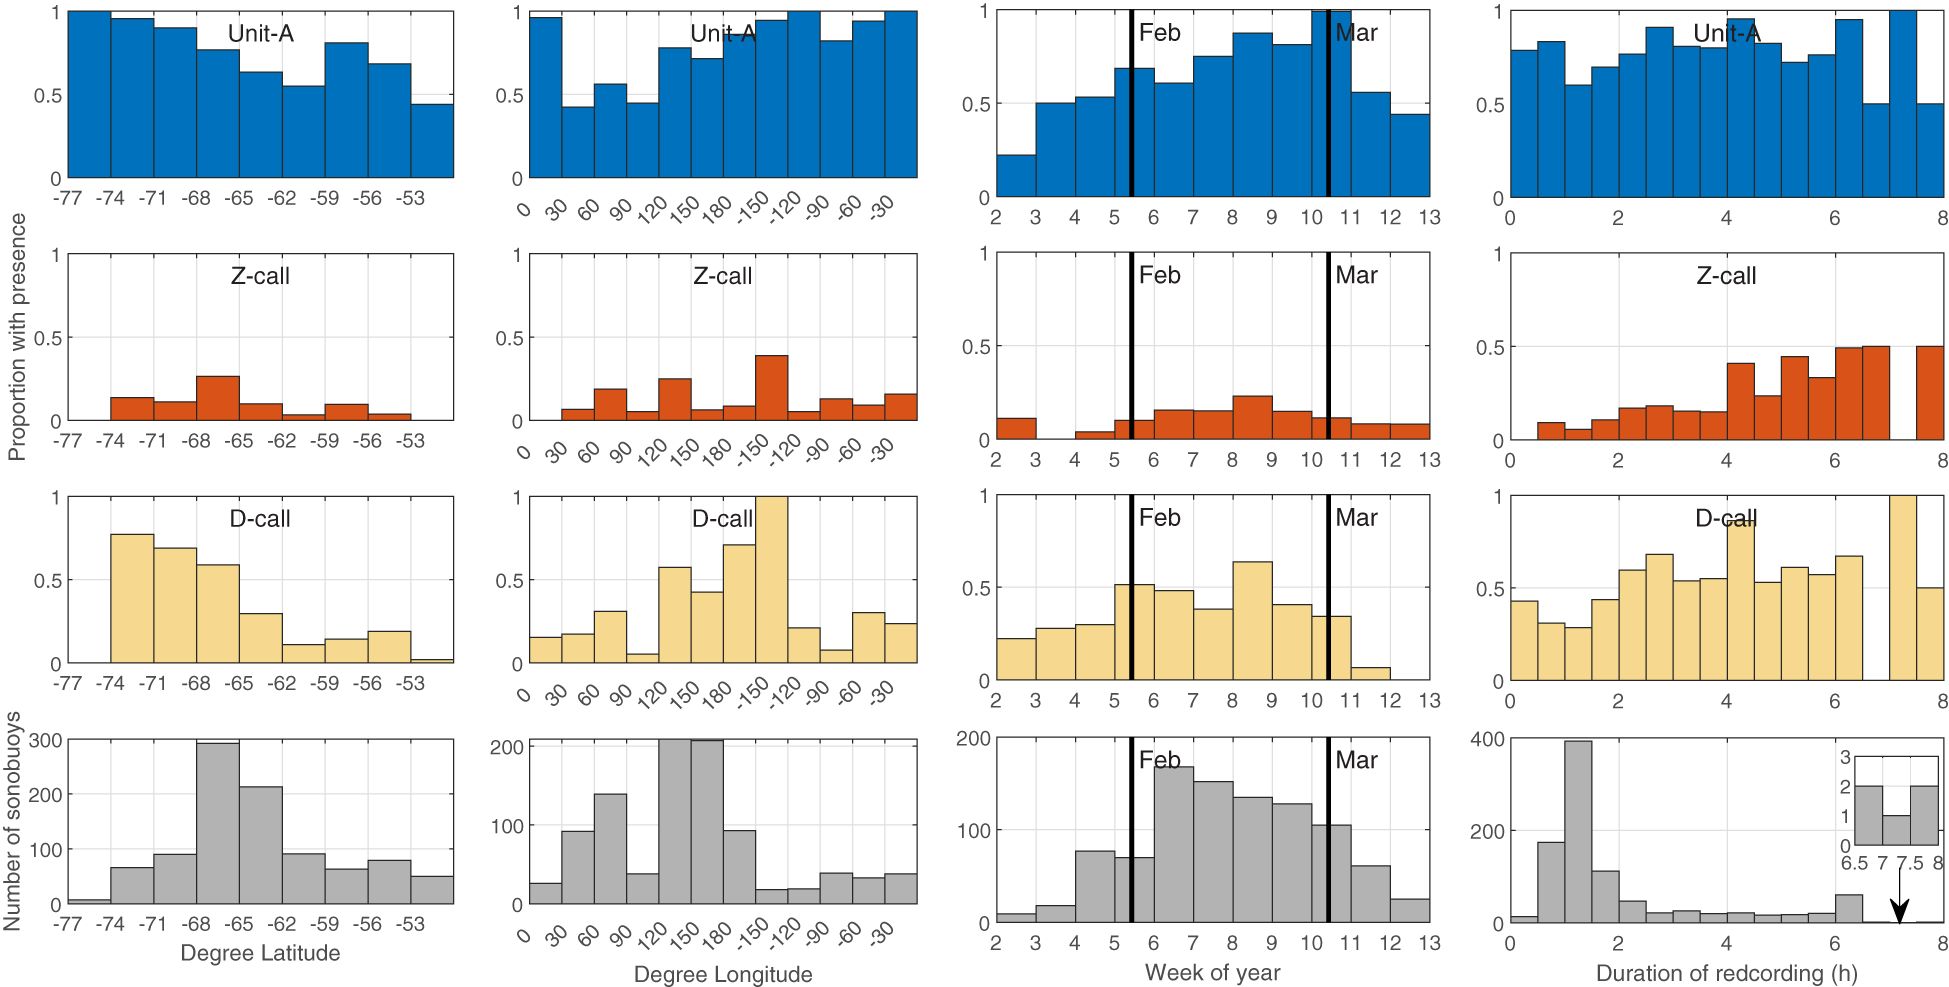
Figure 3 Proportion of sonobuoys with detection of Unit-A, Z-calls, and D-calls (blue, red, yellow bars respectively) by latitude in 3° bins (left column), longitude in 30° bins (second column) week of the year (third column) and recording duration (right column). Bottom panels indicate effort in the number of sonobuoys in each histogram bin. Thick black lines in the third column indicate the start of February and March. The inset in the bottom right panel shows a zoom of the histogram bins between 6.5-8 h.
Within the survey months of January-March, there were subtle differences in the timing of call types across surveys (Figure 3, third column of panels). Unit-A was detected from the start through the end of the survey effort and appeared to increase throughout the year. Z-calls were detected intermittently and least often in January, but were detected consistently from the start of February all the way through the end of voyage data collection (in early-mid March). D-calls showed the opposite of Z-calls, that is they were detected from the start of the voyages in mid-late January through February, but seemed to taper off with decreasing detection rates over March.
Recording duration did not show a strong effect on detection for unit-A, but it did seem to strongly affect probability of detecting Z-calls with proportion of buoys with detections increasing with longer recording duration. An increase in proportion of sonobuoys with presence of D-calls was also found with increasing duration, however the relationship for D-calls appeared noisier and less pronounced than that observed for Z-calls (Figure 3, fourth column of panels).
Regional comparison of detections (presence) across years
Across the three call types and three regions, 15 comparisons could be made (Figures 4, 5). Across seven of these comparisons, the proportion of sonobuoys with detections was significantly higher in the later sample at the 0.05 level. These included all call types in the Indian Sector from voyages in 2006 vs. 2021; for unit-A and Z-calls in the DDU sea in 2017 vs. 2019; and for unit-A in the Ross Sea between 2010 vs 2015 and D-calls in the Ross Sea in 2010 vs. 2017). Six of these seven comparisons yielded no statistically significant differences at the 0.05 level. One of the 15 comparisons yielded a statistically significant decrease in the more recent sample: unit-A decreased in the Ross Sea from a proportion of 1 (70/70) in 2015 to 0.906 (29/32) in 2017. See Supplementary Material for further details of the results of the tests of proportions for each pairwise comparison.
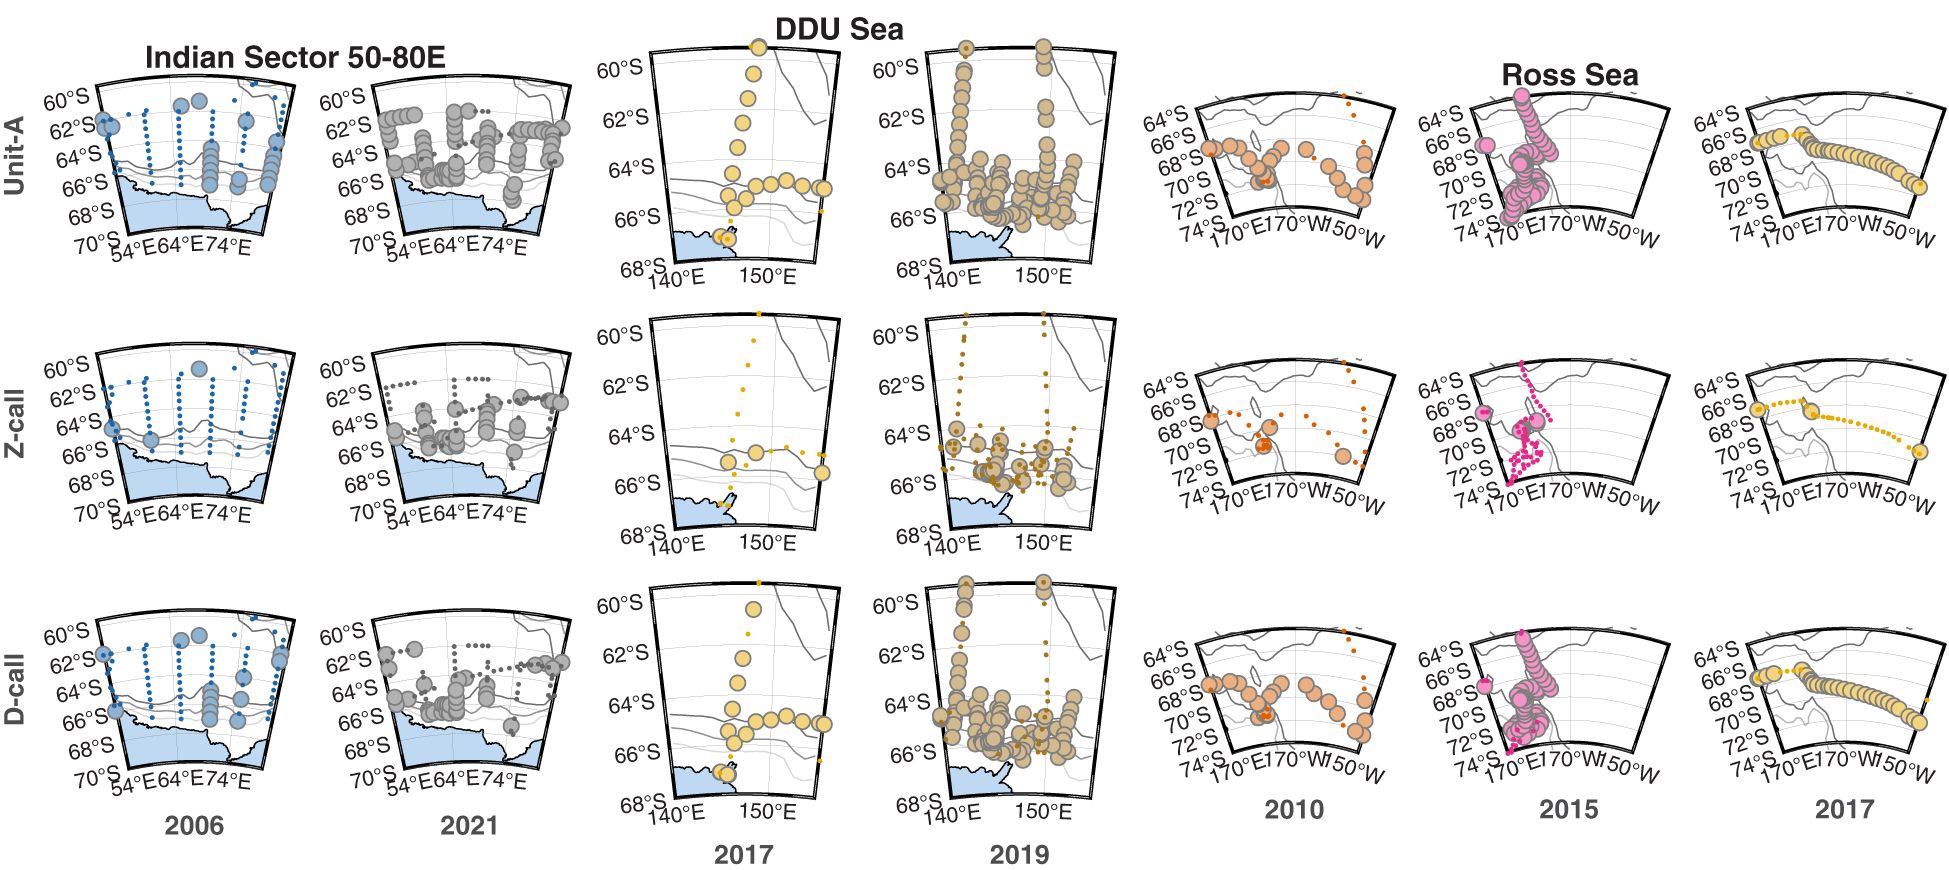
Figure 4 Three regional series of maps illustrating the sonobuoy deployment locations (small dots) and presence (large circles) of detections of three call types: Unit-A (top row), Z-calls (middle row), and D-calls (bottom row) across regions and voyages. Left and right panels in each pair show the oldest and most contemporary voyages respectively. Each set of six or nine panels represents a different area, with the first set (columns 1 & 2) representing the Indian Sector (50-80E), the second set (columns 3 & 4) representing the Dumont d’Urville (DDU) Sea, and the last set (columns 5, 6, & 7) representing the Ross Sea. Colours of symbols correspond to the year of survey (same as Figure 2) with each symbol 50% transparent to help indicate overplotting. Gray to black lines show the 1000, 2000, and 3000 m depth contours. Maps created using the software M_Map (Pawlowicz, 2019) and the Global Coastline Database (Wessel and Smith, 1996).
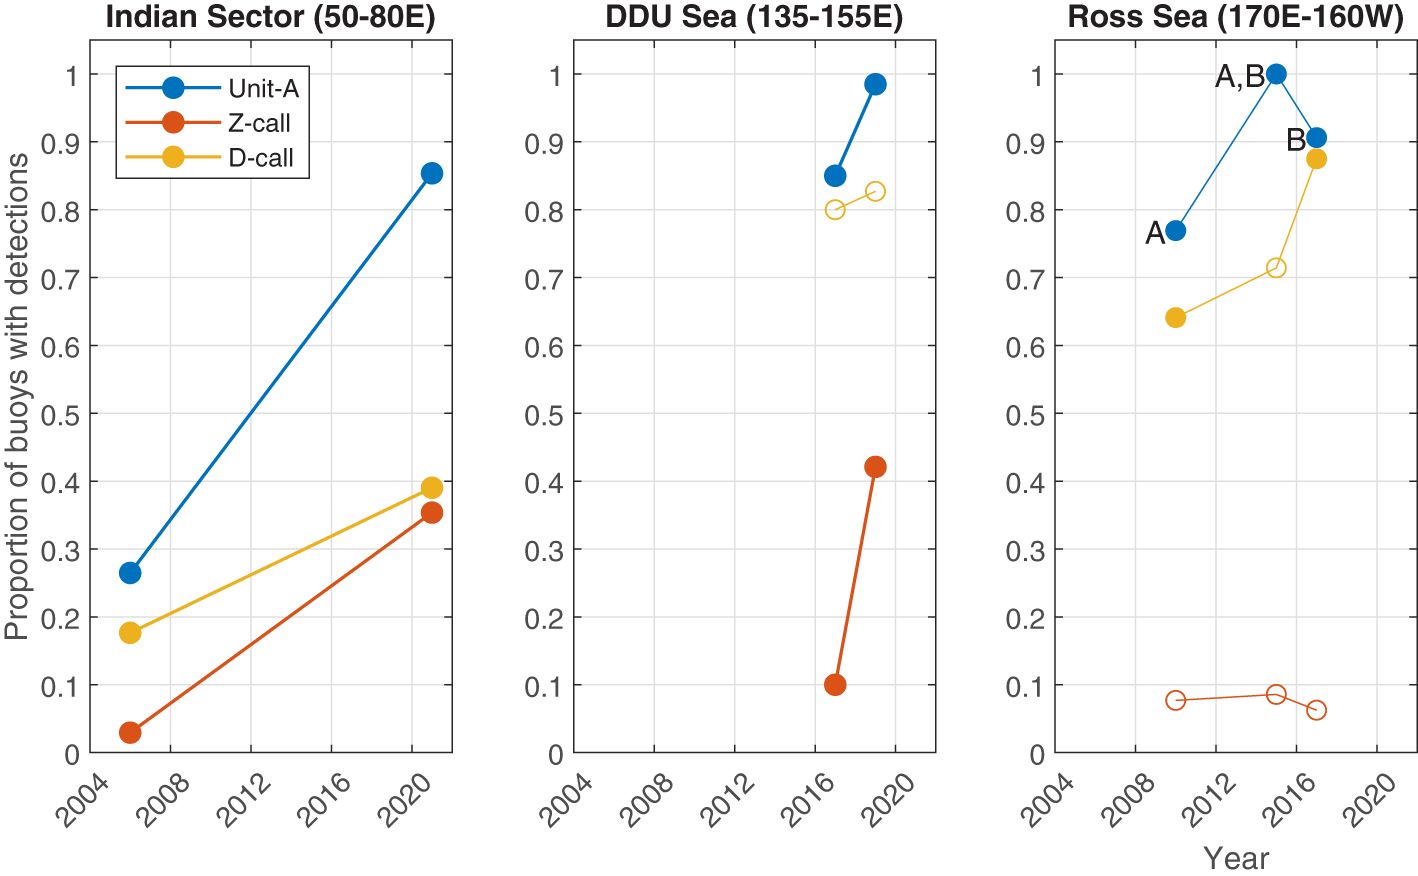
Figure 5 Regional comparisons from different voyages illustrating the proportion of sonobuoys with detections of Antarctic blue whale calls. Each panel shows a region with each line representing a call type. Filled circles indicate pairwise comparisons with statistically significant differences (where p<0.05). Letters A and B are used to identify which pairs were significantly different for unit-A in the Ross sea (i.e. 2010 and 2017 were each significantly different than 2015, but not each other).
Discussion
Spatial and temporal distribution of calls
The aggregate results from our passive acoustic surveys represent the most up-to-date synoptic data on the summer distribution of Antarctic blue whales (ABWs). The results indicate that ABWs still appear to have a circumpolar distribution throughout our study area, which included large portions of their historic Antarctic and sub-Antarctic feeding grounds. Furthermore, each of the three call types we detected had a different spatial distribution. Unit-A was the most widely distributed and was detected on the highest proportion of sonobuoys throughout the Antarctic and sub-Antarctic; Z-calls had the smallest and most discrete distribution concentrated at higher latitudes; and D-calls were intermediate between the two.
This relative spatial distribution among these call types is the same that was described by Miller et al. (2015) and Double et al. (2015) using data collected from sonobuoys deployed in 2013 and 2015, respectively. The 2013 voyage was not included here, and while the 2015 voyage was included in our circumpolar maps of distribution, large portions were excluded from our analysis of regional trends to avoid bias. During these 2013 and 2015 voyages, sonobuoys were predominantly used to track and find whales, instead of being deployed along designed survey tracks or during vessel transits between non-ABW-related destinations. The similarity in the results across the different surveys conducted over the years, regardless of whether sonobuoys were deployed during systematic spatial transects; transits from platforms of opportunity; or whale tracking for acoustically assisted mark-recapture, suggest that the relative probability of detection of these call types (compared to other call types in that voyage) is independent of survey design. That is to say that across all voyages and survey types Z-calls were always the least detected call type, unit-A the most detected call type, and D-calls intermediate between the two.
Furthermore, on the voyages that tracked down groups of ABWs in 2013, 2015, and 2019, there was a strong correlation among Z-calls, D-calls and sightings, but not unit-A and sightings (Double et al., 2015; Miller et al., 2015; Miller et al., 2019a). Thus, it would appear that these differences among call types are likely driven by different detectability, with unit-A being especially detectable. Bouffaut et al. (2021), estimated that unit-A and unit-C had the same source level, though only from calls from a single individual. Assuming those results are indicative of source levels of the whole population, then the higher detectability of unit-A could be driven by the fact that unit-A is a pure tone, whereas unit-B is a downsweep, and unit-C is usually slightly downswept. It is possible that the pure tone of unit-A may provide additional constructive interference via multipath arrivals that does not occur with the shorter duration downsweep, hence resulting in higher probability of detection for unit-A. Alternatively, the enhanced detectability of unit-A in our study might arise from an artefact or limitation of the sonobuoys themselves that results in some negative perception bias for unit-C. A known source of such a bias against unit-C and therefore also detection of full Z-calls, is the shaped filter contained within each sonobuoy (MIL-S-81487, 1996; Greene et al., 2004; Rankin et al., 2019). This filter nominally reduces signal power at 18 Hz (the frequency of unit-C) by 3.2 ± 3 dB compared to 26 Hz (the frequency of unit-A). How such a reduction in received levels at these two frequencies translates into detection range or probability of detection further depends in turn on the noise levels and transmission losses at each frequency. Both noise levels and transmission losses can vary considerably throughout and across surveys, so measurement and estimation of these are beyond the scope of this study. Nevertheless, our results highlight the question: what proportion of the detections of unit-A are truly produced as a “stand-alone” call, and what proportion are part of Z-calls that have less detectable units B and C? In addition to obtaining more source level measurements of unit-C, this question could potentially be answered by modelling the probability of detection of each unit, or by conducting focal follows and/or acoustic tagging studies to estimate the cue rates of both types of calls. We discuss both of these solutions further in the sections below.
In addition to spatial trends, there was also apparent seasonality of song and non-song calls observed in the Antarctic, with D-calls trending towards higher proportion of detections earlier in the summer feeding season, and song trending towards later in the summer, and early autumn. These trends were in accord with observations of seasonality of blue whale song and D-calls observed in the Eastern North Pacific (Oleson et al., 2007a).
Regional comparison of presence of detections over time
Our regional, qualitative comparison of the proportion of sonobuoys with detections revealed a significantly higher proportion with detections in later years for seven out of 15 call types and regions (p<0.05; Figure 5). A further seven comparisons were found not to have statistically significant differences. In only one instance, unit-A in the Ross Sea, was there a statistically significant decline in the more recent sample. Here the percentage of buoys with detections went from 100% in 2015 to 90% in 2017. The call types and regions without a difference in detection rate in the more contemporary voyages were the proportion of Z-calls in the Ross Sea and D-calls in the Dumont D’Urville (DDU) Sea. Respectively, these appeared to remain the same in 2017 as 2010 and decrease very slightly from 2017 to 2019. Although these changes in proportional presence of call types could be associated with changes in ABW abundance, it is important to acknowledge that this is only one of many possible explanations for the acoustic differences in these datasets, which include changes in probability of detection, whale behaviour, and distribution. These factors, and how future studies might address them, are discussed in the following section below.
The surveys in the Indian sector (50-80E) were the most systematic relative to the surveys in the other two regions. The Indian sector surveys followed the same transects, and thus covered the same area in the same manner 15 years apart (2006 vs 2021). These results showed the largest magnitude of changes in presence for all three call types. Further analysis of these surveys would seem to provide the best prospect of investigating changes attributable to distribution and/or abundance over time. At lower latitudes in the Indian Ocean around Australia, other studies have revealed that the acoustic power in the ABW song band (25-29 Hz) has also increased over time (McCauley et al., 2018). However, these low latitude increases over time could potentially be driven by the same multitude of factors as our Antarctic results.
In contrast to the surveys in the Indian sector, the 2019 ENRICH survey through the DDU Sea region aimed for systematic transects across bathymetric and latitudinal gradients, and these transects were adaptively centred on an area where calls of ABWs were initially detected. However, the sonobuoy deployments during the 2017 ACE voyage (contributing the sonobuoys used for the DDU Sea region comparison) were opportunistic, and the voyage track was planned to accommodate direct travel between various points of interest, predominantly glaciers and Antarctic Islands. No attempt was made to obtain uniform spatial coverage. Furthermore, the 2017 ACE voyage and the 2019 ENRICH voyage were conducted only two years apart. Thus it is unlikely that any differences associated with population changes would be detected given that maximum possible population growth rates are low (Branch, 2007). Additionally, there is a large disparity in the duration of the surveys, with the 2017 survey spending only a few days in the region, while the 2019 survey spent 30 days in the region. Further frustrating comparisons, the mean recording duration of sonobuoys deployed during the 2017 was the shortest of all the voyages we analysed, while that of the 2019 voyage was the longest. Thus, it is likely that any differences in detection between these voyages may be driven more by sampling artefacts or inter-annual variability in distribution and behaviour rather than changes in population abundance.
Focal follows of ABWs during the 2013, 2015, and 2019 voyages provide some evidence of different behaviours among these years. In particular, ABW movement rates in the DDU Sea in 2019 differed from those observed in the DDU and Ross Seas in 2013 and from those observed in the Ross Sea in 2015 (Calderan et al., 2023). Furthermore, high inter-annual variability in acoustic detections of fin whales has been observed from long-term acoustic recordings in the DDU Sea compared to other East Antarctic Seas (Aulich et al., 2022). Like blue whales, fin whales feed on Antarctic krill at high latitudes in the summer. Thus, the interannual variability of acoustic detections by both species, along with the high movement rates of blue whales in 2019 suggest that the DDU Sea may have habitat that is favourable to ABWs in some years, and unfavourable in others, and that their observable behaviours may reflect these conditions.
Similar to the 2017 ACE voyage, the 2010 AWE survey through the Ross Sea region was also opportunistic. But instead of direct transits among Antarctic glaciers and Islands, the 2010 AWE voyage focused primarily on humpback whales - collecting biopsy samples, photo-identification images and attaching satellite tags (Gales, 2010). The seven years between the AWE and ACE voyages was long enough that changes in ABW population abundance could potentially be detected. However, the drivers may also have been natural inter-annual variability in distribution, or the different spatial and temporal coverage of the surveys within the region. For example, the 2017 ACE voyage travelled through the Ross Sea from west to east via direct point-to-point travel, whereas the 2010 AWE voyage travelled from east to west via a meandering track in search of humpback whales. Though not included in our regional comparisons due to potential bias, the voyages in 2013 and 2015 both visited the western portion of the Ross Sea with numerous acoustically-assisted encounters of ABWs on both voyages. Across all these voyages, the Ross Sea had the highest effort of all the regions visited. This relatively high effort yielded a consistently high proportion of sonobuoys with detections of unit-A and D-calls. Movement rates of ABWs in the Ross Sea in 2015 were significantly slower than those in the DDU Sea in 2019, and this was due to higher rates of turning, suggestive of area restricted search behaviours typically associated with foraging (Calderan et al., 2023). Furthermore, krill swarm biomass, depth, and height were found to be good predictors of ABW presence in the Ross Sea in 2015 (Miller et al., 2019b). Taken together, this suggests that the Ross Sea was consistently an important foraging area for ABWs over these surveys. The longitude bin with the highest proportion of detections of all call types was also found to the east of the Ross Sea in the adjacent Amundsen Sea. However, the Amundsen Sea had the lowest survey effort, with data only collected during the 2017 voyage. In general, the central Pacific sector of the Antarctic remains scantily sampled for ABWs compared to most other parts of the Southern Ocean, so further data collection would be required to better understand the importance of this region to ABWs.
Drivers of acoustic trends in relation to future research and knowledge gaps
As we have already indicated, there are a number of factors that could be responsible for the changes in acoustic presence (or lack thereof) across regions and call types. These include change in the probability of call detection, change in whale behaviour, change in whale distribution, and change in whale abundance. These potential explanations are not mutually exclusive and can also interact in complex ways. Nevertheless, it is important that future work explores the drivers of acoustic trends and their link to ABW abundance, and that of other cetacean species, because passive acoustics likely present our best, most cost-effective and non-invasive method for monitoring populations long-term and in the face of environmental and climate change. However, in order to achieve this, resources will be required to overcome technological, logistical, biological and analytical challenges.
Fully accounting for all the possible drivers of each of these explanations would require additional efforts that are well beyond the scope of this manuscript. However, it is important to note that the means to address each of these explanations already exist. With further work, each of these potential drivers of acoustic trends could be considered as a hypothesis and could be investigated and accounted for in order to yield better knowledge of this critically endangered subspecies. Therefore, in the next section we briefly explore each of these factors in more detail and outline how they might be addressed with future research. This not only includes new and/or additional analysis of existing datasets, but also proposals for further at-sea studies of ABWs.
Changes in probability of detection
Estimating probability of detection of underwater sounds is challenging, with many factors that can strongly influence the results. These factors can be difficult to measure or even estimate, but include inter-alia: the perception bias of the detectors, source levels of the calls, and the noise levels from wind, ice, other animals, and manmade sounds, as well as factors that affect acoustic propagation which in turn includes: distance, depths, bathymetry, seabed composition, and speed of sound all along the pathway that sound travels between the whale and detector. However, there are an increasing number of studies that demonstrate a variety of methods to measure, model, or otherwise account for these factors to better estimate probability of detection of whale calls. In general, these methods usually involve using an automated detector to count calls, and then application of a suite of additional methods to obtain call densities (Harris et al., 2013; Marques et al., 2013; Helble et al., 2013a; Harris et al., 2018; Thode et al., 2020).
Call densities are counts of calls per unit area and per unit time, and these are also typically corrected for observer bias and effort. Call densities can yield a more detailed picture of spatial and temporal acoustic trends than the simple presence of detections that we have reported here. Obtaining call densities requires application of complex statistical methods that model the observation process, e.g., the passive sonar equation (Küsel et al., 2011; Harris, 2012; Helble et al., 2013b; Harris et al., 2018) and/or implementation of a fundamentally different survey design, e.g. point or line-transect acoustic distance sampling (Marques et al., 2013). Future studies could leverage the ongoing work on acoustic distance sampling or spatially explicit capture-recapture methods when designing surveys and data collection protocols (Harris et al., 2013; Thode et al., 2020; Blackwell et al., 2021; Oedekoven et al., 2021). These methods require arrays of concurrently deployed hydrophones, and would therefore require fundamentally different survey designs to those applied in the Antarctic to date, i.e. where a single-sonobuoy was deployed at each listening station.
Methods that model the observation process, such as sonar equation-based methods, are referred to as auxiliary information methods (Marques et al., 2013). These require knowledge or estimation of a substantial amount of additional information about sound production, propagation through the environment, and detection processes that can in turn be used to model the probability of detection. This information typically includes the key drivers of the parameters of the sonar equation, namely the relationship between signal-to-noise ratio and detection of individual calls; detector/observer bias; transmission loss of sound as it propagates through the environment; distribution of source level of calls; and distribution of noise levels throughout the survey. More recent advances in these techniques also allow for the use of bearing information, similar to those from the DIFAR sonobuoys used here, to estimate fine-scale call density surfaces within the areas monitored (Harris et al., 2018). If knowledge of the call production rates and proportion of population calling is available, then call densities can be multiplied by these quantities in order to estimate animal density or local abundance in the survey area.
It is likely that both distance sampling and auxiliary information methods will be necessary to maximise value from historic and future acoustic surveys. Sonar equation (auxiliary information) based methods would provide a pathway for obtaining call densities from the existing datasets presented here. While new survey platforms, such as fleets of uncrewed underwater or surface vehicles (USVs), potentially each with reusable dipping DIFAR sensors or towed hydrophone arrays, might be better able to accommodate distance-sampling based methods. Additionally, the use of USVs could eliminate any issues of waste that might arise from the non-recovery of sonobuoys. But the success of such a fleet would be contingent on self-noise from the vessel and hydrophones being brought down to sufficiently low levels in the low frequency bands of ABW calls – a feat which could be quite an engineering challenge in itself. It is worth noting that despite the different approaches, both methods produce the same output: call densities. The key benefits of call densities obtained from these methods are that they can: 1) be made statistically robust, 2) be compared directly to each other, and 3) account for all factors except behaviour and abundance (assuming surveys have been appropriately designed). These benefits make call densities more suitable for drawing conclusions about the biology of these animals compared to the call presence per sonobuoy as we have presented here. Given the potential value-add to existing datasets, as well as the potential for even more efficient passive acoustic surveys in the future, the development, refinement, and application of these methods should be considered a priority area of focus for future acoustic work on ABWs. Development of these methods would also have value for other blue whale populations as well as other vocal baleen whale species, not just in the Antarctic, but potentially in all oceans.
Change in abundance
Acoustic assisted mark-recapture surveys (Peel et al., 2014) are likely to remain the most cost-effective way to account for changes in population abundance in ABWs (Peel et al., 2015). In brief, the acoustic assisted surveys proposed by Peel et al. (2015) involve using passive acoustics to more efficiently locate animals for (traditional) mark-recapture surveys using photographic or genetic identification of individual animals. The acoustic targeting of ABWs during the sonobuoy voyages in 2013, 2015, and 2019 were all examples of the acoustically assisted surveys described by Peel et al. (Peel et al., 2014, Peel et al., 2015). USVs, described above, would also likely provide excellent acoustic assistance in the form of near real-time detection, localisation, and call density estimation of ABWs. In many scenarios, particularly in the Antarctic, acoustic surveys from fleets of USVs could be more cost effective than in-situ deployment of sonobuoys from the limited number of crewed research, cargo, and icebreaking vessels that transit this remote region. The photographic and genetic estimates of whale abundance from acoustically-assisted capture-recapture studies could also be compared with acoustically-derived estimates of whale abundance (which in turn would be derived by multiplying the above described call densities from sonobuoys and/or moored recorders by the cue rates obtained from the tagging studies described below).
Change in whale behaviour
Sonobuoy surveys ultimately provide limited capacity to understand changes in whale behaviour. The sorts of behavioural changes that can be detected with sonobuoys are factors such as the duration of bouts of detections, or changes in the structure or nature of calls and call units. These types of changes are not fully representative of the behavioural changes that could drive acoustic trends over time. For example, sonobuoy surveys alone would provide no means of discerning whether the proportion of vocalising animals has changed. However, such studies have been successfully conducted on blue whales in other oceans using concurrent acoustic and visual focal follows and suction-cup acoustic recording tags (Oleson et al., 2007a, b; Lewis et al., 2018). In addition to the proportion of vocalising animals, such studies can also provide knowledge of call production rates and demographics of vocalising animals. Such knowledge is unlikely to be obtained purely from stand-alone acoustic studies, but could heavily influence detection rates, metrics of acoustic presence, and interpretation of trends. These studies also provide information about the depth distribution of vocalising animals, which is important for modelling detection range from acoustic propagation models (e.g. see Miller et al., 2021a). Near real-time detection, localisation, and call density estimation from a network of USVs, as proposed in the previous section, could greatly assist in locating both densely and sparsely aggregated groups of vocalising ABWs for such tagging and focal follow studies. However, care would need to be taken to ensure that targeting groups of vocalising whales does not bias the results.
Change in distribution
Assuming that probability of detection, changes in whale behaviour, and changes in population abundance can be, or have already been addressed, then changes in distribution would be the most likely remaining explanation for any residual changes over time. Such changes could be addressed by additional passive acoustic surveys at increasingly finer scales in regions of interest with increasing spatial and temporal coverage. Additionally or alternatively, further analysis of distribution with respect to environmental covariates could be conducted in a manner similar to analyses of the SOWER sonobuoy data (Shabangu et al., 2017). While such analyses could be conducted solely with presence of calls, a clearer signal would likely emerge from using call densities, or acoustically derived ABW densities as the response variable.
Synergies among proposed future research paths
The factors that might affect acoustic trends such as probability of detection, whale behaviour, abundance, and distribution may interact in complex ways. However, we have outlined above several proposed research paths that could potentially address all of these factors. Furthermore, there are many synergies among these proposed solutions. Addressing all of these factors would expand and add value to two decades’ of existing data, and would substantially improve our understanding of the distribution, life history, and population recovery of Antarctic blue whales and also be applicable to other species. Additionally, the proposed solutions to address these issues would also synergize with addressing knowledge gaps regarding whale abundance and distribution, and consumption rates and krill swarm preferences, to support management decisions undertaken by CCAMLR (CCAMLR, 2019 paragraph 5.17) and the IWC (Leaper and Childerhouse, 2014). For example, acoustic recording & accelerometry tags not only provide an estimate of acoustic cue rates, but can also be used to understand lunge (feeding) rates, a proxy for consumption (Nowacek et al., 2016). Further inter-disciplinary synergies beyond research on ABWs would also be highly tractable. For example, our proposed fleet of USVs could also be equipped with scientific echosounders to obtain information on krill in the vicinity of vocalising whales. This information could then be used to better understand the relationship between ABWs and krill (abundance, distribution, and swarm characteristics), via investigations similar to that described in previous studies of ABWs (Miller et al., 2019b) and other Antarctic whale species (Santora et al., 2010; Nowacek et al., 2011; Herr et al., 2016; Baines et al., 2022).
Conclusion
Sonobuoy surveys have provided the most contemporary data on the summer distribution of Antarctic blue whales (ABWs) on their Antarctic feeding grounds. The three classifications of calls that we investigated had different distributions relative to each other, but all appear to have a circumpolar distribution around the Antarctic and through the sub-Antarctic, but with Z-calls concentrated towards higher latitudes in the summer. Over multi-year to decadal timescales, the proportion of sonobuoys with presence of these three call types was predominantly higher in more recent surveys in the three regions where comparisons were viable.
To better understand these results and add value to these and other long-term datasets, we have outlined an efficient and holistic plan for future studies of ABWs. We propose continued synoptic passive acoustic surveys, but also several additional data collection and analytical methods that are synergistic. These methods include: refinement and application of call density analyses to existing sonobuoy and long-term acoustic datasets; development and deployment of fleets of USVs with reusable dipping DIFAR sensors or low-frequency towed hydrophone arrays for future passive acoustic data collection; tagging a substantial number of ABWs with high-resolution hydrophone accelerometry tags to understand acoustic cue rates and foraging rates; and acoustically assisted photographic identification and genetic capture-recapture studies to estimate population abundance. Thus, passive acoustic monitoring is poised to play a crucial role in future research addressing knowledge gaps about ABWs. These acoustic methods provide an efficient, cost-effective means for long-term monitoring of this endangered species, other species, and environmental variables, such as ice and waves, in the face of environmental change.
Data availability statement
The original contributions presented in the study are included in the article/Supplementary Material, further inquiries can be directed to the corresponding author/s.
Ethics statement
Data collection from sonobuoys during these studies was conducted under Notices of Determination and Authorisation provided by the Australian Antarctic Division for Australian Antarctic Science (AAS) projects #2655; 2683; 2941; 4102; 4512; 4600; 4636 as per the Antarctic Treaty (Environmental Protection) Act 1980 of Australia.
Author contributions
BM: Writing – review & editing, Writing – original draft, Visualization, Software, Project administration, Methodology, Investigation, Funding acquisition, Data curation, Conceptualization. VA-G: Writing – review & editing, Writing – original draft, Project administration, Funding acquisition. JB: Writing – review & editing, Writing – original draft, Methodology, Investigation, Data curation. EB: Writing – review & editing, Writing – original draft, Project administration, Funding acquisition. SC: Writing – review & editing, Writing – original draft, Methodology, Investigation, Data curation. MD: Writing – review & editing, Writing – original draft, Project administration, Funding acquisition. JG: Writing – review & editing, Software, Project administration, Methodology, Investigation, Funding acquisition, Data curation. NK: Writing – review & editing, Writing – original draft, Project administration, Funding acquisition, Conceptualization. SL: Writing – review & editing, Writing – original draft, Project administration, Methodology, Investigation, Data curation. RL: Writing – review & editing, Writing – original draft, Methodology, Investigation, Data curation. EM: Writing – review & editing, Writing – original draft, Project administration, Methodology, Investigation, Data curation. KR: Writing – review & editing, Writing – original draft, Methodology, Investigation, Data curation. AŠ: Writing – review & editing, Writing – original draft, Methodology, Investigation, Funding acquisition, Data curation. KS: Writing – review & editing, Writing – original draft, Methodology, Investigation, Funding acquisition, Data curation.
Funding
The author(s) declare financial support was received for the research, authorship, and/or publication of this article. This work was made possible with the support of numerous Australian Antarctic Science (AAS) Projects with gracious and excellent support from personnel at the Australian Antarctic Division. These projects include: AAS Project 2655: An integrated survey of the waters between 30 and 80 degrees East (CCAMLR Division 58.4.2); AAS Project 2683: Passive acoustic monitoring of Antarctic marine mammals; AAS Project 2941: Conservation and Management Science of Marine Mammals; AAS Project 4102: Population abundance, trend, structure and distribution of the endangered Antarctic blue whale; AAS Project 4512: Ensuring sustainable management of the krill fishery in waters off the Australian Antarctic Territory; AAS Project 4600: Conservation and management of Australian and Antarctic whales – post-exploitation status, distribution, foraging ecology and their role in the Southern Ocean ecosystem; AAS Project 4636: Sustainable Management of Antarctic Krill and Conservation of the Krill-based Ecosystem. The 2017 ACE voyage was a scientific expedition carried out under the auspices of the Swiss Polar Institute, supported by funding from the ACE Foundation and Ferring Pharmaceuticals with major funding provided by the Swiss Polar Institute and the Australian Antarctic Division. AŠ and KS were supported by grants from the US National Science Foundation Office of Polar Programs (1745930) and the International Whaling Commission’s Southern Ocean Research Partnership (IWC-SORP). Thanks to the CSIRO Marine National Facility (MNF) for its support in the form of sea time on RV Investigator, support personnel, scientific equipment and data management on the voyages in 2019 and 2021.
Acknowledgments
We thank the excellent crews and support staff of all the ships that were used to conduct these voyages: the RV Aurora Australis, FV Amaltal Explorer, RV Tangaroa, MV Akademik Treshnikov, and RV Investigator. Special thanks to the TEMPO ad-hoc sonobuoy team, Jez Bird, Derek Hamer, Angus Henderson, Joshua Smith, Maria Isabel Garcia Rojas, Rob King, Alicia Burns, Jessica Melvin, Madeleine Brasier, Christine Weldrick, Olivia Johnstone who all undertook sonobuoy preparation, deployment, and data acquisition during the 2021 voyage on top of their other full-time duties on the visual observation team and krill team. Thanks to Voyage Chief Scientists: Steve Nicol (2006), Nick Gales (2010), Richard O’Driscoll (2015), David Walton (2017), and So Kawaguchi (2021) for their patience and support at sea for this work. Thanks to Simon Wotherspoon for advice and code on implementing the log-odds statistical tests.
Conflict of interest
The authors declare that the research was conducted in the absence of any commercial or financial relationships that could be construed as a potential conflict of interest.
The reviewer JR declared a past co-authorship with the author JG.
Publisher’s note
All claims expressed in this article are solely those of the authors and do not necessarily represent those of their affiliated organizations, or those of the publisher, the editors and the reviewers. Any product that may be evaluated in this article, or claim that may be made by its manufacturer, is not guaranteed or endorsed by the publisher.
Supplementary material
The Supplementary Material for this article can be found online at: https://www.frontiersin.org/articles/10.3389/fmars.2024.1324816/full#supplementary-material
References
Andrews-Goff V., Bell E., Miller B., Wotherspoon S., Double M. (2022). Satellite tag derived data from two Antarctic blue whales (Balaenoptera musculus intermedia) tagged in the east Antarctic sector of the Southern Ocean. Biodivers. Data J. 10, e94228. doi: 10.3897/BDJ.10.e94228
Aulich M. G., Mccauley R. D., Miller B. S., Samaran F., Giorli G., Saunders B. J., et al. (2022). Seasonal distribution of the fin whale (Balaenoptera physalus) in antarctic and Australian waters based on passive acoustics. Front. Mar. Sci. 9, 1–15. doi: 10.3389/fmars.2022.864153
Baines M., Jackson J. A., Fielding S., Warwick-Evans V., Reichelt M., Lacey C., et al. (2022). Ecological interactions between Antarctic krill (Euphausia superba) and baleen whales in the South Sandwich Islands region – Exploring predator-prey biomass ratios. Deep Sea Res. Part I: Oceanogr. Res. Pap. 189, 103867. doi: 10.1016/j.dsr.2022.103867
Baines M., Kelly N., Reichelt M., Lacey C., Pinder S., Fielding S., et al. (2021). Population abundance of recovering humpback whales Megaptera novaeangliae and other baleen whales in the Scotia Arc, South Atlantic. Mar. Ecol. Prog. Ser. 676, 77–94. doi: 10.3354/meps13849
Balcazar N. E., Tripovich J. S., Klinck H., Nieukirk S. L., Mellinger D. K., Dziak R. P., et al. (2015). Calls reveal population structure of blue whales across the southeast Indian Ocean and southwest Pacific Ocean. J. Mammal. 96 (6), 1184–1193. doi: 10.1093/jmammal/gyv126
Berchok C. L., Bradley D. L., Gabrielson T. B. (2006). St. Lawrence blue whale vocalizations revisited: Characterization of calls detected from 1998 to 2001. J. Acoust. Soc. America 120, 2340. doi: 10.1121/1.2335676
Blackwell S. B., Thode A. M., Conrad A. S., Ferguson M. C., Berchok C. L., Stafford K. M., et al. (2021). Estimating acoustic cue rates in bowhead whales, Balaena mysticetus, during their fall migration through the Alaskan Beaufort Sea. J. Acoust. Soc. America 149, 3611–3625. doi: 10.1121/10.0005043
Bouffaut L., Landrø M., Potter J. R. (2021). Source level and vocalizing depth estimation of two blue whale subspecies in the western Indian Ocean from single sensor observations. J. Acoust. Soc. America 149, 4422–4436. doi: 10.1121/10.0005281
Branch T. A. (2007). Abundance of Antarctic blue whales south of 60 S from three complete circumpolar sets of surveys. J. Cetacean Res. Manage. 9, 253–262. doi: 10.47536/jcrm.v9i3
Branch T. A., Butterworth D. S. (2001). Estimates of abundance south of 60° S for cetacean species sighted frequently on the 1978/79 to 1997/98 IWC/IDCR-SOWER sighting surveys. J. Cetacean Res. Manage. 3, 251–270. doi: 10.47536/jcrm.v3i3
Branch T. A., Stafford K. M., Palacios D. M., Allison C., Bannister J. L., Burton C. L. K., et al. (2007). Past and present distribution, densities and movements of blue whales Balaenoptera musculus in the Southern Hemisphere and northern Indian Ocean. Mammal Rev. 37, 116–175. doi: 10.1111/j.1365-2907.2007.00106.x
Buchan S., Quiñones R. (2016). First insights into the oceanographic characteristics of a blue whale feeding ground in northern Patagonia, Chile. Mar. Ecol. Prog. Ser. 554, 183–199. doi: 10.3354/meps11762
Calderan S., Miller B. S., Leaper R. C., Miller E. (2019). Passive acoustic recordings from sonobuoys deployed during the Antarctic Circumnavigation Expedition 2017. Australian Antarctic Data Centre. doi: 10.4225/15/59D5A05F6050F
Calderan S. V., Leaper R., Andrews-Goff V., Miller B. S., Olson P. A., Reyes M. V. R., et al. (2023). Surfacing rates, swim speeds, and patterns of movement of Antarctic blue whales. Front. Mar. Sci. 10. doi: 10.3389/fmars.2023.1087967
Carroll G., Hedley S., Bannister J., Ensor P., Harcourt R. (2014). No evidence for recovery in the population of sperm whale bulls off Western Australia, 30 years post-whaling. Endangered Species Res. 24, 33–43. doi: 10.3354/esr00584
CCAMLR. (1980). Convention on the Conservation of Antarctic Marine Living Resources. Hobart, Tasmania, Australia: Commission for the Conservation of Antarctic Marine Living Resources.
CCAMLR. (2019). Report of the Thirty-eighth Meeting of the Commission (CCAMLR-38) (Hobart, Australia: CCAMLR). Available at: https://meetings.ccamlr.org/en/system/files?file=e-cc-38_0.pdf (Accessed October 13, 2023).
Cooke J. G. (2018). Balaenoptera musculus ssp. intermedia (Cambridge, UK: The IUCN Red List of Threatened Species), e.T41713A50226962. doi: 10.2305/IUCN.UK.2018-2.RLTS.T41713A50226962.en
Double M. C., Andrews-Goff V., Jenner K. C. S., Jenner M.-N., Laverick S. M., Branch T. A., et al. (2014). Migratory Movements of Pygmy Blue Whales (Balaenoptera musculus brevicauda) between Australia and Indonesia as Revealed by Satellite Telemetry. PloS One 9, e93578. doi: 10.1371/journal.pone.0093578
Double M., Miller B. S. (2017). Passive acoustic recordings from sonobuoys deployed during the NZ-Aus Antarctic Ecosystems Voyage 2015. Australian Antarctic Data Centre. doi: 10.4225/15/59BA06898FD65
Double M. C., Miller B. S., Leaper R., Olson P., Cox M. J., Miller E., et al. (2015). “Cruise report on blue whale research from the NZ/Aus Antarctic Ecosystems Voyage 2015 of the Southern Ocean Research Partnership,” in Paper submitted to the Scientific Committee of the International Whaling Commission. SC/66a/SH7. Cambridge, UK: International Whaling Commission, 1–22.
Gales N. (2010). “Antarctic Whale Expedition: Preliminary science field report and summary,” in Submitted to the Scientific Committee of the International Whaling Commission SC/62/O12. Ed. Tangaroa R. V. Cambridge, UK: International Whaling Commission, 21.
Gaskin D. E. (1976). The evolution, zoogeography and ecology of cetacea. Oceanog. Mar. Biol. Ann. Rev. 14, 247–346.
Gavrilov A. N., McCauley R. D., Gedamke J. (2012). Steady inter and intra-annual decrease in the vocalization frequency of Antarctic blue whales. J. Acoust. Soc. America 131, 4476–4480. doi: 10.1121/1.4707425
Gedamke J. (2011). Passive acoustic monitoring of Antarctic marine mammals. Australian Antarctic Data Centre. doi: 10.26179/4Z72-8984
Gedamke J., Robinson S. (2014). Marine mammal acoustic survey data from sonobuoy deployments on the BROKE-WEST Survey, Ver. 2. Australian Antarctic Data Centre. doi: 10.4225/15/53F54E16A74A1. Accessed: 2024-04-16.
Gedamke J., Robinson S. M. (2010). Acoustic survey for marine mammal occurrence and distribution off East Antarctica (30-80°E) in January-February 2006. Deep Sea Res. Part II: Topic. Stud. Oceanogr. 57, 968–981. doi: 10.1016/j.dsr2.2008.10.042
Greene C. R. Jr., McLennan M. W., Norman R. G., McDonald T. L., Jakubczak R. S., Richardson W. J. (2004). Directional frequency and recording (DIFAR) sensors in seafloor recorders to locate calling bowhead whales during their fall migration. J. Acoust. Soc. America 116, 799–813. doi: 10.1121/1.1765191
Harris D. V. (2012). Estimating whale abundance using sparse hydrophone arrays. Available at: https://research-repository.st-andrews.ac.uk/handle/10023/3463 (Accessed May 23, 2023).
Harris D., Matias L., Thomas L., Harwood J., Geissler W. H. (2013). Applying distance sampling to fin whale calls recorded by single seismic instruments in the northeast Atlantic. J. Acoust. Soc. America 134, 3522–3535. doi: 10.1121/1.4821207
Harris D. V., Miksis-Olds J. L., Vernon J. A., Thomas L. (2018). Fin whale density and distribution estimation using acoustic bearings derived from sparse arrays. J. Acoust. Soc. America 143, 2980–2993. doi: 10.1121/1.5031111
Helble T. A., D’Spain G. L., Campbell G. S., Hildebrand J. A. (2013a). Calibrating passive acoustic monitoring: Correcting humpback whale call detections for site-specific and time-dependent environmental characteristics. J. Acoust. Soc. America 134, EL400–EL406. doi: 10.1121/1.4822319
Helble T. A., D’Spain G. L., Hildebrand J. A., Campbell G. S., Campbell R. L., Heaney K. D. (2013b). Site specific probability of passive acoustic detection of humpback whale calls from single fixed hydrophones. J. Acoust. Soc. America 134, 2556–2570. doi: 10.1121/1.4816581
Herr H., Viquerat S., Siegel V., Kock K.-H., Dorschel B., Huneke W. G. C., et al. (2016). Horizontal niche partitioning of humpback and fin whales around the West Antarctic Peninsula: evidence from a concurrent whale and krill survey. Polar Biol. 39, 799–818. doi: 10.1007/s00300-016-1927-9
Jefferies C. S. (2018). International whale conservation in a changing climate: the ecosystem approach, marine protected areas, and the international whaling commission. J. Int. Wildl. Law Policy 21, 239–280. doi: 10.1080/13880292.2018.1547867
Kawaguchi S., Nicol S. (2020). “Krill Fishery,” in Fisheries and Aquaculture, vol. 9. Eds. Lovrich G., Thiel M. (New York, NY, USA: Oxford University Press). doi: 10.1093/oso/9780190865627.003.0006
Kawamura A. (1980). A review of food of balaenopterid whales. Sci. Rep. Whales Res. Inst. Tokyo 32, 155–197.
Kelly N., Bestley S., Burns A., Clarke L., Collins K., Cox M., et al. (2021). “An overview of the ecosystem survey to quantify krill abundance for krill monitoring and management in Eastern Sector of CCAMLR Division 58.4.2: Trends in Euphausiids off Mawson, Predators, and Oceanography “TEMPO.”,” in Paper submitted to the Scientific Committee of the Comission for the Conservation of Antarctic Marine Living Resources, vol. 26. (Hobart, Tasmania, Australia: Working Group on Ecosystem Monitoring and Management).
Kelly N., Collins K., Miller B. S. (2023). Cetacean acoustic presence by species: TEMPO 2021 Sonobuoys. Australian Antarctic Data Centre. doi: 10.26179/z2zn-j090
Küsel E. T., Mellinger D. K., Thomas L., Marques T. A., Moretti D., Ward J. (2011). Cetacean population density estimation from single fixed sensors using passive acoustics. J. Acoust. Soc. America 129, 3610–3622. doi: 10.1121/1.3583504
Leaper R., Childerhouse S. (2014). “Present and Future Conservation Management of Antarctic Baleen Whales,” in Antarctic Futures: Human Engagement with the Antarctic Environment. Eds. Tin T., Liggett D., Maher P. T., Lamers M. (Springer Netherlands, Dordrecht), 97–112. doi: 10.1007/978-94-007-6582-5_4
Leroy E. C., Samaran F., Bonnel J., Royer J. (2016). Seasonal and diel vocalization patterns of Antarctic blue whale (Balaenoptera musculus intermedia) in the Southern Indian Ocean: A multi-year and multi-site study. PloS One 11, e0163587. doi: 10.1371/journal.pone.0163587
Letsheleha I. S., Shabangu F. W., Farrell D., Andrew R. K., la Grange P. L., Findlay K. P. (2022). Year-round acoustic monitoring of Antarctic blue and fin whales in relation to environmental conditions off the west coast of South Africa. Mar. Biol. 169, 41. doi: 10.1007/s00227-022-04026-x
Lewis L. A., Calambokidis J., Stimpert A. K., Fahlbusch J., Friedlaender A. S., McKenna M. F., et al. (2018). Context-dependent variability in blue whale acoustic behaviour. R. Soc. Open Sci. 5. doi: 10.1098/rsos.180241
Ljungblad D. K., Clark C. W., Shimada H. (1998). A comparison of sounds attributed to pygmy blue whales (Balaenoptera musculus brevicauda) recorded south of the Madagascar Plateau and those attributed to ‘true’ blue whales (Balaenoptera musculus) recorded off Antarctica. Rep. Int. Whaling Commission 48, 439–442.
Möller L. M., Attard C. R. M., Bilgmann K., Andrews-Goff V., Jonsen I., Paton D., et al. (2020). Movements and behaviour of blue whales satellite tagged in an Australian upwelling system. Sci. Rep. 10, 21165. doi: 10.1038/s41598-020-78143-2
Mackintosh N. A. (1966). “The distribution of southern blue and fin whales,” in Whales, dolphins and porpoises. Ed. Norris K. S. (University of California Press, Berkeley and Los Angeles), 125–145.
Mackintosh N., Wheeler J., Clowes A. (1929). Southern blue and fin whales. Discovery Rep. 1, 257–540.
Maranda B. H. (2001). Calibration Factors for DIFAR Processing. Technical Memorandum DREA TM 2001-197 (Dartmouth, NS, Canada: Defence Research Establishment Atlantic Canada).
Marques T. A., Thomas L., Martin S. W., Mellinger D. K., Ward J. A., Moretti D. J., et al. (2013). Estimating animal population density using passive acoustics. Biol. Rev. 88, 287–309. doi: 10.1111/brv.12001
McCauley R. D., Gavrilov A. N., Jolliffe C. D., Ward R., Gill P. C. (2018). Pygmy blue and Antarctic blue whale presence, distribution and population parameters in southern Australia based on passive acoustics. Deep-Sea Res. Part II: Topic. Stud. Oceanogr. 157-158, 154–168. doi: 10.1016/j.dsr2.2018.09.006
McDonald M. A., Calambokidis J., Teranishi A. M., Hildebrand J. A. (2001). The acoustic calls of blue whales off California with gender data. J. Acoust. Soc. America 109, 1728–1735. doi: 10.1121/1.1353593
Miller B. S., Barlow J., Calderan S., Collins K., Leaper R., Olson P., et al. (2015). Validating the reliability of passive acoustic localisation: a novel method for encountering rare and remote Antarctic blue whales. Endangered Species Res. 26, 257–269. doi: 10.3354/esr00642
Miller B. S., Calderan S., Gillespie D., Weatherup G., Leaper R., Collins K., et al. (2016). Software for real-time localization of baleen whale calls using directional sonobuoys: A case study on Antarctic blue whales. J. Acoust. Soc. America 139, EL83–EL89. doi: 10.1121/1.4943627
Miller B. S., Calderan S., Leaper R. C., Collins K., Barlow J., Double M. (2014a). Passive acoustic data from sonobuoys deployed during the 2013 Antarctic Blue Whale Voyage. Australian Antarctic Data Centre. doi: 10.4225/15/53EC41A5230B1
Miller B. S., Calderan S., Leaper R., Miller E. J., Širović A., Stafford K. M., et al. (2021a). Source level of Antarctic blue and fin whale sounds recorded on sonobuoys deployed in the deep-ocean off Antarctica. Front. Mar. Sci. 8. doi: 10.3389/fmars.2021.792651
Miller B. S., Calderan S., Miller E., Širović A., Stafford K. M. (2021b). Recordings of underwater sound and detections of marine mammals from sonobuoys deployed during 2019 ENRICH Voyage. Australian Antarctic Data Centre. doi: 10.26179/W901-B438
Miller B. S., Calderan S., Miller E. J., Širović A., Stafford K. M., Bell E., et al. (2019a). “A passive acoustic survey for marine mammals conducted during the 2019 Antarctic voyage on Euphausiids and Nutrient Recycling in Cetacean Hotspots (ENRICH),” in Proceedings of ACOUSTICS 2019, , Cape Schanck, Victoria, Australia. 1–10 (Australian Acoustical Society).
Miller B. S., Collins K., Barlow J., Calderan S., Leaper R., McDonald M., et al. (2014b). Blue whale vocalizations recorded around New Zealand: 1964-2013. J. Acoust. Soc. America 135, 1616–1623. doi: 10.1121/1.4863647
Miller B. S., Gedamke J., Calderan S., Collins K., Johnson C., Miller E., et al. (2014c). “Accuracy and precision of DIFAR localisation systems: Calibrations and comparative measurements from three SORP voyages,” in Submitted to the Scientific Committee 65b of the International Whaling Commission, Bled, Slovenia. SC/65b/SH08, vol. 14. Cambridge, UK: International Whaling Commission.
Miller B. S., IWC SORP Acoustic Trends Working Group, Stafford K. M., Van Opzeeland I., Harris D., Samaran F., et al. (2021c). An open access dataset for developing automated detectors of Antarctic baleen whale sounds and performance evaluation of two commonly used detectors. Sci. Rep. 11, 806. doi: 10.1038/s41598-020-78995-8
Miller B. S., Miller E., Calderan S., Leaper R., Stafford K., Širović A., et al. (2017). “Circumpolar acoustic mapping of endangered Southern Ocean whales: Voyage report and preliminary results for the 2016/17 Antarctic Circumnavigation Expedition,” in Paper SC/67a/SH03 submitted to the Scientific Committee 67a of the International Whaling Commision, vol. 18. (Cambridge, UK: International Whaling Commission).
Miller E. J., Potts J. M., Cox M. J., Miller B. S., Calderan S., Leaper R., et al. (2019). The characteristics of krill swarms in relation to aggregating Antarctic blue whales. Sci. Rep. 9, 16487. doi: 10.1038/s41598-019-52792-4
MIL-S-81487 (1996). Military Specification for AN/SSQ-53D Sonobuoy, MIL-S-81487E(AS). Lakehurst, NJ USA: Naval Air Engineering Center, Systems Engineering and Standardization Department (SESD).
Noad M. J., Kniest E., Dunlop R. A. (2019). Boom to bust? Implications for the continued rapid growth of the eastern Australian humpback whale population despite recovery. Popul. Ecol. 61, 198–209. doi: 10.1002/1438-390X.1014
Nowacek D. P., Christiansen F., Bejder L., Goldbogen J. A., Friedlaender A. S. (2016). Studying cetacean behaviour: new technological approaches and conservation applications. Anim. Behav. 120, 235–244. doi: 10.1016/j.anbehav.2016.07.019
Nowacek D. P., Friedlaender A. S., Halpin P. N., Hazen E. L., Johnston D. W., Read A. J., et al. (2011). Super-aggregations of krill and humpback whales in Wilhelmina Bay, Antarctic Peninsula. PloS One 6, e19173. doi: 10.1371/journal.pone.0019173
Oedekoven C. S., Marques T. A., Harris D., Thomas L., Thode A. M., Blackwell S. B., et al. (2021). A comparison of three methods for estimating call densities of migrating bowhead whales using passive acoustic monitoring. Environ. Ecol. Stat 29, 101–125. doi: 10.1007/s10651-021-00506-3
Oleson E. M., Calambokidis J., Barlow J., Hildebrand J. A. (2007a). Blue whale visual and acoustic encounter rates in the southern California bight. Mar. Mammal Sci. 23, 574–597. doi: 10.1111/j.1748-7692.2007.02303.x
Oleson E. M., Calambokidis J., Burgess W. C., McDonald M. A., LeDuc C. A., Hildebrand J. A. (2007b). Behavioral context of call production by eastern North Pacific blue whales. Mar. Ecol. Prog. Ser. 330, 269–284. doi: 10.3354/meps330269
Opzeeland I. V., Samaran F., Stafford K., Findlay K., Gedamke J., Harris D., et al. (2013). Towards collective circum-Antarctic passive acoustic monitoring: The Southern Ocean Hydrophone Network (SOHN). Polarforschung 83, 47–61.
Pallin L. J., Kellar N. M., Steel D., Botero-Acosta N., Baker C. S., Conroy J. A., et al. (2023). A surplus no more? Variation in krill availability impacts reproductive rates of Antarctic baleen whales. Global Change Biol. 29, 2108–2121. doi: 10.1111/gcb.16559
Pawlowicz R. (2019). M_Map: A mapping package for Matlab. Version 1.4k. Available at: https://www.eoas.ubc.ca/$\sim$rich/map.html.
Peel D., Bravington M., Kelly N., Double M. C. (2015). “Designing an effective mark — recapture study of Antarctic blue whales,” in Ecological Applications, vol. 25 . Eds. Peel D., Bravington M., Kelly N., Double M. C. (Wiley on behalf of the Ecological Society of America Stable), 1003–1015. Available at: https://www.jstor.org/stable/24432105.
Peel D, Miller BS, Kelly N, Dawson S, Slooten E, Double MC (2014). A simulation study of acoustic-assisted tracking of whales for mark-recapture surveys. PloS One 9 (5), e95602. doi: 10.1371/journal.pone.0095602
Rankin S., Ljungblad D. K., Clark C. W., Kato H. (2005). Vocalisations of Antarctic blue whales, Balaenoptera musculus intermedia, recorded during the 2001/2002 and 2002/2003 IWC/SOWER circumpolar cruises, Area V, Antarctica. J. Cetacean Res. And Manage. 7, 13–20. doi: 10.47536/jcrm.v7i1
Rankin S., Miller B., Crance J., Sakai T., Keating J. L. (2019). Sonobuoy Acoustic Data Collection during Cetacean Surveys. NOAA Technical Memorandum NMFS SWFSC614, 1–36. San Diego, CA: U.S. Department of Commerce, NOAA Technical Memorandum NMFS-SWFSC614.
R Core Team. (2022). R: A language and environment for statistical computing. Available at: https://www.r-project.org/.
Read A. J. (2023). The ecology of whales in a changing climate. Science 382, 159–160. doi: 10.1126/science.adk4244
Rocha R. C. Jr., Clapham P. J., Ivashchenko Y. (2015). Emptying the oceans: A summary of industrial whaling catches in the 20th century. Mar. Fish. Rev. 76, 37–48. doi: 10.7755/MFR
Samaran F., Adam O., Guinet C. (2010). Detection range modeling of blue whale calls in Southwestern Indian Ocean. Appl. Acoust. 71, 1099–1106. doi: 10.1016/j.apacoust.2010.05.014
Samaran F., Stafford K. M., Branch T. A., Gedamke J., Royer J.-Y., Dziak R. P., et al. (2013). Seasonal and geographic variation of Southern blue whale subspecies in the Indian Ocean. PloS One 8, e71561. doi: 10.1371/annotation/01e9ce55-8fc3-4eda-964d-755ad7e70e72
Santora J. A., Reiss C. C. S., Loeb V. J. V., Veit R. R. R. (2010). Spatial association between hotspots of baleen whales and demographic patterns of Antarctic krill Euphausia superba suggests size-dependent predation. Mar. Ecol. Prog. Ser. 405, 255–269. doi: 10.3354/meps08513
Schall E., Di Iorio L., Berchok C., Filún D., Bedriñana-Romano L., Buchan S. J., et al. (2020). Visual and passive acoustic observations of blue whale trios from two distinct populations. Mar. Mammal Sci. 36, 365–374. doi: 10.1111/mms.12643
Shabangu F. (2020). Overview of the IWC SOWER cruise circumpolar acoustic survey data and analyses of Antarctic blue whale calls within the dataset. J. Cetacean Res. Manage. (special Issue) 4, 21–37. doi: 10.13140/RG.2.2.20607.02720
Shabangu F., Andrew R., Yemane D., Findlay K. (2020). Acoustic seasonality, behaviour and detection ranges of Antarctic blue and fin whales under different sea ice conditions off Antarctica. Endangered Species Res. 43, 21–37. doi: 10.3354/esr01050
Shabangu F. W., Findlay K. P., Yemane D., Stafford K. M., van den Berg M., Blows B., et al. (2019). Seasonal occurrence and diel calling behaviour of Antarctic blue whales and fin whales in relation to environmental conditions off the west coast of South Africa. J. Mar. Syst. 190, 25–39. doi: 10.1016/j.jmarsys.2018.11.002
Shabangu F. W., Yemane D., Stafford K. M., Ensor P., Findlay K. P. (2017). Modelling the effects of environmental conditions on the acoustic occurrence and behaviour of Antarctic blue whales. PloS One 12, e0172705. doi: 10.1371/journal.pone.0172705
Širović A., Hildebrand J. A. (2011). Using passive acoustics to model blue whale habitat off the Western Antarctic Peninsula. Deep Sea Res. Part II: Topic. Stud. Oceanogr. 58, 1719–1728. doi: 10.1016/j.dsr2.2010.08.019
Sirovic A., Hildebrand J. A., Thiele D. (2006). Baleen whale spatial patterns in the Scotia Sea during January and February 2003. J. Cetacean Res. Manage. 8, 161–171. doi: 10.47536/jcrm.v8i2
Širović A., Hildebrand J. A., Wiggins S. M. (2007). Blue and fin whale call source levels and propagation range in the Southern Ocean. J. Acoust. Soc. America 122, 1208–1215. doi: 10.1121/1.2749452
Širović A., Hildebrand J. A., Wiggins S. M., McDonald M. A., Moore S. E., Thiele D. (2004). Seasonality of blue and fin whale calls and the influence of sea ice in the Western Antarctic Peninsula. Deep Sea Res. Part II: Topic. Stud. Oceanogr. 51, 2327–2344. doi: 10.1016/j.dsr2.2004.08.005
Širović A., Hildebrand J. A., Wiggins S. M., Thiele D. (2009). Blue and fin whale acoustic presence around Antarctica during 2003 and 2004. Mar. Mammal Sci. 25, 125–136. doi: 10.1111/j.1748-7692.2008.00239.x
Stewart J. D., Joyce T. W., Durban J. W., Calambokidis J., Fauquier D., Fearnbach H., et al. (2023). Boom-bust cycles in gray whales associated with dynamic and changing Arctic conditions. Science 382, 207–211. doi: 10.1126/science.adi1847
Thode A. M., Blackwell S. B., Conrad A. S., Kim K. H., Marques T., Thomas L., et al. (2020). Roaring and repetition: How bowhead whales adjust their call density and source level (Lombard effect) in the presence of natural and seismic airgun survey noise. J. Acoust. Soc. America 147, 2061–2080. doi: 10.1121/10.0000935
Thomisch K. (2017). Distribution patterns and migratory behavior of Antarctic blue whales (Bremerhaven, Germany: Alfred-Wegener-Institut Helmholtz-Zentrum für Polar- und Meeresforschung Am). doi: 10.2312/BzPM_0707_2017
Thompson P. O., Findley L. T., Vidal O., Cummings W. C. (1996). Underwater sounds of blue whales Balaenoptera musculus in the Gulf of California, Mexico. Mar. Mammal Sci. 12, 288–293. doi: 10.1111/j.1748-7692.1996.tb00578.x
Torterotot M., Samaran F., Royer J.-Y. (2022). Long-term acoustic monitoring of nonstereotyped blue whale calls in the southern Indian Ocean. Mar. Mammal Sci. 39 (2), 594–610. doi: 10.1111/mms.12998
Torterotot M., Samaran F., Stafford K. M., Royer J.-Y. (2020). Distribution of blue whale populations in the Southern Indian Ocean based on a decade of acoustic monitoring. Deep Sea Res. Part II: Topic. Stud. Oceanogr. 179, 104874. doi: 10.1016/j.dsr2.2020.104874
Trathan P. N. (2023a). The future of the South Georgia and South Sandwich Islands marine protected area in a changing environment: The choice between industrial fisheries, or ecosystem protection. Mar. Policy 155, 105773. doi: 10.1016/j.marpol.2023.105773
Trathan P. N. (2023b). What is needed to implement a sustainable expansion of the Antarctic krill fishery in the Southern Ocean? Mar. Policy 155, 105770. doi: 10.1016/j.marpol.2023.105770
Tripovich J. S., Klinck H., Nieukirk S. L., Adams T., Mellinger D. K., Balcazar N. E., et al. (2015). Temporal segregation of the Australian and Antarctic blue whale call types (Balaenoptera musculus spp.). J. Mammal. 96 (3), 603–610. doi: 10.1093/jmammal/gyv065
Van Parijs S., Clark C. W., Sousa-Lima R. S., Parks S. E., Rankin S., Risch D., et al. (2009). Management and research applications of real-time and archival passive acoustic sensors over varying temporal and spatial scales. Mar. Ecol. Prog. Ser. 395, 21–36. doi: 10.3354/meps08123
Wessel P., Smith W. H. F. (1996). A global, self-consistent, hierarchical, high-resolution shoreline database. J. Geophys. Res. 101, 8741–8743. doi: 10.1029/96JB00104
Wingfield J. E., Rubin B., Xu J., Stanistreet J. E., Moors-Murphy H. B. (2022). Annual, seasonal, and diel patterns in blue whale call occurrence off eastern Canada. Endangered Species Res. 49, 71–86. doi: 10.3354/esr01204
Keywords: Antarctic blue whale, passive acoustic monitoring, sonobuoy, ecology, marine biology, Antarctic, Southern Ocean
Citation: Miller BS, Andrews-Goff V, Barlow J, Bell E, Calderan S, Double MC, Gedamke J, Kelly N, Laverick S, Leaper R, Miller EJ, Reeve K, Širović A and Stafford KM (2024) Antarctic sonobuoy surveys for blue whales from 2006-2021 reveal contemporary distribution, changes over time, and paths to further our understanding of their distribution and biology. Front. Mar. Sci. 11:1324816. doi: 10.3389/fmars.2024.1324816
Received: 24 October 2023; Accepted: 01 April 2024;
Published: 26 April 2024.
Edited by:
Todd Atwood, U.S. Geological Survey, United StatesReviewed by:
Holger Klinck, Cornell University, United StatesJohn P. Ryan, Monterey Bay Aquarium Research Institute (MBARI), United States
Copyright © 2024 Miller, Andrews-Goff, Barlow, Bell, Calderan, Double, Gedamke, Kelly, Laverick, Leaper, Miller, Reeve, Širović and Stafford. This is an open-access article distributed under the terms of the Creative Commons Attribution License (CC BY). The use, distribution or reproduction in other forums is permitted, provided the original author(s) and the copyright owner(s) are credited and that the original publication in this journal is cited, in accordance with accepted academic practice. No use, distribution or reproduction is permitted which does not comply with these terms.
*Correspondence: Brian S. Miller, brian.miller@aad.gov.au