Assessing mesopelagic fish diversity and diel vertical migration with environmental DNA
 Annette F. Govindarajan1*
  Joel K. Llopiz1
  Paul E. Caiger1,2
  J. Michael Jech3
  Andone C. Lavery4
  Helena McMonagle1,5
  Peter H. Wiebe1
  Weifeng (Gordon) Zhang4
- 1Biology Department, Woods Hole Oceanographic Institution, Woods Hole, MA, United States
- 2Institute of Marine Science, University of Auckland, Auckland, New Zealand
- 3National Oceanic and Atmospheric Administration (NOAA), Northeast Fisheries Science Center, Woods Hole, MA, United States
- 4Applied Ocean Physics and Engineering Department, Woods Hole Oceanographic Institution, Woods Hole, MA, United States
- 5School of Aquatic and Fishery Sciences, University of Washington, Seattle, WA, United States
Mesopelagic fishes are an important component of the world’s oceans in terms of their abundance, biomass, and ecosystem function. These fishes are important contributors to the biological carbon pump via their feeding and behaviors, whereby they facilitate the transfer of carbon from shallow waters to the deep sea. Several species undertake diel vertical migration, feeding in shallower waters at night and moving to deeper waters during the day. This process actively expedites the downward flux of carbon. However, carbon budgets and climate models require accurate information regarding the depth distributions and migration patterns of these fishes, and environmental DNA (eDNA) analyses can provide this information. Here, we utilize eDNA approaches, generating taxonomically-informative COI and 12S reference barcodes for 80 species of mesopelagic fishes, which can be used for species-level identification of eDNA sequences. Using these, along with a publicly available barcodes database, we compare results from eDNA analysis with traditional net sampling, and explore the ability of eDNA techniques to detect diel vertical migration in fishes from samples collected in Northwest Atlantic Slope Water. We found that eDNA and net samples often resulted in different species identifications, demonstrating that eDNA can detect species that would otherwise be missed with traditional methods. In our eDNA samples, we also detected more species (12) in our shallowest depth category (0 - 100 m) from night samples than from day samples (3). This is consistent with increased diversity in shallow waters at night due to diel vertical migration. Based on the variability observed in sample duplicates, we suggest that future mesopelagic eDNA studies incorporate larger sample volumes and scaled-up sampling efforts. We also note the potential applications of eDNA analysis in addressing ecological questions related to predator-prey relationships identification of foraging hotspots, and carbon flow through the ocean’s midwaters.
1 Introduction
Mesopelagic fishes are a critical component of the global ecosystem in terms of their biomass, abundance and ecological function. They comprise the majority of the world’s fish biomass, with estimates ranging from 2-16 billion tons (Proud et al., 2019). Mesopelagic bristlemouth fishes (family Gonostomatidae) are thought to be the most abundant vertebrates on the planet (Nelson, 2006). Many mesopelagic fish actively transport carbon from the surface to the deep sea through their vertical migration behaviors, moving up to productive surface waters to feed at night, and back down to depth during the day (Cavan et al., 2019; Saba et al., 2021). Non-migrating fish remineralize carbon through their metabolism (Sarmiento-Lezcano et al., 2022), but they may also contribute to downward carbon transport by consuming migrating zooplankton that would otherwise return to surface waters (Davison et al., 2013). The depth distributions, biomass, and behaviors of mesopelagic fishes, particularly of those that migrate, represent important knowledge gaps in our understanding of the biological carbon pump (Henson et al., 2022).
Ranging from 200 to 1000 m water depth, the mesopelagic environment is exceptionally vast and challenging to access, and consequently, it is poorly explored. Environmental DNA (eDNA) analysis could enable more efficient study of the region’s biodiversity to provide insights for understanding the biological carbon pump and to enable sustainable use of mesopelagic resources (Cavan et al., 2019; Saba et al., 2021). Specifically, metabarcoding analysis of eDNA samples provides “snapshots” of the diversity associated with the sampled water (e.g., Easson et al., 2020; Laroche et al., 2020; Canals et al., 2021; Govindarajan et al., 2021). Environmental DNA sampling is rapidly being incorporated into ecosystem monitoring programs (Mirimin et al., 2021; Ray et al., 2022; Stefanni et al., 2022), and metabarcoding sequence analysis of eDNA samples will provide important records of how biological communities are impacted by climate change and other anthropogenic stressors (Leduc et al., 2019; Lanzén et al., 2021; Miya, 2022).
Metabarcoding analyses require barcode libraries consisting of reference barcode sequences originating from specimens that have been previously identified for taxonomic assignment of the eDNA sequences (Duhamet et al., 2023). However, reference libraries are incomplete and may potentially contain sequences from specimens that have been misidentified (Lindsay et al., 2017; Bucklin et al., 2021). For fishes, the mitochondrial COI gene has been widely used for species identification (Bucklin et al., 2011; Bucklin et al., 2021). As a result of COI barcoding efforts, reference sequences for common mesopelagic fishes in the North Atlantic are publicly available (Kenchington et al., 2017). Indeed, in many cases, reference sequences from multiple specimens and geographic locations have been obtained, enabling detection of population-level variation and cryptic speciation (Kenchington et al., 2017; Christiansen et al., 2018).
With the introduction of high-throughput sequencing and metabarcoding, shorter barcode markers have become necessary. In particular for fishes, a short, hypervariable region of the 12S gene has become the barcode marker of choice. Miya et al. (2015) greatly enabled this approach by designing a “universal” primer pair (MiFish-U-F/R) that amplifies a wide variety of fish species and is able to resolve taxonomy to the species level in most cases, when reference sequences are available. However, there are fewer reference sequences for 12S than for COI (Stoeckle et al., 2021). Thus, it is critical that 12S reference libraries are developed in order for eDNA metabarcoding analyses to be useful for understanding mesopelagic phenomena such as diel vertical migration.
There are relatively few eDNA studies to date that focus on the mesopelagic environment and address diel vertical migration (Easson et al., 2020; Canals et al., 2021; Govindarajan et al., 2021; Feng et al., 2022). Environmental DNA studies have great potential to improve the detection of migrating fish species, many of whom may be missed by traditional net tows (Skjoldal et al., 2013) and cannot be identified from acoustic analyses (e.g., Wiebe et al., 2023). A recent modeling study evaluating the dispersal and fate of mesopelagic eDNA found that eDNA remains close to its source of origin in the vertical dimension, indicating that it should be able to detect migration patterns (Allan et al., 2021). However, while eDNA field data demonstrating vertical structure in biological communities are encouraging, observations are extremely limited (Easson et al., 2020; Canals et al., 2021; Govindarajan et al., 2021).
The goals of this study are to: 1) enable eDNA metabarcoding analyses of mesopelagic fish by obtaining new 12S reference barcode sequences for mesopelagic fish species; 2) assess the ability of eDNA analysis to detect mesopelagic fish species using both previously available reference barcodes and our new barcode sequences; and 3) explore the ability of eDNA analyses to detect the presence of diel vertical migration. For the first goal, we sequenced and analyzed mesopelagic fish specimens collected over the course of several cruises in the North Atlantic Ocean. For the second and third goals, we analyzed eDNA samples obtained from depths between the surface and 1000 m during day and night Conductivity Temperature Depth (CTD) casts on a 2018 cruise in the North Atlantic Slope Water. These samples were previously sequenced with the 18S V9 barcode marker, which, while useful for detecting a broad range of metazoan taxa, may not be suitable for fish (Govindarajan et al., 2021). Here, we applied 12S metabarcoding using the MiFish primer set on these samples and incorporated the new reference barcodes into the taxonomic assignment step. We compared fish species detected from the eDNA samples with those from net tows. We then compared fish species detected from eDNA samples from comparable depth categories during day and night casts. Lastly, to explore the representativeness of the CTD results, we compared fish species detected from duplicate samples taken at four depths during a single CTD cast.
2 Materials and methods
2.1 Reference library generation
Reference library generation consisted of collecting fish specimens, obtaining accurate identifications for those specimens through a combination of morphological analysis and COI barcoding, and then generating 12S barcode sequences. Fish specimens were collected using trawls and net tows from a series of cruises in the northwest Atlantic Ocean over the course of several years (Supplementary Table S1). Fish were identified based on morphological criteria (Carpenter, 2002; Sutton et al., 2020) and photographed. The photographs were deposited in Dryad (doi: 10.5061/dryad.cc2fqz6bp). A small amount of muscle tissue was dissected from each specimen and stored at -80°C until it was used for DNA extraction.
DNA was extracted using DNEasy Blood and Tissue kits (Qiagen, Germantown, MD, USA) following the manufacturer’s protocol. The COI barcode marker was PCR amplified using either the Folmer et al. (1994) HCO-LCO, or the Ward et al. (2005) Fish F1/R1 or Fish F2/R2 primer sets. Fifty µl PCR reactions were run consisting of 10 µl of buffer, 5 µl of Mg, and 0.3 µl Taq polymerase (all from the Promega GoTaq Flex kit), 2 µl of each primer (10 µM), 1-2 µl genomic DNA, and 23.7-24.7 µl water. The following PCR cycle was used for all primer sets: 95°C for 3 minutes, 35 cycles of 95°C for 30 seconds, 48°C for 30 seconds, and 72°C for 1 minute, and 72°C for 5 minutes. PCR products were visualized on a 1% agarose gel under UV light using GelRed (Biotium, Hayward, CA, USA). Successful amplifications were purified using the Qiaquick PCR Purification kits (Qiagen, Germantown, MD, USA) and quantified with a Nanodrop ND-1000 spectrophotometer (Thermo Fisher Scientific, Waltham, MA, USA). Purified products were sent to Eurofins Genomics (eurofins.com) for sequencing in both directions.
Sequence chromatograms were analyzed and consensus sequences generated using the Geneious version 9.0.5 (Biomatters, Inc) software platform. DNA sequences were blasted against the GenBank database for comparison with publicly available sequences. Matches with 98% identity or greater for at least 90% of the read length were considered species-level identifications (e.g., Kenchington et al., 2017; Teramura et al., 2022). Barcode identifications were compared with morphological identifications. In all cases, they either provided the same species-level identification, or they provided species-level identification to specimens identified to only the genus or family level.
For unique species that were identified, we additionally obtained the 12S barcode sequence. This sequence was amplified in 50 µl PCR reactions (with same reagents and concentrations as for the COI PCRs) using the MiFish-U-F/R primer set (Miya et al., 2015) with the following thermal cycler conditions: 95°C for 3 minutes, 35 cycles of 95°C for 20 seconds, 47°C for 20 seconds, and 72°C for 20 seconds, and 72°C for 5 minutes. Successful amplifications were purified, quantified, sequenced, and compared with Genbank in the same way as the COI barcodes. All COI and 12S sequences were deposited on GenBank (Supplementary Table S1). The specimen-voucher ID provided in the GenBank metadata can be used to cross-reference the sequences with the photographic archive in Dryad.
2.2 eDNA and MOCNESS sample collection and genomic DNA extraction
This study uses eDNA and 1-m2 MOCNESS samples that were previously analyzed with the 18S V9 barcode marker (Govindarajan et al., 2021), and detailed sample collection and DNA extraction methods are provided there. To summarize, samples were collected from our study area during a cruise on the NOAA Ship Henry B Bigelow during the summer of 2018. The study area was located in the slope water off the shelf break south of the island of Martha’s Vineyard, Massachusetts (Figure 1). Environmental DNA samples were collected from eight 5-liter Niskin bottles mounted on a Seabird 911 plus CTD rosette. Casts were conducted during either day or night, avoiding migrations. Dawn and dusk migration were observed on a shipboard Simrad EK60 echosounder and occurred approximately between 1800 – 2100 (dusk) and 0400 - 0700 (dawn) local time. There were two night casts, collecting a single sample at each of 8 depths; two day casts, collecting a single sample at each of 8 depths, and one day cast collecting duplicate samples at each of four depths (Supplementary Table S2). Overlapping temperature and salinity profiles indicated that these casts, and the MOCNESS tow, all of which were closely spaced, were from the same water mass (Govindarajan et al., 2021). Sample bottles were triggered at depths based on acoustic backscatter detected by the EK60 echosounder and so were not consistent between casts. Once on board, the seawater samples were filtered on to 0.2 µm PES Sterivex filters using peristaltic pumps, and immediately stored at -80°C. Filtration blanks using sterile water were generated with each cast, and rigorous precautions were taken to avoid contamination. Genomic DNA was extracted using DNEasy extraction kits (Qiagen) as described in Govindarajan et al. (2021).
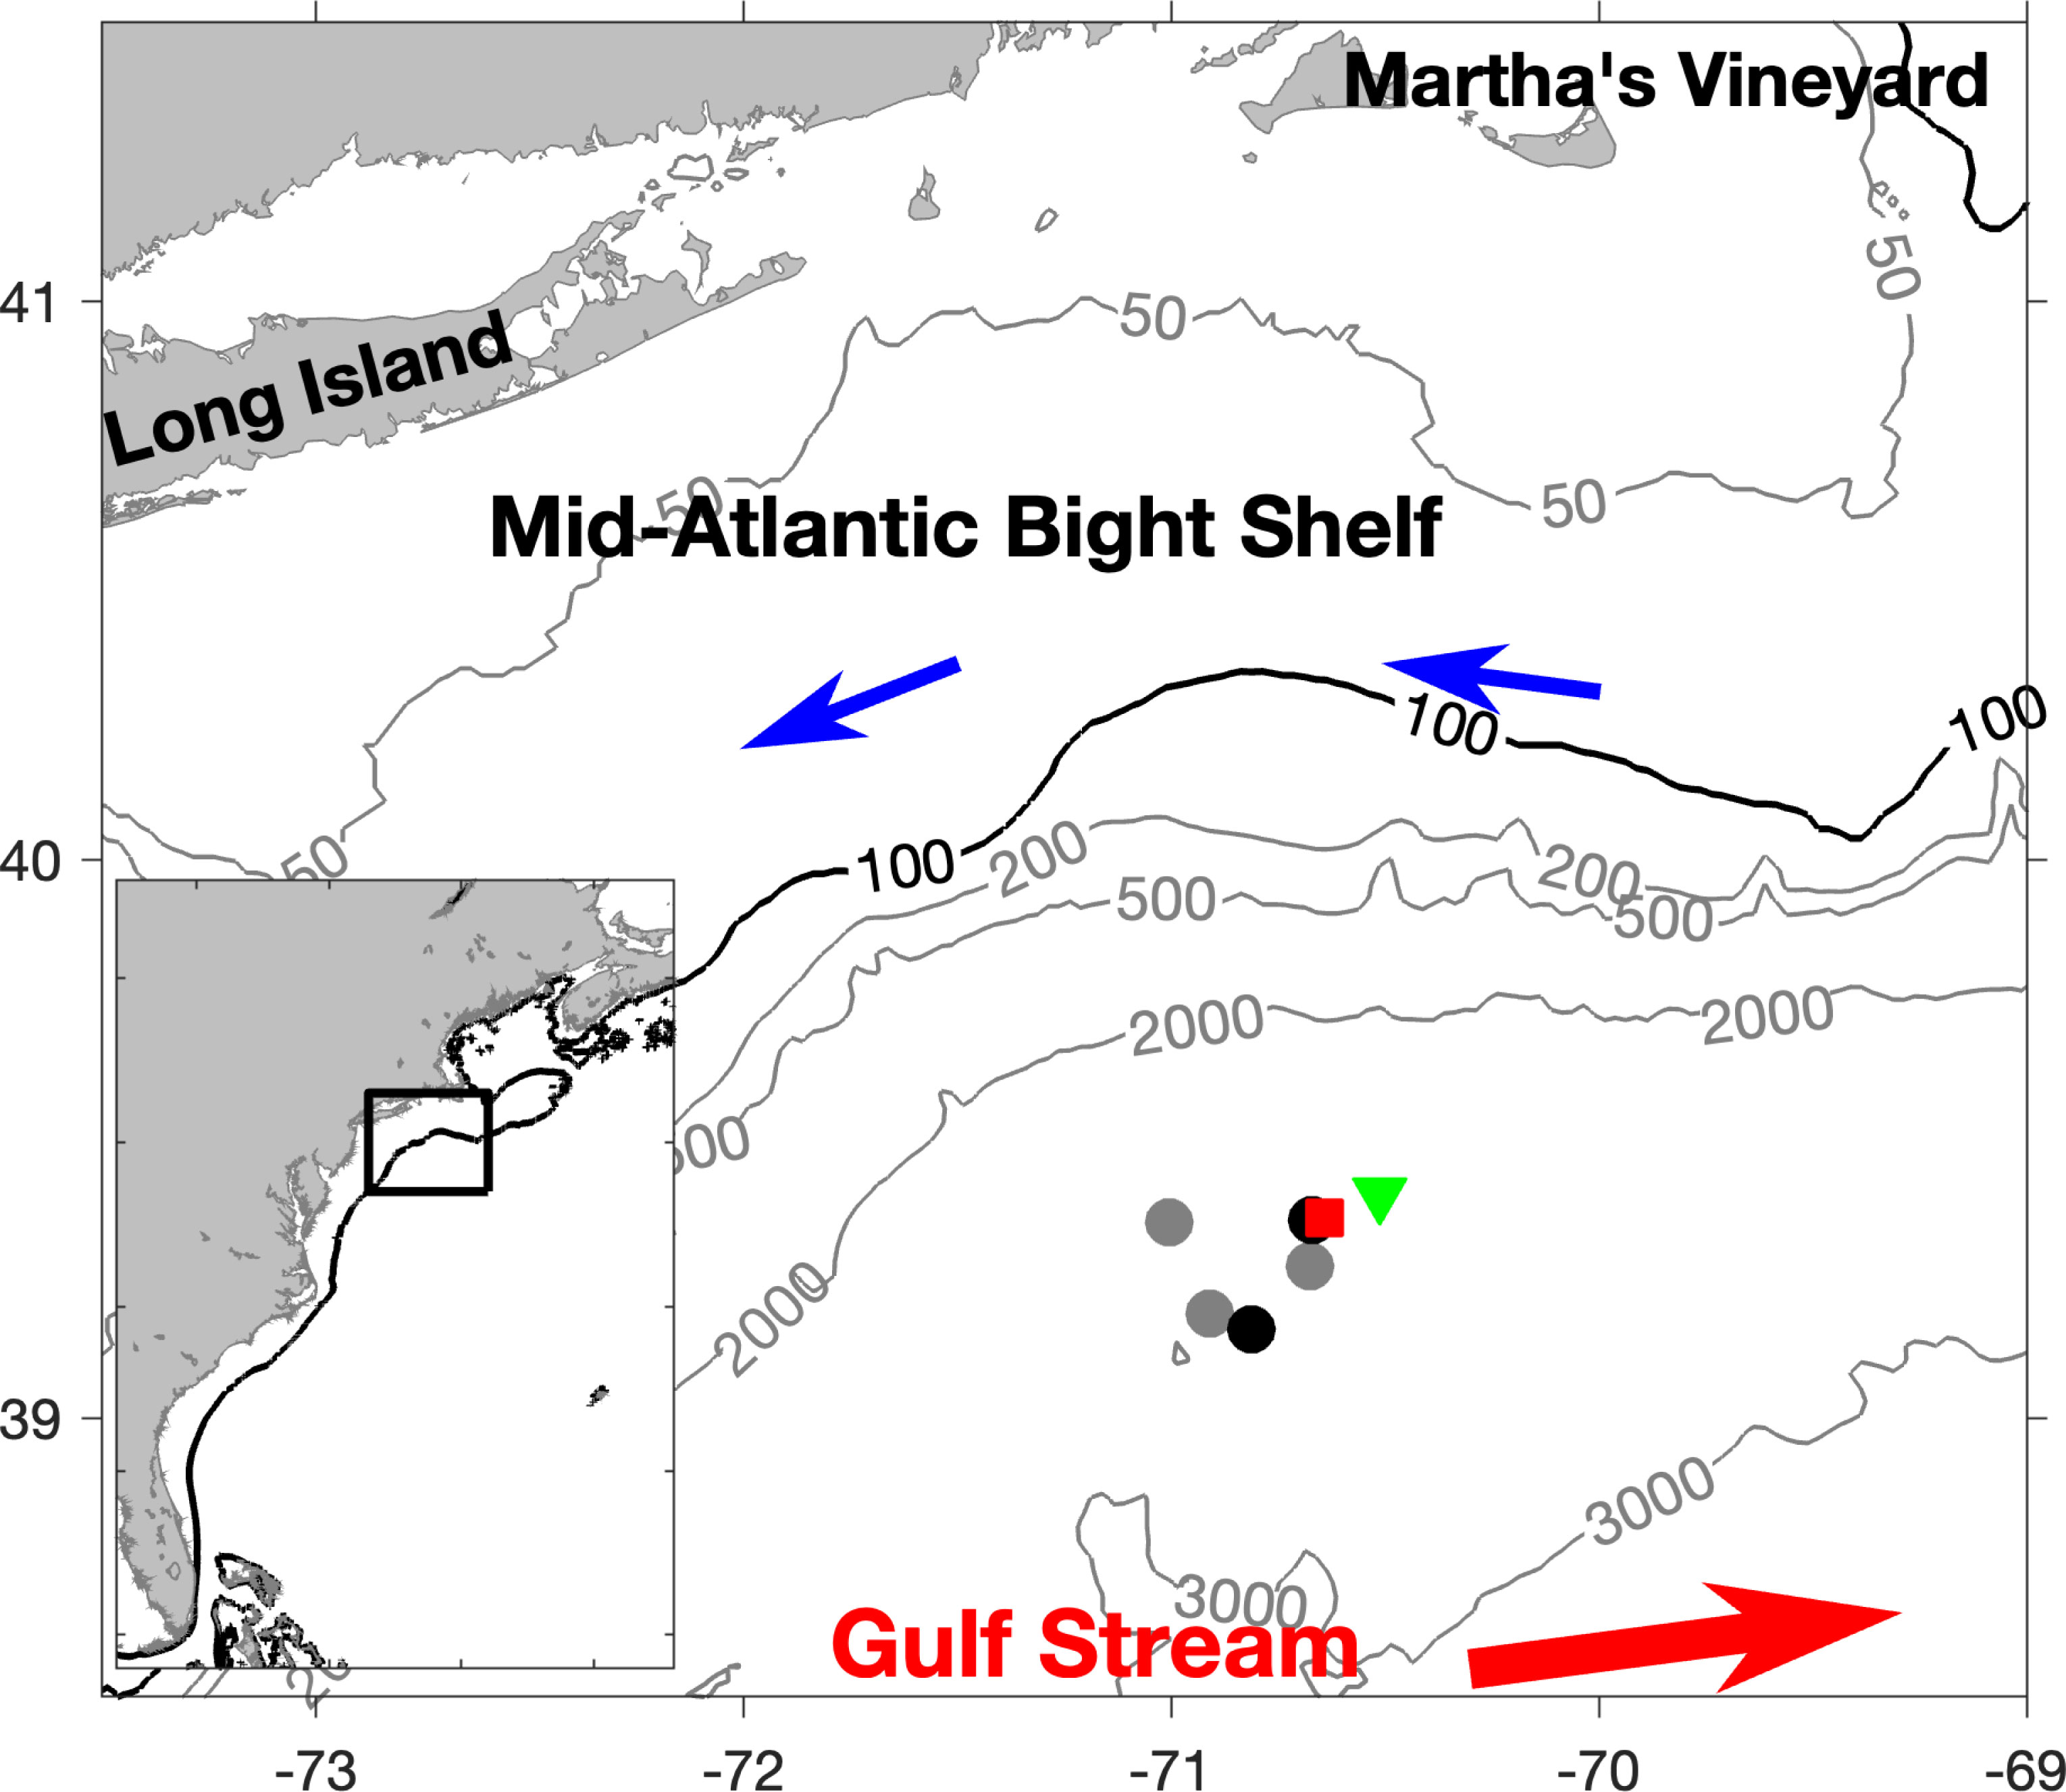
Figure 1 Map of study site. Black circles indicate locations of night CTD casts and gray circles indicate loctions of day CTD casts. The green triangle and red square indicate the starting and ending locations of the MOCNESS tow, respectively. Contour lines connect area of equal depth (m).
For the MOCNESS sampling, a depth-stratified tow (8 nets sampling discrete depth bins of 0-24 m, 24-50 m, 50-100 m, 100-200 m, 200-400 m, 400-600m 600-800 m, and 800-1000 m) was conducted during the night. The contents of each net were split into four equal portions using a Folsom plankton splitter, one of which was preserved in ethanol for metabarcoding analysis. Upon return to the laboratory, the samples were run through 1000 μm sieve and homogenized using a homogenizer with a 10 mm sawtooth probe (Benchmark Scientific). Genomic DNA from the homogenates was extracted using DNEasy extraction kits (Qiagen) as described in Govindarajan et al. (2021).
2.3 12S amplicon library preparation and sequencing
Aliquots of genomic DNA from the eDNA samples and the >1000 m MOCNESS samples were sent to the University of Connecticut Center for Genome Innovation for amplicon library preparation and sequencing. A 2-step PCR protocol adapted from Pitz et al. (2020) was used to amplify the 12S barcode marker region. The first PCR utilized a custom fusion design using the MiFish primers as the target-specific region (Miya et al., 2015) and Illumina-compatible Fluidigm adaptors CS1 and CS2 to add on sequence necessary for sequencing. Each PCR reaction consisted of 2.5 µl template, 12.5 µl NEB Phusion High Fidelity PCR Master Mix, 1 µl forward primer (1 µM), 1 µl reverse primer (1 µM), and 8 µl molecular grade water. The PCR followed a touchdown protocol that consisted of 95°C for 15 minutes, 13 cycles of 94°C 30s, 69.5°C 30s, 72°C 90s (with the annealing temperature decreasing by 1.5°C for each cycle), 25 cycles of 94°C 30°Cs, 50°C 30s, 72°C 45s, and 72°C for 10 minutes. Duplicate PCRs for each sample were run and pooled after initial amplification. Amplicons from the pooled PCRs were visualized with the Agilent 4200 TapeStation electrophoresis system using the High Sensitivity DNA D1000 assay (Agilent Technologies, Santa Clara, CA). Expected – sized amplicons were selected using the Pippin Prep HT gel cassette (2% Agarose, PippinHT, 100-600 bp). The second PCR incorporated index primers that targeted the CS1/CS2 Fluidigm adapters from the primary PCR products. PCR reactions consisted of 5 µl size-selected and purified PCR product, 25 µl NEB Phusion High Fidelity PCR Master Mix, 15 µl molecular grade water, and 5 µl of a unique dual index 10bp barcode (IDT for Illumina Nextera DNA UD barcode plate). The PCR cycle conditions were 95°C for 3 minutes, 12 cycles of 95°C 15s, 60°C 30s, 72°C 60s; and 72°C for 3 minutes. Amplicon libraries were purified using AMPure XP Beads (Agencourt) and assessed with an Agilent 4200 TapeStation electrophoresis system (High Sensitivity DNA D1000 assay). Libraries were quantified using a Qubit 3.0 fluorometer (Life Technologies, Carlsbad, CA), normalized, pooled, and denatured according to the Illumina MiSeq sample preparation guide. 20–30% PhiX (Illumina, San Diego, CA) was added to the amplicons, which were run on the Illumina MiSeq using the 500 cycle v2 reagent kit (250 bp paired-end). The field negative control samples and the PCR blank were also sequenced. These did not contain detectable amounts of DNA so equimolar pooling was not possible; therefore, the maximum volume that was used for the samples was used for library preparation.
2.4 Analysis
Metabarcoding sequence data was processed using Quantitative Insights Into Microbial Ecology 2 (QIIME2) version 2020.11 (Bolyen et al., 2019), following the general approach described in (Govindarajan et al., 2021; Govindarajan et al., 2022). After examining sequence quality plots, sequence primers and read-through (sequence data extending beyond the reverse primer at the far ends of the forward and reverse amplicons) were trimmed using the Cutadapt QIIME2 plugin (Martin, 2011). Sequences were quality filtered, truncated to 150 base pairs in length, denoised, and merged to create amplicon sequence variants (ASVs) using DADA2 (Callahan et al., 2016) within the QIIME2 platform. After this initial quality control, samples contained 172,325 ± 83,257 reads. Our expected amplicon size was ~170 base pairs (Miya et al., 2015), and so sequences less than 150 bp and greater than 190 bp were eliminated from the dataset. Amplicon sequence variants (ASVs) present in any of the control samples were also removed (these came to 198,513 reads belonging to 11 ASVs, or 2.15% of the dataset). Rare ASVs, defined as having a summed frequency of <100 were also removed.
Three hundred and ninety-five ASVs remained at this stage, and these were classified with GenBank using batch Blast searches within the Geneious software platform followed by manual curation of the results. Blast searches are the most common approach for identifying fish eDNA reads (Xing et al., 2022) and manual curation reduces errors associated with GenBank misidentifications (Claver et al., 2023; although note this approach may not be feasible for larger datasets). Amplicon sequence variants that were identified as non-fish or did not have a match with at least 90% query coverage were excluded from subsequent analyses, except for a small number of ASVs that matched marine mammals which were kept, for a total of 170 remaining ASVs. Fish and mammal ASVs were identified to species if they had a ≥ 98% identity with at least 90% coverage with the reference sequence If multiple Genbank species met this criterion, the ASV was identified to the highest common level (e.g., if the ASV matched two different species belonging to the same genus, the ASV was only identified to genus). Fish ASVs were also compared to our new 12S sequences using the Blast function in Geneious and the same criteria for species identification. These results were integrated with the GenBank results to produce final ASV taxonomic assignments. Ninety-eight percent identity is commonly set as the threshold for species-level identification with ASVs generated by the MiFish primers (Díaz et al., 2020; Andres et al., 2023; He et al., 2023).
The final annotated dataset was analyzed using R (R Studio Team, 2020; R Core Team, 2021). Sequence data were categorized by sampling method (CTD or MOCNESS) and the two day CTD profiles and the two night CTD profiles were combined and further categorized into depth categories (0 – 100 m, 100-200 m, 200-400 m, and 400-800 m). Temperature and salinity data from this cruise showed that all samples were collected from the same water mass (Govindarajan et al., 2021). There were the same number of samples in the day and night casts in each depth category, so we compared fish diversity (number of species and relative read abundances) between day and night for each depth category (but not among depth categories). We also compared fish diversity from the night casts to the diversity in the MOCNESS samples (sequences were combined into corresponding depth categories), which were also collected at night. In our fifth cast (cast 10), we assessed the consistency of duplicate samples taken at 4 depths ranging from 375 - 800 m). To provide context for all of our results, identified fish species were further assessed to determine which are associated with mesopelagic depths and vertical migration behavior based on species information provided in Fishbase (https://www.fishbase.se).
3 Results
3.1 DNA barcoding
We present COI and 12S barcode sequences from 80 specimens, each representing a unique species of mesopelagic fish and comprising 30 families (Supplementary Table S1). Thirty-five of the COI sequences originate from Quigley et al., 2023, and 44 are newly presented here. We were unable to obtain a COI sequence for Nesserohamphus ingolfianus. For the 44 newly presented sequences, in all cases, the COI barcoding returned 99%-100% matches from our GenBank Blast searches that were consistent with our morphological identifications (Supplementary Table S3) and confirmed taxonomic assignments. However, in nine of our searches, we found close (99-100%) matches with other species, in addition to those with the expected species name annotation. Because intraspecific differences are typically 99-100% in the COI marker in fishes and interspecific distances much larger (Ward et al., 2009; Kenchington et al., 2017), and because our specimens were also identified morphologically, these results indicate probable misidentifications on GenBank. In four of our searches, we found additional matches with the same species name but with lesser percent identity, suggesting either cryptic lineages or misidentifications.
For each of our 80 fish species, we also obtained 12S barcode sequences. The GenBank Blast search results for this dataset were variable (Supplementary Table S3). Eighteen species did not have close matches and our sequences appear to be the first 12S record on GenBank for these species. Seven species had close matches to other species that are likely misidentified. Fifty-two species had close (>98%) matches on Genbank to sequences with the expected species identifications, although eight of these also produced close matches to other species as well. Two species had lesser matches (94.6% and 97%) to sequences with their same identifications; one of these also had a 97% match to a different species. One species (Physiculus fulvus) had an identical (100%) match to a sequence with the same identification, but with a low query cover (77.65%). One species (Scopelogadus mizolepis) had a 100% match to a closely related species (S. beanii).
3.2 Metabarcode taxonomic assignment
Of the 395 ASVs remaining after our sequence processing and quality control steps, a total of 114 ASVs were identified to species from GenBank, and another 56 ASVs were considered as unidentified vertebrates (i.e., fish or marine mammal) (Supplementary Table S4). When these ASVs were searched against our new sequence library, 114 ASVs yielded the same identifications (69 ASVs representing 21 species, and the remaining ASVs “unidentified”); 37 ASVs representing 24 species were able to be identified by species from GenBank only, and 11 ASVs representing four species were identified from our new sequence library only, for a total of 49 species. The identification of five ASVs, identified as Scopelogadus beanii on GenBank was qualified to Scopelogadus sp., based on a > 98% identity with S. mizolepis from our reference library. Three ASVs representing one species yielded conflicting identifications. These were identified and Nemichthys curvirostris on GenBank and N. scolopaceus with our sequence library. The discrepancy between our reference sequence and GenBank was noted in our Blast search results (Supplementary Table S3), and we considered N. scolopaceus to be the correct identification based on our morphological analysis and COI barcode from our reference specimen. Four of the species identified from GenBank were marine mammals (Tursiops truncatus, Ziphius cavirostris, Stenella sp., and Mesoplodon miris). Thirty-five out of the 45 fish species that we identified are associated with mesopelagic depths, and 22 of these are reported on Fishbase to engage in vertical migration behavior (Supplementary Table S5). Fishbase also reported that one species identified from the MOCNESS, Ostorhinchus apogonoides, is a tropical reef fish and so is unlikely to be in our study area and its identification may be erroneous.
3.3 Results from MOCNESS samples
After the sequence quality control steps, there were 1,206,750 sequence reads in the MOCNESS dataset, with 150,844 ± 74,219 reads per sample (Supplementary Table S6). Twenty-three fish species and several unidentified ASVs were identified (Figure 2; Supplementary Figure S1). Most of the identified species are associated with mesopelagic environments (Supplementary Table S5). All nets except for 50 – 100 m contained unidentified sequence reads (Figure 2; Table 1). In terms of relative read abundance, the surface net (0-24 m) was dominated by Diogenichthys atlanticus, the longfin lanternfish, which is a vertically migrating mesopelagic species typically found between 0 and 100 m at night (which is when the MOCNESS sampling conducted), and Bothias robins, the two-spot flounder, which is generally found at depths 0-100 m (Supplementary Table S5). Sequence reads from Benthosema glaciale, the Glacier lanternfish, dominated the 24 – 50 m net and comprised about half of the reads in the 50 – 100 m net. Benthosema glaciale is also a vertically migrating fish typically found in the top 200 m at night (Supplementary Table S5). Sequence reads identified as Arctozenus risso, the spotted barracudina which is not reported on Fishbase to undertake DVM, were also relatively abundant in the 50 – 100 m and 100 – 200 m nets. Sequence reads from Cyclothone pallida, the non-migratory tan bristlemouth, and Stomias boa, the migratory Boa dragonfish, were also prominent in the 50 – 100 m net. In addition to Arctozenus risso, the 100 m net also contained Astronesthes niger (Barbed dragonfish, migratory), the bristlemouths Cyclothone microdon, Cyclothone pseudopallida and Cyclothone braueri (all non-migratory), Hygophum benoiti (Benoit’s lanternfish; migratory), Scopeloberyx opisthopterus (bigscale; non-migratory), and Sternoptyx diaphana (diaphanous hatchetfish, non-migratory). The 200 – 400 m contained sequence reads from Argyropelecus hemigymnus (the half-naked hatchetfish, most abundant; migratory), Benthosema suborbitale (smallfin lanternfish, migratory), and Cyclothone microdon. The 400 - 600m contained sequence reads primarily from Cyclothone microdon and Hygophum benoiti, but also Cyclothone pseudopallida. The 600 – 800 m net was dominated by Cyclothone microdon reads, and the 800 – 1000 m net contained sequence reads from Boreogadus saida, Cyclothone microdon, Hygophum benoiti, Lobiancha dolfeini, and Scopelogadus sp.
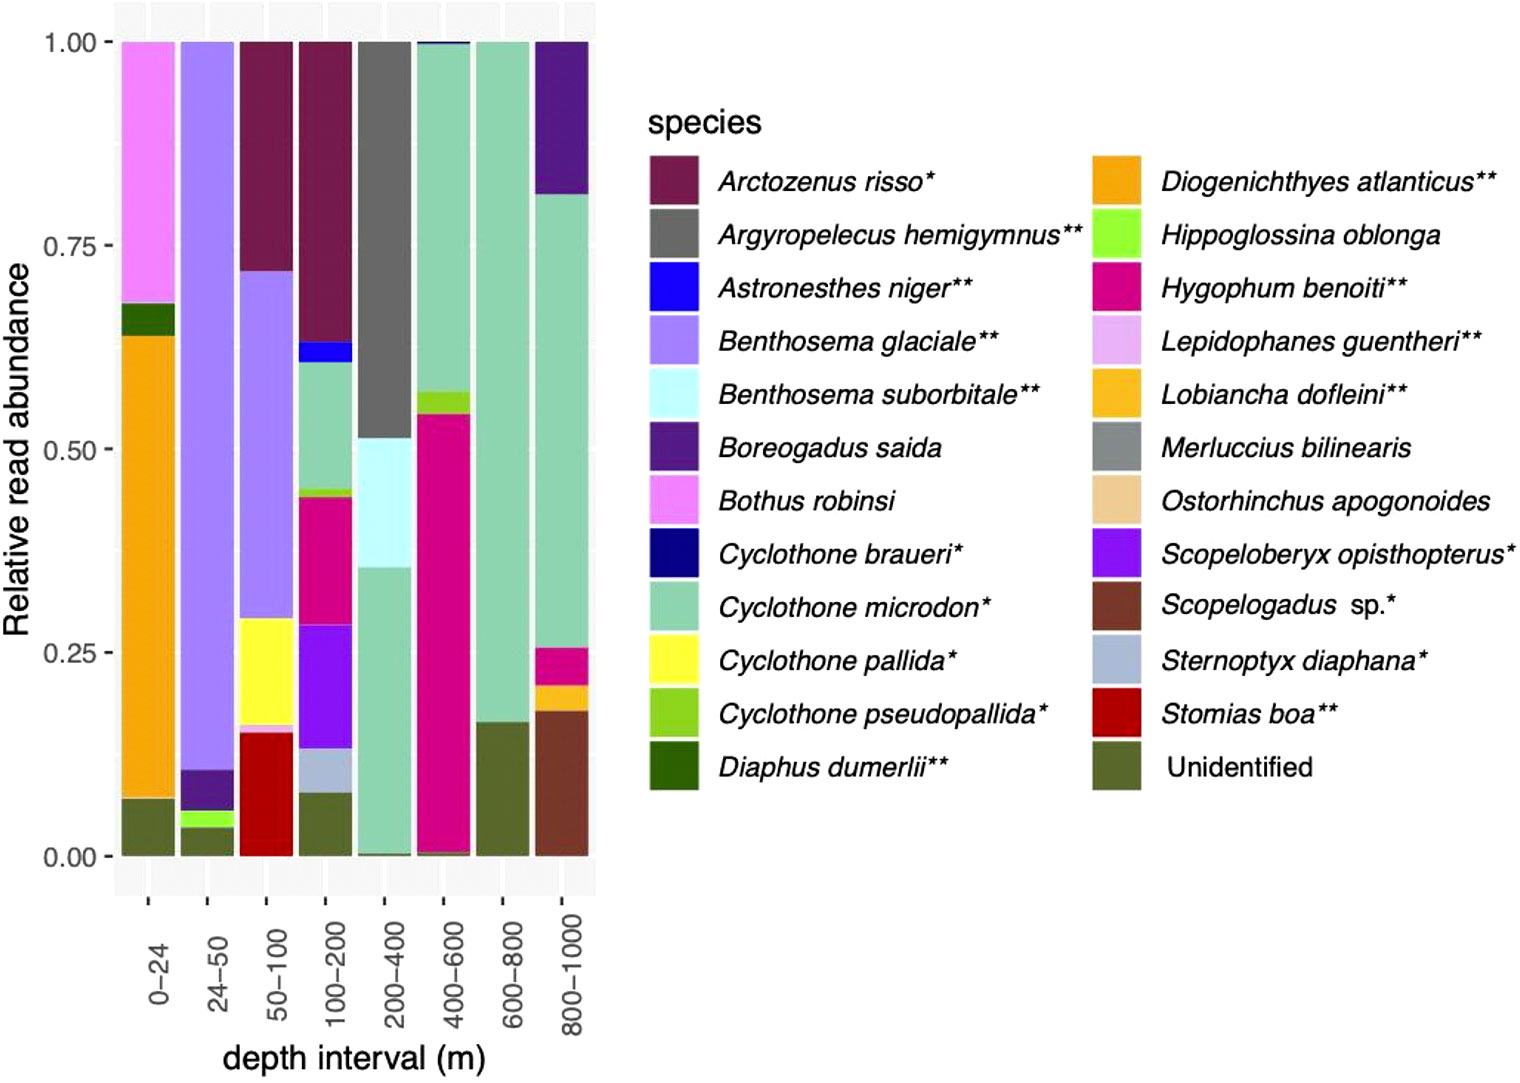
Figure 2 Relative read abundances of fish species detected in the MOCNESS. See Supplementary Figure 1 for depth categories that correspond with eDNA depth categories. *indicates species associated with a mesopelagic habitat; **indicates mesopelagic species thought to undertake DVM.
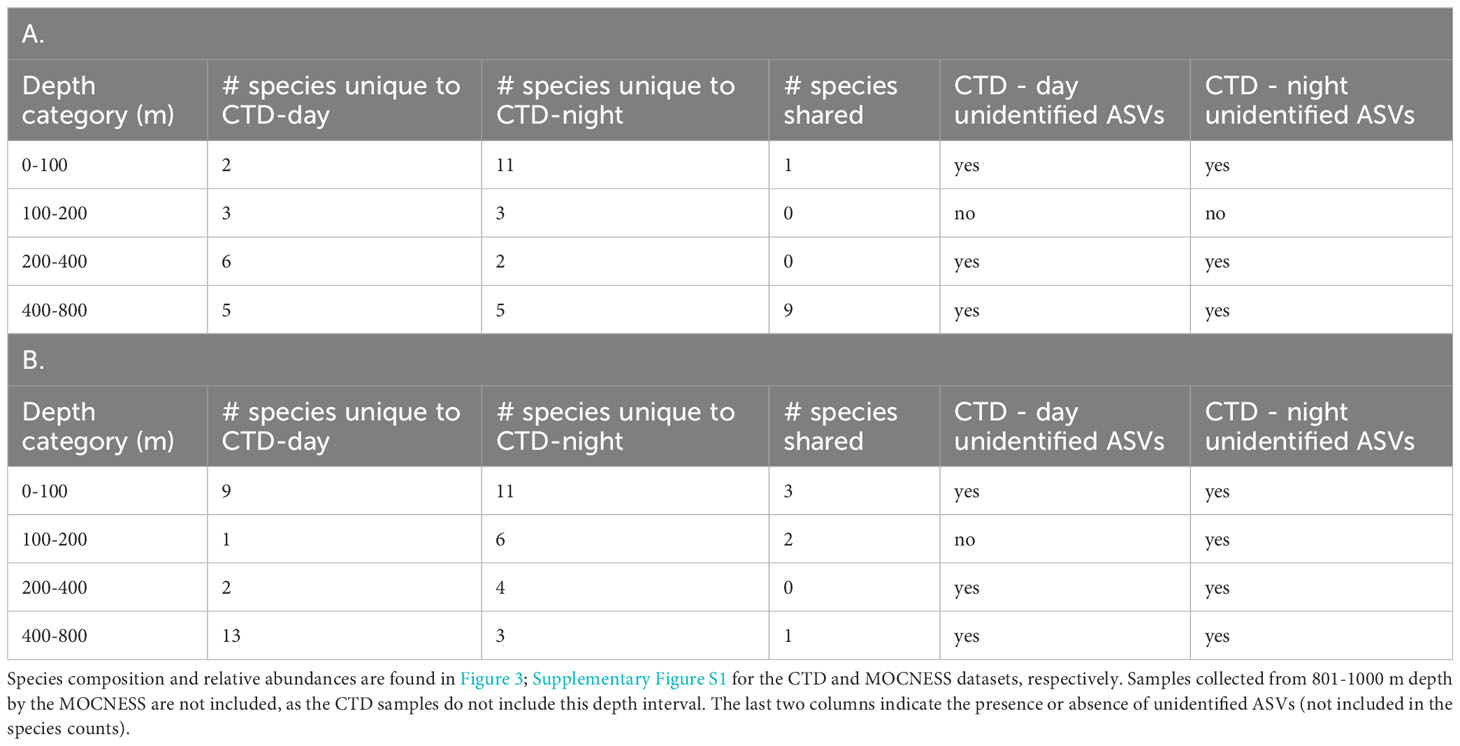
Table 1 Comparison of species from corresponding depth categories in A) day and night CTD samples, and B) night CTD and MOCNESS samples.
Hippoglossina oblonga, the American four-spot flounder, and Merluccias bilinearis can be found in waters deeper than 200 m but are classified as demersal. Boreogadus saida, Arctic cod, can occur throughout the epipelagic and mesopelagic zones but are often classified as cryopelagic (occurring near sea ice). All of the rest (18 identified species) are mesopelagic or bathypelagic, and many (7 species) are known vertical migrators (Supplementary Table S5; Figure 2). Several of these “deep sea” species were detected exclusively or primarily in samples from >200 m. Three species were found primarily in deeper waters, with a small number of reads from the shallowest net.
3.4 Results from CTD water samples
There were 6,037,388 sequence reads after the quality control steps in the CTD dataset, with 150,933 ± 88,097 reads per sample (Supplementary Table S6). This includes five samples which had zero reads and one sample that had only two reads. Altogether, there were a total of 32 identified species and several unidentified reads in the CTD dataset (Figures 3, 4). As with the MOCNESS dataset, most species that were identified are associated with the mesopelagic (26 out of 32), and of these, 15 species are known vertical migrators (Supplementary Table S5; Figure 3).
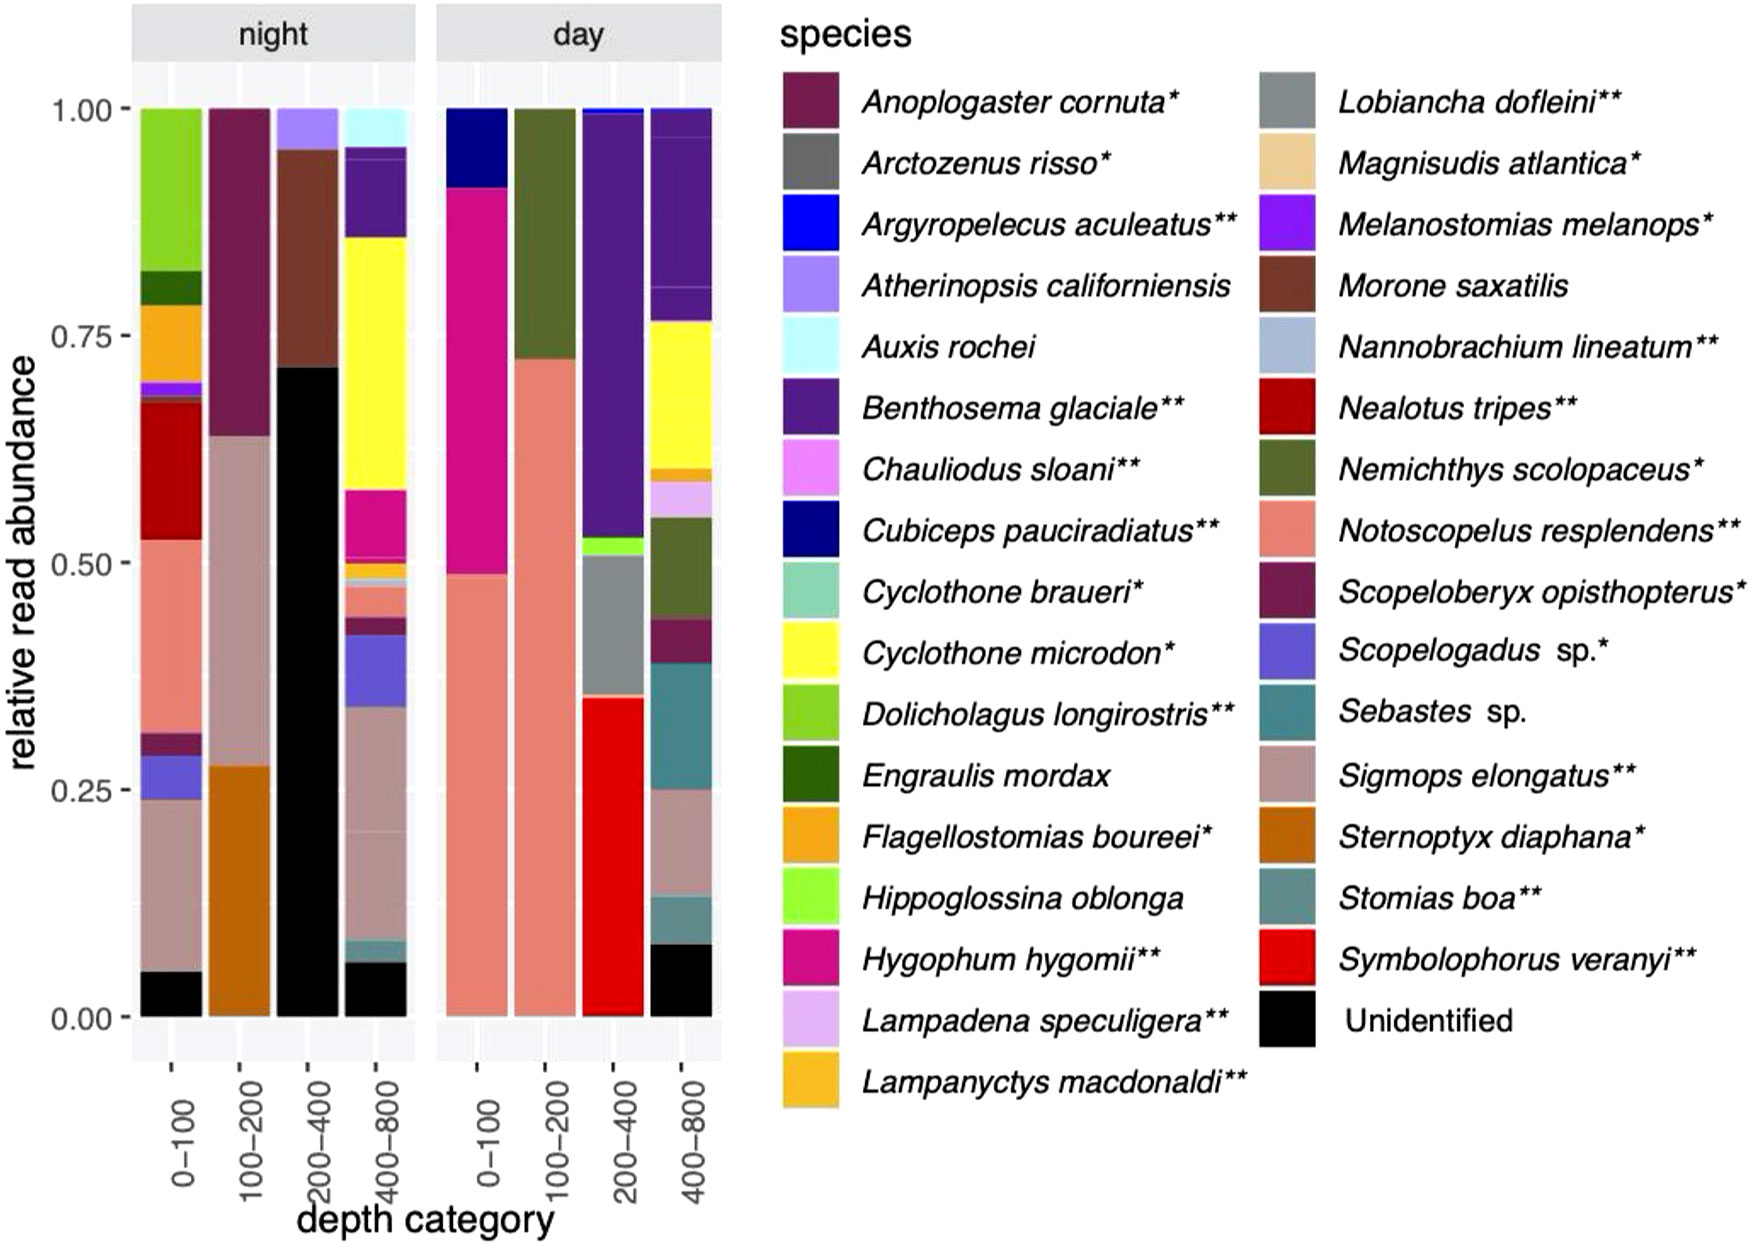
Figure 3 Relative read abundances of fish species detected in night (casts 6 and 9) and day (casts 5 and 7) eDNA samples. Four mammal species were also detected (not shown). *indicates species associated with a mesopolagic habitat; **indicates mesopelagic species thought to undertake DVM.
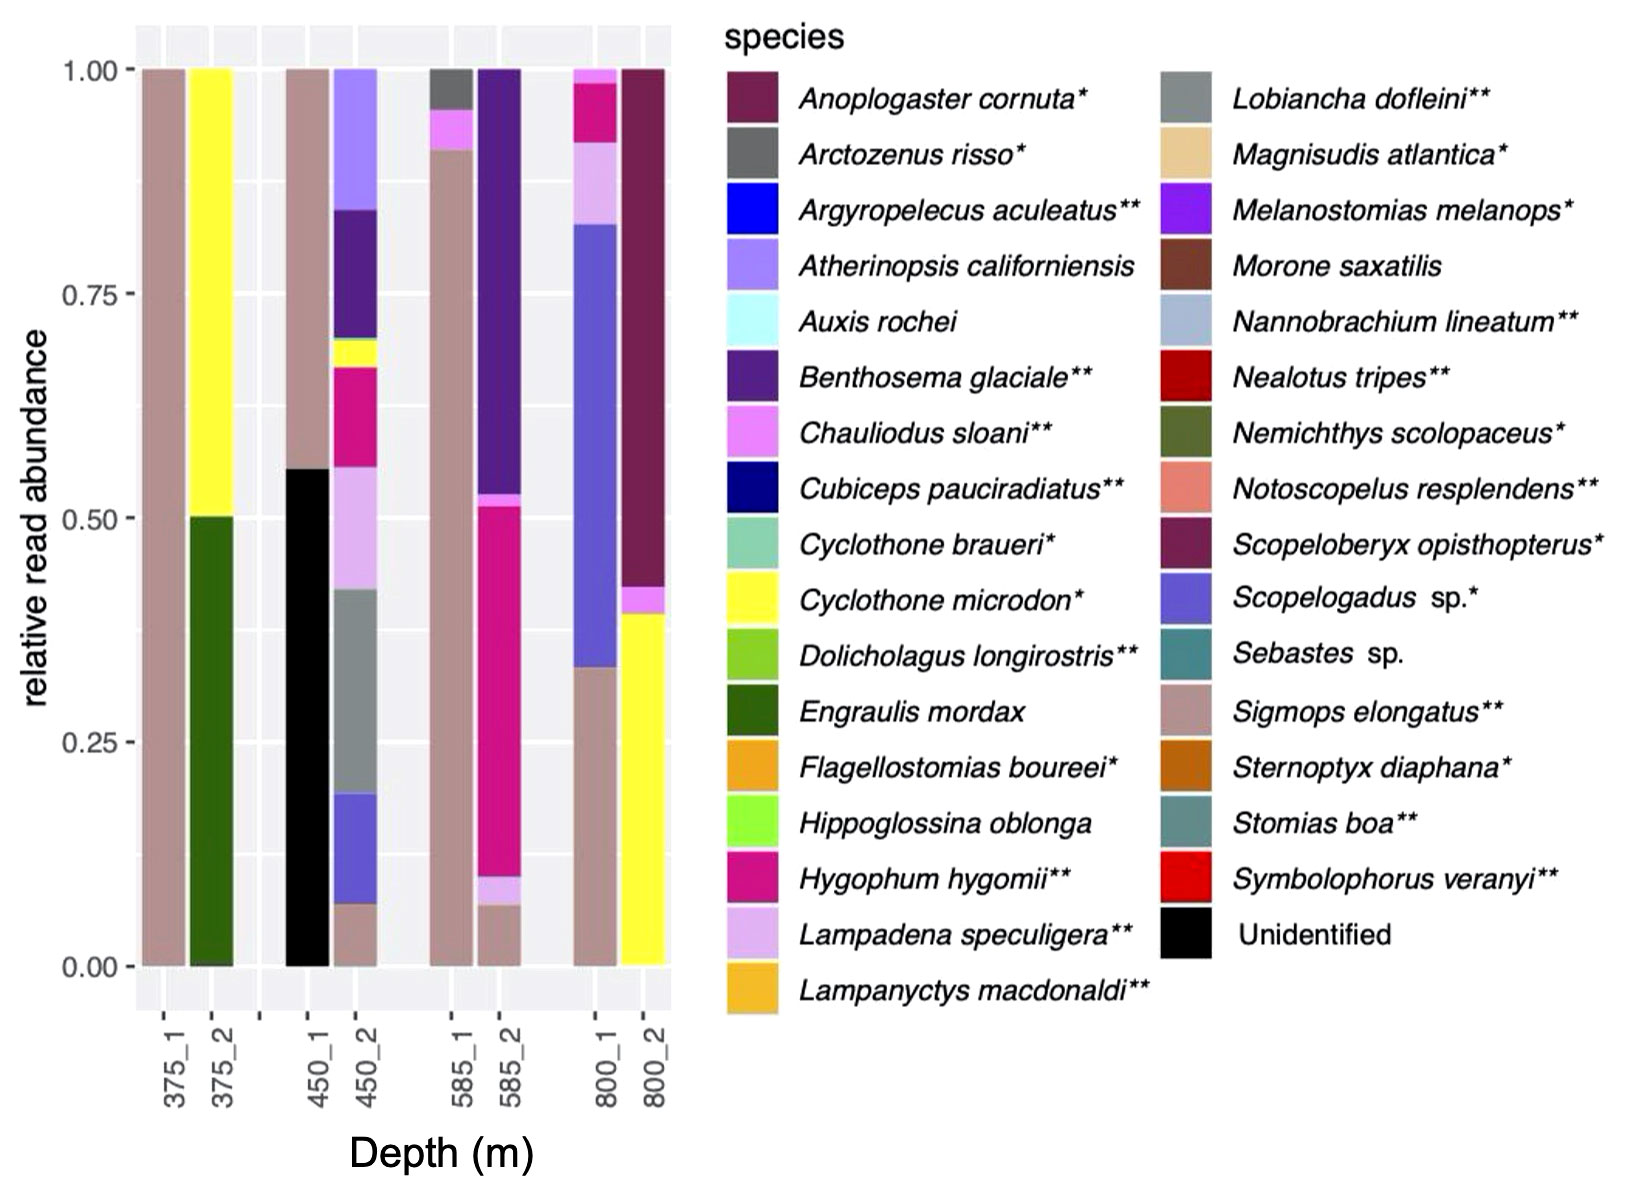
Figure 4 Relative read abundances in duplicate eDNA samples (cast 10). Cast was taken during the daytime. Colors represent same species as in Figure 3. *indicates species associated with a mesopelagic habitat; **indicates mesopelagic species thought to undertake DVM.
The combined two day vertical profiles (casts 5 and 7) and two night vertical profiles (casts 6 and 9) each had four samples in the 0-100 m category, one sample in the 101 - 200 m category, two samples in the 201-400 m category, and 9 samples in the 401 - 800 m category. Thus, sample sizes between depth categories were unequal, so day - night diversity comparisons were made within depth categories only (Table 1). Notably, many more species were found in the night 0-100 m category than in the day 0-100 m category (13 species vs 4 species).
Species that were prominent in terms of their relative abundance and presence in multiple samples include Notoscopelus resplendens (prominent from 0-200 m in the day and night samples), Hygophum hygomii (0-100 m in the day samples), Benthosema glaciale (400-800 m in the day samples), and Sigmops elongatus (in several day and night sample categories). Species that are not typically mesopelagic (Supplementary Table S5) that were found include Morone saxatalis (striped bass), detected in the 200-400 m depth category at night and the bullet tuna (Auxis rochei), detected in the 400-800 m depth category also at night. Overall, there was very little overlap in species composition between the night CTD samples and the MOCNESS samples (also taken at night; (Figure 3; Supplementary Figure S1; Table 1). The non-migrating bristlemouth Cyclothone microdon, however, was found in deeper depth categories in the day CTD, night CTD, and MOCNESS sample sets (Figures 2, 3). In addition to fishes, four marine mammals, which prey on fish and zooplankton, were detected at various depths (Mesoplodon mirus, Stenella longirostris, Tursiops truncatus, and Ziphius cavirostris; Table 2). As expected, no marine mammals were detected in the CTD duplicate or MOCNESS sample sets.

Table 2 Marine mammals detected in the CTD dataset.
Species composition in the duplicate samples from four depths ranging from 375 to 800 m taken during Cast 10 was highly variable, with generally little overlap between the duplicates (Figure 4). Prominent species were Sigmops elongatus (found in all but one sample), Cyclothone microdon, and Hygophum hygomii, all of which were also found in the day and night CTD sample sets.
4 Discussion
4.1 DNA barcoding and reference library
Our DNA barcoding provided several new insights and resources for the barcoding community. We provided new 12S sequences for 80 mesopelagic fish species which will further improve taxonomic accuracy of eDNA studies in this ocean region. Many of our sequences will be first records on GenBank for those species. Even for species where other 12S sequences are available, our sequences will help shed light on intraspecific variation and expand the geographic representation for this marker on GenBank. Our COI barcodes provided validation for our species identification and will also add to knowledge on intraspecific variation and geographic differentiation, which can facilitate the discovery of cryptic species (Kenchington et al., 2017; Teramura et al., 2022).
Importantly, because we barcoded both the COI and 12S markers from the same specimens, we were able to detect species identification discrepancies on GenBank. While our COI barcoding was consistent with our morphological identifications in all cases, we discovered several GenBank records from species that appear to be misidentified. We suggest that the identifications for these are erroneous based both on the discrepancy with our morphological identifications, which were made by individuals with expertise in fish taxonomy based on published meristic characters and dichotomous keys (Carpenter, 2002; Sutton et al., 2020) and the fact that the vast majority of GenBank records matching our sequences in these cases were identified consistently with our specimens. Moving forward, new approaches such as genome skimming (Hoban et al., 2022) that can sequence several markers from multiple species simultaneously, may be a valuable approach for improving both efficiency and consistency in generating barcodes.
4.2 eDNA and MOCNESS comparison
Consistent with other water column studies (Govindarajan et al., 2021; Merten et al., 2021), the combined MOCNESS and eDNA datasets revealed more taxa than either method individually. Both approaches detected several fish species that the other approach did not, and the eDNA dataset included signals from large fish (bullet tuna) and marine mammals, which would not be sampled by the MOCNESS. The presence of unique species in each dataset can be explained by several factors, but the overarching issue is that the two approaches are fundamentally sampling different entities. The MOCNESS targets organisms that are in the sampled area at the time of sampling, while the eDNA signal represents particles, which may have originated elsewhere or from animals that were present at an earlier time. Also, the volume of water sampled is vastly larger with the MOCNESS (Govindarajan et al., 2021) and the sampling is integrated over time and space – potentially obscuring smaller-scale patchiness and temporal changes, unlike small volume Niskin bottle sampling, which represents a point source (Govindarajan et al., 2023) and signatures of many taxa in the local area may fall outside that volume. Furthermore, MOCNESS sampling may miss species that can avoid net capture (Potter and Lough, 1987; Skjoldal et al., 2013). Given these differences in the nature of sampling, the detection of unique taxa with each method is expected and neither approach is “better” or “worse” than the other. Rather, each approach contributes independent insights that can add to the overall understanding of the ecosystem (Govindarajan et al., 2023). Additionally, our observation that there was little overlap in the CTD and MOCNESS samples in the species detected suggests that reliance on a single approach undoubtedly underestimates biodiversity.
A challenge for detecting ecologically meaningful patterns and making sampling approach comparisons is the ability to obtain multiple, replicated samples over small spatiotemporal scales, which is limited by logistical and resource constraints associated with deep sea research. With Niskin bottle sampling, there is a tradeoff between depth resolution and replication, due to the limited number of bottles. Our CTD rosette accommodated 8 Niskin bottles, and with this resource we conducted 4 CTD sampling casts that sampled without replication at 8 depths, and one CTD sampling cast that sampled duplicates at 4 depths. Other CTD rosettes may have up to 24 bottles (e.g., Laroche et al., 2020), but this is still inadequate for highly resolved, replicated surveys. In the future, autonomous samplers and sampling platforms – including autonomous or uncrewed vehicles that are independent of ships - could enable more rigorous and resolved experimental designs (Truelove et al., 2022; Govindarajan et al., 2023; Preston et al., 2023).
4.3 Detecting diel vertical migration with eDNA
In typical diel vertical migration patterns, some mesopelagic species migrate to shallow waters to feed during the night, while spending day hours at depth. Our finding of greater mesopelagic species richness in the 0-100 m depth bins during the night is strongly indicative of that pattern. Similarly, Canals et al. (2021) found evidence of mesopelagic fish vertical migration in a 12S metabarcode analysis of eDNA. Easson et al. (2020) also found evidence of DVM from eDNA metabarcoding data for a variety of animal taxa. However, they did not detect a substantial fish signal in their data, possibly due to their use of a broadly-amplifying 18S barcode marker (“V4”), which is not fish-specific. Govindarajan et al. (2021), also using a broadly-amplifying 18S marker (“V9”) on the same sample set analyzed in this work, did not detect DVM or a significant fish signal. The different findings of this study and Canals et al. (2021) compared to Easson et al. (2020) and Govindarajan et al. (2021) are likely due to the choice of barcode marker. Based on these results, we suggest that future eDNA studies focused on fish DVM use a fish-specific marker such as 12S.
The process of DVM has significant implications for the biological pump by expediting the movement of carbon from the surface to the deep sea. A better understanding of this process, including the species-specific distribution patterns of migrators as well as variations on migration behaviors and migrations beyond mesopelagic depths (van Haren, 2007; van Haren and Compton, 2013; Kaartvedt et al., 2020), is essential for understanding biogeochemical cycling and perturbations that may occur with climate change (Henson et al., 2022). Environmental DNA analysis has great potential to efficiently enable this research. Observed eDNA signals are the product of several physiological and environmental factors, including eDNA shedding, transport and dispersal, and decay processes (Govindarajan et al., 2023). In the mesopelagic zone, the movement of vertical migrators relative to eDNA shedding and decay processes could potentially make it difficult to understand whether eDNA signals originate from the sampling location or elsewhere in the water column. In a modeling study that accounted for the movement of migrators as well as eDNA shedding and decay in typical temperate ocean conditions, Allan et al. (2021) found that eDNA signals remain close to their point of origin (on the scale of 20 meters) in the vertical dimension, indicating that eDNA can be useful to elucidate vertical distribution and migration. The results presented here and elsewhere (Easson et al., 2020; Canals et al., 2021) support this finding.
4.4 Predator detection and inferring trophic relationships
Environmental DNA analyses can provide valuable ecological insights beyond species detection (D’Alessandro and Mariani, 2021; Merten et al., 2021) and has applications in food web ecology. In addition to detecting the presence of mesopelagic fish species, our results identified signals from pelagic fish and marine mammals that are potentially preying on these species. In particular, the tuna and three out of the four marine mammal species that were detected were all from Cast 9. All of these predator species are known to feed on mesopelagic fishes to some extent, as well as cephalopods and crustaceans (Santos et al., 2001; Benoit-Bird and Au, 2003; Mostarda et al., 2007; Hernandez-Milian et al., 2017). While these eDNA signatures originated from different depths, the concentration of signals from this cast suggests that this particular cast location was a foraging hotspot. For example, foraging hotspots may form inside mesoscale eddies (Braun et al., 2019; Della Penna and Gaube, 2020) and be associated with other oceanographic features such as seamounts (Romagosa et al., 2020). While these features were outside the scope of this study, future research could incorporate eDNA analyses into studies involving fish tag and satellite data, to test hypotheses on the prey fields associated with mesoscale oceanographic features and predator presence.
A caveat to our observations is that in some cases, the eDNA signal was found at depths deeper than what the species is known to inhabit - specifically, the bullet tuna Auxis rochei is typically found in epipelagic waters (Sabatés and Recasens, 2001), but the eDNA signature was found at 775 m. We also observed eDNA from the spinner dolphin Stenella longirsotris at 600 m, although these dolphins take advantage of the evening migration to feed on mesopelagic prey in shallower water (Benoit-Bird and Au, 2003). These observations suggest that at least some of the eDNA signatures originate from shallower water sources, or that these species forage deeper than expected. However, this caveat is still consistent with the possibility that a foraging hotspot in shallower water exists at this location.
Other studies have used eDNA metabarcode analyses in combination with other methods to infer deep sea and oceanic trophic relationships. Visser et al. (2021) combined marine mammal predator biologging with eDNA analysis of potential cephalopod prey and found that while the predators occupied distinct niches, their distributions were unexpectedly controlled by factors other than cephalopod community composition. In another approach, Satterthwaite et al. (2023) combined eDNA data with larval fish sampling to create an ecological co-occurrence network that revealed both potential larval fish predators and prey. D’Allesandro and Mariani (2021) combined eDNA metabarcoding datasets and species inventory data from the literature and generated consumer-resource interaction matrices to identify trophic linkages. Integrating eDNA analyses with other data types, particularly acoustic approaches that can identify migrating layers and tagging methods to characterize predator behaviors, has great potential to elucidate mesopelagic food webs.
4.5 eDNA origin
As noted above, there were some detections of species at depth ranges where we would not expect them to occur (e.g., we found non-migratory Cyclothone species in the 100 m depth category; the demersal American four-spot flounder in the midwater; and the shallow water tuna at depth). It is possible that the source of these eDNA signals originated from larvae or eggs, which may be found at shallower depths than the adults (Sabatés and Masó, 1990). Environmental DNA analyses cannot distinguish the form of the eDNA signal (e.g., sloughed cells, gametes, fecal pellets) or the ontogenetic stage of the source individuals. Therefore, other types of sampling and sensing data, such as net tows and video that can provide complementary organismal data, will continue to be important as eDNA analyses become integrated into ocean observing workflows.
4.6 Sampling effort
We observed significant variability in our dataset between duplicate Niskin bottle samples taken at the same depth and time. This is very likely a consequence of small sample volumes, which may fail to capture the full biodiversity present at the sampling location (McClenaghan et al., 2020; Govindarajan et al., 2022). Indeed, some of our samples did not contain any fish reads at all. Our samples were obtained from filtering ~5 liters of water each, which was the volume captured by the Niskin bottles. While this volume is more than the liter or less samples often used in coastal or freshwater studies, it is miniscule relative to the scale of the midwater environment. Autonomous sampling from AUVs with in situ filtration and large-area filters that can capture very large volumes (several 10’s of liters or more per sample; (Govindarajan et al., 2015; Govindarajan et al., 2022) are a promising approach for maximizing species detection in the future. That said, despite the small volumes sampled, the overall number of species detected was comparable to the MOCNESS dataset, which sampled animals over several orders of magnitude greater volume (Govindarajan et al., 2021). This observation highlights the power of eDNA to more efficiently detect taxa compared to conventional methods, in terms of sampling effort. Stochasticity associated with the PCR process may be another contributing factor to the observed variability between our duplicate samples (Shirazi et al., 2021). To minimize this, we ran duplicate PCRs for each sample (that were subsequently pooled), but additional replication (e.g., PCR triplicates, Cananzi et al., 2022) could potentially improve consistency.
5 Conclusions and future directions
We present new 12S barcode sequences for 80 unique mesopelagic species that were identified using an integrative taxonomic approach that included morphological assessment and COI barcode analysis. These sequences will facilitate future metabarcoding efforts from mesopelagic eDNA samples. By sequencing both the COI and 12S sequences from the same specimens, we discovered likely identification errors from sequences on GenBank, and also provided a pathway to link 12S-based identifications to potential cryptic lineages identified by COI.
We applied our library in combination with sequences from GenBank to identify species from our MOCNESS and eDNA 12S metabarcoding datasets. We found that each approach detected species that the other did not, consistent with expectations based on the different natures of the two approaches. Intriguingly, the eDNA results also included the detection of tuna and mammal species which would not be caught in net sampling. We suggest that eDNA and net tow approaches are complementary and that using both approaches can bring a more complete understanding of the ecosystem. To identify evidence of DVM, we compared eDNA samples taken during the day and night. We found that night mesopelagic fish diversity was greater than day diversity in the shallowest depth bins, consistent with the typical DVM pattern.
Future research should focus on continued reference sequence generation to improve the accuracy and completeness of reference databases. We note that many ASVs in our MOCNESS and eDNA samples were not able to be identified. Additionally, our results show the potential for eDNA to address ecological questions relating to diel vertical migration and food web interactions. We expect that future studies (especially those with expanded sampling, integration with different sensing approaches, and inclusive of a broad range of animal groups) will provide exciting new insights into these phenomena, contributing to a greater understanding of the biological carbon pump, and climate change impacts.
Data availability statement
The datasets presented in this study can be found in online repositories. The names of the repository/repositories and accession number(s) can be found below: https://www.ncbi.nlm.nih.gov/genbank/, OQ883774-OQ883853; https://www.ncbi.nlm.nih.gov/genbank/, OQ870399-OQ870442; https://datadryad.org/stash, DOI: 10.5061/dryad.sj3tx9694. The photographic library can be found in https://datadryad.org/stash, DOI: 10.5061/dryad.cc2fqz6bp.
Author contributions
AG conceived the study. AG, PC, JMJ, AL, JL, HM, PW, and WZ planned, prepared for, and/or conducted the shipboard sampling. HM and PC conducted the morphological identifications and photographed and dissected the fish. AG conducted the DNA barcoding and sequence analyses. AG drafted the manuscript. All authors contributed to the article and approved the submitted version.
Funding
The author(s) declare financial support was received for the research, authorship, and/or publication of this article. This research is part of the Woods Hole Oceanographic Institution’s Ocean Twilight Zone Project, funded as part of The Audacious Project housed at TED. Funding for the NOAA Ship Henry B Bigelow was provided by NOAA’s Office of Marine and Aviation Operations (OMAO).
Acknowledgments
We thank the crew and scientists of the NOAA Ship Henry B. Bigelow, Glenn McDonald (WHOI) for assistance with eDNA sampling; Jessica Barrow, Rene Francolini, Erin Frates, Katie Pell, John Selby, and Sarah Stover (WHOI), for assistance with DNA barcoding; Lyndsey Lefebre (WHOI) for assistance with compiling fish metadata; Bo Reese (UConn Center for Genomic Innovation) for assistance with library preparation and DNA sequencing, and Martha Hauff (Stonehill College) for providing helpful insights on the manuscript.
Conflict of interest
The authors declare that the research was conducted in the absence of any commercial or financial relationships that could be construed as a potential conflict of interest.
Publisher’s note
All claims expressed in this article are solely those of the authors and do not necessarily represent those of their affiliated organizations, or those of the publisher, the editors and the reviewers. Any product that may be evaluated in this article, or claim that may be made by its manufacturer, is not guaranteed or endorsed by the publisher.
Supplementary material
The Supplementary Material for this article can be found online at: https://www.frontiersin.org/articles/10.3389/fmars.2023.1219993/full#supplementary-material
References
Allan E. A., DiBenedetto M. H., Lavery A. C., Govindarajan A. F., Zhang W. G. (2021). Modeling characterization of the vertical and temporal variability of environmental DNA in the mesopelagic ocean. Sci. Rep. 11, 21273. doi: 10.1038/s41598-021-00288-5
Andres K. J., Lambert T. D., Lodge D. M., Andrés J., Jackson J. R. (2023). Combining sampling gear to optimally inventory species highlights the efficiency of eDNA metabarcoding. Environ. DNA 5, 146–157. doi: 10.1002/edn3.366
Benoit-Bird K. J., Au W. W. L. (2003). Prey dynamics affect foraging by a pelagic predator (Stenella longirostris) over a range of spatial and temporal scales. Behav. Ecol. Sociobiol 53, 364–373. doi: 10.1007/s00265-003-0585-4
Bolyen E., Rideout J. R., Dillon M. R., Bokulich N. A., Abnet C. C., Al-Ghalith G. A., et al. (2019). Reproducible, interactive, scalable and extensible microbiome data science using QIIME 2. Nat. Biotechnol. 37, 852–857. doi: 10.1038/s41587-019-0209-9
Braun C. D., Gaube P., Sinclair-Taylor T. H., Skomal G. B., Thorrold S. R. (2019). Mesoscale eddies release pelagic sharks from thermal constraints to foraging in the ocean twilight zone. Proc. Natl. Acad. Sci. 116, 17187–17192. doi: 10.1073/pnas.1903067116
Bucklin A., Peijnenburg K. T. C. A., Kosobokova K. N., O’Brien T. D., Blanco-Bercial L., Cornils A., et al. (2021). Toward a global reference database of COI barcodes for marine zooplankton. Mar. Biol. 168, 78. doi: 10.1007/s00227-021-03887-y
Bucklin A., Steinke D., Blanco-Bercial L. (2011). DNA barcoding of marine metazoa. Annu. Rev. Mar. Sci. 3, 471–508. doi: 10.1146/annurev-marine-120308-080950
Callahan B. J., McMurdie P. J., Rosen M. J., Han A. W., Johnson A. J. A., Holmes S. P. (2016). DADA2: High-resolution sample inference from Illumina amplicon data. Nat. Methods 13, 581–583. doi: 10.1038/nmeth.3869
Canals O., Mendibil I., Santos M., Irigoien X., Rodríguez-Ezpeleta N. (2021). Vertical stratification of environmental DNA in the open ocean captures ecological patterns and behavior of deep-sea fishes. Limnology Oceanography Lett. 6, 339–347. doi: 10.1002/lol2.10213
Cananzi G., Gregori I., Martino F., Li T., Boscari E., Camatti E., et al. (2022). Environmental DNA metabarcoding reveals spatial and seasonal patterns in the fish community in the venice lagoon. Front. Mar. Sci. 9, 1009490.
Carpenter K. E., De Angelis N. eds. (2002). The living marine resources of the Western Central Atlantic. (Rome: Food and agriculture organization of the United Nations) Vol. 2, p. 1373. Available at: https://digitalcommons.odu.edu/biology_books/4.
Cavan E. L., Laurenceau-Cornec E. C., Bressac M., Boyd P. W. (2019). Exploring the ecology of the mesopelagic biological pump. Prog. Oceanography 176, 102125. doi: 10.1016/j.pocean.2019.102125
Christiansen H., Dettai A., Heindler F. M., Collins M. A., Duhamel G., Hautecoeur M., et al. (2018). Diversity of mesopelagic fishes in the southern ocean - A phylogeographic perspective using DNA barcoding. Front. Ecol. Evol. 6. doi: 10.3389/fevo.2018.00120
Claver C., Canals O., de Amézaga L. G., Mendibil I., Rodriguez-Ezpeleta N. (2023). An automated workflow to assess completeness and curate GenBank for environmental DNA metabarcoding: The marine fish assemblage as case study. Environ. DNA. doi: 10.1002/edn3.433
Davison P. C., Checkley D. M., Koslow J. A., Barlow J. (2013). Carbon export mediated by mesopelagic fishes in the northeast Pacific Ocean. Prog. Oceanography 116, 14–30. doi: 10.1016/j.pocean.2013.05.013
D’Alessandro S., Mariani S. (2021). Sifting environmental DNA metabarcoding data sets for rapid reconstruction of marine food webs. Fish Fisheries 22, 822–833. doi: 10.1111/faf.12553
Della Penna A., Gaube P. (2020). Mesoscale eddies structure mesopelagic communities. Front. Mar. Sci. 7. doi: 10.3389/fmars.2020.00454
Díaz C., Wege F.-F., Tang C. Q., Crampton-Platt A., Rüdel H., Eilebrecht E., et al. (2020). Aquatic suspended particulate matter as source of eDNA for fish metabarcoding. Sci. Rep. 10, 14352. doi: 10.1038/s41598-020-71238-w
Duhamet A., Albouy C., Marques V., Manel S., Mouillot D. (2023). The global depth range of marine fishes and their genetic coverage for environmental DNA metabarcoding. Ecol. Evol. 13, e9672. doi: 10.1002/ece3.9672
Easson C. G., Boswell K. M., Tucker N., Warren J. D., Lopez J. V. (2020). Combined eDNA and acoustic analysis reflects diel vertical migration of mixed consortia in the gulf of Mexico. Front. Mar. Sci. 7. doi: 10.3389/fmars.2020.00552
Feng Y., Sun D., Shao Q., Fang C., Wang C. (2022). Mesozooplankton biodiversity, vertical assemblages, and diel migration in the western tropical Pacific Ocean revealed by eDNA metabarcoding and morphological methods. Front. Mar. Sci. 9. doi: 10.3389/fmars.2022.1004410
Folmer O., Black M., Hoeh W., Lutz R., Vrijenhoek R. (1994). DNA primers for amplification of mitochondrial cytochrome c oxidase subunit i from diverse metazoan invertebrates. Mol. Mar. Biol. Biotechnol. 3 (5), 294–299.
Govindarajan A. F., Adams A., Allan E., Herrera S., Lavery A. C., Llopiz J. K., et al. (2023). Advances in environmental DNA technology for observing ocean twilight zone animal biodiversity. Oceanography 36, 80–86. doi: 10.5670/oceanog.2023.s1.27
Govindarajan A. F., Francolini R. D., Jech J. M., Lavery A. C., Llopiz J. K., Wiebe P. H., et al. (2021). Exploring the use of environmental DNA (eDNA) to detect animal taxa in the mesopelagic zone. Front. Ecol. Evol. 9. doi: 10.3389/fevo.2021.574877
Govindarajan A. F., McCartin L., Adams A., Allan E., Belani A., Francolini R., et al. (2022). Improved biodiversity detection using a large-volume environmental DNA sampler with in situ filtration and implications for marine eDNA sampling strategies. Deep Sea Res. Part I: Oceanographic Res. Papers 189, 103871. doi: 10.1016/j.dsr.2022.103871
Govindarajan A. F., Pineda J., Purcell M., Breier J. A. (2015). Species- and stage-specific barnacle larval distributions obtained from AUV sampling and genetic analysis in Buzzards Bay, Massachusetts, USA. J. Exp. Mar. Biol. Ecol. 472, 158–165. doi: 10.1016/j.jembe.2015.07.012
He X., Jeffery N. W., Stanley R. R. E., Hamilton L. C., Rubidge E. M., Abbott C. L. (2023). eDNA metabarcoding enriches traditional trawl survey data for monitoring biodiversity in the marine environment. ICES J. Mar. Sci. 80, 1529–1538. doi: 10.1093/icesjms/fsad083
Henson S. A., Laufkötter C., Leung S., Giering S. L. C., Palevsky H. I. (2022). and cavan, E Uncertain response of ocean biological carbon export in a changing world. L Nat. Geosci. 15, 248–254. doi: 10.1038/s41561-022-00927-0
Hernandez-Milian G., Lusher A., O’Brian J., Fernandez A., O’Connor I., Berrow S., et al. (2017). New information on the diet of True’s beaked whale (Mesoplodon mirus, Gray 1850), with insights into foraging ecology on mesopelagic prey. Mar. Mammal Sci. 33, 1245–1254. doi: 10.1111/mms.12430
Hoban M. L., Whitney J., Collins A. G., Meyer C., Murphy K. R., Reft A. J., et al. (2022). Skimming for barcodes: rapid production of mitochondrial genome and nuclear ribosomal repeat reference markers through shallow shotgun sequencing. PeerJ 10, e13790. doi: 10.7717/peerj.13790
Kaartvedt S., Røstad A., Christiansen S., Klevjer T. A. (2020). Diel vertical migration and individual behavior of nekton beyond the ocean’s twilight zone. Deep Sea Res. Part I: Oceanographic Res. Papers 160, 103280. doi: 10.1016/j.dsr.2020.103280
Kenchington E. L., Baillie S. M., Kenchington T. J., Bentzen P. (2017). Barcoding Atlantic Canada’s mesopelagic and upper bathypelagic marine fishes. PloS One 12, e0185173. doi: 10.1371/journal.pone.0185173
Lanzén A., Dahlgren T. G., Bagi A., Hestetun J. T. (2021). Benthic eDNA metabarcoding provides accurate assessments of impact from oil extraction, and ecological insights. Ecol. Indic. 130, 108064. doi: 10.1016/j.ecolind.2021.108064
Laroche O., Kersten O., Smith C. R., Goetze E. (2020). From sea surface to seafloor: a benthic allochthonous eDNA survey for the abyssal ocean. Front. Mar. Sci. 7, 682. doi: 10.1101/2020.05.07.082602
Leduc N., Lacoursière-Roussel A., Howland K. L., Archambault P., Sevellec M., Normandeau E., et al. (2019). Comparing eDNA metabarcoding and species collection for documenting Arctic metazoan biodiversity. Environ. DNA 1, 342–358. doi: 10.1002/edn3.35
Lindsay D. J., Grossmann M. M., Bentlage B., Collins A. G., Minemizu R., Hopcroft R. R., et al. (2017). The perils of online biogeographic databases: a case study with the ‘monospecific’ genus Aegina (Cnidaria, Hydrozoa, Narcomedusae). Mar. Biol. Res. 13, 494–512. doi: 10.1080/17451000.2016.1268261
Martin M. (2011). Cutadapt removes adapter sequences from high-throughput sequencing reads. EMBnet.journal 17, 10–12. doi: 10.14806/ej.17.1.200
McClenaghan B., Fahner N., Cote D., Chawarski J., McCarthy A., Rajabi H., et al. (2020). Harnessing the power of eDNA metabarcoding for the detection of deep-sea fishes. PloS One 15, e0236540. doi: 10.1371/journal.pone.0236540
Merten V., Bayer T., Reusch T. B. H., Puebla O., Fuss J., Stefanschitz J., et al. (2021). An integrative assessment combining deep-sea net sampling, in situ observations and environmental DNA analysis identifies Cabo Verde as a cephalopod biodiversity hotspot in the atlantic ocean. Front. Mar. Sci. 9. doi: 10.3389/fmars.2021.760108
Mirimin L., Desmet S., Romero D. L., Fernandez S. F., Miller D. L., Mynott S., et al. (2021). Don’t catch me if you can – Using cabled observatories as multidisciplinary platforms for marine fish community monitoring: An in situ case study combining Underwater Video and environmental DNA data. Sci. Total Environ. 773, 145351. doi: 10.1016/j.scitotenv.2021.145351
Miya M. (2022). Environmental DNA metabarcoding: A novel method for biodiversity monitoring of marine fish communities. Annu. Rev. Mar. Sci. 14, 161–185. doi: 10.1146/annurev-marine-041421-082251
Miya M., Sato Y., Fukunaga T., Sado T., Poulsen J. Y., Sato K., et al. (2015). MiFish, a set of universal PCR primers for metabarcoding environmental DNA from fishes: detection of more than 230 subtropical marine species. R. Soc. Open Sci. 2, 150088. doi: 10.1098/rsos.150088
Mostarda E., Campo D., Castriota L., Esposito V., Scarabello M. P., Andaloro F. (2007). Feeding habits of the bullet tuna Auxis rochei in the southern Tyrrhenian Sea. J. Mar. Biol. Assoc. United Kingdom 87, 1007–1012. doi: 10.1017/S0025315407055440
Pitz K., Truelove N., Nye C., Michisaki R. P., Chavez F. (2020) Environmental DNA (eDNA) 12S Metabarcoding Illumina MiSeq NGS PCR Protocol (Touchdown). Available at: https://protocols.io/view/environmental-dna-edna-12s-metabarcoding-illumina-bcppivmn (Accessed April 26, 2023).
Potter D. C., Lough R. G. (1987). Vertical distribution and sampling variability of larval and juvenile sand lance (Ammodytes sp.) on nantucket shoals and georges bank. J. Northwest Atlantic Fishery Sci. 7 (2), 107–116.
Preston C., Yamahara K., Pargett D., Weinstock C., Birch J., Roman B., et al. (2023). Autonomous eDNA collection using an uncrewed surface vessel over a 4200-km transect of the eastern Pacific Ocean. Environ. DNA 00, 1–18. doi: 10.1002/edn3.468
Proud R., Handegard N. O., Kloser R. J., Cox M. J., Brierley A. S. (2019). From siphonophores to deep scattering layers: uncertainty ranges for the estimation of global mesopelagic fish biomass. ICES J. Mar. Sci. 76, 718–733. doi: 10.1093/icesjms/fsy037
Quigley L. A., Caiger P. E., Govindarajan A. F., McMonagle H., Jech J. M., Lavery A. C., et al. (2023). Otolith characterization and integrative species identification of adult mesopelagic fishes from the western north atlantic ocean.
Ray J. L., Hestetun J. T., Mugu S., Dahlgren T. G. (2022) Environmental DNA monitoring of pelagic fish fauna at the Hywind Scotland floating wind energy installation – A pilot study (NORCE Climate and Environment). Available at: https://norceresearch.brage.unit.no/norceresearch-xmlui/handle/11250/3033242 (Accessed April 29, 2023).
R Core Team (2021). R: A language and environment for statistical computing. (Vienna, Austria: R Foundation for Statistical Computing). Available at: https://www.R-project.org/.
R Studio Team (2020). RStudio: Integrated development for r. (Boston, MA: RStudio, PBC). Available at: http://www.rstudio.com/.
Romagosa M., Lucas C., Pérez-Jorge S., Tobeña M., Lehodey P., Reis J., et al. (2020). Differences in regional oceanography and prey biomass influence the presence of foraging odontocetes at two Atlantic seamounts. Mar. Mammal Sci. 36, 158–179. doi: 10.1111/mms.12626
Saba G. K., Burd A. B., Dunne J. P., Hernández-León S., Martin A. H., Rose K. A., et al. (2021). Toward a better understanding of fish-based contribution to ocean carbon flux. Limnology Oceanography 66, 1639–1664. doi: 10.1002/lno.11709
Sabatés A., Masó M. (1990). Effect of a shelf-slope front on the spatial distribution of mesopelagic fish larvae in the western Mediterranean. Deep Sea Res. Part A. Oceanographic Res. Papers 37, 1085–1098. doi: 10.1016/0198-0149(90)90052-W
Sabatés A., Recasens L. (2001). Seasonal distribution and spawning of small tunas (Auxis rochei and Sarda sarda) in the Northwestern Mediterranean. Scientia Marina 65, 95–100. doi: 10.3989/scimar.2001.65n295
Santos M. B., Pierce G. J., Herman J., López A., Guerra A., Mente E., et al. (2001). Feeding ecology of Cuvier’s beaked whale (Ziphius cavirostris): a review with new information on the diet of this species. J. Mar. Biol. Assoc. United Kingdom 81, 687–694. doi: 10.1017/S0025315401004386
Sarmiento-Lezcano A. N., Pilar Olivar M., Peña M., Landeira J. M., Armengol L., Medina-Suárez I., et al. (2022). Carbon remineralization by small mesopelagic and bathypelagic Stomiiforms in the Northeast Atlantic Ocean. Prog. Oceanography 203, 102787. doi: 10.1016/j.pocean.2022.102787
Satterthwaite E. V., Allen A. E., Lampe R. H., Gold Z., Thompson A. R., Bowlin N., et al. (2023). Toward identifying the critical ecological habitat of larval fishes. Oceanography 36 (1), 90–93.
Shirazi S., Meyer R. S., Shapiro B. (2021). Revisiting the effect of PCR replication and sequencing depth on biodiversity metrics in environmental DNA metabarcoding. Ecol. Evol. 11 (22), 15766–15779.
Skjoldal H. R., Wiebe P. H., Postel L., Knutsen T., Kaartvedt S., Sameoto D. D. (2013). Intercomparison of zooplankton (net) sampling systems: Results from the ICES/GLOBEC sea-going workshop. Prog. Oceanography 108, 1–42. doi: 10.1016/j.pocean.2012.10.006
Stefanni S., Mirimin L., Stanković D., Chatzievangelou D., Bongiorni L., Marini S., et al. (2022)Framing cutting-edge integrative deep-sea biodiversity monitoring via environmental DNA and optoacoustic augmented infrastructures (Accessed April 29, 2023).
Stoeckle M. Y., Adolf J., Charlop-Powers Z., Dunton K. J., Hinks G., VanMorter S. M. (2021). Trawl and eDNA assessment of marine fish diversity, seasonality, and relative abundance in coastal New Jersey, USA. ICES J. Mar. Sci. 78, 293–304. doi: 10.1093/icesjms/fsaa225
Sutton T. T., Hulley P. A., Wienerroither R., Zaera-Perez D., Paxton J. R. (2020) Identification guide to the mesopelagic fishes of the central and south east Atlantic Ocean. Available at: https://policycommons.net/artifacts/1422305/identification-guide-to-the-mesopelagic-fishes-of-the-central-and-south-east-atlantic-ocean/2036388/ (Accessed April 29, 2023).
Teramura A., Koeda K., Matsuo A., Sato M. P., Senou H., Ho H.-C., et al. (2022). Assessing the effectiveness of DNA barcoding for exploring hidden genetic diversity in deep-sea fishes. Mar. Ecol. Prog. Ser. 701, 83–98. doi: 10.3354/meps14193
Truelove N. K., Patin N. V., Min M., Pitz K. J., Preston C. M., Yamahara K. M., et al. (2022). Expanding the temporal and spatial scales of environmental DNA research with autonomous sampling. Environ. DNA 4 (4), 972–984. doi: 10.1002/edn3.299
van Haren H. (2007). Monthly periodicity in acoustic reflections and vertical motions in the deep ocean. Geophysical Res. Lett. 34 (12), L12603. doi: 10.1029/2007GL029947
van Haren H., Compton T. J. (2013). Diel vertical migration in deep sea plankton is finely tuned to latitudinal and seasonal day length. PloS One 8, e64435. doi: 10.1371/journal.pone.0064435
Visser F., Merten V. J., Bayer T., Oudejans M. G., de Jonge D. S. W., Puebla O., et al. (2021). Deep-sea predator niche segregation revealed by combined cetacean biologging and eDNA analysis of cephalopod prey. Sci. Adv. 7, eabf5908. doi: 10.1126/sciadv.abf5908
Ward R. D., Hanner R., Hebert P. D. N. (2009). The campaign to DNA barcode all fishes, FISH-BOL. J. Fish Biol. 74, 329–356. doi: 10.1111/j.1095-8649.2008.02080.x
Ward R. D., Zemlak T. S., Innes B. H., Last P. R., Hebert P. D. N. (2005). DNA barcoding australia’s fish species. Philos. Trans. R. Soc B: Biol. Sci. 360 (1462), 1847–1857. doi: 10.1098/RSTB.2005.1716
Wiebe P. H., Lavery A. C., Lawson G. L. (2023). Biogeographic variations in diel vertical migration determined from acoustic backscattering in the northwest Atlantic Ocean. Deep Sea Res. Part I: Oceanographic Res. Papers 193, 103887. doi: 10.1016/j.dsr.2022.103887
Keywords: mesopelagic, diel vertical migration, fish, eDNA, biodiversity, barcoding
Citation: Govindarajan AF, Llopiz JK, Caiger PE, Jech JM, Lavery AC, McMonagle H, Wiebe PH and Zhang W(G) (2023) Assessing mesopelagic fish diversity and diel vertical migration with environmental DNA. Front. Mar. Sci. 10:1219993. doi: 10.3389/fmars.2023.1219993
Received: 11 May 2023; Accepted: 10 November 2023;
Published: 11 December 2023.
Edited by:
Daniel Wagner, Ocean Exploration Trust, United StatesReviewed by:
Meredith Everett, National Oceanic and Atmospheric Administration (NOAA), United StatesLorenzo Zane, University of Padua, United States
Copyright © 2023 Govindarajan, Llopiz, Caiger, Jech, Lavery, McMonagle, Wiebe and Zhang. This is an open-access article distributed under the terms of the Creative Commons Attribution License (CC BY). The use, distribution or reproduction in other forums is permitted, provided the original author(s) and the copyright owner(s) are credited and that the original publication in this journal is cited, in accordance with accepted academic practice. No use, distribution or reproduction is permitted which does not comply with these terms.
*Correspondence: Annette F. Govindarajan, afrese@whoi.edu