Western Gull Foraging Behavior as an Ecosystem State Indicator in Coastal California
 Megan A. Cimino1,2*
  Scott A. Shaffer3
  Heather Welch1,2
  Jarrod A. Santora4
  Pete Warzybok5
  Jaime Jahncke5
  Isaac Schroeder1,2
  Elliott L. Hazen1,2
  Steven J. Bograd1,2
- 1Environmental Research Division, NOAA Southwest Fisheries Science Center, Monterey, CA, United States
- 2Institute of Marine Science, University of California, Santa Cruz, Santa Cruz, CA, United States
- 3Department of Biological Sciences, San José State University, San Jose, CA, United States
- 4Fisheries Ecology Division, Southwest Fisheries Science Center, National Marine Fisheries Service, National Oceanic and Atmospheric Administration, Santa Cruz, CA, United States
- 5Point Blue Conservation Science, Petaluma, CA, United States
With accelerating climate variability and change, novel approaches are needed to warn managers of changing ecosystem state and to identify appropriate management actions. One strategy is using indicator species—like seabirds as ecosystem sentinels—to monitor changes in marine environments. Here, we explore the utility of western gulls (Larus occidentalis) breeding on Southeast Farallon Island as a proxy of ecosystem state in coastal California by investigating the interannual variability in gull foraging behavior from 2013 to 2019 in relation to upwelling conditions, prey abundances, and overlap with humpback whales (Megaptera novaeangliae) as gulls frequently feed in association with whales. Western gulls have a flexible diet and forage on land and at-sea. We combined gull GPS tracking data during the incubation phase, ecosystem survey data on multiple predator and prey species, and derived oceanographic upwelling products. When foraging at sea, gulls overlapped with cool upwelled waters. During 2015–2017, 25% more gull foraging trips visited land than in other years, where land trips were on average ∼8 h longer and 40% further than sea trips, which coincided with high compression of coastally upwelled waters (habitat compression) in 2015–2016. Gull foraging behavior was related to local prey abundances, where more foraging occurred near shore or on land when prey abundances were low. However, visual surveys indicated that ∼70% of humpback whale observations co-occurred with gulls, and the year with the most foraging on land (2017) corresponded to regionally low relative whale abundances, suggesting gull movement patterns could be an indicator of whale presence. Further, both whales and gulls forage near-shore under high upwelling habitat compression and low krill abundance. Hence, the deployment of year-round tags on gulls with the capability of near real-time data accessibility could provide important fine-scale metrics for conservation and management of the threatened yet recovering eastern Pacific humpback whale population between infrequent and coarse surveys. Entanglement in fishing gear and ship strikes are major inhibitors to whale recovery and have increased concomitantly with human use of ocean resources. Moreover, as climate variability and change increase, novel indicators should be explored and implemented to inform marine spatial planning and protect species across multiple scales from new risks.
Introduction
Ecological indicators can be used to assess ecosystem state, such as indicator species that are easy to monitor, respond to a stressor in a predictable way, and can be used to guide management actions (Dale and Beyeler, 2001; Siddig et al., 2016; Samhouri et al., 2017). Seabirds are near the apex of most marine food chains and thus, many are well known as ecosystem sentinels to monitor changes in marine environments (Durant et al., 2009; Hazen et al., 2019; Grémillet et al., 2020; Sydeman et al., 2021). For example, seabird foraging behavior, breeding phenology, breeding success, diet, population, and body condition can be indicative of the productive capacity of ecosystem states (Durant et al., 2009; Sydeman et al., 2021). Long-term monitoring of seabirds can be accomplished using different methodologies: demographic monitoring at breeding colonies, biologging as a means to characterize movement and distribution, and at-sea visual surveys. Each approach provides different, but often complementary information on the annual status of a population. Analyzed separately, demographic monitoring provides no information of at sea distributions, biologging distribution data is often limited to a small number of individuals, and at-sea surveys provide population-level distribution data but are only a snapshot in time. However, when evaluating the utility and potential effectiveness of a seabird species indicator, the power of compiling information from different monitoring approaches may provide a more holistic ecosystem view.
Novel ecosystem-based management approaches such as indicators and dynamic ocean management tools are increasing in use in the California Current region to understand various interacting factors that threaten species survival. For example, through the California Current Integrated Ecosystem Assessment (CCIEA1), a variety of environmental, biological, economic, and social indicators are publicly available (Harvey et al., 2020). In addition, there are operational dynamic ocean management tools [e.g., EcoCast (Hazen et al., 2018; Welch et al., 2020), WhaleWatch (Hazen et al., 2017; Abrahms et al., 2019), and TOTAL (Welch et al., 2019)], aimed at protecting key species from human activity or other ecosystem stressors. Many of these tools provide either an annual index, or the resolution of the mapped data is limited by satellites or models (days to months, 10–25 km). As climate change and variability are amplified, indicators at higher spatiotemporal scales that improve predictability are increasingly necessary (e.g., days to weeks, ≤ 10 km). The foraging locations and trip characteristics of tracked animals, such as seabirds, can resolve key fine-scale oceanographic or predator-prey dynamics that, in conjunction with current ecosystem indicators, can improve our understanding of ecosystem state for management. For example, seabird hotspots from multispecies tracking data can inform marine protected area design (Davies et al., 2021). Thus, considering additional indicators is critical as increased variability in ecosystem conditions has led to surprises in ecological interactions and a recognition that new approaches are needed for effective management (Santora et al., 2020).
A particularly concerning issue in the California Current system is severe whale injury or mortality as a result of entanglements in fishing gear and ship strikes (Williams and O’Hara, 2010; Redfern et al., 2013; Rockwood et al., 2021). With the urgent need to utilize ecosystem data to advise marine resource management, working groups were established to develop mitigation strategies and understand drivers of increased whale entanglement (Santora et al., 2020; Feist et al., 2021; Ingman et al., 2021) and ship strikes (Hazen et al., 2017; Abrahms et al., 2019; Blondin et al., 2020; Rockwood et al., 2020). Specifically, humpback whales (Megaptera novaeangliae) can shift between onshore and offshore foraging habitats depending on prey availability driven by upwelling conditions (see Figure 1). Shoreward upwelling habitat compression can lead to nearshore foraging and intensify the overlap between whales and nearshore crab fishing gear (Santora et al., 2020). Thus, a monthly habitat compression index (HCI), the areal extent of cool upwelled water, aids in understanding the risk of interactions between fishing activities and humpback whales. However, the HCI was not designed to capture the fine-scale spatiotemporal dynamics of whale distributions given it is calculated monthly integrated over 4.5° latitude, suggesting the development of other high-resolution indicators would be useful.
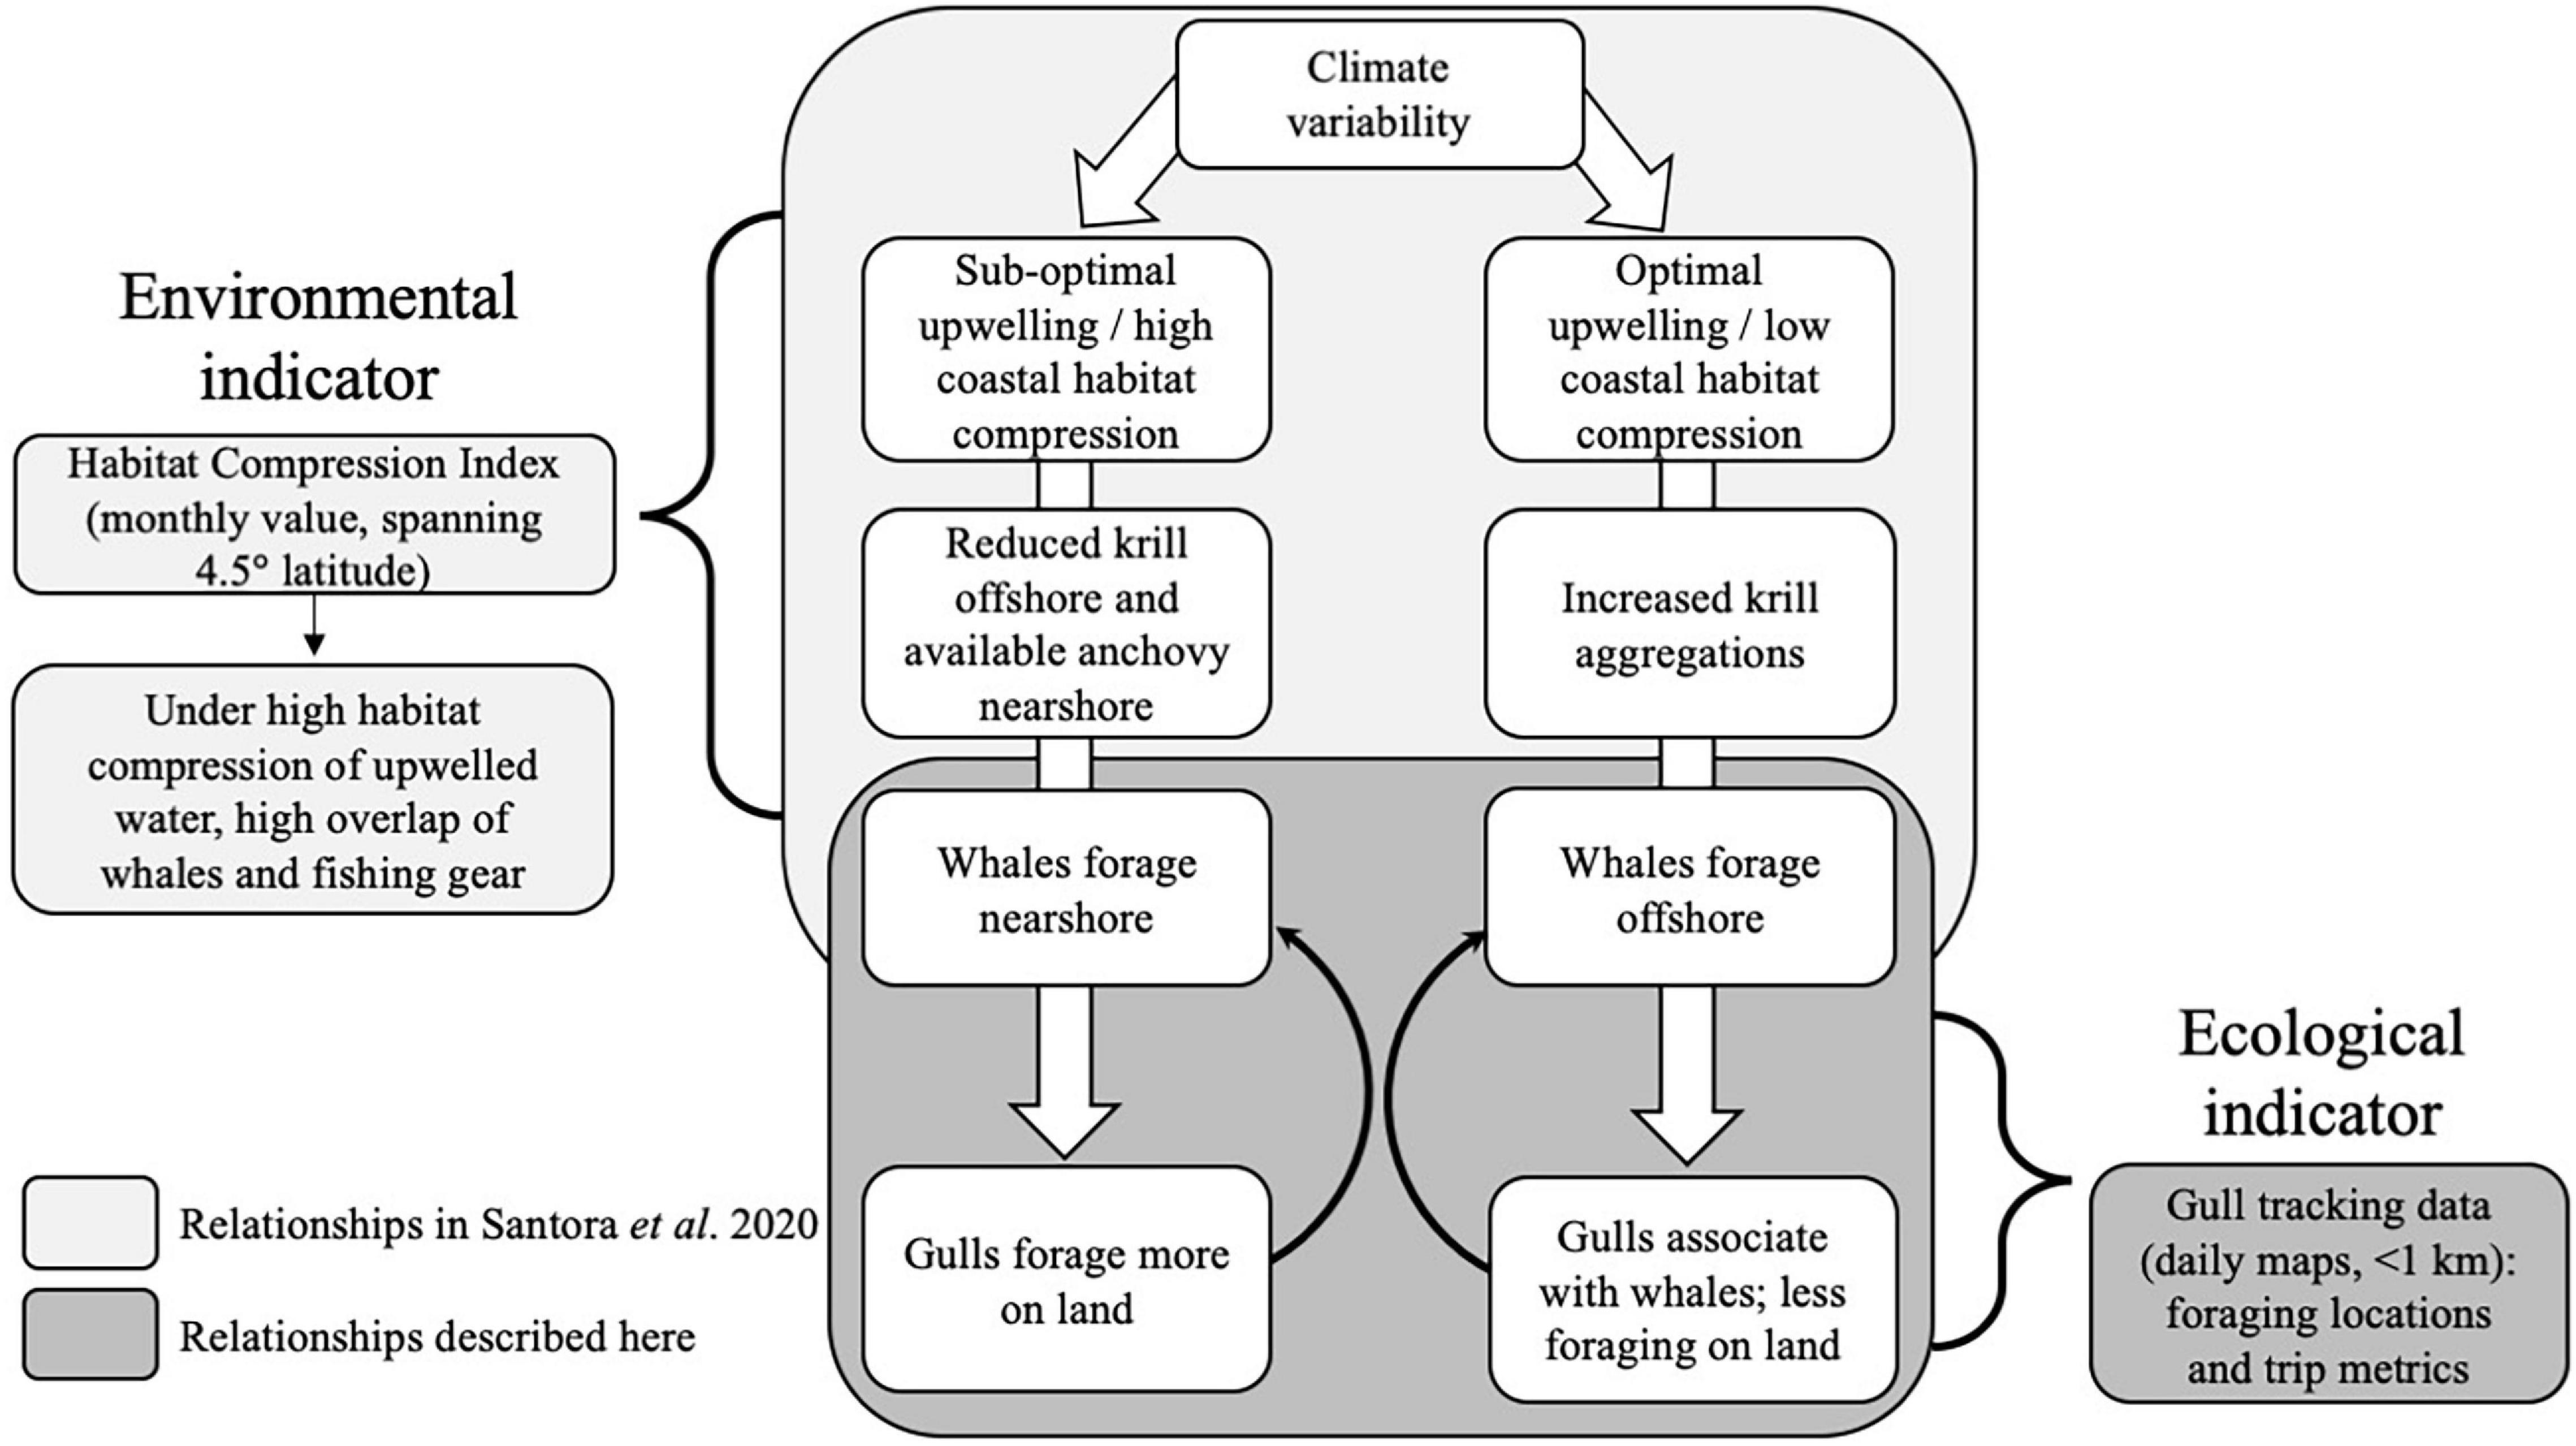
Figure 1. Conceptual model showing how climate variability causes optimal or suboptimal upwelling habitat conditions that alters the distribution and/or abundance of prey and humpback whales, which leads to changes in western gull foraging behavior. The Habitat Compression Index (HCI) is an existing environmental indicator that was developed to predict the risk of interactions between crab fishing activities and humpback whales. In this study, we propose western gull foraging behavior as a new ecological indicator that provides higher-resolution information on ecosystem conditions compared to the HCI.
Seabirds and cetaceans often associate at sea, either through overlapping spatial distributions when targeting the same foraging habitats (Yen et al., 2004; Cox et al., 2018; Sutton et al., 2019), or by maximizing foraging efficiency when feeding together (Harrison, 1979; Ballance et al., 1997; Maxwell and Morgan, 2013). In these feeding associations, seabirds are the likely beneficiaries as cetaceans make food more accessible by driving prey that is typically out of reach toward the surface and sometimes concentrating prey into tight groups (Evans, 1982). Gulls are one species known to benefit from associating with whales (e.g., Harrison, 1979; Haynes et al., 2011; García-Cegarra et al., 2020) because they are only capable of shallow plunge dives (Henkel, 2009). In particular, western gulls (Larus occidentalis) are regionally abundant throughout coastal California and Oregon, spanning the range of biologically productive waters known for high cetacean biodiversity and are anecdotally known to associate with whales. When breeding, western gulls are central place foragers with high repeatability in foraging locations, a capacity to respond quickly to changing conditions due to relatively high flight speeds, and they often feed in aggregations when attracted by social facilitation (Shaffer et al., 2017). Their adaptability is also related to being a generalist carnivore, feeding on a diversity of forage species while at sea and exploiting human refuse when feeding at landfills and urban centers (Annett and Pierotti, 1989; Annett and Pierotti, 1999; Cassell, 2016; Shaffer et al., 2017). Conservation strategies building upon seabird-cetacean feeding associations have been suggested (Veit and Harrison, 2017), but these common multi-species associations have not been explored as an ecological indicator.
Here, we examined the movement patterns and distribution of western gulls to evaluate their utility as an indicator of ecosystem state and specifically humpback whale presence in coastal central California. Humpback whales migrate through central California to feed on krill and forage fish historically during the late summer/fall upwelling season (Calambokidis et al., 2000) but currently arrive in the Farallon Island region in May/June, nearly 4 months earlier than during the early 1990s (Ingman et al., 2021). This time period overlaps with the incubation and chick rearing phases of western gulls breeding at the Farallon Islands. Using multiple years of high-resolution tracking data from incubating western gulls, we characterized interannual variability in foraging behavior (e.g., foraging at sea vs. on land, trip distance and duration) in relation to: (1) upwelling conditions, (2) prey abundances, and (3) humpback whale presence. We combined gull tracking data with ecosystem assessment surveys that monitor predator and prey species abundances and upwelling conditions derived from an oceanographic model. Ultimately, the ecosystem relationship between predator-prey-oceanographic interactions (see Figure 1) allowed us to test whether western gull foraging movements and distributions could serve as an indicator of ecosystem conditions and humpback whale feeding aggregations in an effort to minimize negative human impacts on this threatened species. We aim to show that gull foraging behavior can provide a high-resolution, near-real time indicator of where and when whales may be foraging or switching their distributions to nearshore regions (indicating a shift in ecosystem state, see Figure 1) where entanglement or ship collision is more likely to occur. Combining multiple data streams leads to a better understanding of indicators, and more robust conservation and planning approaches.
Materials and Methods
Western Gull Tracking and Data Processing
Western gulls were studied at Southeast Farallon Island (37.697N, −123.001W), within the Farallon Islands National Wildlife Refuge, located 45 km from the coast of San Francisco, California, United States. Southeast Farallon Island is one of the largest seabird breeding colonies in the Eastern Pacific and has the largest breeding population of western gulls in California (Ainley, 1990). In addition to this region containing important seabird habitat, the San Francisco Bay area contains a large port with high shipping and fishing traffic, high humpback whale density, and is a hotspot for the commercial Dungeness crab (Metacarcinus magister) fishery—the largest fixed-gear fishery in central California (Feist et al., 2021).
Birds were captured using noose mats or a single foot snare during the incubation phase of breeding between mid-May and early June of each year in 2013–2019 (see Shaffer et al., 2017; Table 1). Their breeding phenology at this colony is remarkably consistent (Sydeman et al., 1991). Western gull pairs exchange incubation duties where one individual forages, while the mate remains at the nest to incubate and protect the eggs. Each gull was captured twice at their nest, once to deploy a GPS logger and again 2–6 days later for logger recovery. A total of 133 adults (Table 1) were equipped with a GPS data logger (20-g igotU GT-120 or 32-g GT-600, Mobile Action Technology, Taiwan) that recorded location data at 1–2 min intervals (spatial accuracy 3–4 m, manufacturer specifications). GPS loggers were encased in adhesive-line heat shrink tubing and attached to the base of 4–5 central tail feathers using Tesa tape for a total package that was < 3% of body mass (Shaffer et al., 2017). Only large (1,100 g) male gulls were tracked using the 32-g GPS loggers.
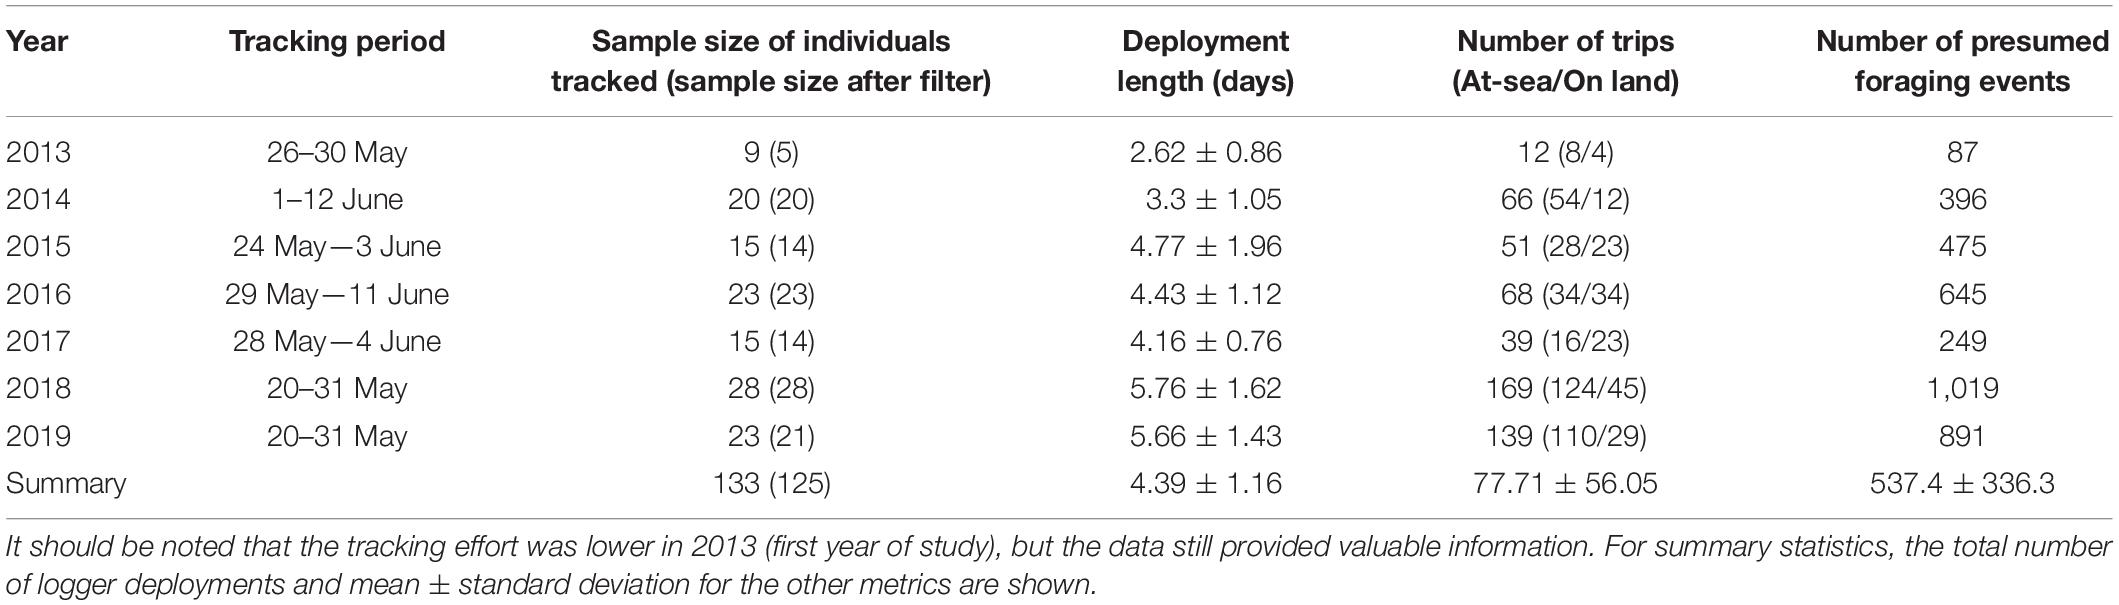
Table 1. Summary of western gull tracking dates, sample size of individuals tracked before and after speed and quality filters were applied, the mean deployment duration, the total number of trips and foraging events by year.
GPS location data were filtered using a speed algorithm to remove erroneous positions (<0.01% of data) based on a maximum flying speed of 70 km h–1 (Shaffer et al., 2017), and tracks were linearly interpolated to a standardized 2-min interval. We processed the data into individual trips using the R package track2KBA (Lascelles et al., 2016; Beal et al., 2020) and we only considered complete trips that started and returned to the colony, were >30 min in duration, and >1 km away from the colony because gulls can make short trips offshore to drink or rest.
Foraging trip metrics included the maximum linear distance from the colony, total travel distance over a trip, and trip duration measured as the total time outside of a 1 km buffer from the colony (Shaffer et al., 2017). Within trip activity patterns were categorized into periods of transiting (travel speeds >6 km h–1 between consecutive locations) and stationary (travel speeds <6 km h–1 between consecutive locations) where stationary periods that were ≥4 min (two GPS fixes or interpolated locations) were assumed to be foraging events (following Shaffer et al., 2017). For each foraging event within a trip, we calculated the mean location and duration of event. In addition, we determined whether foraging events occurred at sea or on land by matching all foraging events to bathymetry/elevation data. Ocean trips were classified as any trip that did not overlap with land. A “land trip” was classified as any trip where a gull overlapped with land (elevation ≥0 m). We also determined whether gulls foraged within 5 km of the shoreline (i.e., relatively “nearshore”) or within 3 km of a landfill—reflecting the average size of landfills2 at ∼2.5 km2. These trip characteristics were all used as potential gull foraging indicators. All analyses in this study were performed in R (R Core Team, 2020).
Tracking data were summarized by year to investigate interannual variability in gull behavior including trip duration, total distance traveled, maximum linear distance from colony, and the proportion of foraging events by trip at sea, nearshore, and near a landfill (means ± SD were calculated by individual and then year); and the distribution of the proportion of foraging events on land by trip was determined to show the spread of the data. To determine if there were statistically significant differences in trip characteristics between years, we used linear mixed-effects models (for trip duration, total distance, and maximum linear distance) and generalized linear mixed-effects models with a binomial error distribution (for presence/absence of foraging events on land/at sea, nearshore, or at a landfill) using the lme4 R package (Bates et al., 2015) with year as the fixed effect and individual as the random effect. While western gulls are generally sexually size dimorphic (Pierotti and Annett, 1995), there was some overlap in size measurements for both sexes and thus, data for both sexes were combined in this study. The response variables (trip duration and maximum trip distance) were log10 transformed. For post hoc comparisons between years, we used the “glht” function in the multcomp R package (Hothorn et al., 2008) with Tukey’s honestly significant difference pairwise multiple comparisons of means (Bretz et al., 2016) and adjusted p-values using the Bonferroni correction to account for multiple comparisons. Results were considered statistically significant at p-value (p) < 0.05 and marginally significant at 0.05 < p < 0.10.
The spatial region encompassing gull foraging events each year and all years collectively was determined using two-dimensional kernel density estimations with an axis-aligned bivariate normal kernel in R following past work (Venables and Ripley, 2002; Pickett et al., 2018). To highlight the dominant areas utilized each year, we showed the 75 and 50% (core) foraging regions.
Environmental Data
We obtained medium resolution shoreline data from the National Oceanic and Atmospheric Administration (NOAA) nautical charts, shipping lanes from the NOAA Office of Coast Survey electronic navigational charts, National Marine Sanctuary boundaries from the NOAA Sanctuaries geographic information system database, and 1 arc-minute bathymetry/elevation data from the ETOPO1 Global Relief Model. Landfill locations were downloaded from the California Office of Environmental Health Hazard Assessment and included two Recology recycling center locations that western gulls are known to visit (Shaffer et al., 2017). Distance to the shoreline and landfills/recycling centers within our study area were calculated over a 1 km × 1 km grid.
The California Current system is characterized by wind-driven coastal upwelling that delivers deep, cool nutrient-rich waters to the surface, which supports a diversity of primary producers up to top predators (Huyer, 1983; Checkley and Barth, 2009; Jacox et al., 2018). The HCI evaluates the monthly area of coastal upwelling habitat and is considered a regional indicator of the likelihood of ecosystem shifts coinciding with the shoreward distribution and increased aggregation intensity of top predators (Figure 1; Santora et al., 2020). The HCI is the area covered by surface waters below a monthly sea surface temperature (SST; derived from data assimilative Regional Ocean Modeling System analysis of the California Current system) over the domain between latitudes 37.3–38.5°N and extending from the shore out to 150 km from land. The monthly SST thresholds were the long-term (1980–2010) SST spatial average for a given month over the same latitude range (37.3–38.5°N) and over 75 km from shore (11.5°C in May and 12.0°C for June). We computed monthly HCI for May and June from 2013 to 2019, corresponding to the period when western gulls were tracked and ecosystem surveys occurred. We evaluated the spatial areas that fall below the thresholds during May and June in relation to western gull habitat use each year.
Prey Data and Predator Sightings From Ecosystem Surveys
The NOAA-NMFS Rockfish Recruitment and Ecosystem Assessment Survey (RREAS) occurs predominately during May and often into early June each year (Sakuma et al., 2016) and spans most of coastal California. Prey abundance indices were obtained from 15-min net tows using a modified Cobb midwater trawl with a 9.5 mm cod-end liner with a headrope depth of 30 m (Sakuma et al., 2006; Ralston et al., 2013). Individuals from the net hauls were sorted to species and the total number per haul and species were estimated by extrapolating the species subsample to the total species volume. Abundance was estimated as log-transformed catch-per-unit-effort [ln(CPUE + 1)]. Prey taxa included krill (Euphausiids), market squid (Doryteuthis opalescens), northern anchovy (Engraulis mordax) adults and young-of-the-year (YOY), Pacific sanddab (Citharichthys sordidus) YOY, and rockfish (Sebastes) YOY based on past studies (Cassell, 2016; Santora et al., 2017). For each year, we mapped the proportional abundance of each species at each sampling station within our study region. To examine interannual variability near the gull colony, CPUE across the five or six stations (not all stations were sampled each year) directly around the Farallon Islands were averaged to give a single annual abundance value for each prey species. Because tracked western gulls overlapped considerably with these selected stations, these stations likely provide the best information on the available prey field in the region.
Daytime seabird and whale sighting observations were made using standardized survey methods (Tasker et al., 1984; Yen et al., 2004) where an observer counted seabirds and mammals from the ship’s bridge at vessel speeds above 5 kts. All mammals out to 3 km and seabirds within a 300 m arc from the bow and 300 m off the side were counted. Because visual surveys do not occur in the same location each year, we calculated how much of the study region (box in Figure 2) was covered by the survey each year. These calculations showed the survey covered 25% of the study region in 2013–2014, < 10% in 2015, 20% in 2016–2017, ∼12% in 2018, and 30% in 2019. In 2018, the small area that was surveyed (Supplementary Figure 1) missed the main gull foraging region to the northwest of the Farallon Islands, and similarly, 2015 had the lowest survey coverage. In contrast, in 2019, the survey covered the largest area with the most nearshore observations overlapping with the gull foraging region to the north of the Farallon Islands. We also determined the total area of overlap between the survey and the tracking data (shown on Supplementary Figure 1). The tracking data was integrated on a 5 km × 5 km grid where 0 indicated the absence of foraging events and 1 indicated the presence of at least one foraging event for each year (Supplementary Figure 1).
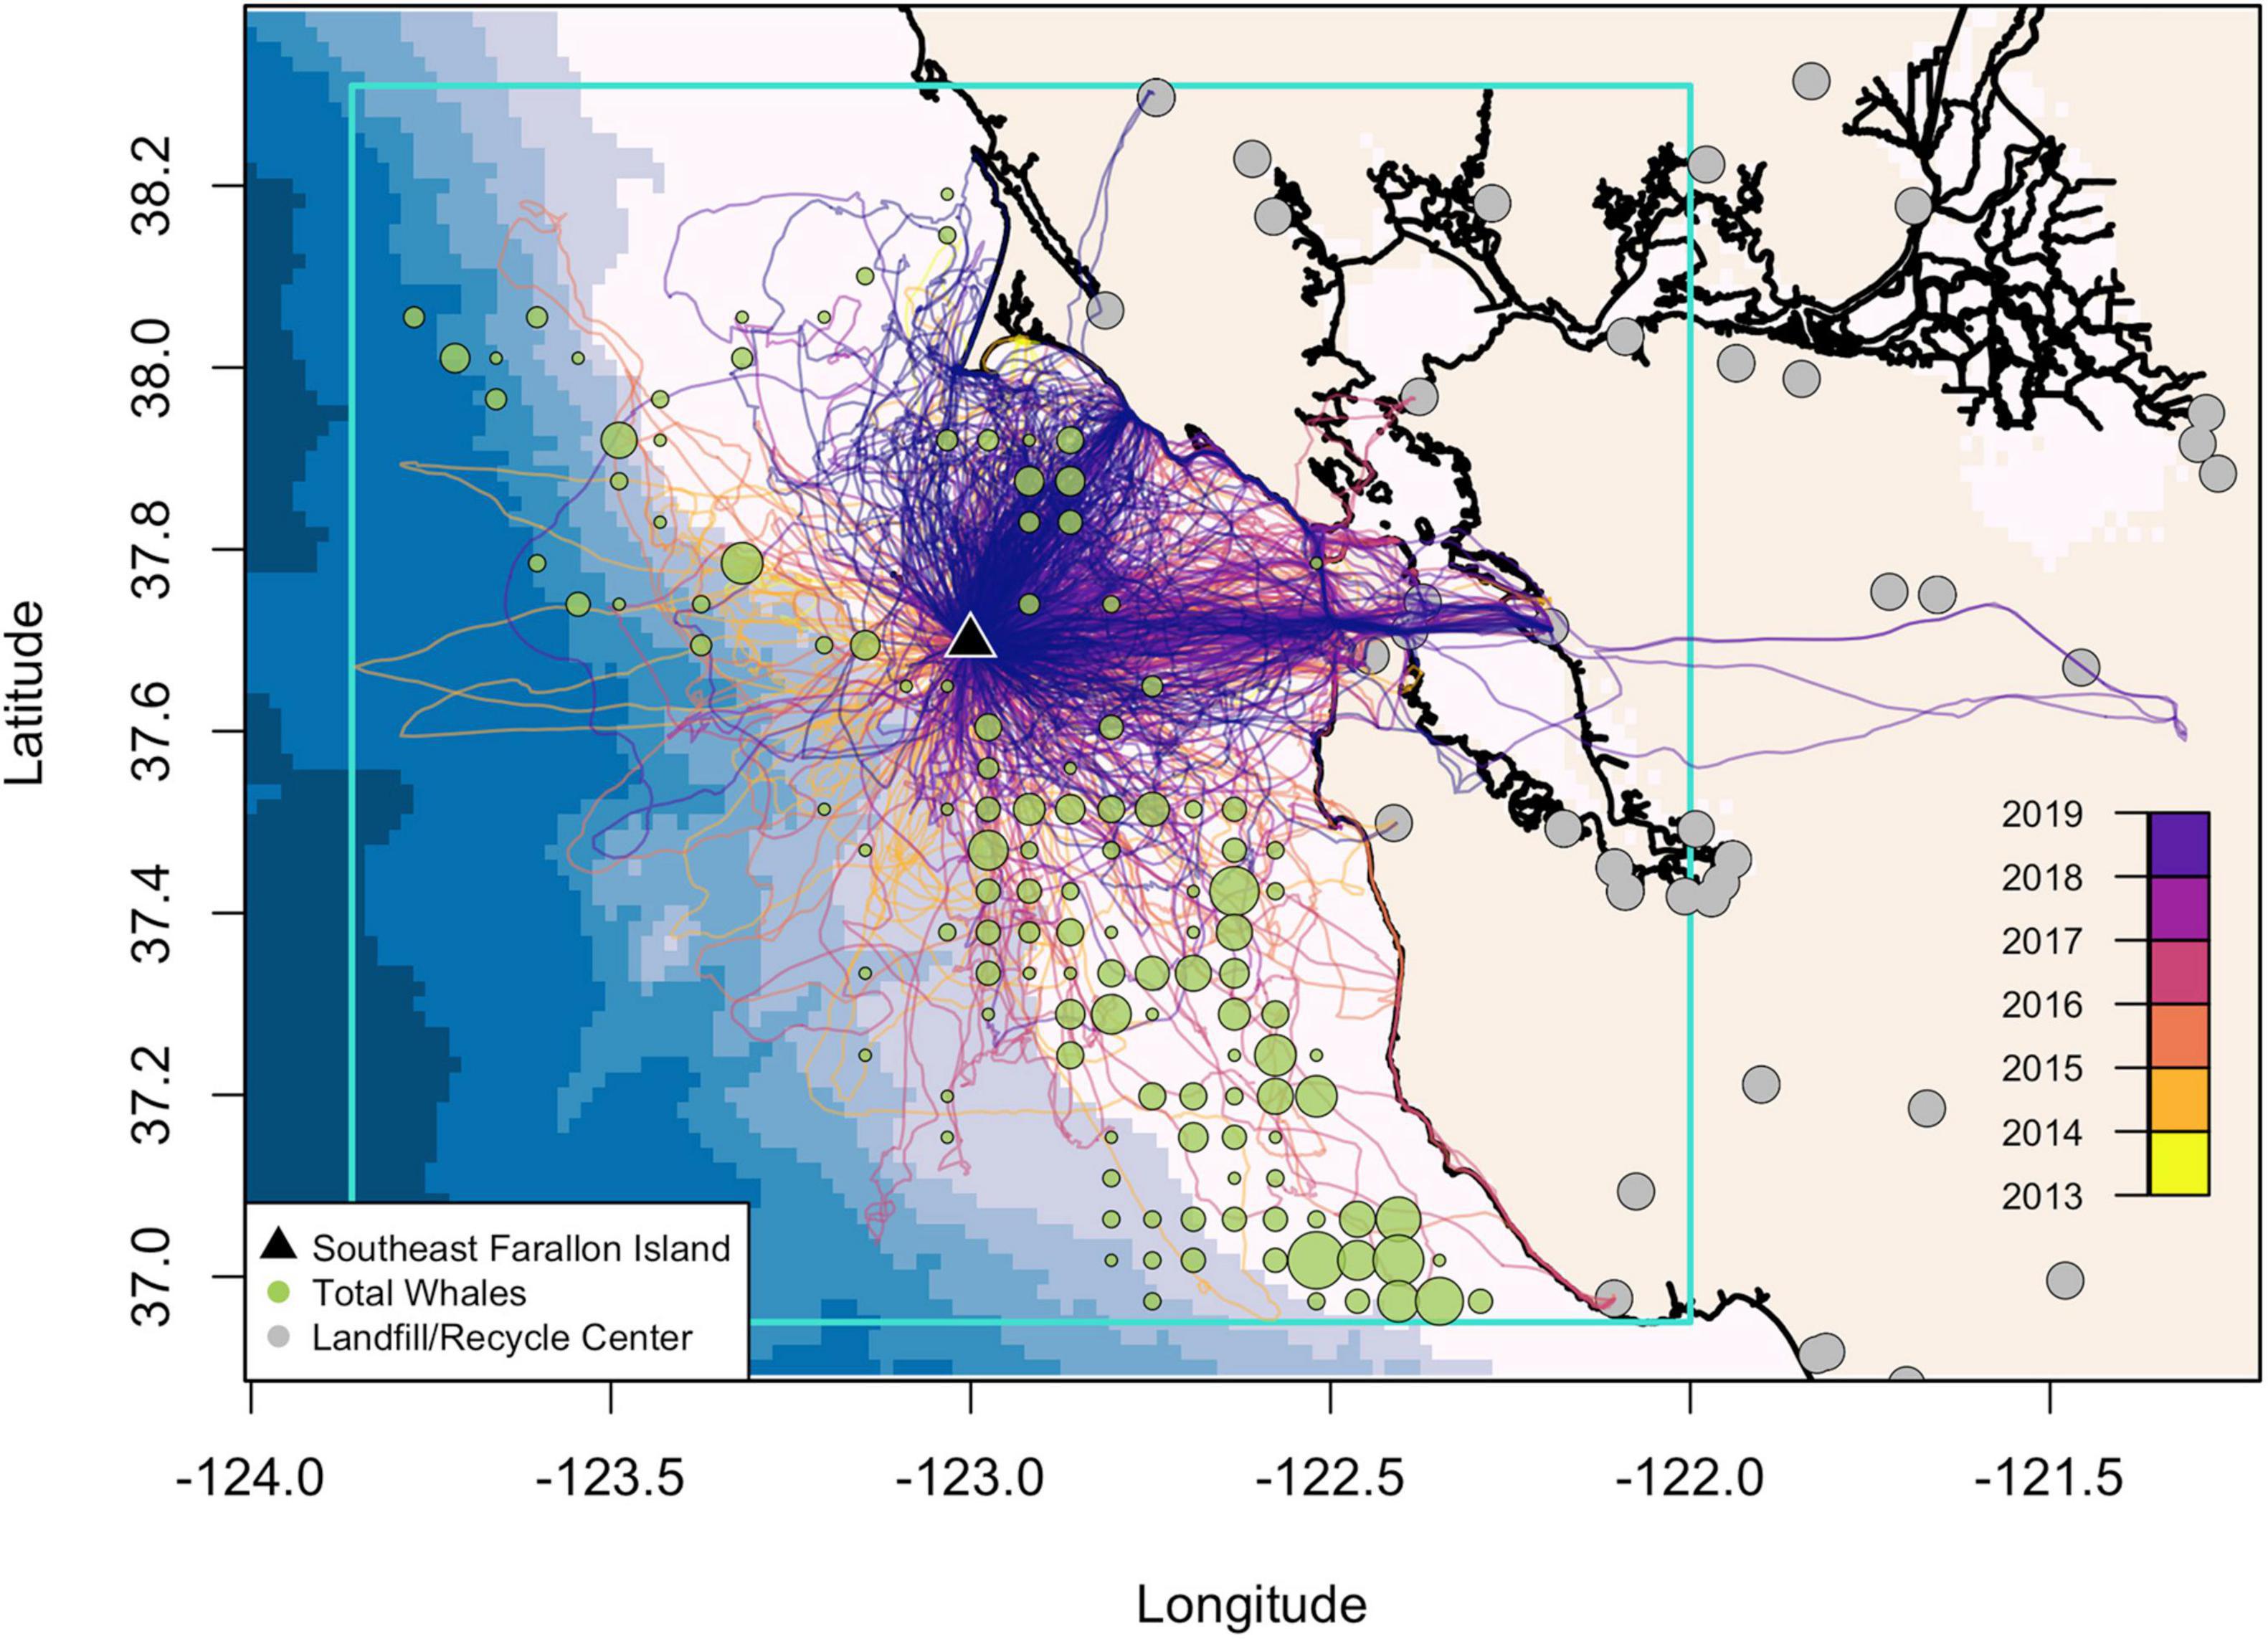
Figure 2. Map of western gull tracks from 2013 to 2019 from their breeding colony on Southeast Farallon Island, east of the San Francisco Bay, California, United States (inset). The blue box is the study region. The total number of humpback whale sightings (summed on a 5 km × 5 km grid) from 2013 to 2019 from the Rockfish Recruitment and Ecosystem Assessment Survey where the size of the circle is scaled from 1 to 23 individuals. Note, the survey did not equally cover our entire study area. Landfill or recycling center locations are denoted in gray and bathymetry is shown in the background from 0 to 3,800 m depth in ∼600 m increments.
Using this survey data, the number of western gulls and humpback whales were summed within the same 5 km × 5 km grid cells each year (see Supplementary Figure 1). Further, to investigate associations between the two species each year, we determined the grid cells where humpback whales were present and retaining only those cells, we determined the number of western gulls and humpback whales within those grid cells. The proportion of those grid cells where both species were present was determined to understand the likelihood of associations in the two species distributions. It was inappropriate to do the comparison by first determining where gulls were present because gulls spend most of their time at-sea transiting compared to foraging and we only expected their foraging locations to overlap with whales.
Statistical Analyses
We computed Pearson’s correlations between prey abundance indices, gull foraging characteristics, and the HCI. We also calculated correlations between the gridded number of gulls and number of whales from the survey including each grid cell and all years. These correlations provide a simple metric of association among the many investigated time series.
To investigate overlap between whales, gulls and cool upwelled waters, we computed a range overlap metric. Range overlap measures the proportion of a species’ range where another species or habitat condition co-occurs, and is the area occupied by both species or conditions divided by the area occupied by one species (Araújo et al., 2011; Carroll et al., 2019). We computed range overlap for each year between: (a) foraging gull locations from tracking data and cool SST (gulls were the denominator), (b) whales and gulls from survey data (whales were the denominator), and (c) the co-occurrence of whales and gulls from survey data and cool SST (whale and gull co-occurrence was the denominator). Cool SST thresholds were 11.5°C in May and 12.0°C for June (as described in section “Environmental Data”). For a, we computed range overlap separately for May and June in all years while for c, we used only May cool SST as the majority of the RREAS survey occurs in May. Range overlap has values from zero to one, where one indicates high overlap. We report the mean and standard deviation of all years.
We tested whether the proportion of foraging events at specific locations (e.g., near shore and on land) were related to the HCI and prey abundances. We tested 12 models in total for each proportional dataset, six models with May HCI and the abundance of each prey species and six models with June HCI and the abundance of each prey species. We used generalized additive models (GAMs) fit using the “mgcv” package in R (R Core Team, 2020), using the “betar” family that is appropriate for proportional data and logit-link function. GAMs can fit complex non-linear relationships using a smoothness parameter estimated by generalized cross-validation. In cases where a non-linear relationship did not exist and a linear relationship was more appropriate, we did not use the smoothness parameter. We tested for multicollinearity between predictor variables using variance inflation factors, which we found was not a problem as all values were <4 (O’Brien, 2007). We calculated variable importance using the “caret” R package. Akaike information criterion corrected for small sample size (AICc) was used to rank model performance, where models with a ΔAICc < 2 were considered to have substantial support and > 10 had no support (Burnham and Anderson, 2002). We removed models that had negative R2-values, which indicated the model fit was worse than a horizontal line. We report the R2, deviance explained and Akaike weight as an indicator of model performance for all models with a ΔAICc < 10.
Results
Western Gull Foraging Patterns
After applying our filtering criteria, there were foraging tracks from 125 gulls yielding a total of 544 complete foraging trips. Of these, 516 foraging trips included at least one foraging event, with a total of 3,762 foraging events across all trips (Table 1). Gull foraging trips were concentrated along the continental slope or shelf where whales typically aggregate (Figure 2 and Supplementary Figure 1), along the shoreline, and to specific landfill/recycling center locations in urban areas (Figure 2).
There was interannual variability in foraging trip characteristics. The highest percentage of land trips out of the total number of trips were in 2015 (45%), 2016 (50%), and 2017 (59%), and the lowest percentage of land trips were in 2014 (19%), 2018 (27%), and 2019 (21%, Table 1). Mean trip duration ranged from 8 to 15 h for land trips and ∼3–4 h for sea trips (Figure 3A). There were no significant differences between the duration of land trips across years or the duration of sea trips across years (p > 0.05) but the durations of land trips were significantly longer than sea trips in all years (z-statistic(z) = −3.7 to −11.9, p < 0.001). The mean maximum trip distance from the breeding colony was 45–60 km for land trips and 17–30 km for sea trips, and the mean total distance traveled was 110–170 km for land trips and 45–70 km for sea trips (Figure 3B). There were no significant differences between the maximum distance or total distance traveled for land trips across years or the maximum distance or total distance traveled for sea trips across years (p > 0.05). In all years, the maximum distances of land trips were significantly farther than sea trips (z = −2.8 to −12.6, p < 0.001), and the total distances of land trips were significantly farther than sea trips (z = −2.6 to −11.8, p < 0.001). On average, land trips were 8.2 h longer, 31.4 km farther from the colony, and the total distance of the trip was 90.7 km farther.
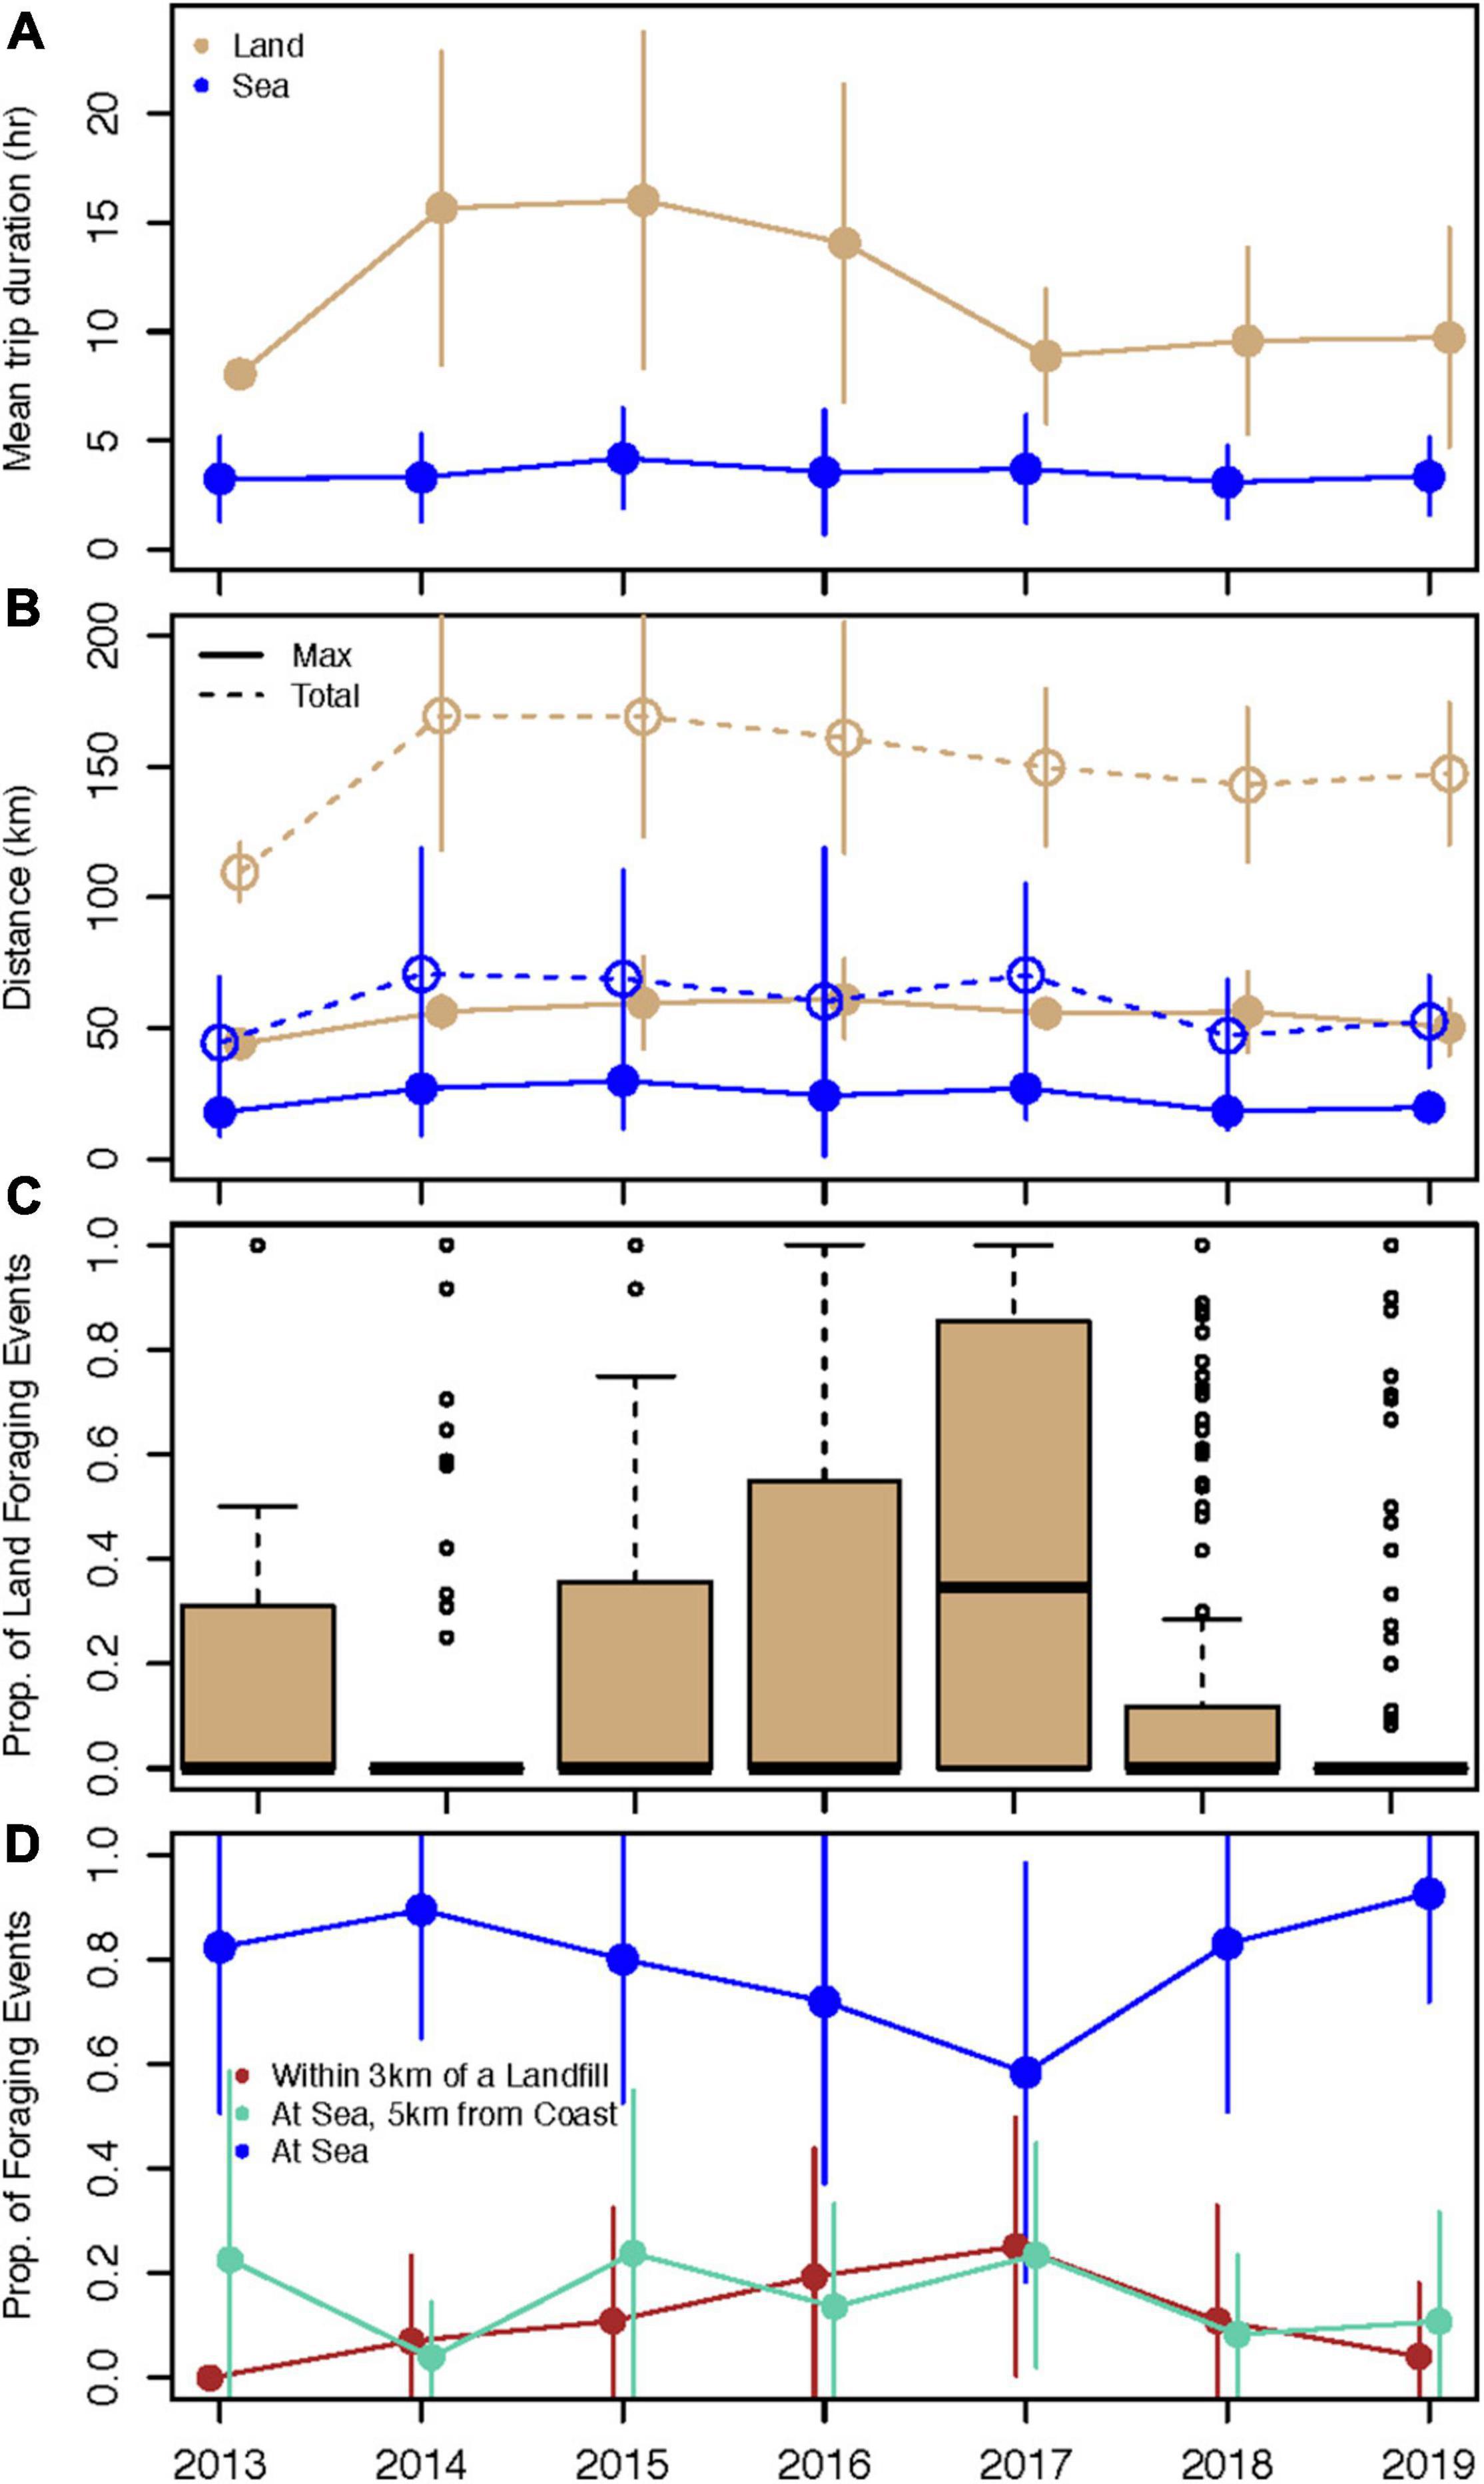
Figure 3. Summary of western gull foraging trip characteristics by year. For trips where land was visited and at-sea only trips, (A) mean and standard deviation in foraging trip duration and (B) the maximum distance traveled from the colony and total distance traveled per trip. (C) Boxplot of the proportion of foraging events on land for each trip. The box represents the interquartile range, the horizontal line is the median, the whiskers represent the range of non-outlier observations, and circles are outliers. (D) The mean and standard deviation in the proportion of foraging events for each trip that were at sea, at sea and within 5 km of the shoreline, and within 3 km of a landfill/recycling center.
Gulls foraged at sea but also at a variety of sites on land, including landfills, parks, cemeteries, fast food, and other restaurants. The proportion of foraging events that were on land for each trip was generally low but there were always a few trips that solely or partially had foraging events on land (Figure 3C). On average, ∼80% of foraging events were at sea while ∼20% were near shore or a landfill (Figure 3D). There were significantly more foraging events at sea in 2019 compared to 2015 (z = 2.91, p = 0.07), 2016 (z = 3.41, p = 0.01), and 2017 (z = 4.27, p < 0.001) as well as less foraging at sea in 2017 compared to 2014 (z = −2.96, p = 0.06). There were significantly fewer foraging events near landfills in 2019 compared to 2015 (z = −3.08, p = 0.04), 2016 (z = −4.11, p < 0.001), 2017 (z = −4.39, p < 0.001), and marginal significance in 2018 (z = −2.83, p = 0.09). Similarly, there was less foraging near the shore in 2014 compared to 2015 (z = 4.00, p = 0.001) and 2017 (z = 4.04, p = 0.001); and marginally less foraging near the shore in 2018 compared to 2015 (z = −2.87, p = 0.09) and 2017 (z = −2.95, p = 0.07). Some of the annual foraging characteristics (e.g., distance and duration) were significantly related to each other (see Supplementary Figure 2).
Gull Habitat Space in Relation to Coastal Upwelling and Prey Abundance
Western gull foraging habitat space varied by year as did the area with cool upwelled waters and regional prey abundances. Core foraging areas (within the 50% contour of the kernel densities of foraging locations) generally encompassed an area adjacent to the colony but oriented in different directions each year (Figure 4). In 2013, 2014, 2018, and 2019, foraging occurred predominantly to the north of the colony, and in 2014–2017, foraging also occurred to the west and there were larger hotspots over landfill locations over the mainland. The location and area of cool surface waters varied, with the greatest compression shoreward and to the north occurring in 2015–2016 and 2019. The spatial footprint of cool waters was generally similar in May and June but with a greater southward extension during May in 2014–2017 and during June in 2018–2019. Despite the variability in location of cool waters, gulls often foraged within these areas. The range overlap between foraging locations from gull tracking data and cool SST generally showed high overlap (0.73 ± 0.33, see annual values for May and June on Figure 4). However, 2019 had low overlap due to the small area of cool waters in the north but it should be noted that gulls foraged to the north of the Farallon Islands toward the region with cool waters.
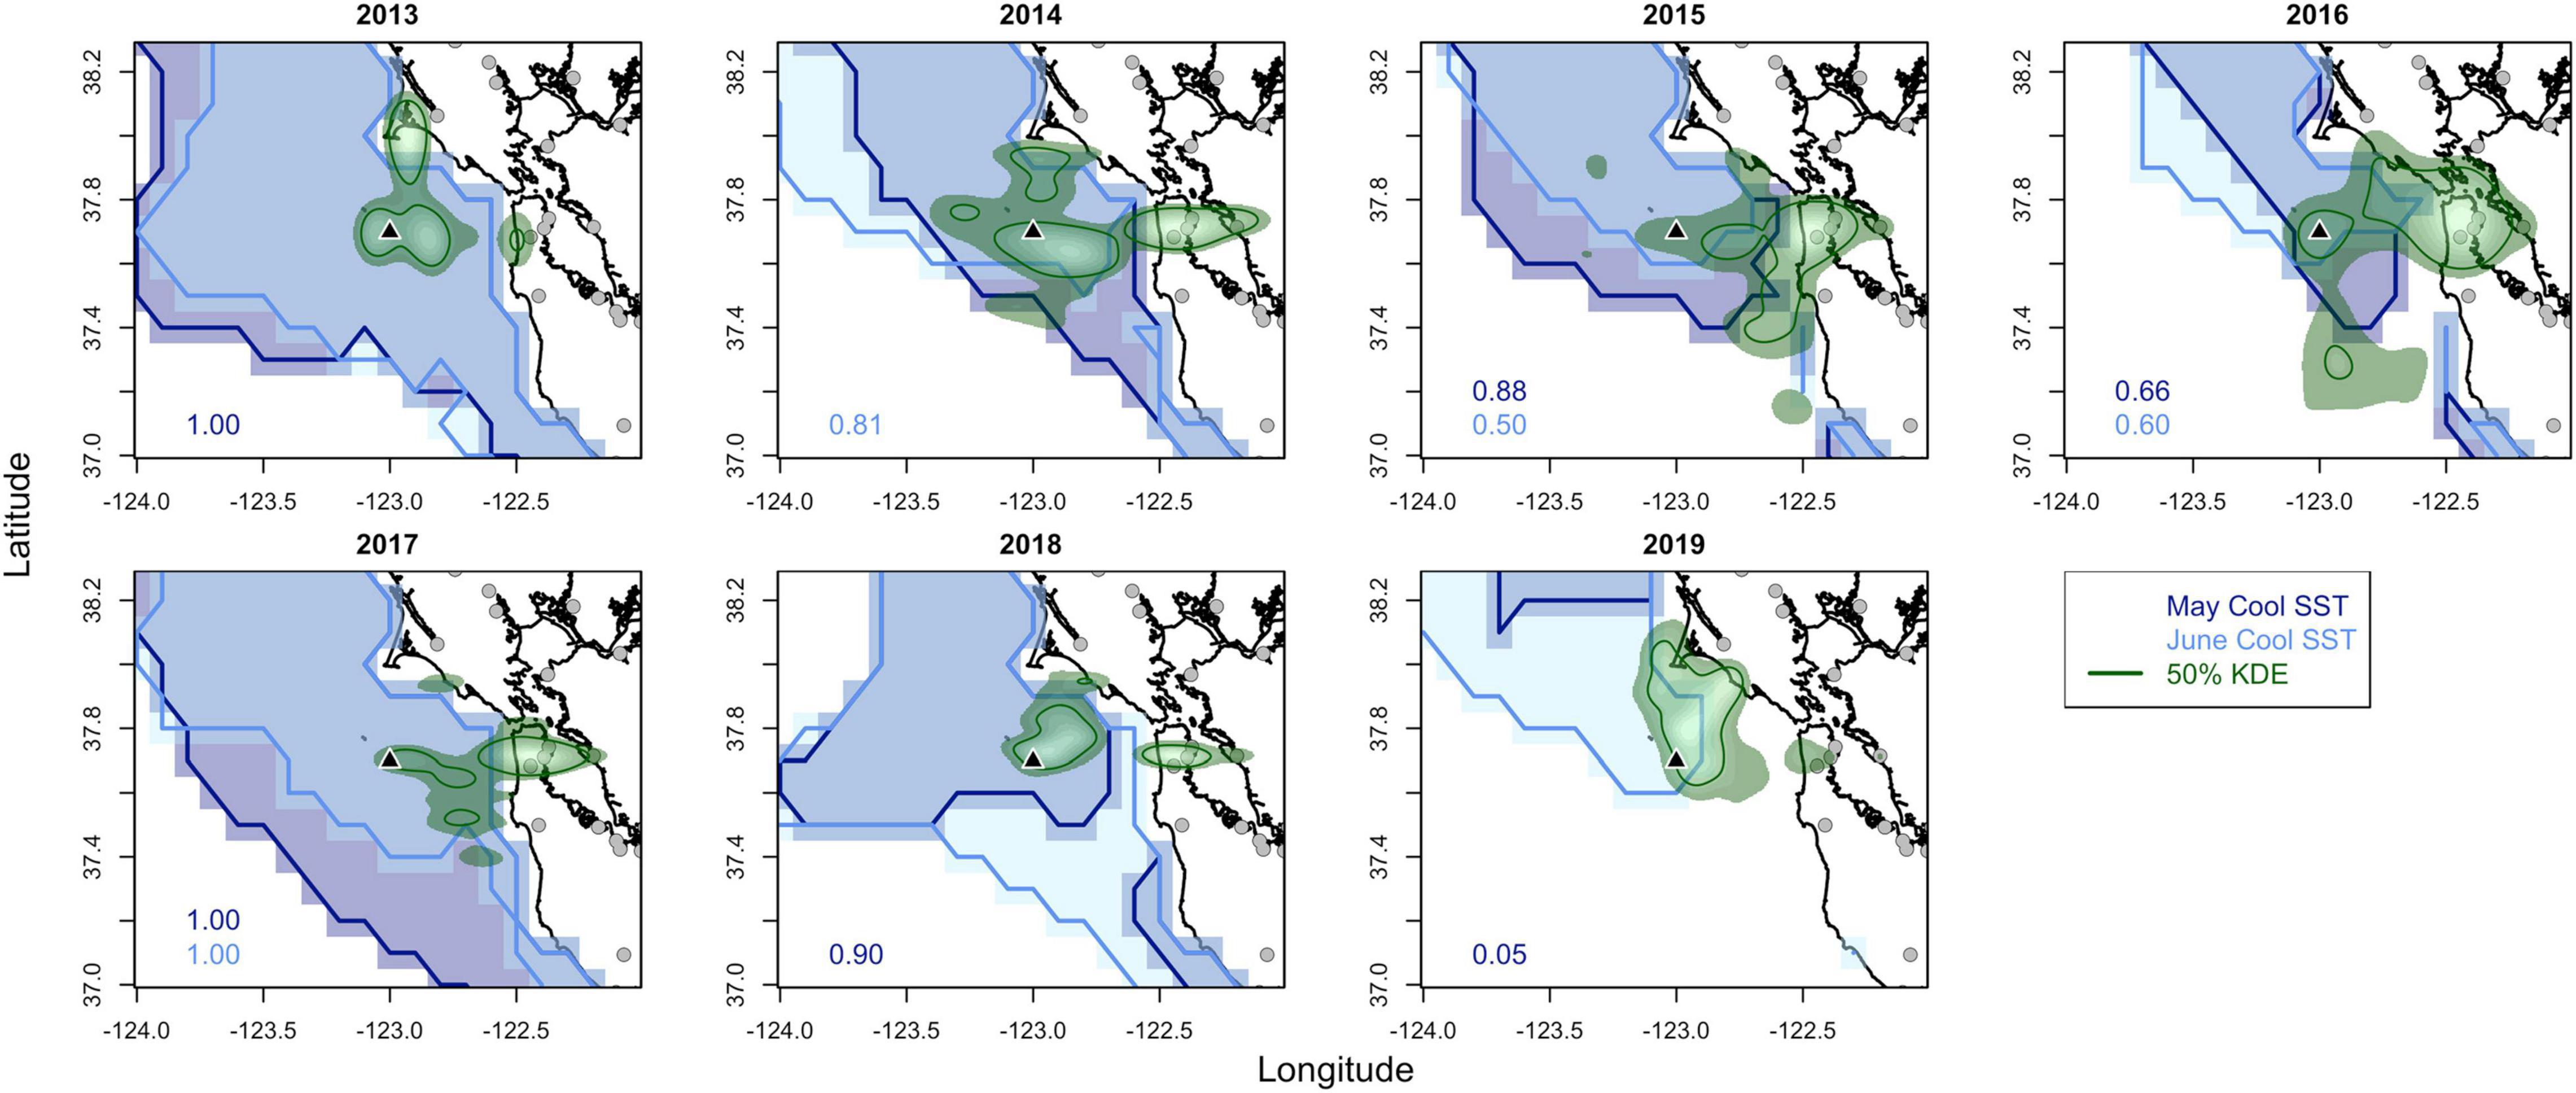
Figure 4. Western gull kernel density estimates (KDE, green) for foraging locations for each year with the outer area being the 75% KDE and the inner 50% KDE line representing the core foraging area. The area with cool sea surface temperature (SST) in May (SST below 11.5°C) and June (SST below 12°C) is shown with the numbers indicating the range overlap between gull foraging locations and cool SST for each month. Southeast Farallon Island is the black triangle and landfills/recycling centers are the gray circles.
Interannual variability in prey distribution and abundance was observed, including latitudinal and onshore-offshore patterns (Supplementary Figure 3). Focusing on trawl data around the Farallon Islands, the most abundant prey item was krill (mean CPUE 7.91), which had dips in abundance in 2015–2016 and 2019 (Figure 5A). Market squid had a mean abundance of 2.88 CPUE with a dip in 2016. Rockfish YOY peaked in 2015 (4.85 CPUE) and declined from 2016 to 2019 to 0.85 CPUE. Pacific sanddab YOY followed a somewhat similar trend to rockfish, peaking in 2014 and declining from 2015 to 2019 (0 CPUE) with a small peak in 2018. Comparatively, northern anchovy YOY were least abundant with small peaks in 2015 (1.18 CPUE) and 2019 (0.60 CPUE) while adult anchovy CPUE increased in 2018–2019 to 3.42 from 0. Annual prey abundances were not correlated to each other except for a marginal relationship between rockfish YOY and anchovy adults (r = 0.70, p = 0.08; Supplementary Figure 2).
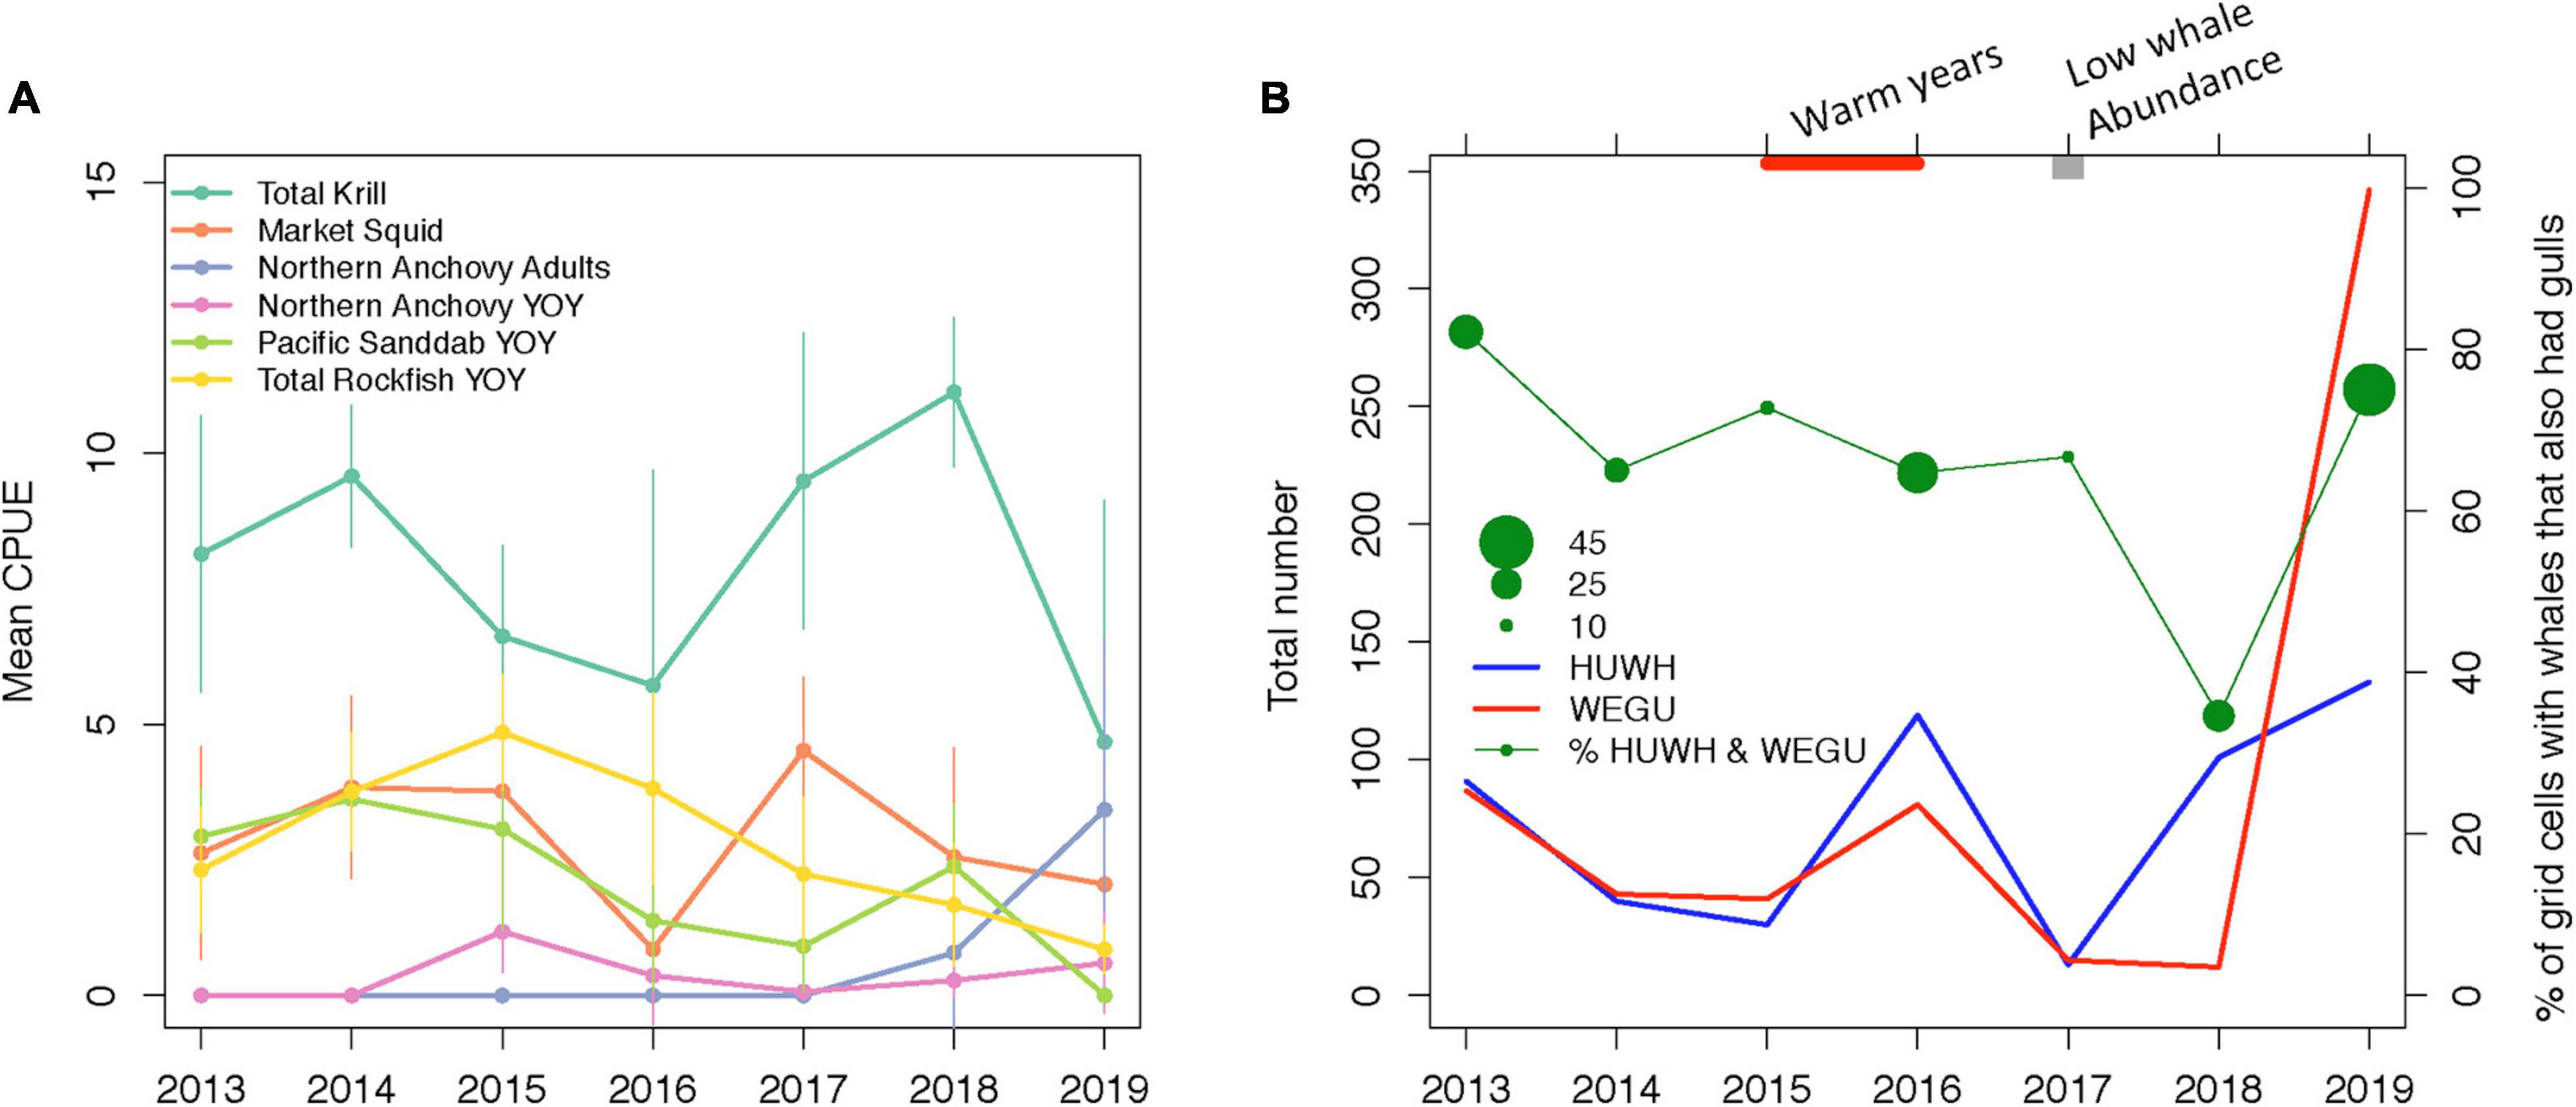
Figure 5. Prey indices and predator overlap from the ecosystem survey. (A) Mean and standard deviation in Catch-Per-Unit-Effort [ln(CPUE + 1)] of prey species within the 5 or 6 trawl stations surrounding the Farallon Islands (see Supplementary Figure 3). For taxa with multiple species, the “total” abundance of all species was used. (B) The number of humpback whales (HUWH, blue line) within 5 km × 5 km grid cells within the gull foraging domain (blue box in Figure 1) and the number of western gulls (WEGU, red line) in grid cells where humpback whales were observed from 2013 to 2019. The percentage of grid cells with whales that also had gulls (green line) with the size of the circle indicating the number of grid cells where at least 1 whale was present. During 2015 and 2016, there were marine heatwave impacts on our study area, and in 2017, there were regionally low humpback whale abundances.
Given significant interannual variability in the proportion of foraging events that were on land, at sea, near shore or a landfill, we tested for drivers of this interannual variability focusing on the proportion of foraging events on land and near shore given the high correlations between these proportional datasets (Supplementary Figure 2). The proportion of foraging events on land was related to the HCI during May (variable importance 63.3%) and Pacific sanddab YOY abundance (variable importance 36.7%, Table 2 and Supplementary Table 1). Gulls foraged over land more frequently when the HCI was high (i.e., high shoreward compression of upwelled water) and when sanddab abundance was low (Supplementary Figure 4A). The proportion of foraging events near shore was also related to the HCI during May (variable importance 58.2%) and krill abundance (variable importance 41.8%, Table 2 and Supplementary Table 1). Gulls had more foraging events near shore when the HCI was high and krill abundance was low (Supplementary Figure 4B). The two best performing models only explained 50–60% of the deviance (Table 2).
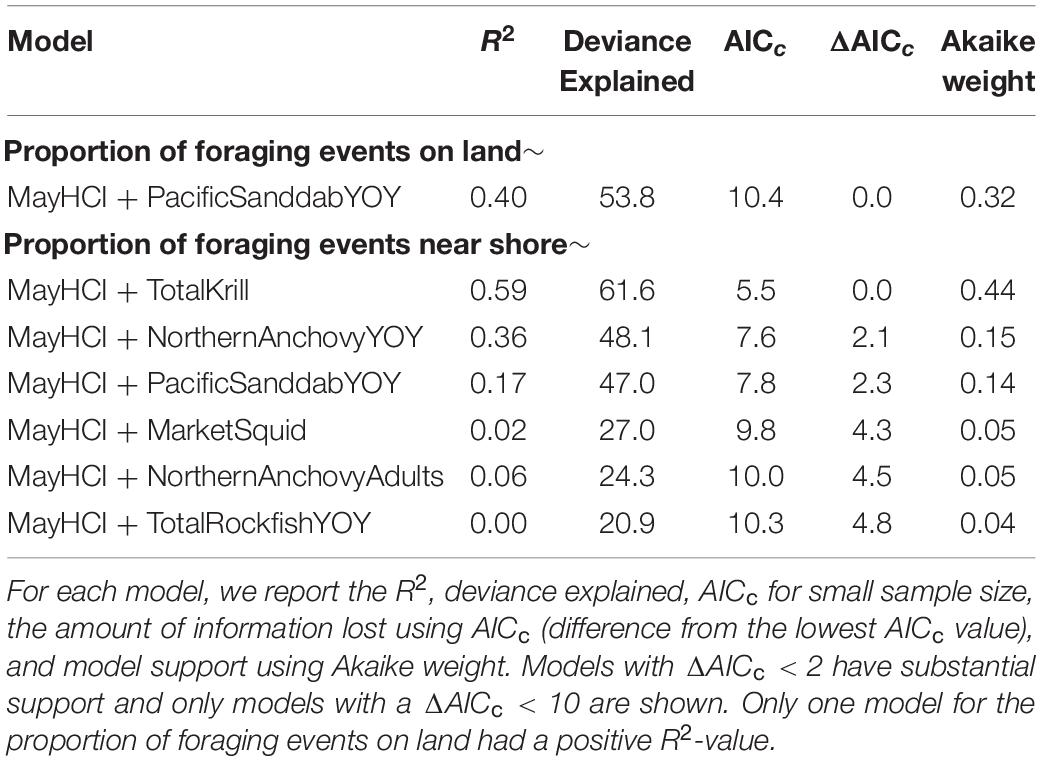
Table 2. Generalized additive models relating the proportion of foraging events on land and near shore to the Habitat Compression Index (HCI) and prey abundances.
Ecosystem Survey Informs Overlap of Humpback Whales and Gulls
The ecosystem survey coverage varied each year but in general, spatial patterns in visual sightings revealed that western gulls were likely to be present near the Farallon Islands and that humpback whales were more abundant south of the island (Figure 2 and Supplementary Figure 1). Across years, there were a total of 9–44 grid cells per year where humpback whales were observed (see the size of circle in Figure 5B). The total number of whales within those grid cells ranged from 13 to 133 and the total number of gulls ranged from 12 to 342. A higher abundance of whales within a grid cell was weakly, but positively correlated to gull abundance (Spearman’s Rank rho = 0.18, p = 0.02). During all years except 2018, 65–82% (mean 71%) of grid cells had both whales and gulls present. In 2018, despite a moderate number of whales observed (101 whales in 26 grid cells), there were few gulls sighted resulting in only 35% of grid cells with both species, which is likely related to the small area surveyed outside of the gull foraging region (Supplementary Figure 1). In 2017, the survey reported the fewest number of whales observed (13 whales) concomitant with the second lowest number of gull sightings in 2018. Range overlap indicated a high degree of overlap between whales and gulls from the survey data (0.71 ± 0.13), and where whales and gulls co-occurred, there was often high range overlap with cool SST (0.82 ± 0.16 for 2013–2018, with no overlap in 2019 as the footprint of cool SST was small, Figure 4).
Discussion
We examined the drivers of interannual variability in western gull foraging behaviors at the Farallon Islands and the utility of western gulls as an ecological indicator by combining animal tracking data, ecosystem survey data on multiple predator and prey species, and oceanographic data on upwelling. Our analysis suggests that western gulls can serve as a valuable ecosystem sentinel and more specifically as a fine-scale indicator of humpback whale presence. Specifically, our results indicate that gull foraging behavior can differ between years, where this behavioral plasticity combined with the capacity to exploit resources in both marine and terrestrial habitats may allow gulls to buffer more extreme oceanic events (e.g., marine heatwaves) compared to other seabird species with less flexible diets and behavior. Gull foraging patterns were coincident with regions of cool upwelled waters, foraging closer to shore and on land in years when there was higher compression of upwelled water and lower prey abundances. Evidence that gull at-sea distributions were associated with humpback whales suggests prey accessibility may be more important than prey-abundance alone. However, continued sampling that increases this short time window within a season and tagging outside the breeding period could be key factors that may strengthen these relationships.
Gull Foraging Patterns in Relation to Environmental Variability
Although seabird foraging behavior often relates to ecosystem state, including variables such as productive waters, prey distribution, abundance and accessibility (reviewed by Durant et al., 2009), the utility of western gulls as an ecosystem indicator was unknown. Many gull species employ a dual-habitat foraging strategy alternating between marine and terrestrial habitats (e.g., Schwemmer and Garthe, 2008; Garthe et al., 2016; Navarro et al., 2017). The most striking patterns in gull foraging behavior were interannual shifts in foraging locations between landscapes and seascapes. When conducting land trips, the gulls mainly followed and foraged along the shoreline or visited specific landfills/recycling centers (as previously identified by Shaffer et al., 2017). A flexible diet and plasticity in foraging dynamics may allow gulls to adapt to a changing environment, and terrestrial habitats with predictable food sources may provide a buffer in years when food at sea is harder to acquire (Garthe et al., 2016; Navarro et al., 2017).
The interannual variability in gull behavior and habitat use appears somewhat related to environmental conditions as more near shore and land foraging occurred during years with high upwelling habitat compression. During our study, marine heatwaves caused unprecedented ocean warming, altered upwelling and impacted ecosystem dynamics (e.g., Cavole et al., 2016; McCabe et al., 2016; Ryan et al., 2017; Santora et al., 2020). Marine heatwaves cause a shoreward compression of cool surface waters (e.g., 2015) whereas strong upwelling conditions often result in cool surface waters extending further offshore (e.g., 2013, Checkley and Barth, 2009; Bograd et al., 2019). The 2015 marine heatwave (Bond et al., 2015) was followed by a moderate El Niño in late 2015/early 2016, which coincided with shoreward habitat compression. During 2015–2017, a higher proportion of foraging occurred nearshore and on land. While upwelling conditions and habitat compression may have influenced gull foraging dynamics in 2015–2016, gull foraging behavior in 2017 (the year with the most foraging on land) cannot solely be explained by oceanographic anomalies. To establish more robust climate connections, we acknowledge that a longer time series is necessary.
Gull Foraging Behavior in Relation to Prey Species During Incubation
Gull food consumption and foraging strategies can vary with food availability, breeding stage, and intraspecific competition (Annett and Pierotti, 1989; Belant et al., 1998; Camphuysen et al., 2015; Corman et al., 2016; Isaksson et al., 2016; Navarro et al., 2017). The variability in prey communities and shifts in gull foraging dynamics suggests that the prey species consumed varied both intra- and interannually. We found that there were more gull foraging events on land and near shore when Pacific sanddab and krill abundance was low, respectively. These models explained 50–60% of the deviance, with prey abundances contributing 35–40% to the models. Apart from these relationships, we did not find evidence that prey abundance around the Farallon Islands was related to other gull foraging dynamics but more complex and finer-scale comparisons between the prey field and foraging behavior may be needed as the spatial structure of prey communities are convoluted (see Supplementary Figure 3). It is also possible that stronger relationships between gull foraging dynamics and prey exist during the chick-rearing period, when gulls prey switch from human refuse to marine resources (Spaans, 1971; Ward and Zahavi, 1973; Annett and Pierotti, 1989). Food found on land can be of lower quality leading to reduced breeding success (Isaksson et al., 2016) but adults may initially forage on land due to the predictability and abundance of food. Therefore, foraging at landfills could provide a buffer for adults during incubation when prey availability at sea is low, but this may not provide a buffer for chicks who either reject items from landfills or do not get adequate nutrition (Annett and Pierotti, 1989; Isaksson et al., 2016).
Gull Foraging Behavior as an Indicator of Humpback Whales
Another critical factor to consider when characterizing gull foraging behavior and prey availability is gull feeding associations with humpback whales. From visual sighting data, ∼70% of humpback whale observations coincided with gulls, which is also supported by high range overlap (0.71). While present in central California, humpback whales prey switch from krill to anchovy when krill are less available, which results in changes in feeding locations from offshore to onshore habitats (Ainley and Hyrenbach, 2010; Santora et al., 2018, 2020; Figure 1). In 2015–2016, onshore shifts of whales due to prey availability was also driven by upwelling habitat compression. This same relationship was seen in the gull tracking data, where there was a higher proportion of foraging locations near shore under high habitat compression and low krill abundance. There were also more foraging events on land during high compression, suggesting gulls take advantage of predictable terrestrial feeding hotspots. Further, when whales and gulls co-occurred, it was often within cool upwelled waters. As noted above, 2017 was the year with the most foraging on land, which could not be explained by environmental characteristics alone. Whale abundance in the region was low in 2017, with the second lowest encounter rate from 1996 to 2019 (Wells et al., 2017; Thompson, 2019), and distributed shoreward likely feeding on anchovy (Wells et al., 2017), which aligned with gull foraging locations (Figure 4). If whales were a key factor in making prey available to gulls and whales were not highly abundant, gulls likely shifted their foraging locations to regions with predictable sources of food (such as landfills). Further, if whales aid in making prey available, it is not surprising that prey abundances were not the main driver of gull foraging behavior as gulls are capable of switching among many species of krill, fish and squid when available within surface waters. Overall, whales respond to prey and oceanographic dynamics in a predictable manner (Santora et al., 2020; Ingman et al., 2021; Figure 1), and our findings suggest gulls respond in the same way. Given that gull distributions were related to humpback whale presence, gulls could perform as an informative indicator of ecosystem state.
Using Gulls for Marine Spatial Planning and Conservation
Fishery and vessel interactions with protected species pose a risk to populations and are a global conservation issue (Read, 2008). Entanglement in trap fisheries is thought to be the most common source of human-related injury or mortality to humpback whales followed by ship strike (Carretta et al., 2015). With whale protections under the Marine Mammal Protection Act, entanglements and ship strikes generate public concern and many agencies are actively working to recover these populations. To reduce risks to whales, it is critical to identify where and when threats occur. While ship strikes often occur in the vicinity of large ports (especially off San Francisco for humpbacks) with peaks in high traffic summer months (Rockwood et al., 2017; Keen et al., 2019), the Dungeness crab fishery is usually open from mid-November to the end of June with the highest activity from mid-November to February (Carretta et al., 2015; Figure 6). Indicators that provide actionable high-resolution information are critical as more decision support tools are needed (Santora et al., 2020), especially given that earlier arrivals, longer residency and higher concentrations of whales in central California could lead to increased risks (Ingman et al., 2021).
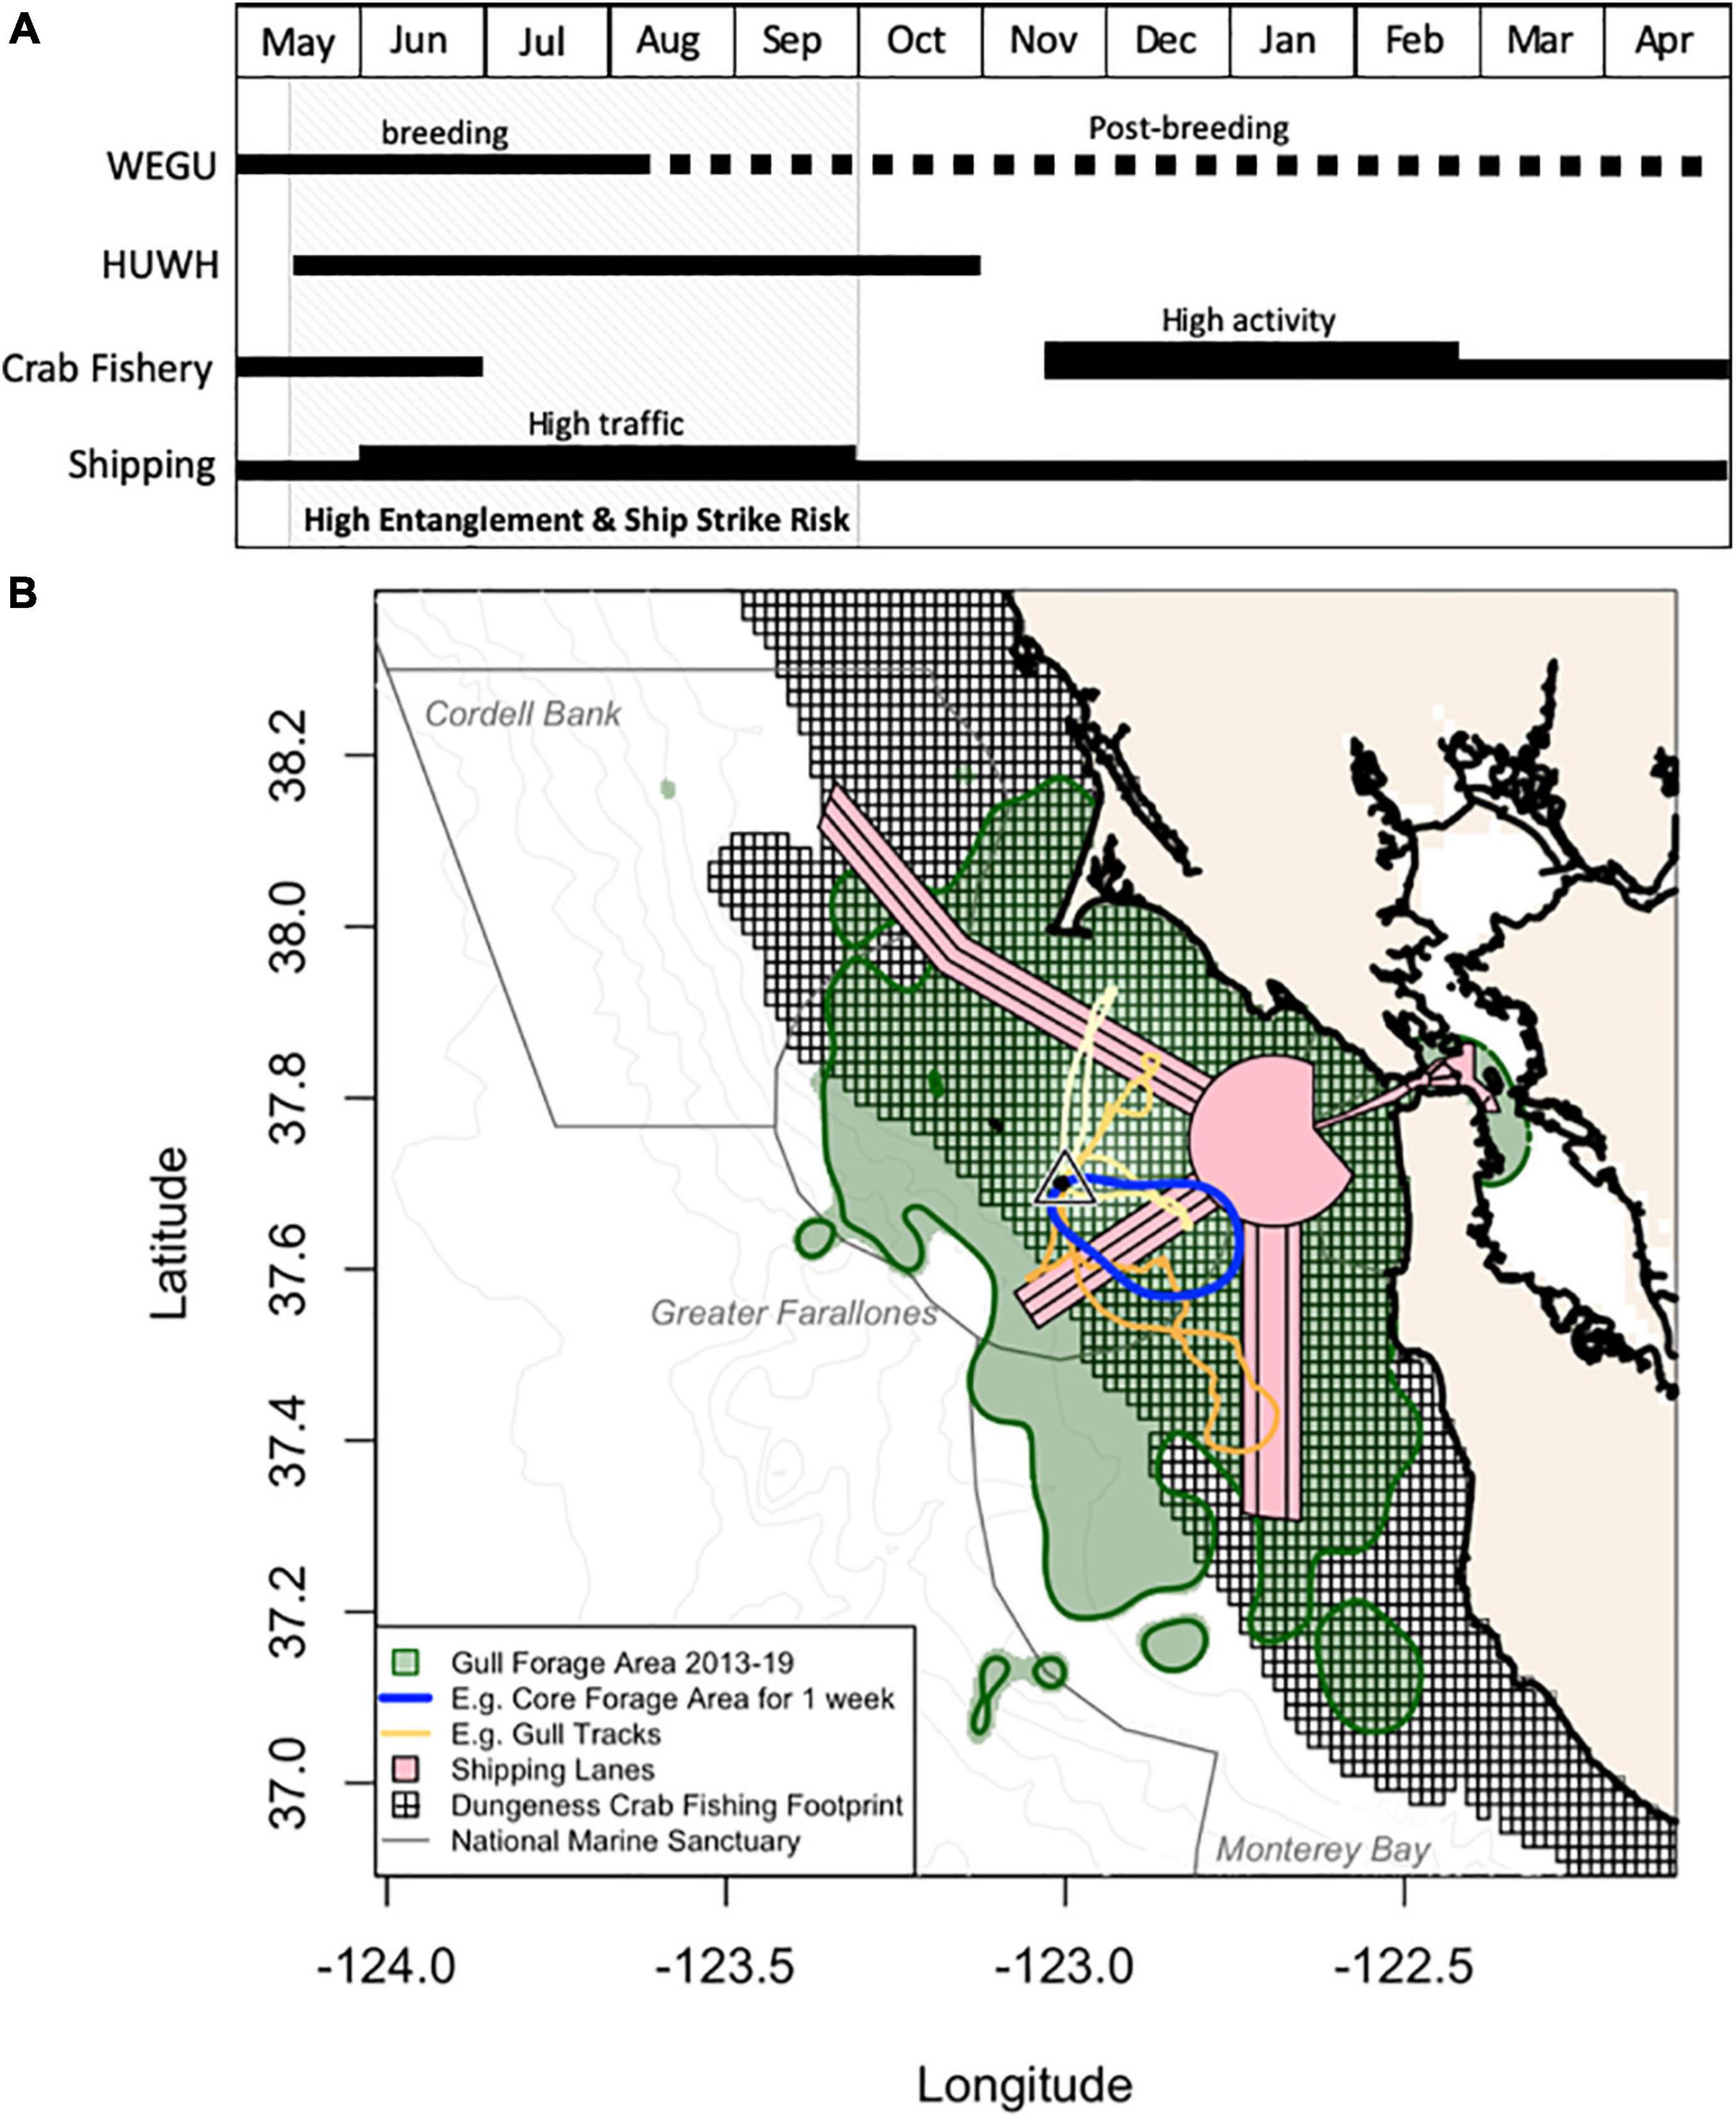
Figure 6. Temporal and spatial overlap of western gulls (WEGU), humpback whales (HUWH), the Dungeness crab fishery, and shipping traffic in central California. (A) Phenology of the WEGU annual cycle at Southeast Farallon Island (black triangle) and HUWH presence in central California. After the gull breeding period, many birds remain in the Greater Farallones region occasionally visiting their colony. The Dungeness crab fishery operates from November to June with a peak in November—February. Shipping traffic outside of the San Francisco Bay is present year-round with a peak in the summer (June—September). Whale entanglement and ship strike risk occurs roughly from May to November (depending on whale arrival and departure dates), with the highest risk period between May and September (gray shading). (B) An example of a gull tracking visualization that could exist on an indicator dashboard highlighting: shipping lanes, the footprint of the crab fishery (<180 m), and gull foraging metrics including habitat use over 2013–2019 [95% kernel density estimate (KDE)], core habitat space over a 1-week period (50% KDE), and four examples of foraging trips. Also shown are three National Marine Sanctuary borders and bathymetry contours.
By using animal tracking data and known seabird-cetaceans feeding associations, we can obtain information on where humpback whales face threats from fisheries or large vessels. Western gulls occupy their Farallon Island breeding colony during a critical period when shipping traffic is high, crab fishing is ending, and humpback whales arrive in the region (Figure 6). Although the gull breeding period ends in late July/early August, many individuals remain nearby until the majority of the population returns in October-November (Spear, 1988; Ainley, 1990). Thus, the population has the capacity to provide clues about how the ecosystem and humpback whale distributions shift over the summer-fall entanglement and ship strike period (Figure 6). Such generalist predators also offer a different view on the state of an ecosystem than would a habitat specialist, suggesting that combining a few indicator species could give a more complete assessment of ecosystem response (Hazen et al., 2019). Outfitting a small portion of the gull population with year-round transmitters that are capable of near real-time, remote offload could benefit dynamic ocean management. Successful long-term deployments of tags on birds are also higher than whales due to reduced tag shedding, increased transmissions as birds largely remain above the surface, and reduced tag/labor costs.
The Gulf of Farallones-Monterey Bay area accounts for a high percentage of humpback strike mortality and entanglements, and should be a high priority area for mitigation efforts (Rockwood et al., 2017, 2020). Based on the results presented here, we suggest a few strategies for using gulls to inform ecosystem management. First, from continuous gull tracking datasets, indices on foraging characteristics (e.g., Figure 3) could be produced on daily to weekly scales. A threshold (e.g., >20%) for the proportion of foraging events on land indicates low whale abundances or suboptimal at sea foraging habitats. Second, gull tracking data could be mapped and viewed in relation to crab pot/fishing vessel locations or shipping lanes (e.g., Figure 6), and alerts can be set up to provide an early warning system of potential human-wildlife conflicts. For example, when the gull core foraging area overlaps with a shipping lane, vessel speed reductions could be implemented until that region is no longer highly utilized by gulls likened to a Seasonal Management Area with the designation of temporary “Areas to be Avoided.” Keen et al. (2019) found a 2–3 kt reduction significantly reduces ship strike risk by 20–50%. Core foraging areas could also indicate risky crab pot deployment locations, or signal fishers to retrieve deployed gear. Third, more simply, notifying ship captains of these predictable seabird-cetacean relationships could mitigate ship strike risk as it is easier to spot a gull aggregation above the water and adjust course than a whale on the sea surface.
Visualizations or metrics derived from the tracking data could feed into existing ocean observing dashboards and provide information to the public, fishers, fisheries managers, scientists and other teams who consider the tradeoffs between economic needs and the risk to protected resources. Tracking data yields cost-effective information on fine time and space scales, complementing and improving upon existing coarse resolution indicators used in central California. The tracking and monitoring of new indicator species in addition to existing indicators can provide critical information for identifying and establishing management tools and arming managers with the best information to protect species from climate and anthropogenic threats.
Data Availability Statement
The datasets used in this study are available in publicly accessible websites or repositories, or included in the Supplementary Materials: shoreline data (https://shoreline.noaa.gov/data/datasheets/medres.html), bathymetry/elevation data (https://www.ngdc.noaa.gov/mgg/global/global.html), landfill locations (https://oehha.ca.gov/calenviroscreen/indicator/solid-waste-sites-and-facilities), sea surface temperature is provided as supplementary dataset with access from the UC Santa Cruz Ocean Modeling and Data Assimilation group (https://oceanmodeling.ucsc.edu/ccsnrt/#txtOutput), habitat compression index (https://www.integratedecosystemassessment. noaa.gov/regions/california-current/cc-projects-whale- entanglement), RREAS data (https://data.noaa.gov/dataset/dataset/rockfish-recruitment-and-ecosystem-assessment-survey-catch-data1), and gull tracking data is deposited in the Animal Telemetry Network data portal (https://portal.atn.ioos.us/#metadata/20adbe37-d59b-4bf6-a2e0-db725ecbd29c/project).
Ethics Statement
The western gull tracking study was reviewed and approved by the Institutional Animal Care and Use Committee at San Jose State University (protocol #979) and approved by USFWS Special Use Permits (SUP 81640 and 81641) issued to S.A. Shaffer for research activities at the Farallon Island National Wildlife Refuge.
Author Contributions
SS and MC conceived of the study. SS, PW, and JS collected the data. MC, HW, SS, JS, and IS analyzed the data. MC made the manuscript figures. MC wrote the initial manuscript with contributions from all authors. All authors contributed to the article and approved the submitted version.
Funding
The gull research was supported by grants from SJSU-RSCA, CSU COAST, and the Myers Trust Foundation. Support was also provided from NASA and the U.S. Marine Biodiversity Observation Network (MBON; 80NSSC20M0001).
Conflict of Interest
The authors declare that the research was conducted in the absence of any commercial or financial relationships that could be construed as a potential conflict of interest.
Publisher’s Note
All claims expressed in this article are solely those of the authors and do not necessarily represent those of their affiliated organizations, or those of the publisher, the editors and the reviewers. Any product that may be evaluated in this article, or claim that may be made by its manufacturer, is not guaranteed or endorsed by the publisher.
Acknowledgments
The gull field research would not have been possible without the support of students and Point Blue Conservation Science staff on the Farallon Islands. We thank the U.S. Fish and Wildlife Service for granting permission and providing resources to conduct research on the Farallon Islands National Wildlife Refuge. We would like to thank the captains and crew of the Farallon Patrol including the Army Corps of Engineers, who provided safe passage to and from the Farallon Islands. We thank the NOAA-NMFS RREAS team and the Farallon Institute for maintaining visual surveys.
Supplementary Material
The Supplementary Material for this article can be found online at: https://www.frontiersin.org/articles/10.3389/fmars.2021.790559/full#supplementary-material
Footnotes
- ^ https://www.integratedecosystemassessment.noaa.gov/regions/california-current
- ^ https://www.waste360.com/mag/waste_mapping_landfill_space
References
Abrahms, B., Welch, H., Brodie, S., Jacox, M. G., Becker, E. A., Bograd, S. J., et al. (2019). Dynamic ensemble models to predict distributions and anthropogenic risk exposure for highly mobile species. Divers. Distrib. 25, 1182–1193. doi: 10.1111/ddi.12940
Ainley, D. G. (1990). Seabirds of the Farallon Islands: Ecology, Dynamics, and Structure of An Upwelling-System Community. Palo Alto, CA: Stanford University Press.
Ainley, D. G., and Hyrenbach, K. D. (2010). Top-down and bottom-up factors affecting seabird population trends in the California current system (1985–2006). Prog. Oceanogr. 84, 242–254. doi: 10.1016/j.pocean.2009.10.001
Annett, C., and Pierotti, R. (1989). Chick hatching as a trigger for dietary switching in the Western Gull. Colon. Waterbirds 12, 4–11. doi: 10.2307/1521306
Annett, C. A., and Pierotti, R. (1999). Long-term reproductive output in western gulls: consequences of alternate tactics in diet choice. Ecology 80, 288–297. doi: 10.1890/0012-9658(1999)080[0288:LTROIW]2.0.CO;2
Araújo, M. B., Rozenfeld, A., Rahbek, C., and Marquet, P. A. (2011). Using species co-occurrence networks to assess the impacts of climate change. Ecography 34, 897–908. doi: 10.1111/j.1600-0587.2011.06919.x
Ballance, L. T., Pitman, R. L., and Reilly, S. B. (1997). Seabird community structure along a productivity gradient: importance of competition and energetic constraint. Ecology 78, 1502–1518. doi: 10.1890/0012-9658(1997)078[1502:SCSAAP]2.0.CO;2
Bates, D. M., Maechler, M., Bolker, B., and Walker, S. (2015). Fitting linear mixed-effects models Using lme4. J. Stat. Softw. 67, 1–48. doi: 10.18637/jss.v067.i01
Beal, M., Oppel, S., Handley, J., Pearmain, L., Morera-Pujol, V., Miller, M., et al. (2020). BirdLifeInternational/track2kba: First Release (Version 0.5. 0). Zenodo. Available online at: http://doi.org/10.5281/zenodo.3823902 (Accessed March 14, 2021).
Belant, J. L., Ickes, S. K., and Seamans, T. W. (1998). Importance of landfills to urban-nesting herring and ring-billed gulls. Landsc. Urban Plan. 43, 11–19.
Blondin, H., Abrahms, B., Crowder, L. B., and Hazen, E. L. (2020). Combining high temporal resolution whale distribution and vessel tracking data improves estimates of ship strike risk. Biol. Conserv. 250:108757. doi: 10.1016/j.biocon.2020.108757
Bograd, S. J., Schroeder, I. D., and Jacox, M. G. (2019). A water mass history of the Southern California current system. Geophys. Res. Lett. 46, 6690–6698.
Bond, N. A., Cronin, M. F., Freeland, H., and Mantua, N. (2015). Causes and impacts of the 2014 warm anomaly in the NE Pacific. Geophys. Res. Lett. 42, 3414–3420. doi: 10.1002/2015GL063306
Bretz, F., Hothorn, T., and Westfall, P. (2016). Multiple Comparisons Using R. London: Chapman and Hall/CRC.
Burnham, K. P., and Anderson, D. R. (eds) (2002). Model Selection and Multi-Model Inference: A Practical Information-Theoretic Approach. New York, NY: Springer.
Calambokidis, J., Steiger, G. H., Rasmussen, K., Urbán, J., Balcomb, K. C., Salinas, M., et al. (2000). Migratory destinations of humpback whales that feed off California, Oregon and Washington. Mar. Ecol. Prog. Ser. 192, 295–304. doi: 10.3354/meps192295
Camphuysen, K. C., Shamoun-Baranes, J., Van Loon, E. E., and Bouten, W. (2015). Sexually distinct foraging strategies in an omnivorous seabird. Mar. Biol. 162, 1417–1428. doi: 10.1007/s00227-015-2678-9
Carretta, J. V., Muto, M., Wilkin, S. M., Greenman, J., Wilkinson, K. M., DeAngelis, M., et al. (2015). Sources of Human-Related Injury and Mortality for US Pacific West Coast Marine Mammal Stock Assessments, 2009–2013. NOAA-TM-NMFS-SWFSC-554. Washington, DC: NOAA.
Carroll, G., Holsman, K. K., Brodie, S., Thorson, J. T., Hazen, E. L., Bograd, S. J., et al. (2019). A review of methods for quantifying spatial predator–prey overlap. Glob. Ecol. Biogeogr. 28, 1561–1577.
Cassell, A. L. (2016). Intercolony Comparison of Diets of Western Gulls in Central California. San Jose, CA: San Jose State University.
Cavole, L. M., Demko, A. M., Diner, R. E., Giddings, A., Koester, I., Pagniello, C. M., et al. (2016). Biological impacts of the 2013–2015 warm-water anomaly in the Northeast Pacific: winners, losers, and the future. Oceanography 29, 273–285. doi: 10.5670/oceanog.2016.32
Checkley, D. M., and Barth, J. A. (2009). Patterns and processes in the California Current System. Prog. Oceanogr. 83, 49–64. doi: 10.1016/j.pocean.2009.07.028
Corman, A. M., Mendel, B., Voigt, C. C., and Garthe, S. (2016). Varying foraging patterns in response to competition? A multicolony approach in a generalist seabird. Ecol. Evol. 6, 974–986. doi: 10.1002/ece3.1884
Cox, S., Embling, C., Hosegood, P., Votier, S., and Ingram, S. (2018). Oceanographic drivers of marine mammal and seabird habitat-use across shelf-seas: a guide to key features and recommendations for future research and conservation management. Estuar. Coast. Shelf Sci. 212, 294–310. doi: 10.1016/j.ecss.2018.06.022
Dale, V. H., and Beyeler, S. C. (2001). Challenges in the development and use of ecological indicators. Ecol. Indic. 1, 3–10. doi: 10.1016/S1470-160X(01)00003-6
Davies, T. E., Carneiro, A. P., Tarzia, M., Wakefield, E., Hennicke, J. C., Frederiksen, M., et al. (2021). Multispecies tracking reveals a major seabird hotspot in the North Atlantic. Conserv. Lett. 14:e12824.
Durant, J. M., Hjermann, D. Ø., Frederiksen, M., Charrassin, J.-B., Le Maho, Y., Sabarros, P. S., et al. (2009). Pros and cons of using seabirds as ecological indicators. Clim. Res. 39, 115–129. doi: 10.3354/cr00798
Evans, P. (1982). Associations between seabirds and cetaceans: a review. Mammal Rev. 12, 187–206. doi: 10.1111/j.1365-2907.1982.tb00015.x
Feist, B. E., Samhouri, J. F., Forney, K. A., and Saez, L. E. (2021). Footprints of fixed-gear fisheries in relation to rising whale entanglements on the US West Coast. Fish. Manage. Ecol. 28, 283–294. doi: 10.1111/fme.12478
García-Cegarra, A.-M., Castro, C., and Van Waerebeek, K. (2020). Feeding of humpback whales at low latitudes of the Southeast Pacific Ocean. Neotrop. Biodivers. 421–430. doi: 10.1080/23766808.2021.1971041
Garthe, S., Schwemmer, P., Paiva, V. H., Corman, A.-M., Fock, H. O., Voigt, C. C., et al. (2016). Terrestrial and marine foraging strategies of an opportunistic seabird species breeding in the Wadden Sea. PLoS One 11:e0159630. doi: 10.1371/journal.pone.0159630
Grémillet, D., Gallien, F., El Ksabi, N., and Courbin, N. (2020). Sentinels of coastal ecosystems: the spatial ecology of European shags breeding in Normandy. Mar. Biol. 167, 1–11.
Harrison, C. S. (1979). The association of marine birds and feeding gray whales. Condor 81, 93–95. doi: 10.2307/1367866
Harvey, C., Garfield, N. T., Williams, G., Tolimieri, N., Andrews, K., Barnas, K., et al. (2020). Ecosystem Status Report of the California Current for 2019-20: A Summary of Ecosystem Indicators Compiled by the California Current Integrated Ecosystem Assessment Team (CCIEA). Seattle, WA: Northwest Fisheries Science Center.
Haynes, T., Nelson, S., and Padula, V. (2011). Dynamics of multi-species feeding associations in marine waters near Juneau, Alaska. Mar. Ornithol. 39, 227–234.
Hazen, E. L., Abrahms, B., Brodie, S., Carroll, G., Jacox, M. G., Savoca, M. S., et al. (2019). Marine top predators as climate and ecosystem sentinels. Front. Ecol. Environ. 17, 565–574. doi: 10.1002/fee.2125
Hazen, E. L., Palacios, D. M., Forney, K. A., Howell, E. A., Becker, E., Hoover, A. L., et al. (2017). WhaleWatch: a dynamic management tool for predicting blue whale density in the California Current. J. Appl. Ecol. 54, 1415–1428. doi: 10.1111/1365-2664.12820
Hazen, E. L., Scales, K. L., Maxwell, S. M., Briscoe, D. K., Welch, H., Bograd, S. J., et al. (2018). A dynamic ocean management tool to reduce bycatch and support sustainable fisheries. Sci. Adv. 4:eaar3001. doi: 10.1126/sciadv.aar3001
Henkel, L. A. (2009). Co-occurrence and aggregation of marine birds and mammals in Monterey Bay, California, USA. Mar. Ecol. Prog. Ser. 387, 295–303. doi: 10.3354/meps08082
Hothorn, T., Bretz, F., and Westfall, P. (2008). Simultaneous inference in general parametric models. Biom. J. 50, 346–363. doi: 10.1002/bimj.200810425
Ingman, K., Hines, E., Mazzini, P. L., Rockwood, R. C., Nur, N., and Jahncke, J. (2021). Modeling changes in baleen whale seasonal abundance, timing of migration, and environmental variables to explain the sudden rise in entanglements in California. PLoS One 16:e0248557. doi: 10.1371/journal.pone.0248557
Isaksson, N., Evans, T. J., Shamoun-Baranes, J., and Åkesson, S. (2016). Land or sea? Foraging area choice during breeding by an omnivorous gull. Mov. Ecol. 4, 1–14. doi: 10.1186/s40462-016-0078-5
Jacox, M. G., Edwards, C. A., Hazen, E. L., and Bograd, S. J. (2018). Coastal upwelling revisited: Ekman, Bakun, and improved upwelling indices for the US West Coast. J. Geophys. Res. Oceans 123, 7332–7350. doi: 10.1029/2018JC014187
Keen, E. M., Scales, K. L., Rone, B. K., Hazen, E. L., Falcone, E. A., and Schorr, G. S. (2019). Night and day: diel differences in ship strike risk for fin whales (Balaenoptera physalus) in the California current system. Front. Mar. Sci. 6:730. doi: 10.3389/fmars.2019.00730
Lascelles, B. G., Taylor, P., Miller, M., Dias, M., Oppel, S., Torres, L., et al. (2016). Applying global criteria to tracking data to define important areas for marine conservation. Divers. Distrib. 22, 422–431. doi: 10.1111/ddi.12411
Maxwell, S. M., and Morgan, L. E. (2013). Foraging of seabirds on pelagic fishes: implications for management of pelagic marine protected areas. Mar. Ecol. Prog. Ser. 481, 289–303. doi: 10.3354/meps10255
McCabe, R. M., Hickey, B. M., Kudela, R. M., Lefebvre, K. A., Adams, N. G., Bill, B. D., et al. (2016). An unprecedented coastwide toxic algal bloom linked to anomalous ocean conditions. Geophys. Res. Lett. 376, 10366–10376.
Navarro, J., Grémillet, D., Ramirez, F. J., Afán, I., Bouten, W., and Forero, M. G. (2017). Shifting individual habitat specialization of a successful predator living in anthropogenic landscapes. Mar. Ecol. Prog. Ser. 578, 243–251. doi: 10.3354/meps12124
O’Brien, R. M. (2007). A caution regarding rules of thumb for variance inflation factors. Qual. Quant. 41, 673–690.
Pickett, E. P., Fraser, W. R., Patterson-Fraser, D. L., Cimino, M. A., Torres, L. G., and Friedlaender, A. S. (2018). Spatial niche partitioning may promote coexistence of Pygoscelis penguins as climate-induced sympatry occurs. Ecol. Evol. 8, 9764–9778. doi: 10.1002/ece3.4445
Pierotti, R. J., and Annett, C. A. (1995). Western Gull: Larus Occidentalis. Chicago, IL: American Ornithologists’ Union. doi: 10.2173/tbna.174.p
R Core Team (2020). R: A Language and Environment for Statistical Computing. Vienna: R Foundation for Statistical Computing.
Ralston, S., Sakuma, K., and Field, J. (2013). Interannual variation in pelagic juvenile rockfish (Sebastes spp.) abundance–going with the flow. Fish. Oceanogr. 22, 288–308.
Read, A. J. (2008). The looming crisis: interactions between marine mammals and fisheries. J. Mammal. 89, 541–548. doi: 10.1644/07-MAMM-S-315R1.1
Redfern, J., McKenna, M., Moore, T., Calambokidis, J., Deangelis, M., Becker, E., et al. (2013). Assessing the risk of ships striking large whales in marine spatial planning. Conserv. Biol. 27, 292–302. doi: 10.1111/cobi.12029
Rockwood, R. C., Adams, J., Silber, G., and Jahncke, J. (2020). Estimating effectiveness of speed reduction measures for decreasing whale-strike mortality in a high-risk region. Endanger. Species Res. 43, 145–166. doi: 10.3354/esr01056
Rockwood, R. C., Adams, J. D., Hastings, S., Morten, J., and Jahncke, J. (2021). Modeling whale deaths from vessel strikes to reduce the risk of fatality to endangered whales. Front. Mar. Sci. 919:649890. doi: 10.3389/fmars.2021.649890
Rockwood, R. C., Calambokidis, J., and Jahncke, J. (2017). High mortality of blue, humpback and fin whales from modeling of vessel collisions on the US West Coast suggests population impacts and insufficient protection. PLoS One 12:e0183052. doi: 10.1371/journal.pone.0183052
Ryan, J., Kudela, R., Birch, J., Blum, M., Bowers, H., Chavez, F., et al. (2017). Causality of an extreme harmful algal bloom in Monterey Bay, California, during the 2014–2016 northeast Pacific warm anomaly. Geophys. Res. Lett. 44, 5571–5579. doi: 10.1002/2017GL072637
Sakuma, K. M., Field, J. C., Mantua, N. J., Ralston, S., Marinovic, B. B., and Carrion, C. N. (2016). Anomalous epipelagic micronekton assemblage patterns in the neritic waters of the California Current in spring 2015 during a period of extreme ocean conditions. CalCOFI Rep. 57, 163–183.
Sakuma, K. M., Ralston, S., and Wespestad, V. G. (2006). Interannual and spatial variation in the distribution of young-of-the-year rockfish (Sebastes spp.): expanding and coordinating a survey sampling frame. Calif. Coop. Ocean. Fish. Invest. Rep. 47:127.
Samhouri, J. F., Stier, A. C., Hennessey, S. M., Novak, M., Halpern, B. S., and Levin, P. S. (2017). Rapid and direct recoveries of predators and prey through synchronized ecosystem management. Nat. Ecol. Evol. 1, 1–6. doi: 10.1038/s41559-016-0068
Santora, J. A., Hazen, E. L., Schroeder, I. D., Bograd, S. J., Sakuma, K. M., and Field, J. C. (2017). Impacts of ocean climate variability on biodiversity of pelagic forage species in an upwelling ecosystem. Mar. Ecol. Prog. Ser. 580, 205–220. doi: 10.3354/meps12278
Santora, J. A., Mantua, N. J., Schroeder, I. D., Field, J. C., Hazen, E. L., Bograd, S. J., et al. (2020). Habitat compression and ecosystem shifts as potential links between marine heatwave and record whale entanglements. Nat. Commun. 11:536.
Santora, J. A., Zeno, R., Dorman, J. G., and Sydeman, W. J. (2018). Submarine canyons represent an essential habitat network for krill hotspots in a Large Marine Ecosystem. Sci. Rep. 8:7579. doi: 10.1038/s41598-018-25742-9
Schwemmer, P., and Garthe, S. (2008). Regular habitat switch as an important feeding strategy of an opportunistic seabird species at the interface between land and sea. Estuar. Coast. Shelf Sci. 77, 12–22. doi: 10.1016/j.ecss.2007.08.017
Shaffer, S. A., Cockerham, S., Warzybok, P., Bradley, R. W., Jahncke, J., Clatterbuck, C. A., et al. (2017). Population-level plasticity in foraging behavior of western gulls (Larus occidentalis). Mov. Ecol. 5, 1–13.
Siddig, A. A., Ellison, A. M., Ochs, A., Villar-Leeman, C., and Lau, M. K. (2016). How do ecologists select and use indicator species to monitor ecological change? Insights from 14 years of publication in Ecological Indicators. Ecol. Indic. 60, 223–230. doi: 10.1016/j.ecolind.2015.06.036
Spaans, A. L. (1971). On the feeding ecology of the Herring Gull Larus argentatus Pont, in the northern part of the Netherlands. Ardea 55, 73–188. doi: 10.5253/arde.v59.p73
Spear, L. B. (1988). Dispersal patterns of western gulls from southeast Farallon Island. Auk 105, 128–141.
Sutton, A. L., Jenner, K. C. S., and Jenner, M.-N. M. (2019). Habitat associations of cetaceans and seabirds in the tropical eastern Indian Ocean. Deep Sea Res. Part II Top. Stud. Oceanogr. 166, 171–186. doi: 10.1016/j.dsr2.2018.06.002
Sydeman, W. J., Penniman, J. F., Penniman, T. M., Pyle, P., and Ainley, D. G. (1991). Breeding performance in the western gull: effects of parental age, timing of breeding and year in relation to food availability. J. Anim. Ecol. 135–149.
Sydeman, W. J., Schoeman, D. S., Thompson, S. A., Hoover, B. A., García-Reyes, M., Daunt, F., et al. (2021). Hemispheric asymmetry in ocean change and the productivity of ecosystem sentinels. Science 372, 980–983. doi: 10.1126/science.abf1772
Tasker, M. L., Jones, P. H., Dixon, T., and Blake, B. F. (1984). Counting seabirds at sea from ships: a review of methods employed and a suggestion for a standardized approach. Auk 101, 567–577.
Thompson, A. R. (2019). State of the California current 2018–19: a novel anchovy regime and a new marine heatwave? CalCOFI Rep. 60, 1–61.
Veit, R. R., and Harrison, N. M. (2017). Positive interactions among foraging seabirds, marine mammals and fishes and implications for their conservation. Front. Ecol. Evol. 5:121. doi: 10.3389/fevo.2017.00121
Venables, W., and Ripley, B. (2002). Modern Applied Statistics With S. (New York, NY: Springer), 271–300. doi: 10.1007/978-0-387-21706-2
Ward, P., and Zahavi, A. (1973). The importance of certain assemblages of birds as “information-centres” for food-finding. Ibis 115, 517–534. doi: 10.1111/j.1474-919X.1973.tb01990.x
Welch, H., Brodie, S., Jacox, M. G., Bograd, S. J., and Hazen, E. L. (2020). Decision-support tools for dynamic management. Conserv. Biol. 34, 589–599.
Welch, H., Hazen, E. L., Briscoe, D. K., Bograd, S. J., Jacox, M. G., Eguchi, T., et al. (2019). Environmental indicators to reduce loggerhead turtle bycatch offshore of Southern California. Ecol. Indic. 98, 657–664. doi: 10.1016/j.ecolind.2018.11.001
Wells, B. K., Schroeder, I. D., Bograd, S. J., Hazen, E. L., Jacox, M. G., Leising, A., et al. (2017). State Of The California Current 2016-17: still anything but “normal” in the North. Calif. Coop. Ocean. Fish. 58, 1–55.
Williams, R., and O’Hara, P. (2010). Modelling ship strike risk to fin, humpback and killer whales in British Columbia, Canada. J. Cetacean Res. Manage. 11, 1–8.
Keywords: ecosystem indicator, predator-prey, foraging ecology, humpback whale, biologging, entanglement, upwelling, marine heatwave
Citation: Cimino MA, Shaffer SA, Welch H, Santora JA, Warzybok P, Jahncke J, Schroeder I, Hazen EL and Bograd SJ (2022) Western Gull Foraging Behavior as an Ecosystem State Indicator in Coastal California. Front. Mar. Sci. 8:790559. doi: 10.3389/fmars.2021.790559
Received: 06 October 2021; Accepted: 22 November 2021;
Published: 28 January 2022.
Edited by:
Jorge M. Pereira, University of Coimbra, PortugalReviewed by:
Ruedi Nager, University of Glasgow, United KingdomVirginia Morera-Pujol, University College Dublin, Ireland
Copyright © 2022 Cimino, Shaffer, Welch, Santora, Warzybok, Jahncke, Schroeder, Hazen and Bograd. This is an open-access article distributed under the terms of the Creative Commons Attribution License (CC BY). The use, distribution or reproduction in other forums is permitted, provided the original author(s) and the copyright owner(s) are credited and that the original publication in this journal is cited, in accordance with accepted academic practice. No use, distribution or reproduction is permitted which does not comply with these terms.
*Correspondence: Megan A. Cimino, megan.cimino@noaa.gov