Estimating the Abundance of Marine Mammal Populations
 Philip S. Hammond1*
  Tessa B. Francis2,3
  Dennis Heinemann4
  Kristy J. Long5
  Jeffrey E. Moore6
  André E. Punt2
  Randall R. Reeves7
  Maritza Sepúlveda8
  Guðjón Már Sigurðsson9
  Margaret C. Siple2
  Gísli Víkingsson9
  Paul R. Wade10
  Rob Williams11
  Alexandre N. Zerbini10,12,13
- 1Sea Mammal Research Unit, Scottish Oceans Institute, University of St Andrews, St Andrews, United Kingdom
- 2School of Aquatic and Fishery Sciences, University of Washington, Seattle, WA, United States
- 3Puget Sound Institute, University of Washington Tacoma, Tacoma, WA, United States
- 4U.S. Marine Mammal Commission, Bethesda, MD, United States
- 5Office of Protected Resources, NOAA’s National Marine Fisheries Service, Silver Spring, MD, United States
- 6Protected Resources Division, NOAA SWFSC, La Jolla, CA, United States
- 7Okapi Wildlife Associates, Hudson, QC, Canada
- 8Facultad de Ciencias, Universidad de Valparaíso, Valparaíso, Chile
- 9Pelagic Division, Marine and Freshwater Research Institute, Hafnarfjörður, Iceland
- 10Marine Mammal Laboratory, NOAA AFSC, Seattle, WA, United States
- 11Oceans Initiative, Seattle, WA, United States
- 12Cascadia Research Collective, Olympia, WA, United States
- 13Marine Ecology and Telemetry Research, Seabeck, WA, United States
Motivated by the need to estimate the abundance of marine mammal populations to inform conservation assessments, especially relating to fishery bycatch, this paper provides background on abundance estimation and reviews the various methods available for pinnipeds, cetaceans and sirenians. We first give an “entry-level” introduction to abundance estimation, including fundamental concepts and the importance of recognizing sources of bias and obtaining a measure of precision. Each of the primary methods available to estimate abundance of marine mammals is then described, including data collection and analysis, common challenges in implementation, and the assumptions made, violation of which can lead to bias. The main method for estimating pinniped abundance is extrapolation of counts of animals (pups or all-ages) on land or ice to the whole population. Cetacean and sirenian abundance is primarily estimated from transect surveys conducted from ships, small boats or aircraft. If individuals of a species can be recognized from natural markings, mark-recapture analysis of photo-identification data can be used to estimate the number of animals using the study area. Throughout, we cite example studies that illustrate the methods described. To estimate the abundance of a marine mammal population, key issues include: defining the population to be estimated, considering candidate methods based on strengths and weaknesses in relation to a range of logistical and practical issues, being aware of the resources required to collect and analyze the data, and understanding the assumptions made. We conclude with a discussion of some practical issues, given the various challenges that arise during implementation.
Introduction
Ecologists use information on abundance to improve understanding of what determines how species are distributed (Begon et al., 1996). In conservation biology, practitioners use estimates of abundance to assess the conservation status of species or populations (Cardinale et al., 2019). Assessments for the IUCN Red List of Threatened Species1 depend on abundance information in three of the five criteria used to rank risk levels (A: reduction in population; C: small and declining population size; and D: very small or range-restricted population). Population size and trend estimation are also used to inform options and mechanisms for managing human activities to reduce impacts.
One motivation for this paper is the widespread threat to marine mammal populations due to incidental catch (bycatch) in fishing gear (Read et al., 2006; Avila et al., 2018), and the need for information on abundance to put bycatch mortality into a population context. In Europe, a legal driver for this is the EU Marine Strategy Framework Directive, under which biodiversity indicator D1C1 requires that, to ensure long-term viability, incidental bycatch mortality be kept below levels that threaten a species (European Union, 2017). The implementing regulations2 of the United States Marine Mammal Protection Act (MMPA) issued in 2016, require that imported fish and fish products be evaluated with respect to United States standards for managing marine mammal bycatch (as discussed in Williams et al., 2016a). These implementing regulations (“Seafood Import Provisions”) require countries with fisheries identified as “Export Fisheries” to be comparable in effectiveness to the regulatory program for United States commercial fisheries; this typically requires conducting bycatch assessments of marine mammal populations (Wade et al., In review, Frontiers in Marine Science3).
Two fundamental pieces of information needed to conduct a bycatch assessment are an estimate of bycatch mortality and an estimate of the abundance of the impacted population. Best-practice methods for estimating bycatch mortality are described in Moore et al. (In review, Frontiers in Marine Science4). This paper describes methods for estimating the abundance of populations of marine mammals.
An additional, more general, motivation for the present work is that expertise in estimating marine mammal abundance is patchy around the world. Although methods to estimate abundance have been developed and applied to many marine mammal species, there are still numerous populations globally where necessary data and estimates of abundance are lacking. We hope that the information in this paper will be of use to managers and practitioners in places around the world where knowledge of the methods available to estimate marine mammal abundance may be limited.
Efforts to estimate the abundance of marine mammal populations began in earnest in the 1960s. One of the first such efforts for cetaceans involved systematic counts from coastal CA, United States, of migrating gray whales (Eschrichtius robustus) (see Laake et al., 2012). For pinnipeds, McLaren (1961) used data from at-sea surveys to estimate the abundance of ringed seals (Pusa hispida) and counts of gray seal (Halichoerus grypus) pups were initiated in the early 1960s to estimate the population around Britain (Russell et al., 2019). The use of data from seals that were physically captured, tagged, and recaptured to estimate abundance using mark-recapture methods began in the 1970s (e.g., Siniff et al., 1977).
Methods for estimating abundance from whale sightings were first considered by Doi (1974). In the 1970s, two notable cetacean survey programs to estimate abundance began. First, the United States government initiated surveys to estimate the abundance of pantropical spotted (Stenella attenuata) and spinner dolphins (S. longirostris) in the eastern tropical Pacific (Smith, 1981). Second, surveys under the International Whaling Commission’s International Decade of Cetacean Research were initiated to estimate the abundance of Antarctic minke whales (Balaenoptera bonaerensis) (see Branch and Butterworth, 2001).
The development of photo-identification of individual whales and dolphins in the 1970s enabled the use of mark-recapture methods to estimate the abundance of cetaceans from their natural markings, including humpback (Megaptera novaeangliae), southern right (Eubalaena australis), killer (Orcinus orca), and sperm (Physeter macrocephalus) whales, and bottlenose dolphins (Bigg, 1982; Whitehead, 1982; Whitehead and Gordon, 1986; Whitehead et al., 1986; Scott et al., 1990). Whales had previously been marked using Discovery tags (Brown, 1978), but these data were neither intended nor used for estimating abundance.
The 1980s saw the publication of a seminal textbook on the estimation of animal abundance by Seber (1982), followed by the continued development of mark-recapture and transect methods tailored for estimation of marine mammal abundance (see reviews in Hammond, 1986; Hiby and Hammond, 1989; Hammond et al., 1990, and aerial survey methods for dugongs [Dugong dugon] in Marsh and Sinclair, 1989).
Methodological development has expanded rapidly over the last three decades and there is now an extensive literature describing studies to estimate abundance for many marine mammal species. There are also general texts that describe methods that are commonly used, or that provide practical guidance on implementation (e.g., Buckland et al., 2001, 2015; Amstrup et al., 2005; Dawson et al., 2008; Hammond, 2010; Williams et al., 2017; Buckland and York, 2018).
The aim of this paper is to provide easy access to the way in which marine mammal abundance can be estimated, highlighting the relevant literature (established and recent) so that readers can pursue further details about the various methods available for pinnipeds, cetaceans and sirenians. We start with a general introduction to abundance estimation, including an “entry-level” description of the fundamental concepts and the importance of recognizing sources of bias (systematic inaccuracy in estimates) and obtaining a measure of precision (uncertainty in estimates). Each of the primary methods available to estimate abundance of marine mammals is then described. For each method, information is summarized on data collection and analysis, including common challenges in implementation. The assumptions of the method (violation of which can lead to bias) are outlined and references to example studies that illustrate the method are given. Each method has strengths and weaknesses in relation to a range of logistical and practical issues, including relative cost. The final section discusses which methods are likely to be appropriate for pinnipeds, cetaceans and sirenians, given the various challenges that arise during implementation.
This paper does not address the estimation of trends in abundance. The challenges of detecting trends, driven by the limited power of typical abundance data, especially for cetaceans, are well-documented (e.g., Taylor et al., 2007). Some studies describing how to provide the best information on abundance trends from the available data include Jewell et al. (2012); Moore and Barlow (2014), Campbell et al. (2015); Williams et al. (2016b), Forney et al. (2021); Nachtsheim et al. (2021), and Boyd and Punt (2021).
Estimating Abundance – General Principles
Abundance and Population Size
The terms abundance and population size are sometimes used interchangeably. The common usage of the English word “abundance” indicates a large quantity of something but, in the context of estimating species abundance, it simply means the number of animals, whether large or small. Abundance may refer to the number of animals in any defined area or it may refer to a “population,” which begs the question – what is a population?
As a precursor to his discussion of comparative demography, Cole (1957) defined a population as: “a biological unit at the level of ecological integration where it is meaningful to speak of a birth rate, a death rate, a sex ratio, and an age structure in describing the properties of the unit.” This resonates with the commonly considered definition that a population comprises individuals of a species that live and interbreed in the same space.
However, such a definition is challenging to implement for many species, perhaps particularly so for marine mammals. Krebs (1972, p139) proposed a more pragmatic definition: “a group of organisms of the same species occupying a particular space at a particular time … [its] boundaries … both in space and time are vague and in practice are usually fixed by the investigator arbitrarily.” Indeed, studies of abundance using at-sea transect surveys (see below) need to be defined in space and time. Estimates of abundance from such surveys therefore relate to the “population” in an area, not to a wider biological population. In studies to estimate abundance using mark-recapture methods (see below), the population estimated comprises those individuals that use the study area, which may be different from the number of animals present in the area during a transect survey. Calambokidis and Barlow (2004) discuss this difference with respect to humpback and blue (Balaenoptera musculus) whales.
A population may also be defined for the purposes of assessment and/or management; such definitions may be general or specific. For example, the IUCN defines a population as the “set of individuals from the same wild species that share the same habitat” (IUCN, 2021). The United States Marine Mammal Protection Act defines a “population stock” as a group of animals “of the same species or smaller [taxon] in a common spatial arrangement that interbreed when mature” (MMPA Section 3, 16 United States Code 1362). The International Whaling Commission (IWC) manages whaling on the basis of defined management stocks, for which abundance estimates are required to be incorporated within a management procedure [e.g., bowhead whales (Balaena mysticetus) in the Bering-Chukchi-Beaufort Seas5 ]. The International Council for the Exploration of the Sea has defined “Assessment Units” for some species of small cetacean in the European Atlantic [e.g., harbor porpoise (Phocoena phocoena); ICES, 2014].
Whatever the context, for any study reporting abundance, it is critical to define clearly the “population” to which abundance refers.
Counting and Estimation of Abundance From Samples
The simplest measure of the number of animals in a population is a count. On rare occasions (e.g., “southern resident” killer whales, which are all uniquely identifiable and do not disperse from their natal units), all individuals in the population can be counted (Olesiuk et al., 1990). However, a count is highly unlikely to represent true population size for most marine mammals, especially cetaceans, because of problems of access (individuals spend all or most of their time at sea and mostly underwater), behavior (individuals are highly mobile), and scale (most species occur over large areas). Nevertheless, a count is a minimum measure of abundance and this may be of value in the absence of an estimate of abundance. However, use of a count, in the large majority of cases, would substantially underestimate the capacity of the population to sustain human impacts, such as bycatch mortality, and would therefore lead to much lower bycatch limits than are necessary to achieve management objectives.
To obtain a realistic measure of the number of animals in a marine mammal population, abundance must typically be estimated. Estimation involves collecting a sample of data that can be extrapolated to the entire population using one or more statistical models. The principles of extrapolating sample data to estimate abundance using models can be illustrated through a simple example.
Consider the need to obtain a measure of the number of animals in a defined study area of size A = 450 km2. It is not logistically feasible to count all the animals in the area. Instead, a smaller subarea of size a = 50 km2 is defined, within which it is believed possible to count all the animals, and in which the density of animals is assumed to be representative of the larger area A. The count in the subarea (n = 35 animals) forms the sample. Extrapolating to obtain an estimate of abundance is achieved by (i) dividing the count n by the size of the subarea a to provide an estimate of animal density, n/a = 35/50 = 0.7 animals per km2, and (ii) multiplying estimated animal density by the size of the whole study area, A = 450 km2 to provide the estimate of abundance, 315 animals.
The statistical model in this case is simply: . The “hat” over the N indicates that it is an estimated quantity.
The sizes of the areas, A and a, are known quantities because they can be measured exactly, but the number of animals in the subarea is unknown and the count, n, is thus a random variable with associated statistical error. Estimating this error allows us to provide a measure of precision of the estimate of abundance (see below).
Bias and Precision in Estimates of Abundance
All models, whether simple or complex, make assumptions about the accuracy and representativeness of the sample data. The resulting estimates of abundance can be biased if these assumptions are not met. A biased estimate is not an accurate measure of true abundance.
In the example in the previous section, the fundamental assumption made is that it is valid to extrapolate the estimate of animal density in the subarea, n/a, to the whole study area. This assumption has two elements: first, that the sample count, n, accurately represents the number of animals in the subarea a; and second, that animal density in the subarea is representative of density in the study area as a whole.
The first element, accuracy, can be thought of as the capacity of the data collection protocol to provide accurate data. If it over- or under-counts the animals, animal density will similarly be over- or underestimated and extrapolation to the whole study area will result in an over- or underestimate of abundance. For example, the count will be incomplete and abundance will be underestimated if some animals are unavailable for detection at the time of the count because they are hidden from view, or if they react to the presence of the observer and move away before they are counted. These two situations can occur in surveys for marine mammals and the solution is to collect additional data so that a correction factor can be estimated to avoid under- or over-estimation of abundance.
The second element, representativeness, is determined by the sampling design. In this example, a single subarea has been selected for estimating animal density. This could be appropriate if animals were distributed randomly in space, but this is rarely the case and cannot be assumed. Counting within the subarea would lead to overestimating animal density and, therefore, abundance, if, e.g., there were a gradient in density across the study area and the small area fell within an area of high density. The solution is to modify the sampling design, for example by splitting the single subarea into several smaller subareas and distributing them randomly or systematically over the entire study area. This should ensure that estimated animal density is representative of overall density.
If assumptions about the data and methodology are met, the resulting estimate of abundance should be an unbiased measure of the true abundance. The concept here is that if multiple sets of sample data are collected, the resulting repeat estimates of abundance should be centered about the true abundance. In practice, because true abundance is unknown, the only way to determine that an estimate is unbiased is to ensure that the assumptions about the data and the estimation method are met.
Obtaining an unbiased estimate is ideally the aim of all studies of abundance. It is therefore important (a) to use a method of data collection that maximizes the accuracy of the data, and (b) to implement a sampling design that ensures the sample data are representative.
The point was made in the previous section that estimating statistical error enables an estimate of abundance or population size to be presented with a measure of precision. The measure of precision expresses the level of uncertainty we have in the estimate. Statistically, it indicates how much the estimate would vary if it were calculated from repeated sets of sample data. Measures of precision are primarily driven by sample size; they include the Standard Error (SE), Coefficient of Variation (CV, the SE divided by the estimate, expressed as a proportion or a percentage), and a 95% Confidence Interval (CI). An estimate with poor precision indicates that its value was driven substantially by chance, whereas an estimate with higher precision indicates that its value would be similar regardless of the sample of data collected. We should thus be less certain about an imprecise estimate, and be more cautious about its use, than a precise estimate. As a general rule, an estimate of abundance should always be accompanied by a measure of precision.
It is important to be clear about the difference between bias and precision in this context. An estimate may be based on few data and thus be imprecise but nevertheless be unbiased if assumptions about the data and estimation methods are met. In contrast, a precise estimate based on a large sample may be biased because of violation of sampling or analytical method assumptions. For informing conservation and management, the worst-case scenario is arguably a precise but biased estimate because it conveys a false sense of confidence in an inaccurate measure of abundance. For example, consider a population of 10,000 animals, for which there is an estimate of abundance of 15,000 with a CV of 0.1. The estimate is inflated because the sampled subarea contained a higher density of animals than the entire study area. The CV is small because a lot of data were collected in the sampled subarea. In this case, the 95% confidence interval for the estimate (12,000–18,000) would not include the true value. A mortality limit reference point (see Moore et al., In review, Frontiers in Marine Science) (see text footnote 4) calculated on the basis of this estimate would be considerably inflated, potentially leading to bycatch levels that threaten the population. This reinforces the importance of understanding and meeting assumptions about the data and the estimation methods.
Accompanying Information to Support an Abundance Estimate
Abundance estimates provided to management authorities should be accompanied by enough information to allow assessment of their validity. As well as the estimate (for a particular location and time) and measure(s) of its precision, it is also good practice to provide:
• A description of the survey/sampling design;
• A description of data collection methods, including survey platform, observer training and experience;
• Summary data, including spatial maps, searching effort, animals counted and/or individuals identified (depending on the method); and
• A description of analytical methods and additional information used to generate the estimate and the measure(s) of its precision.
An example of this is the specification of information that should accompany any abundance estimate intended for use in IWC management applications (e.g., the Revised Management Procedure or an Aboriginal Whaling Management Procedure; IWC, 2012, 2020).
Methods for Estimating Abundance
Several methods are available to estimate the abundance of marine mammal populations; each can be considered within the conceptual framework of extrapolating from counts, corrected as appropriate, to an estimate of total abundance or population size using statistical models. Which method is most appropriate and how it is implemented depends on the species and other factors such as logistics, resources and, in some cases, the purpose of estimating abundance. This section introduces the various methods available and identifies their data requirements, key features and assumptions.
Correcting and Extrapolating Counts of a Defined Portion of a Population
The primary basis for estimating the abundance of pinniped populations (seals, sea lions, fur seals, walruses) is information on counts of animals on land or ice. Cetaceans (whales, dolphins and porpoises) and sirenians (dugongs and manatees) are never similarly accessible for such counts. Counts may be of pups (or walrus calves) born during a pupping season or of non-pups hauled out at that time or at other times of the year.
Pinnipeds that haul out on land typically occur in breeding colonies (where pups can be counted) or in other types of aggregation outside the pupping season (e.g., for molting), thus facilitating the counting of animals. These counts can be corrected, if necessary, and then extrapolated to provide an estimate of population size. Ice-associated pinnipeds are typically distributed over wide areas of ice requiring information on counts to be obtained from aerial surveys (see “Transect sampling from ship or aerial surveys”).
More generally, estimates using count data may be combined with those obtained using other methods such as surveys (see “Transect sampling from ship or aerial surveys” below) and mark-recapture (see “Mark-recapture” below), for example for Hawaiian monk seals (Neomonachus schauinslandi) (Baker et al., 2016).
Pup Counts
In species of pinniped that form breeding colonies on land, pups may be counted during the pupping season from a boat (e.g., Boyd, 1993), from land (e.g., Guinet et al., 1994; Wege et al., 2016), or often most efficiently via aerial surveys (e.g., Russell et al., 2019). Collating data from diverse counting methods may be required (e.g., Galatius et al., 2020). Pup counts or estimates of total pup production are frequently used as indices of relative abundance, especially when considering population trends over time (e.g., Guinet et al., 1994; Shaughnessy et al., 2000; Wege et al., 2016). Using pup counts to estimate population size requires extrapolation.
Depending on the method of counting, detecting all pups present may not be possible, e.g., because of obstructed views. The probability of detecting a pup can be estimated by focused comparisons of typical counts with known unbiased counts, or through a mark-recapture experiment using temporarily marked pups (e.g., Shaughnessy et al., 2000; Wege et al., 2016) to correct for negative bias in count data. Comparison of ground counts and aerial survey counts can also indicate bias in counts (e.g., Westlake et al., 1997; Lowry, 1999). The use of unmanned aerial vehicles (UAV) can markedly improve the probability of detecting a pup (e.g., Adame et al., 2017; McIntosh et al., 2018; see also “Aerial survey or ship survey?” below). An extreme situation is where ringed seal (Pusa hispida) pups are hidden in subnivean lairs and invisible and other methods may be more appropriate (e.g., photo-identification using camera traps; Koivuniemi et al., 2016).
Pupping seasons can extend over several weeks so conducting multiple counts over the entire pupping season may be necessary to obtain an unbiased estimate of total pup production (e.g., Russell et al., 2019). It may not be possible to conduct counts at all colonies in a population, in which case it is necessary to apply models to pup counts from a subset of colonies to obtain unbiased estimates of the total number of pups born in a season (e.g., Wege et al., 2016).
In species that give birth to pups over large areas of ice, aerial surveys are necessary to sample these areas. For example, pup production of harp seals (Pagophilus groenlandicus) in the northwest Atlantic is estimated using visual helicopter strip transect surveys of pupping areas previously identified using aerial reconnaissance, as well as photographic fixed-wing aerial surveys of these same areas (Stenson et al., 2020).
The simplest way to extrapolate from pups to total population is to construct a life table and compute the ratio of total population numbers to the number of pups, i.e., a “pup multiplier” (e.g., Pitcher et al., 2007; Hauksson, 2007; Russell et al., 2019). Values of demographic parameters (such as age-specific survival and fecundity rates) are required to construct the life table. To avoid bias, demographic parameters should be representative of the population to which the pup counts are being extrapolated and additional resources may be needed to estimate survival or fecundity. Alternatively, it may be necessary to use values from studies of the species, or a similar species, elsewhere (Trites and Larkin, 1996; Lowry et al., 2014; Punt et al., 2020). The Marine Mammal Bycatch Impacts Exploration tool6 provides a range of calf/pup survival rates, adult survival rates and age at maturity for different groups of pinnipeds (Siple, 2021). Prudence is needed when using demographic parameters that are not population specific or if population size is changing and density-dependent effects have led to changes in demographic parameters over time (Frie et al., 2012). In addition, it is not easy to estimate the precision of estimates of total population size using this approach.
A more complex way to extrapolate from pups to total population size, that can overcome some of the problems associated with the simple life table approach, is to use a population model that is fitted to the count data (e.g., Thomas et al., 2019). Advantages of this approach include incorporating more detailed information on demographic parameters, modeling density-dependent effects, using datasets additional to pup counts (such as counts of adults and/or data on animals killed in hunts or fisheries) and incorporating uncertainty (e.g., Butterworth et al., 1995). The assumptions made using such population models to ensure unbiased estimation of population size depend on the models.
All-Age Haul-out Counts
Counts of animals older than pups made during the pupping season or at other times of the year, including the annual molt, can be used as a basis for estimating abundance. In species of pinniped that haul out in aggregations on land, the same counting methods can be used as described above for pups, and the same issues apply regarding failure to detect or count all animals at a colony or haul-out site, or not being able to make counts at all colonies/haul-out sites. Counts may thus need to be corrected as described above if assumed to be inaccurate or unrepresentative.
In ice-associated pinnipeds, aerial surveys are needed to obtain information on counts. For example, Bengtson et al. (2005) used fixed-wing aerial line transect surveys to estimate the abundance of ringed and bearded seal and Ver Hoef et al. (2014) used data from helicopter line transect surveys in the Bering Sea to estimate the abundance of ribbon (Histriophoca fasciata), bearded (Erignathus barbatus) and spotted (Phoca largha) seals. Speckman et al. (2011) used thermal images and digital photography data collected from fixed-wing aerial strip transect surveys to estimate the abundance of walrus (Odobenus rosmarus) in the Bering Sea. See also “Transect sampling from ships or aerial surveys” regarding strip and line transect surveys, and “Aerial survey or ship survey?” regarding the use of camera systems.
A novel method of obtaining counts that has potential for some species of pinniped is to use earth observation imagery (Moxley et al., 2017).
In some circumstances, it may be reasonable to assume that all animals are ashore when counts are made, for example mature animals on breeding colonies, and, in such cases, the count may represent this component of the population (e.g., for South American sea lions Otaria flavescens, Sepúlveda et al., 2011). However, typically, the number of animals hauled out varies substantially over time so, preferably, the mean of a series of counts conducted over an appropriate period should be used in place of a single count (e.g., Sepúlveda et al., 2012; Brasseur et al., 2018). This also allows variability in the count to be incorporated into the overall measure of precision of an extrapolated count (see below).
Because, typically, not all animals are ashore or on ice when counts are made, a mean count (or corrected count, if necessary) needs to be extrapolated to the entire population, and this requires estimating the proportion of the population that is hauled out during the period to which the mean count applies. This proportion needs to be estimated from data on haul-out behavior, obtained from observations of animals at haul-out sites or, preferably, from marked individuals. Animals may be marked using flipper tags or small implantable tags, by photo-identification, or, ideally, by deploying transmitters on the animals to obtain telemetry data (e.g., Thompson et al., 1997; Bengtson et al., 2005; Sharples et al., 2009; Udevitz et al., 2009; Lonergan et al., 2011; Ver Hoef et al., 2014). Either way, additional resources are required to generate data from which the proportion of the population hauled out can be estimated. To obtain an unbiased estimate of population size by simple extrapolation of a mean haul-out count using an estimate of the proportion of the population hauled out requires that the counts and the haul-out proportion data are, similarly, representative of all components of the population in terms of age, sex and life history. If this is not the case, analysis will need to account for the variation (e.g., Lonergan et al., 2011) or at least acknowledge potential bias in estimates of total population size.
Transect Sampling From Ship or Aerial Surveys
Most of the information on the abundance of cetaceans comes from surveys of defined areas conducted at sea on ships (or smaller boats), or from the air using sampling along define transect lines. Pinnipeds can also be detected during at-sea surveys, although it is unusual for these data to be used to estimate abundance (but see Brediñana-Romano et al., 2014; Williams et al., 2017). However, an aerial survey is the only option for obtaining information on abundance for some ice-associated pinnipeds. The abundance of sirenians is typically estimated from aerial surveys.
Unlike extrapolating counts or mark-recapture (see below), transect methods sample animal density within defined areas, not individual animals. Typically, a team of observers searches on either side of a set of transect lines placed across a survey area and counts the number of animals detected. Most cetaceans occur clustered in groups, so observers typically count groups of animals and determine (or estimate – see below) the size of each group. Use of camera systems instead of observers to capture data on aerial survey is discussed below.
Surveys may be conducted in so-called “passing mode” or “closing mode.” In passing mode, the ship, small boat or aircraft does not divert from the transect line to investigate detected groups of animals. In closing mode, when a group of animals is detected, searching effort is suspended and the group is approached by the ship or small boat or circled overhead by the aircraft. The additional time spent observing the animals, especially in close proximity from ships or small boats, may allow more accurate species identification and group size estimation, including taking photographs for this purpose. Surveys conducted in passing mode maximize searching time, and are necessary for double observer team surveys (see below), but they may be subject to greater error in species identification and group size estimation than surveys conducted in closing mode.
Abundance is estimated by first estimating the density of animals per unit area and then extrapolating density to the whole study area. Abundance is therefore defined as the estimated number of animals in a specified area during the period of time that the survey took place. It is thus conceptually similar to the example described in “Counting and estimation of abundance from samples,” but the area sampled is the area around the set of transect lines placed across the survey area (see Figure 1), not a subarea.
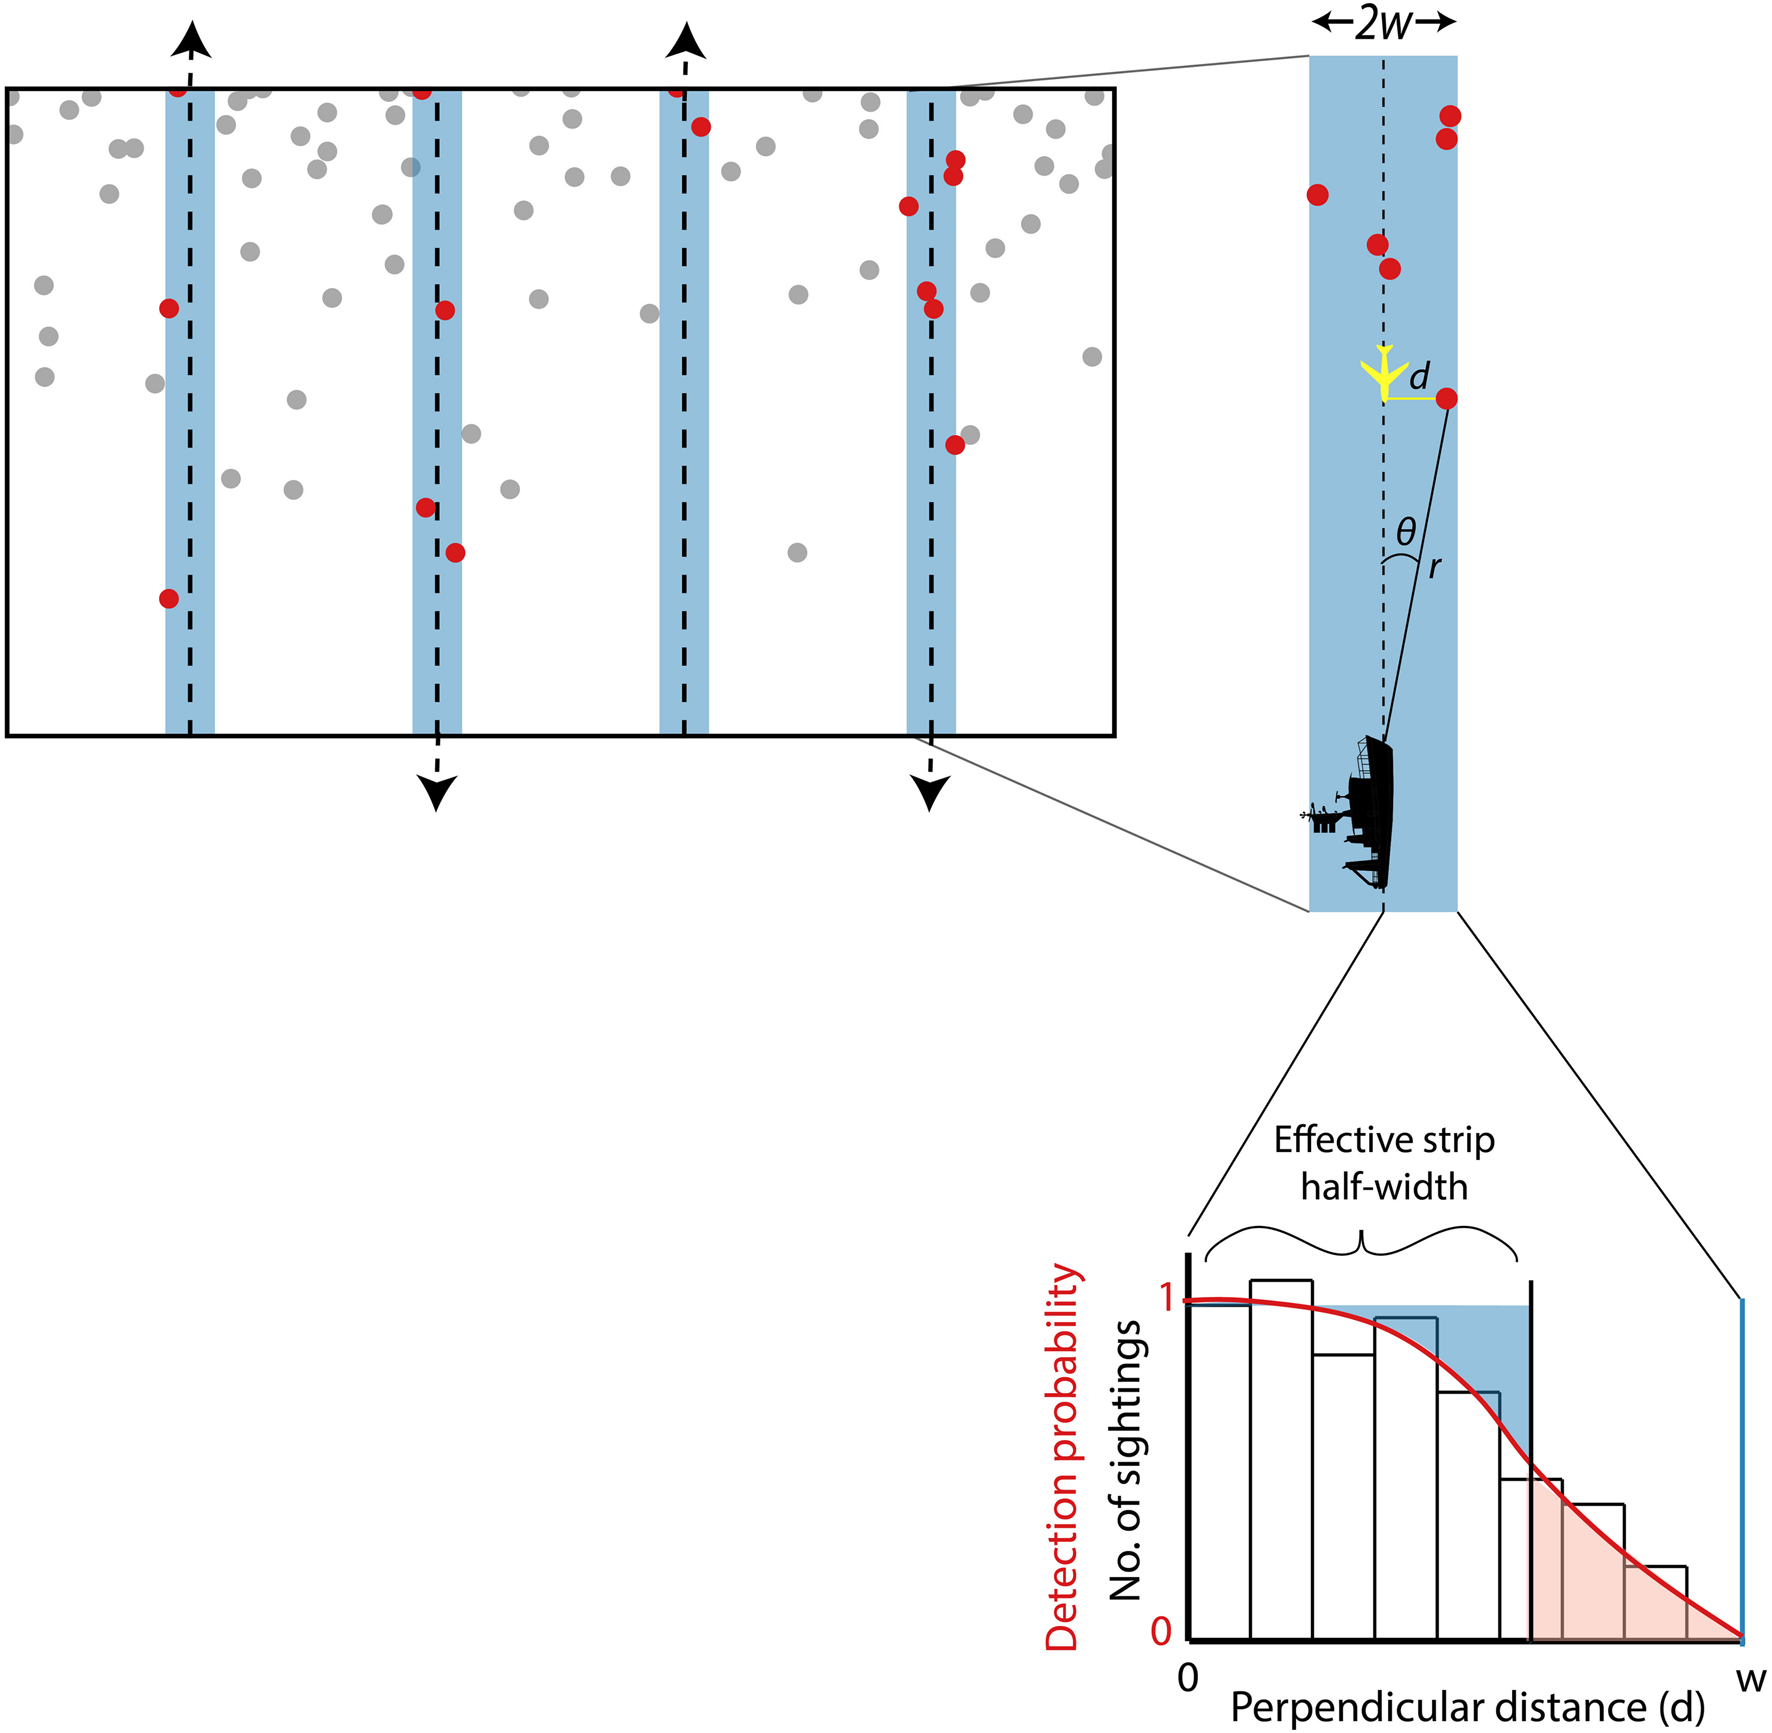
Figure 1. Schematic representation of the elements of a line transect survey. Illustration of a sampling design (top left) in which parallel lines are placed equidistant from each other (other designs such as zig-zag lines could also be appropriate). The starting point for the first line is random so that the design satisfies the requirements for an equal coverage probability design (see text). The shaded areas around the lines represent the strip searched by observers as they progress in the direction of travel indicated by the arrows at the end of each line. The dots represent animals (or groups of animals); red dots are those within the searched strip. In a strip transect survey, all the animals represented by red dots are assumed to be detected. In a line transect survey, animals further from the transect line are less likely to be detected so not all of the animals represented by red dots may actually be sighted. Note that animals are not distributed randomly across the survey area – density is higher toward the top than the bottom. This design follows good practice in placing lines perpendicular to the density gradient (if known) to minimize inter-line variability in the number of animals detected and thus maximize precision in abundance estimation. To the right is an illustration of data collection on one of the transect lines. The width of the strip searched on each side of the line is defined as w. When an animal (or group of animals) is detected from the ship, observers measure the distance r and the angle θ, from which perpendicular distance from the transect line, d, can be calculated as r x sinθ. Perpendicular distance is measured directly from the aircraft when it comes abeam of the animal. On completion of a survey, the perpendicular distances measured to all the detected animals or groups can be plotted as a frequency histogram. Note that the frequency of animals detected declines as perpendicular distance increases away from the transect line (zero perpendicular distance). The red curved line represents the detection function fitted to the perpendicular distance data, with detection probability = 1 at perpendicular distance = 0, as assumed in line transect analysis (see text). The effective strip half-width, esw (average detection probability x w, see text), is the perpendicular distance at which the number of animals detected at greater distances (represented in pink) equals the number of animals present but not detected at lesser distances (represented in blue).
Proper placement of the transect lines is critical for unbiased estimation of abundance. To guarantee that estimated animal density is representative of the entire study area, the set of transect lines must be placed according to a design that ensures that every point in the study area has the same probability of being sampled. This is known as an equal coverage probability design. Clearly any one set of transect lines can only sample a small proportion of the available area. However, incorporating a random starting point into an appropriate design ensures that many repeated, randomly chosen sets of lines would sample everywhere in the study area. Estimates of abundance from surveys that achieve equal coverage probability are known as design-based estimates.
Stratification of survey areas into a number of blocks is commonly done, often for logistical reasons. Survey design should then ensure equal coverage probability within each block. If density differs among blocks, for example because they cover different habitats, stratification may improve the precision of abundance estimates. Transect line placement can be challenging in coastal, inland, and riverine areas; Dawson et al. (2008) provide guidance for such areas. In some circumstances, data from surveys that do not achieve equal coverage probability can be used to estimate abundance in a model-based approach (see “Model-based estimation of abundance”).
Transect surveys for cetaceans typically collect data visually. However, for deep-diving species, abundance estimated from visual data is likely to be negatively biased because of the long dive times of these species (see availability bias below). For these species, using passive acoustic data (i.e., recordings of sounds made regularly, such as for echolocation, by the animals) to estimate abundance may be possible. For example, sperm whale abundance has been estimated from a combined acoustic and visual survey (Barlow and Taylor, 2005) and solely from acoustic data collected from hydrophones towed behind a survey ship (Lewis et al., 2007). Taylor et al. (2017) combined a line transect survey with acoustic data from static recorders to estimate the abundance of vaquitas (Phocoena sinus). Data from static acoustic recorders have also been used to estimate the abundance of beaked whales (Marques et al., 2009) using point-transect distance sampling, a variant of line transect sampling in which the area around a series of points is searched, instead of the area on either side of a series of transect lines (Buckland et al., 2001). These methods are under development; recent work also includes the use of drifting passive acoustic recorders to estimate the density of deep-diving cetacean species (e.g., Keating et al., 2018; Barlow et al., 2021a,b,c).
Strip Transect Surveys
In strip transect sampling, it is assumed that all animals are detected within a strip of defined width on each side of the transect line (Figure 1). The sum of the lengths of all the transect lines multiplied by the width of the strip on both sides of the line defines the sample area searched. As noted above, this is equivalent to the subarea in the example in “Counting and estimation of abundance from samples.” The number of animals detected (counted) divided by the size of the searched area gives an estimate of animal density, which is multiplied by the size of the survey area to estimate abundance. If not all animals are detected within the strip, abundance will be underestimated (see “Line transect sampling” below).
A form of strip transect is typically used to survey sirenians. In surveys of dugongs in Australia, the defined strip is narrow (200 m) and no clear evidence has been found of a decline in detection with perpendicular distance within the strip (Pollock et al., 2006). However, corrections to these counts are made for availability bias and perception bias (Marsh and Sinclair, 1989), which are described below. Other example studies of estimating sirenian abundance from such surveys include Preen (2004); Findlay et al. (2011), Martin et al. (2015); Hagihara et al. (2016) and Hostetler et al. (2018). Note also that abundance of manatees (Trichechus manatus) in Panama has been estimated from side-scan sonar deployed from a small boat in a river system (Guzman and Condit, 2017). Strip transect surveys have also been used to obtain data to estimate the abundance of ice-associated pinnipeds (e.g., Speckman et al., 2011; Stenson et al., 2020).
Line Transect Sampling
The probability of detecting an animal, or a group of animals, declines as the distance away from the transect line increases so, unless the strip is narrow, not all animals in the strip will be seen. Line transect sampling is a modification of strip transect sampling, in which the assumption that all animals are detected within a defined strip is relaxed; it is only required that all animals are seen on the transect line (see below for discussion of this). Instead, data are collected on the perpendicular distance from the transect line to each detected animal or group (Figure 1). Line transect sampling is thus often referred to as distance sampling (Buckland et al., 2001, 2015; Thomas et al., 2010).
A detection function is fitted to the perpendicular distance data (Thomas et al., 2010; Figure 1), which provides an estimate of the average probability of detection (of animals or groups) within the strip. Including covariates related to sighting conditions in the detection function may improve its fit. Dividing the number counted by the average probability of detection corrects the count for the animals or groups missed within the strip. In conventional analysis, however, the correction is actually made to the width of the strip, not to the number counted.
Multiplying the strip width by the average probability of detection gives a quantity known as the effective strip width (esw, Figure 1). The term “effective” signifies that it is the width of a strip within which all animals would have been counted. Note that esw conventionally refers to one side of the transect line only so is actually the effective strip half-width. The sum of the lengths of all the transect lines multiplied by the esw on both sides of the line defines the effective search area, within which all animals would have been counted.
Animal density is estimated by dividing the number of animals seen, or the number of groups seen multiplied by mean group size, by the effective search area. As for strip transect sampling, abundance is estimated by multiplying the estimate of animal density by the size of the survey area.
There is an extensive literature on using line transect sampling to estimate the abundance of many species of cetaceans in different habitats. Table 1 gives references to some example studies that describe how the method can be implemented for a variety of species. In addition, line transect sampling is used to estimate the abundance of ice-associated seals (e.g., Bengtson et al., 2005; Ver Hoef et al., 2014).
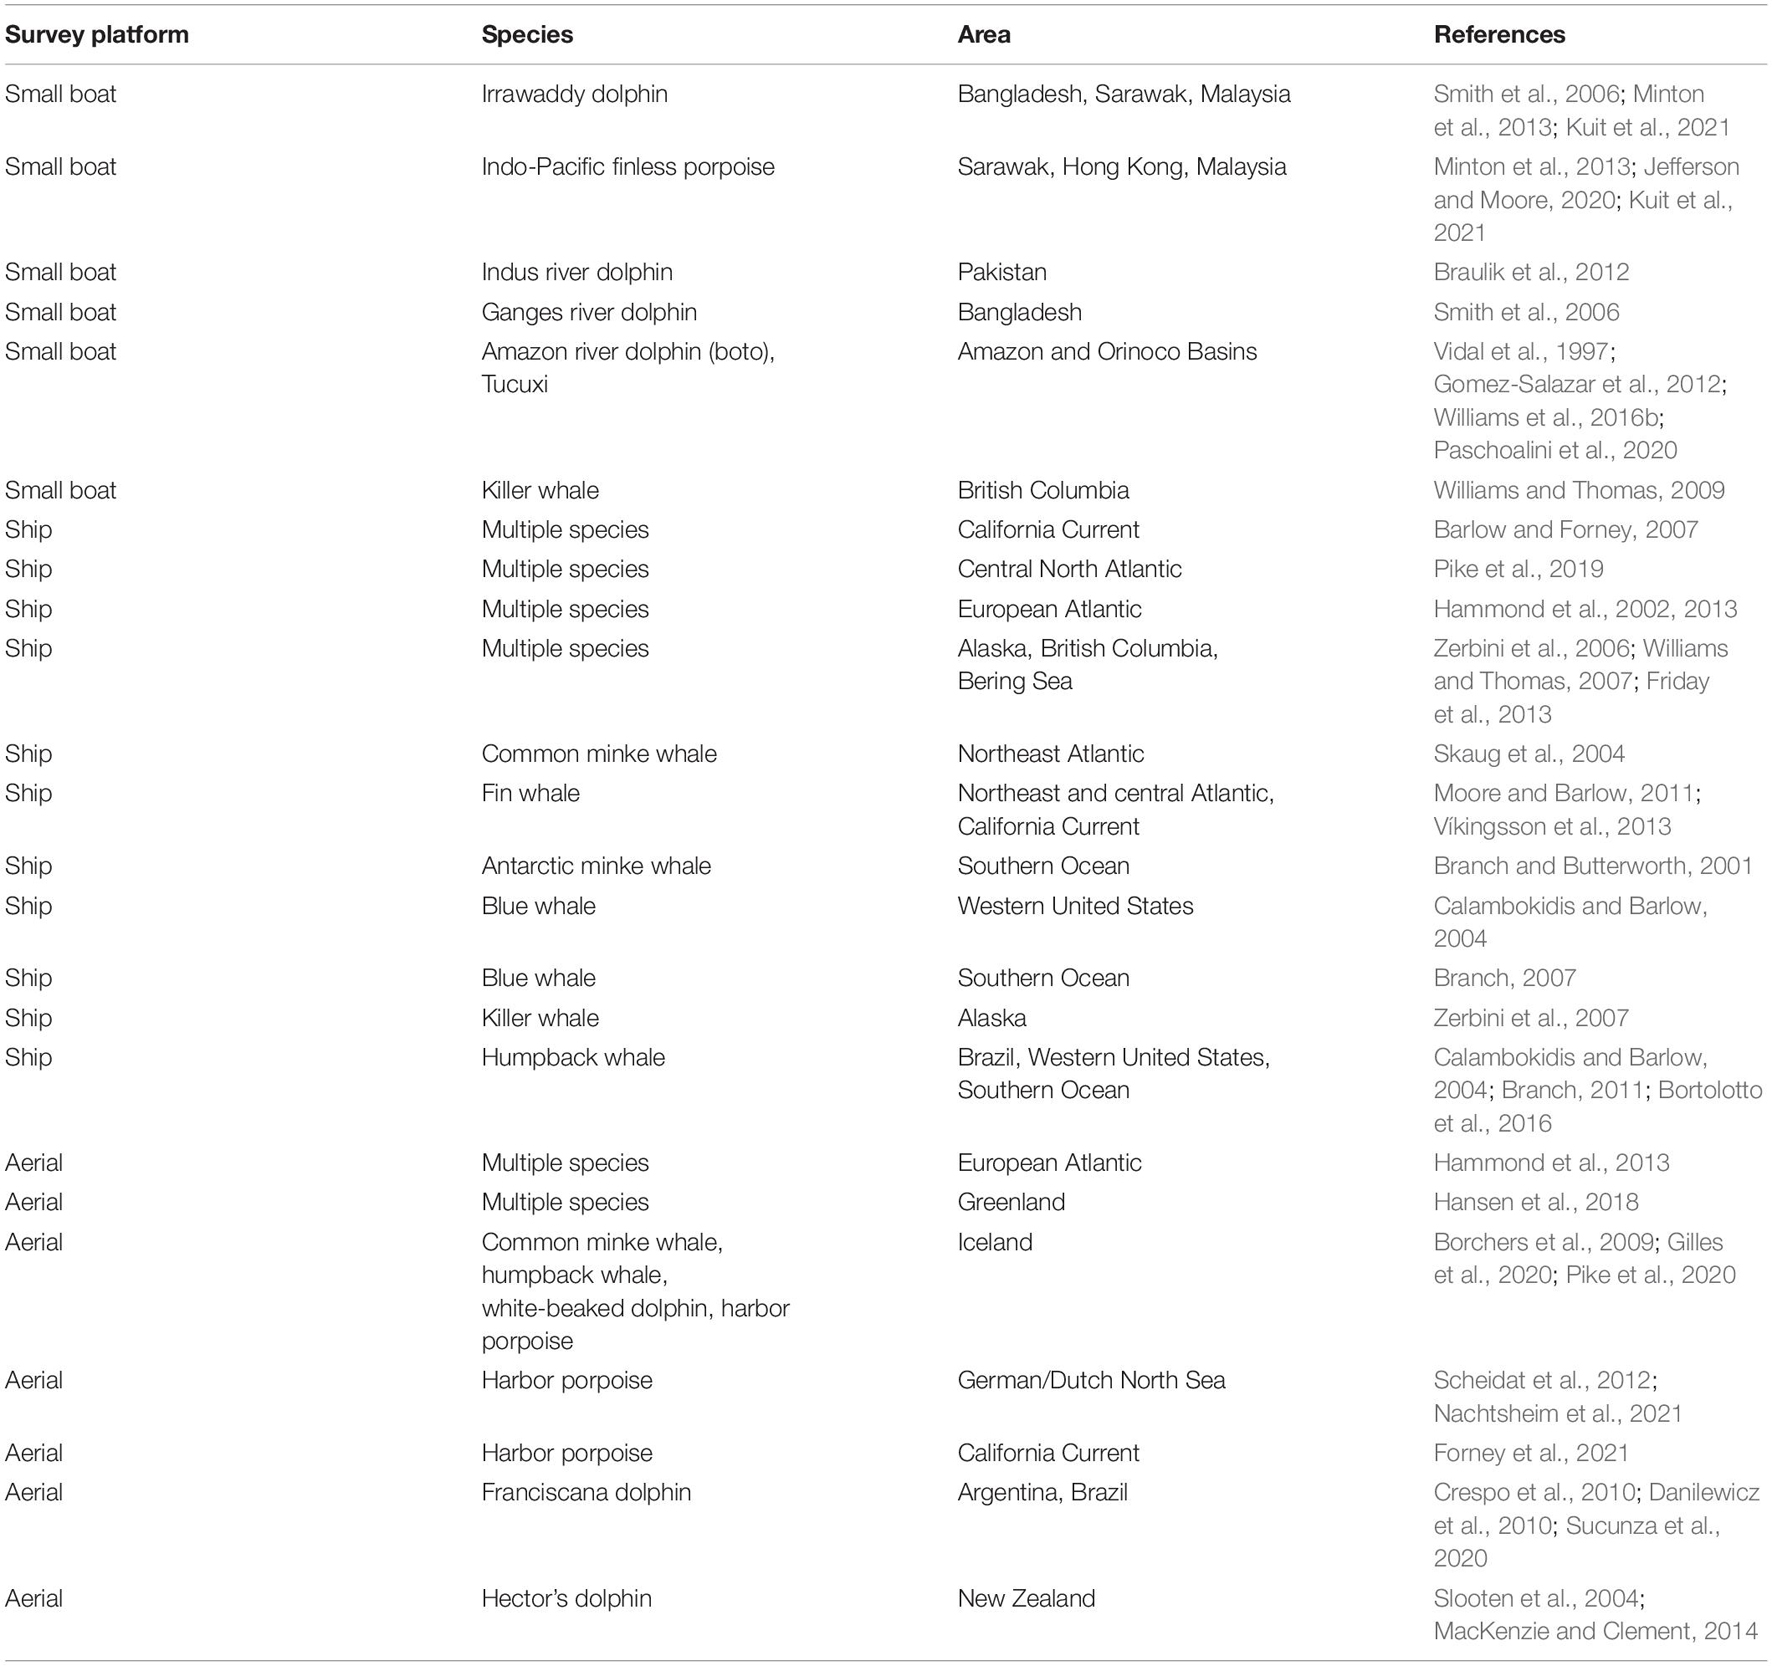
Table 1. Example studies using line transect (distance) sampling to estimate the abundance of cetacean species.
Further Assumptions of Line Transect Sampling
An important assumption of line transect sampling is that all animals directly on the transect line are seen. Clearly, this is unlikely to be true generally for marine mammals, which spend most of their lives underwater and might thus be unavailable for detection at the surface. Undercounting as a result of this is known as availability bias, because animals are unavailable to be seen. Even if a group of animals on the transect line is at the surface, it may not be detected because of observation conditions or simply by chance; this is known as perception bias. Estimates of cetacean abundance that are not corrected for animals missed on the transect line are thus negatively biased to an unknown extent. In the literature, the probability of detection on the transect line, encompassing availability and perception, is typically known as g(0).
A standard way to correct for animals missed on the transect line is to collect data from two independent observation platforms (double observer team data), identify duplicate detections, and implement so-called mark-recapture distance sampling methods (e.g., Burt et al., 2014), which allow correction for perception bias. g(0) is likely to vary with sighting conditions (Barlow, 2015), which may thus need to be taken into account in analysis (e.g., Moore and Barlow, 2013).
Double-observer team data collection is usually not possible on small boats used in coastal waters, and small aircraft may also not be able to accommodate two independent teams of observers; estimates of abundance from such surveys will therefore not be corrected for perception bias. Some recent work explores the use of passive acoustic data collected from a towed hydrophone in combination with a conventional visual observer team to estimate g(0) (Martin et al., 2020; Rankin et al., 2020).
There is also the potential to correct for availability bias using double observer team data. On ships, this can be implemented using the so-called “tracker mode,” which involves one team of observers (tracker) searching far ahead of the vessel and tracking detected animals until after they become available to the second team (primary) searching closer to the vessel (e.g., Hammond et al., 2013). However, this method may not correct, or fully correct, for availability bias, depending on the species. In particular, as mentioned above in the context of acoustic data, long-diving species such as beaked whales or sperm whales may be underwater, and thus unavailable, for the whole time that a survey ship passes by. On aerial surveys, the circle-back or “racetrack” method (Hiby, 1999) was developed to correct for both perception and availability bias for relatively short-diving species, such as the harbor porpoise (e.g., Scheidat et al., 2012; Hammond et al., 2013). In this method, triggered by a sighting of an animal or group of animals, the aircraft circles back and re-surveys the same piece of transect line to provide the equivalent of double observer team data.
Alternatively, availability bias can be corrected for using data on the proportion of time animals or groups of animals spend on the surface; such data may come from observations of diving behavior (e.g., MacKenzie and Clement, 2014; Sucunza et al., 2018) or telemetry (e.g., Heide-Jørgensen and Laidre, 2015).
Some additional studies that estimate the proportion of animals seen on the transect line, g(0), include Marsh and Sinclair (1989) and Laake et al. (1997) for aerial surveys, and Barlow (2015); Moore and Barlow (2013), and Pike et al. (2019) for ship surveys.
A further assumption of line transect sampling is that animals do not move prior to detection. Random movement only becomes important at slow survey speeds; bias in estimated abundance is positive but small unless survey speed is less than around twice the speed of movement of the animals (Buckland et al., 2001). This is typically not the case but may need to be considered if the survey vessel is a yacht, for example. However, some species may react to approaching survey ships by moving away from or toward them prior to being detected, resulting in biased measurements of perpendicular distance. Such responsive movement is typically not a problem for aerial surveys because of the relatively high speed of aircraft. From ships, responsive avoidance or attraction may lead to under- or over-estimation of abundance, respectively. Over-estimation (positive bias) as a result of attraction prior to detection has been shown to be substantial in some studies (e.g., Turnock and Quinn, 1991; Cañadas et al., 2004). One method of identifying and dealing with responsive movement prior to detection on ship surveys is described in Palka and Hammond (2001).
As with other methods, it is assumed that data are collected accurately but this can be a considerable challenge in line transect (or strip transect) surveys for cetaceans. The basic data related to sightings of animals (species identity, perpendicular distance, group size) can all be difficult to determine or measure, especially from a ship, and errors can lead to bias. Issues related to measurement error in estimates of distance and angle to groups sighted on boat surveys are discussed by Williams et al. (2007). The potential bias in estimates of abundance caused by errors in distance and angle measurements is investigated by Leaper et al. (2010). A photographic method to improve the accuracy of these measurements (Gordon, 2001; Leaper and Gordon, 2001) has been further developed and used in surveys in the European Atlantic (e.g., Hammond et al., 2013). Bias in group size estimation may have a substantial effect on abundance estimates. For example, in transect surveys of pelagic dolphins, Gerrodette et al. (2019) found that observers underestimated group sizes greater than 25 animals and that this negative bias increased with group size. Boyd et al. (2019) described methods for estimating group size from photographic or video images taken on aerial survey. Observer training in group size estimation may improve estimates by reducing variance among observers and reducing bias.
Model-Based Estimation of Abundance
An alternative to the design-based estimation methods of analysis described above is to model observed density along the transect lines as a function of environmental covariate data and to use the model to predict density over the entire survey area to obtain an estimate of abundance (e.g., Gilles et al., 2016; Panigada et al., 2017; Rogan et al., 2017; Becker et al., 2020). This model-based estimation of abundance is also referred to as density surface modeling (Miller et al., 2013) or species distribution modeling (Zurell et al., 2020). Note that detection probability must be estimated and incorporated in analysis for model-based estimates of abundance to be unbiased. Relevant environmental covariates could be spatial (e.g., latitude and longitude), physiographic (e.g., depth, slope), or reflect dynamic oceanography (e.g., sea surface temperature).
There are several attractive features of model-based estimation of abundance. The use of additional covariate data means that model-based estimates of abundance are potentially more precise than design-based estimates calculated from the same survey data (e.g., Rogan et al., 2017). Moreover, the data do not have to come from surveys designed to achieve equal coverage probability of the survey area, so abundance can be estimated from surveys where this has not been possible (e.g., Cañadas and Hammond, 2006, 2008; Williams et al., 2006, 2011). Data collected from platforms of opportunity such as fishery surveys, ferries, or whale-watching vessels could thus be used to estimate abundance using model-based methods, as long as the base survey data themselves are adequate. A potentially useful feature of model-based estimation is that abundance can be estimated for any defined area, rather than being restricted to the survey blocks in the design-based method.
However, there are some important issues to consider when using model-based methods. As in any model, the more covariates included, the larger the number of observations needed to support a more complex model. Model-based methods may thus not be appropriate for datasets with a small number of observations. In addition, the range of values of the environmental covariates in the area for which abundance is to be estimated (the “covariate envelope”) must have been adequately sampled by the survey to ensure robust prediction of abundance. Prediction of any model outside the range of the data used by the model should be done with caution and estimation of abundance in areas or in a “covariate envelope” not covered by the data may be challenged. However, there is an increasing need to estimate abundance in unsurveyed areas and methods for extrapolating model-based density to such areas are in development (see e.g., Mannocci et al., 2017; Bouchet et al., 2020).
Perhaps the most important issue is the obvious point that model-based estimates of abundance are dependent on the model fitted to the data. Good modeling practice can be gleaned from appropriate texts and example studies (e.g., Gilles et al., 2016; Becker et al., 2020) but there are nevertheless multiple ways in which models can be applied and different models will produce different estimates of abundance. Selection of the “best” model can be challenging. Estimating the precision of model-based abundance estimates can also be more challenging than it is for design-based estimation; propagating uncertainty in all model parameters is complex and is an active area of research (Becker et al., 2020; Sigourney et al., 2020).
Land- or Ice-Based Counts of Migrating Baleen Whales
Some populations of baleen whales, namely gray, humpback and bowhead whales, migrate close to land or ice and can be counted as they pass a suitable observation point. However, even if the whole population migrates past such a point, not all animals will be observed and counted, so the counts need to be corrected and extrapolated to obtain unbiased estimates. Whales can be missed because they migrated past the observation point before or after the observation period, at distances beyond visual range, or during periods when counting could not take place, such as at night or during poor weather. These whales are thus unavailable to be counted, leading to availability bias described above, which needs to be corrected for with correction factors derived from additional data and/or models.
Whales may also be missed because they were available to be seen but were not detected (equivalent to perception bias described above). A correction factor for this bias can be estimated from data collected at two observation points in the form of a mark-recapture experiment, equivalent to mark-recapture distance sampling. In addition, in studies where whales are typically detected in groups, the number of whales in a group may be underestimated and need to be corrected for using data collected additional to the main study.
Studies to estimate abundance of migrating baleen whales that include correction factors such as those described above include: gray whales (Rugh et al., 2005; Laake et al., 2012), humpback whales (Noad et al., 2011) and bowhead whales (George et al., 2004; Givens et al., 2016).
The number of migrating whales can also be estimated using aerial survey, rather than land- or ice-based counts. Salgado Kent et al. (2012) employed this method to estimate the abundance of humpback whales off western Australia on both north- and southbound migration. In this study, challenges in allocating temporarily milling whales to the north- or southbound component of migration was identified as a factor that could influence estimates of abundance.
Mark-Recapture
Recognition of Individual Animals
If individual animals are naturally or artificially marked, and can subsequently be recognized in the future, mark-recapture methods can be used to estimate abundance (Hammond et al., 1990; Amstrup et al., 2005; Hammond, 2018). The conventional way to mark an animal is to capture it physically and apply an artificial mark or tag, for example, a colored band or ring attached to the leg of a bird. Studies of marine mammals in which artificial marks or tags have been applied to individuals have typically been undertaken to estimate correction factors for pinniped counts or to estimate survival rates (McIntosh et al., 2013; Greig et al., 2019; Brusa et al., 2020). Population size has been estimated from analysis of data from leopard seals (Hydrurga leptonyx) marked with flipper tags (Jessopp et al., 2004; Forcada and Robinson, 2006) and northern elephant seals (Mirounga angustirostris) marked with hair dye (García-Aguilar and Morales-Bojórquez, 2005).
In some species of marine mammal, individual animals can be recognized from natural markings on their skin or pelage, or the nicks and notches on their dorsal or tail fin. Individuals are “captured” and “marked” by taking high-quality photographs of these natural markings, avoiding the need for physical capture or artificial marking. This method of data capture is known as photo-identification, or photo-id. Some example studies estimating the abundance of species that possess natural markings using mark-recapture methods applied to photo-id data are given in Table 2.
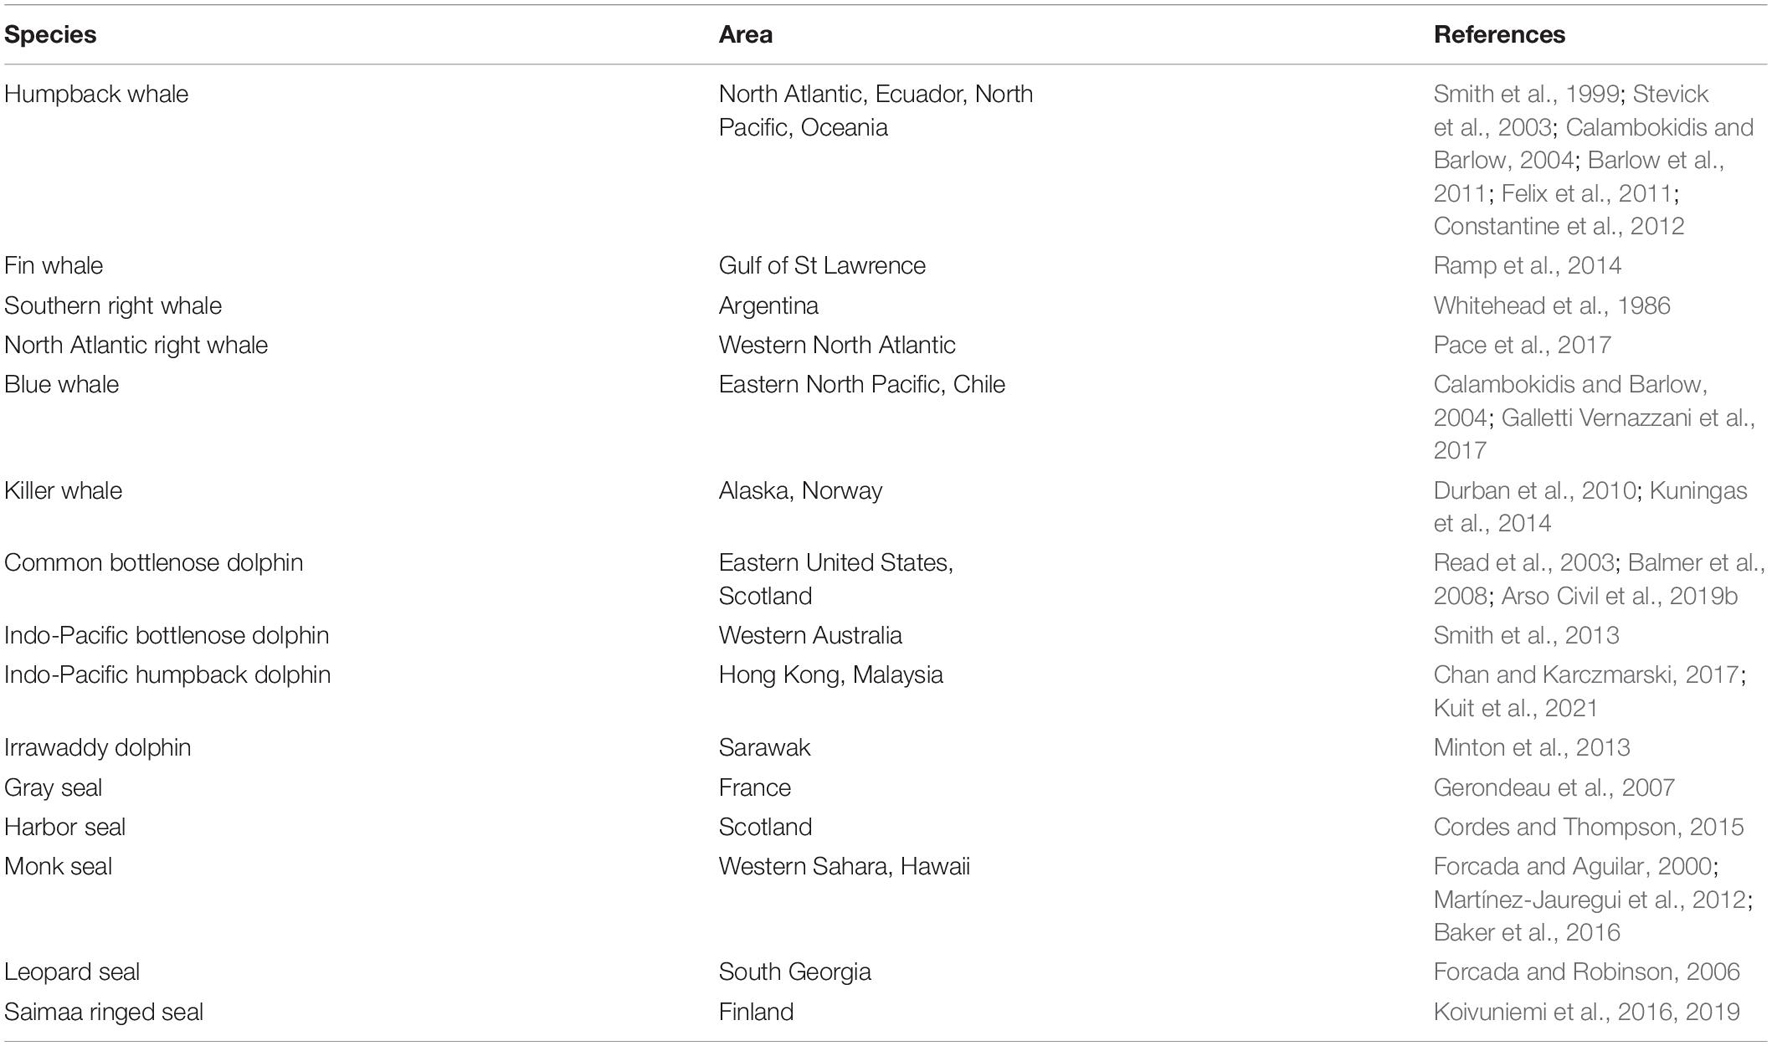
Table 2. Example studies applying mark-recapture analyses to photo-identification data to estimate the abundance of cetacean and pinniped species.
Photographs may be taken on land for pinnipeds and at sea for most species of cetacean; aerial photographs can be used for some species of large whale, e.g., right and bowhead whales. Processing includes grading photographs for image quality and matching images to a catalog of previously identified individuals. Urian et al. (2015) provides a good general review of best practices for implementing photo-id methods to generate data for estimating abundance using mark-recapture. Issues that need consideration include photographic quality, distinctiveness of individuals, matching criteria, and the permanence or evolution of natural markings.
The process of matching individuals becomes considerably more time consuming as a catalog of individuals becomes large. Computer software to assist matching individuals of some species has been available and used for some time, e.g., for gray seals (Hiby and Lovell, 1990) and humpback whales (Mizroch et al., 1990). Two generic systems currently available are the Interactive Individual Identification System (I3S)7; and the Image-Based Ecological Information System (IBEIS) accessible via Wildbook8. Recent developments of automated matching systems for cetaceans include Bogucki et al. (2019) for right whales and Cheeseman et al. (in press) for humpback whales. Some projects encourage so-called citizen science by providing portals for members of the public to upload photographs for matching910.
In addition to physical marking/tagging and photo-id, individuals can be marked using their DNA as a genetic marker. As with photo-id, this avoids the need for physical marking and, if a remote biopsy sample is taken, physical capture (e.g., Palsbøll et al., 1997). Conventional mark-recapture models can then be applied; examples include studies of Māui dolphins (Cephalorhynchus hectori maui) (Hamner et al., 2014), North Pacific right whales (Eubalaena japonica) (Wade et al., 2011) and humpback whales in Oceania (Constantine et al., 2012). Genetic data from individuals can also be used to estimate population size in close-kin mark-recapture analysis (Bravington et al., 2016; Ruzzante et al., 2019). While the use of this method is still in its infancy, it has some advantages over traditional mark-recapture methods that may prove useful in some circumstances.
If data from more than one mark type are available, for example left-and right-side photo-id images of individuals or both photo-id and genetic markers, it may be possible to use both data sources simultaneously to estimate abundance (see Madon et al., 2011; McClintock et al., 2013; McClintock, 2015).
On rare occasions, it may be possible to identify all, or almost all, of the animals in a population over a season, in which case the data provide a (nearly) complete count and there is no need for mark-recapture analysis. This is most likely to occur only for small populations in which individuals are strongly resident in a small area, e.g., ‘southern resident’ killer whales, which number less than 100 (Olesiuk et al., 1990). So-called discovery curves (e.g., Balmer et al., 2008) of the cumulative number of newly identified individuals plotted over a period of time in which the population is assumed to be closed (see below) may help to ascertain this.
Mark-Recapture Estimation of Abundance
Using mark-recapture methods to estimate the size of a population is most easily illustrated by considering data from just two samples, a capture occasion and a recapture occasion. Consider that a sample (number) of individuals, n1, is captured, marked and released back into the population. After a period to allow mixing of animals, a second sample of individuals, n2, is captured. If a number of these individuals, m2, have been previously marked (and are thus recaptures), and if some assumptions are met (see below), the estimated proportion of marked animals in the second sample, , should equal the proportion of marked animals in the whole population, , where N is population size.
Equating these terms and rearranging the equation leads to an estimator of the size of the population: , usually known as the Petersen two-sample estimator. Alternatively, we could express estimated population size as: , to illustrate that mark-recapture methods correct the count of individual animals captured in a sample by an estimate of the probability of capturing an animal. Mark-recapture analysis can also be thought of as a way to estimate the number of animals in the population that were never captured during the study.
Abundance, thus estimated, is defined as the number of individuals that were present in the study area during the period when sampling took place. Note that, in situations where animals move in and out of the study area during the sampling period (see below), this estimate of abundance may be different from that obtained from a survey over a shorter period of time (see “Mark-recapture using photo-id data or line transect sampling?”).
Most mark-recapture studies, including those referred to above, use multiple samples, in which all samples except the first include recaptures of marked animals and captures of animals not previously encountered. The data used in analysis are the capture histories of each individually identified animal, typically represented by a string of 1s (captured) and 0s (not captured). Options for analysis range from relatively simple “conventional” models to those that allow relaxation of assumptions made by simpler models (see below). Mark-recapture analysis is often conducted in the purpose-specific software MARK11 (see “Data analysis”).
In some species, particularly delphinids, not all individuals in the population possess natural markings that allow them to be recognized. In these cases, mark-recapture analysis of these data only estimates the abundance of animals with adequate markings. To obtain estimates of abundance of the whole population, the proportion of unmarked animals in the population must be estimated (e.g., Urian et al., 2015).
Mark-Recapture Assumptions
Regardless of how an animal is marked, mark-recapture methods assume that individuals are uniquely marked, that marks cannot change or be lost, and that all marked animals are recognized and recorded correctly. The assumption that the data are accurate is particularly important in mark-recapture analysis because errors in recording the number of recaptures can lead to substantial bias in estimates of population size if sample sizes are small. Additional assumptions made when applying mark-recapture methods relate to the models used for data analysis (e.g., Hammond, 2018).
An important assumption made by conventional mark-recapture models is that, within a sampling occasion, all animals have the same probability of capture. In studies where individuals are physically captured and marked, capture probability may change as a result of marking. However, the most common violation of this assumption for studies of cetaceans using photo-id is that capture probabilities vary from one individual to the next – often described as heterogeneity of capture probabilities. There are several reasons for this. Individuals may have preferences for different areas leading to variation in the probability of encountering an animal if not all areas inhabited by the population are equally sampled, as is commonly the case. Individuals may also respond differently to being approached for photography, and variation in natural markings among individuals may lead to variation in ability to identify them. Capture probability may vary by sex or reproductive status as well as from individual to individual.
For these reasons, heterogeneity of capture probabilities is a feature of most cetacean photo-id datasets, even when field methods are implemented to minimize the problem. If this is not explicitly dealt with by modifying conventional mark-recapture models in analysis, estimates of population size will be negatively biased (e.g., Hammond, 2010, 2018). Animals with high capture probability will be recaptured more often than average, leading overall to more recaptures than expected and to negative bias (see equation for Petersen two-sample estimator above). Conversely, animals with very low capture probability may never be seen and thus not be included in the population estimate, also leading to negative bias.
Another key consideration is whether the population can be assumed to be demographically closed, i.e., no recruitment, death or permanent immigration/emigration takes place during the study period. If this can be assumed, closed population models (see Hammond, 2018) can be used in analysis. For this to be true, the study period must clearly be short relative to the life history of the study species. It is commonly accepted that data collected within a year adequately meet the assumption of demographic closure for marine mammals. For longer-lived species with lifespans of several decades, it may be acceptable to use closed models to analyze data from two or more years (e.g., Smith et al., 1999) because the bias introduced by failure of the closure assumption is relatively small (Hammond, 1986). Justifying the use of closed models is potentially important because it is straightforward to relax the assumption of equal capture probabilities, thus minimizing or avoiding the associated negative bias otherwise associated with heterogeneity (Wilson et al., 1999; Calambokidis and Barlow, 2004; Kuningas et al., 2014; Curtis et al., 2021).
Open population models (see Hammond, 2018) that allow demographic change may be required to analyze longer time series of data (i.e., several years). However, modifying open population models to fully relax assumptions about equal capture probabilities is rarely possible and they may also be difficult to fit to data (e.g., Curtis et al., 2021). Open population models are thus less commonly used for estimating the abundance of marine mammal populations.
The open population model POPAN estimates the size of a so-called “superpopulation.” This is an estimate of the total number of animals using the study area that were alive at any point over the whole study period; for any given year it thus includes animals that have died and those that have yet to be recruited. Studies that have used this model include Constantine et al. (2012) for humpback whales in Oceania and Galletti Vernazzani et al. (2017) for blue whales (Balaenoptera musculus) off Chile.
Other studies have used open population models of survival to estimate annual recapture probabilities, pt and then used them to correct the number of animals captured each year, nt. Abundance in each year, t, is then estimated as , which is equivalent to the equation relating to the Petersen estimator. Studies using this approach include Taylor et al. (2009) for polar bears (Ursus maritimus) and Madon et al. (2013) for humpback whales. However, this approach assumes that capture and recapture probabilities are equal, which is likely not to be the case in most studies. More complex open population mark-recapture models to estimate abundance can be developed if data are available, for example for western gray whales (Cooke et al., 2005) and for North Atlantic right whales (Eubalaena glacialis) (Pace et al., 2017).
It may be preferable to use closed population models fitted to data within each year if multiple samples are available within each year. Alternatively, a method of analysis that combines open and closed population models, known as “robust design,” can be applied to data to estimate population size within years and survival rates between years (e.g., Smith et al., 2013; Arso Civil et al., 2019a, b) or seasonal variation in population size (e.g., Cordes and Thompson, 2015). Robust design models can also estimate temporary emigration/immigration rates, the incorporation of which can reduce any bias in annual estimates of population size (and survival rate) caused by inter-annual movement of animals out of and into the study area. These models can be powerful tools but to use them appropriately requires studies that generate representative data both within and among years.
Practicalities and Resources
In some cases where the abundance of a population of marine mammals is to be estimated, the choice of a suitable method is fairly clear. For example, extrapolating counts of either pups or all-age animals is likely to be the main method considered to estimate the abundance of pinniped species that form aggregations on land because counts are typically relatively easy to conduct. For ice-associated species, however, their scattered distribution in large and difficult-to-access areas will typically require an aerial survey. Ship line transect surveys may be the only feasible method to estimate the abundance of cetacean populations inhabiting large areas far from land. However, there are circumstances in which the choice of method may not be clear.
Given the species of interest and its primary habitat, understanding the practical requirements and resources needed to collect the data to implement a given method is a good starting point. Table 3 summarizes this information for each of the methods described above. Even if the choice of methods is clear, it should be useful to summarize what the commitments are likely to be. Some particular issues are discussed below. Whatever method is used, it is crucial that personnel have adequate expertise and receive the appropriate training.
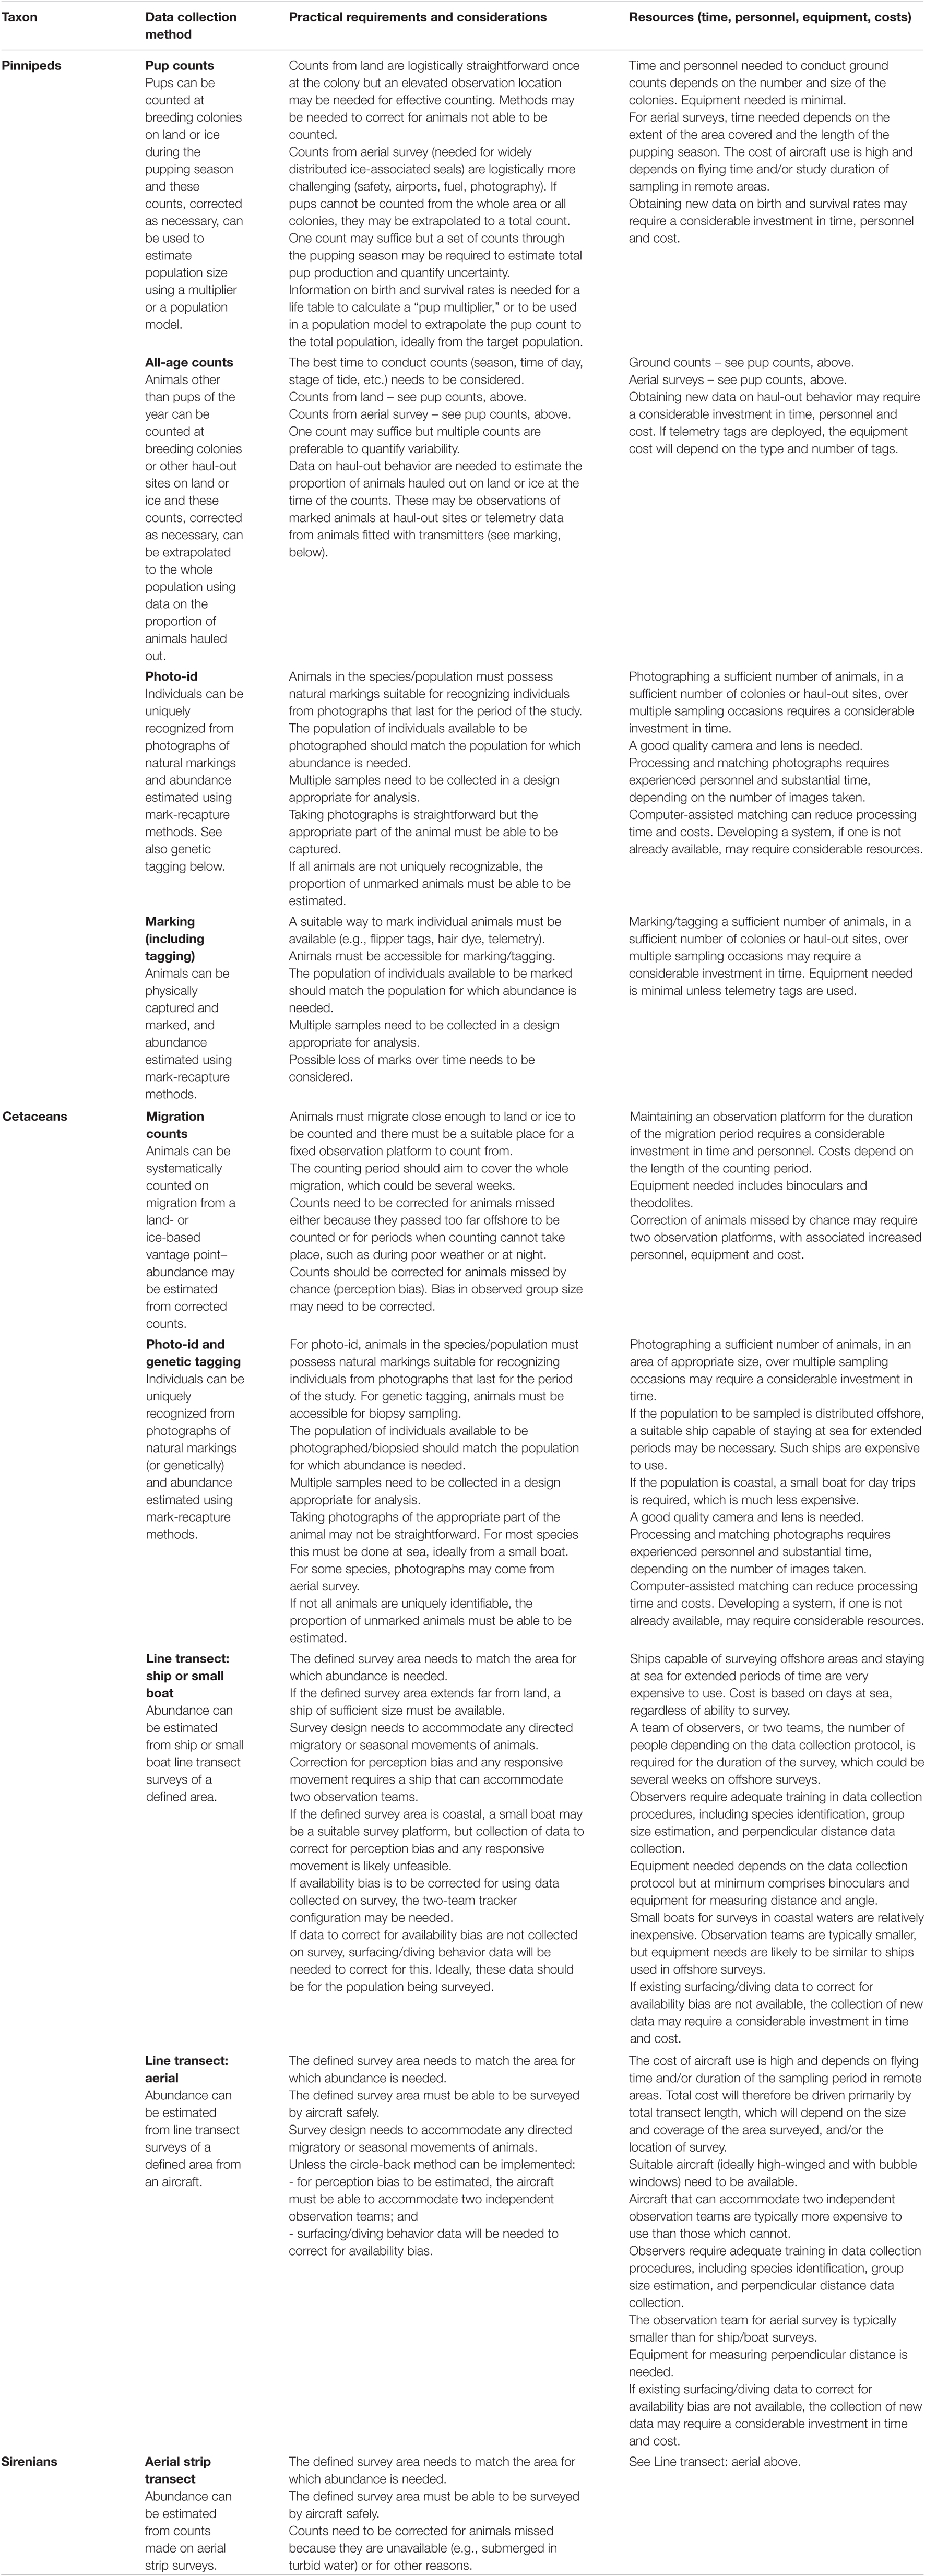
Table 3. Summary of practical requirements and resource needs for obtaining data to estimate abundance of marine mammal populations.
Figure 2 summarizes the general flow of information and activities when considering the estimation of abundance of a marine mammal population.
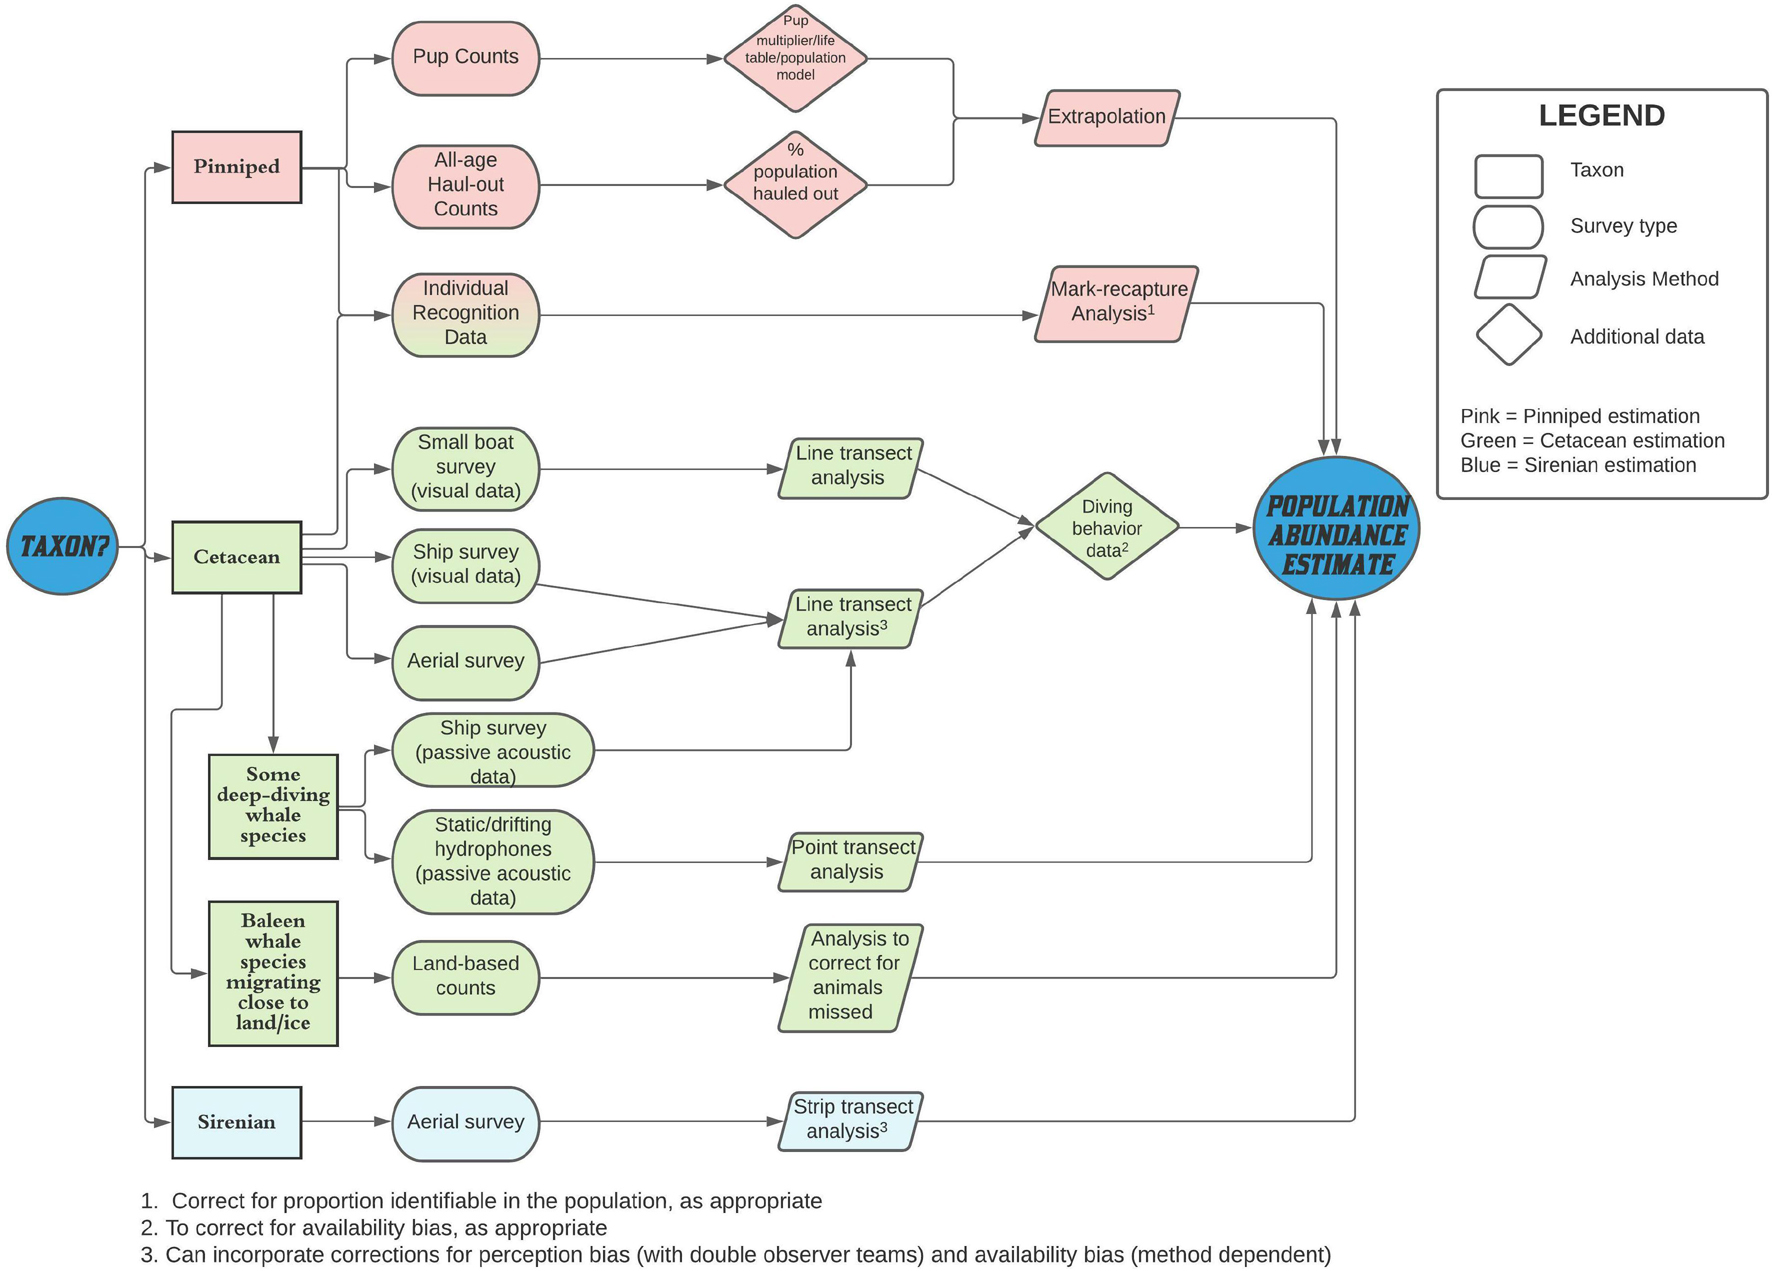
Figure 2. Simplified schematic of the flow of information and activity when estimating the abundance of marine mammal populations.
Pinniped Counts – Pups or All-Age Animals?
Section “Correcting and extrapolating counts of a defined portion of a population” and Table 3 describe the basis and requirements for studies to estimate the abundance of pinniped populations from counts. When considering such studies, it may be required to decide whether to count pups or animals of all ages. The practical aspects of ensuring that counts are as accurate as possible are similar, but the choice may be informed based on how available the animals are to count.
In most species, pups are available at a defined time of the year and, in many species, pups are ashore for many days or even weeks, facilitating both planning and the actual counting. If there is a period of peak pupping, pup counts can be focused at this time both to maximize the count but also to ensure consistency across years. Care may be needed, however, if the pupping period shifts over time. Counts of mature animals can also be made at pupping/breeding colonies but immature animals are unlikely to be included.
Counts of pups may not be straightforward to obtain for some species; for example, harbor seal (Phoca vitulina) pups can enter the water soon after birth. For such species, or where counting pups is logistically challenging, counting animals of all ages may be required or desirable. In these cases, it is important to determine an appropriate time to make counts, ideally when the largest proportion of the population is hauled out. For phocid seals, the annual molt may be a good time.
The difference in how pup counts and all-age counts are extrapolated to the whole population may also be an important factor in choice of method. For pups, life history information is needed to calculate a “pup multiplier” or as input to a population model. For all-age animals, information on haul-out behavior, preferably from telemetry, is needed to estimate the proportion of animals ashore when counts are made.
Mark-Recapture Using Photo-Id Data or Line Transect Sampling?
If individuals in a population of cetaceans possess natural markings suitable for photo-identification, e.g., humpback or blue whales, or bottlenose dolphins (Tursiops truncatus), viable alternative methods could be mark-recapture analysis of photo-id data or a line transect sampling using a ship, small boat or aerial survey.
For mark-recapture estimation, the distribution and/or size of the population and the behavior of the animals can make it challenging to achieve capture probabilities that are sufficiently high for abundance to be estimated with the desired level of accuracy and/or precision. In such cases, a line transect survey would be more effective. Multiple case-specific factors mean that it is not possible to generalize on how high capture probabilities should be, but the studies in Table 2 provide examples for guidance.
As mentioned above in relation to definition of the population being estimated, surveys using line transect methods sample density within a defined area and thus estimate abundance within that area at the time of the survey. Mark-recapture methods sample individuals and therefore estimate the size of the population using the study area during a study period. Estimates of these two quantities may not be the same even for the same study/survey area. If the mark-recapture study period is longer than the line transect survey and if animals move in and out of the study area during that period, the population sampled will comprise more animals than are present in the area at one time. This may be important in terms of the objectives for the abundance estimate. If the objective of the study is to estimate abundance in an area at a particular time, a line transect survey may be most appropriate, but if it is to estimate the number of animals using the area over a longer period, mark-recapture could be more appropriate. Abundance has been estimated and compared using these two methods for humpback and blue whales off the west coast of the United States and Mexico (Calambokidis and Barlow, 2004), and for killer whales in British Columbia (Williams and Thomas, 2009).
Two studies that consider some of these issues for small cetaceans are Minton et al. (2013) and Kuit et al. (2021). The first study used small boat line transect surveys to estimate the abundance of Irrawaddy dolphin (Orcaella brevirostris) and Indo-Pacific finless porpoise (Neophocaena phocaenoides) in coastal waters of Sarawak, Borneo, and also used mark-recapture analysis of photo-id data to estimate the number of Irrawaddy dolphins using the study area. The estimates of Irrawaddy dolphin from the two methods were broadly comparable but those from mark-recapture were around 50% larger, a result interpreted by Minton et al. (2013) as reflecting the mark-recapture analysis representing a larger population beyond the study area.
The second study used small boat line transect surveys to estimate the abundance of Irrawaddy dolphin and Indo-Pacific finless porpoise in coastal waters of Matang, Malaysia, and mark-recapture analysis of photo-id data to estimate the number of Indo-Pacific humpback dolphins (Sousa chinensis) using the study area. Kuit et al. (2021) did not use mark-recapture for Irrawaddy dolphins because the animals’ behavior led to poor-quality photographs and adversely affected individual identification. Minton et al. (2013) also noted that obtaining photo-id pictures of Irrawaddy dolphins was challenging.
There may be practical implications in terms of time to conduct the sampling and/or process the data. A line transect survey can be conducted relatively quickly and only one survey is needed to estimate abundance. Mark-recapture studies require at least two and ideally several capture occasions over a period of time that allows the population to mix between occasions. It is likely to take longer to process photo-id data than line transect survey data prior to analysis. Implementing multiple sampling occasions and processing photo-id data have cost implications that may exceed those of conducting a line transect survey (see Table 3).
There may also be practical implications in terms of observation platform. Photo-id can be done from ships but is best done from small boats. In riverine or enclosed marine habitats where navigation is impractical for larger vessels and where survey conditions are good, small boats may be the best platform for line transect surveys. However, small boats may have limitations, depending on the survey area and the method used. The observer is typically not very high above water level thus limiting the area that can be searched. It is unlikely that animals missed on the transect line as a result of perception bias will be able to be corrected for. Any movement of animals in response to the approaching boat prior to detection will also be impossible to account for; this may be important for some coastal species. Aerial surveys, on the other hand, are immune to responsive movement, and it is feasible to collect two-team data to estimate perception bias with an aircraft of sufficient size. However, aerial surveys are likely to be much more expensive and the logistics (surrounding terrain, location of suitable airports, etc.) and safety issues are more challenging (see below). Practical advice for designing and conducting line transect surveys for cetaceans in coastal and riverine habitats can be found in Dawson et al. (2008).
Aerial Survey or Ship Survey?
Some cetacean species are not typically confined to coastal waters but nevertheless may not occur a long way offshore. For example, harbor porpoises are largely found on the continental shelf in European Atlantic waters (Hammond et al., 2013). Even if the distribution of the species of interest extends beyond this, the objective may nevertheless be to estimate abundance within a limited range, for example a country’s 200 nm exclusive economic zone. The choice of whether to survey using a ship or an aircraft may therefore arise.
A crucial overarching consideration is safety. Accidents can happen at sea and in the air but the consequences are inherently far more serious in aerial surveys; fatal accidents have occurred during aerial surveys of cetaceans and seals. The risks can be reduced by careful consideration of the type of aircraft, the environmental conditions, and the logistics. Twin-engine aircraft should always be used when at all possible, especially in waters away from the coast. Experienced pilots are essential. Important logistical issues include the location of suitable airports and the availability of fuel. Aerial surveys should only be undertaken by personnel who recognize the risks and where those risks have been mitigated to the extent possible. Regarding choice of equipment to maximize the effectiveness of data collection, high-wing aircraft with bubble windows optimize visibility on and around the transect line. A clinometer is needed for measuring perpendicular distance; the recently developed “geometer” (Hansen et al., 2020) facilitates this and minimizes error.
Camera systems have been used on aerial surveys for some time to count pinnipeds on land or ice (e.g., Speckman et al., 2011; Russell et al., 2019; Thompson et al., 2019; Stenson et al., 2020) and also some cetaceans (e.g., beluga and narwhal – Gosselin et al., 2017; Doniol-Valcroze et al., 2020). They have also been used on aerial surveys for seabirds (e.g., Buckland et al., 2012) and are increasingly being used or considered for cetaceans (e.g., Williamson et al., 2016; Lennert-Cody et al., 2018). There remain challenges regarding data processing, which is time consuming without automatic image analysis, and in data analysis for unbiased abundance estimation, but there are recent developments. In particular, work on analytical methods to use data from two camera systems on one aircraft is promising (Stevenson et al., 2018; Borchers et al., 2020).
Advances in technology have also led to the development of various unoccupied aircraft systems (UAS) [also known as unmanned aerial vehicles – UAV] to collect photographic data on marine mammals with the aim of assessing their effectiveness for estimating abundance. Results show promise for pinnipeds (Goebel et al., 2015; Moreland et al., 2015), sirenians (Jones et al., 2006; Hodgson et al., 2013) and cetaceans (Aniceto et al., 2018); see also reviews in Marine Mammal Commission (2016) and Johnston (2019). UAS may also be useful to confirm species identity and estimate group size of cetaceans on ship surveys.
Unoccupied aircraft systems eliminate the human risk of flying but there are currently considerable challenges to use them to conduct surveys to estimate abundance. In a comparison of surveys of Arctic cetaceans conducted using UAS and piloted aircraft, Ferguson et al. (2018) found that estimates of density from UAS were smaller, less precise and an order of magnitude more expensive to obtain than estimates from conventional visual survey methods. UAS powered by jet fuel can survey for several hours (e.g., Angliss et al., 2018; Ferguson et al., 2018) but the endurance of more widely available battery powered UAS is usually too short (e.g., 20 min; Aniceto et al., 2018) for most surveys.
Ships typically survey at speeds that are an order of magnitude slower than aircraft, and thus cover transects much more slowly than aircraft per unit time. Even though the effective strip width on aerial surveys is typically narrower than on ship surveys, the effective search area is still much smaller per unit time on ship surveys than on aerial surveys. For example, on the SCANS-II survey of European Atlantic waters, the effective search areas per unit time for harbor porpoises, white-beaked dolphins (Lagenorhynchus albirostris) and bottlenose dolphins were 5–9 times larger for an aerial survey than a ship survey (Hammond et al., 2013). Aerial surveys are thus able to “cover a lot more ground.”
However, because of the difference in survey speed, the probability of detecting animals is much smaller on aerial surveys than on ship surveys, although aircraft survey speed does mean that responsive movement does not need to be considered. On aerial surveys, animals are available to be seen for a shorter period of time and it is easier to miss them by chance. In other words, both availability bias and perception bias are larger on aerial surveys than on ship surveys. This also means that sample sizes of sightings may be smaller on aerial surveys, which may make it more challenging to estimate detection probability.
There are also differences between ship and aerial surveys regarding ease of species identification and determining group size. On an aerial survey, groups of animals are seen for only a very short period of time (a few seconds) but on a ship there is much more time available to identify the species composition and size of groups, especially if conducted in closing mode.
One advantage of ship surveys is that they allow different data types to be collected. These may include photo-id data (which can also be collected on aerial surveys for some species, e.g., right and bowhead whales), biopsy sampling for genetic studies, environmental data for studies of habitat use and potentially for model-based abundance estimation, and acoustic data for deep-diving cetacean species such as sperm or beaked whales. However, photo-id and biopsy sampling take time away from surveying and it is important to consider whether the objectives of the study would be compromised by collection of such additional data. Ships can also accommodate more people, which may be useful in the context of training and outreach activities.
In terms of cost, chartering and using ships and aircraft is expensive and the cost varies depending on the equipment. The cost of larger ships is typically charged for a block of time on a per-day basis. Time at sea not surveying due to poor weather is part of this cost, which means that the expected proportion of time thus lost should be factored into survey planning. For aerial surveys, equipment charter costs are typically primarily dependent on flying hours, so time not surveying may not incur much financial penalty. However, in remote areas, aircraft need to be chartered for blocks of time in the same way as a ship and unfavorable weather also needs to be considered in planning.
Data Analysis
Table 3 does not consider analysis of the data to estimate abundance. To estimate abundance from pup or all-age counts of pinnipeds, or land-based counts of migrating whales, analysis can follow methods described in studies referred to in the associated sections of this paper.
For line transect (distance) sampling, the software DISTANCE (12 Thomas et al., 2010) is a commonly used analysis engine for Windows platforms. Several packages within the R analysis software (R Core Team, 2020) are also available for line transect analysis (Miller et al., 2019; Laake et al., 2020). Mark-recapture models to estimate population size are available in the widely used software MARK (see text footnote 8; Cooch and White, 2019) for Windows platforms. Efficient implementation of analyses in MARK can also be achieved through the R package RMark (Laake, 2013). DISTANCE and MARK can be used to implement standard methods and also more complex analyses that relax some of the assumptions of the more basic methods, as described above. The R package multimark (McClintock, 2015) fits mark-recapture models to data from more than one mark type, e.g., left- and right- side photo-id images, or photo-id and genetic marks.
However, a quick scan of the studies referred to above indicates that some use statistically complex methods that cannot be implemented in standard software and will be beyond the expertise of most biologists. If such methods are pursued, experienced analysts will be required.
Concluding Remarks
Motivated by the need to estimate the abundance of marine mammal populations to inform assessments for conservation and management, this paper provides background to abundance estimation and reviews the various methods available for pinnipeds, cetaceans and sirenians.
For pinnipeds, the primary methods are extrapolating counts of pups to the all-age population using life history information, or extrapolating counts of non-pups hauled out on land or ice to the whole population by accounting for the proportion of animals in the water, ideally using telemetry data. For species that aggregate on land, counts can typically be made on site, but aerial surveys are needed to count widely distributed ice-associated seals.
The abundance of cetaceans and sirenians is primarily estimated from transect surveys. Ships are needed to survey wide areas offshore, but aerial surveys are commonly used in waters adjacent to coasts, and small boats may be desirable or required in coastal waters and rivers. The assumption of line transect sampling that all animals are detected on the transect line is rarely if ever met for marine mammals but, on ship or aerial surveys, double-observer data can be collected and used to correct, or partially correct, for animals missed on the transect line. Data on diving behavior can also be used to correct for animals that are unavailable because they are underwater. For some deep-diving cetaceans, and potentially other species, passive acoustic data collected from towed, static or drifting hydrophones can be used to estimate abundance. The abundance of baleen whale species that migrate close to land or ice can be estimated from land-based counts.
For species of cetaceans or pinnipeds in which individuals are naturally marked or can be physically tagged, mark-recapture analysis of photo-identification or tag data can be used to estimate the number of animals using the study area. These studies require multiple sampling occasions and typically take longer than line transect surveys. Clearly, they are not appropriate for species that do not possess useable natural markings or cannot be tagged.
Whilst these are the most commonly used methods, there is no simple formula to follow to decide on the most suitable way to estimate marine mammal abundance. When choosing an appropriate method and how to implement it, key issues include: defining the population to be estimated, consideration of candidate methods based on strengths and weaknesses in relation to a range of logistical and practical issues, being aware of the resources required to collect and analyze the data, and understanding the assumptions made, the violation of which may lead to bias.
Estimating the abundance of marine mammal populations can be logistically, financially, and technically challenging but the information is essential to inform assessments of conservation status. The challenge is ongoing because population size changes and assessments need to be updated periodically. Regarding bycatch assessment, although methods are available to assess bycatch without estimates of abundance, they depend on the availability of fairly accurate bycatch mortality estimates and are sensitive to uncertainties (Punt et al., 2021). Information on abundance is thus a key requirement of bycatch assessments (Wade et al., In review, Frontiers in Marine Science) (see text footnote 3), which also need to be updated regularly.
In some developed countries, there is legislation requiring regular assessment of conservation status, including assessment of the impact of human activities, such as fisheries bycatch. For example, the United States MMPA requires stock assessment reports to be reviewed at least every 3 years, and annually for stocks for which human-caused mortality exceeds PBR (Wade, 1998) or which are estimated to be declining. In Europe, the reporting cycle for assessments under the EU Habitats Directive and Marine Strategy Framework Directive is 6 years. The legislative imperative and the consequent availability of funding, means that information on marine mammal abundance in these countries tends to be quite good, with reasonable coverage spatially and temporally.
This is not the case in most developing countries, where estimates of marine mammal abundance are typically generated at a small scale by individuals who are often linked to Non-Governmental Organisations, as evidenced by some of the example studies referred to in this paper. A challenge for the future is thus to facilitate an expansion of resources in these countries to enable estimates of abundance of more marine mammal populations to become available to inform conservation assessments. This paper aims to help expand one resource – the expertise base of researchers with the skills to conduct studies to estimate marine mammal abundance.
Author Contributions
PH, TF, and AP developed the initial manuscript idea. PH led the writing of the manuscript. All authors contributed to the conceptual framework, outline of the manuscript, writing and editing, and gave final approval for publication.
Funding
Support for this project was provided by the Lenfest Ocean Program.
Conflict of Interest
RR is employed by Okapi Wildlife Associates Reg’d.
The remaining authors declare that the research was conducted in the absence of any commercial or financial relationships that could be construed as a potential conflict of interest.
Publisher’s Note
All claims expressed in this article are solely those of the authors and do not necessarily represent those of their affiliated organizations, or those of the publisher, the editors and the reviewers. Any product that may be evaluated in this article, or claim that may be made by its manufacturer, is not guaranteed or endorsed by the publisher.
Acknowledgments
We thank Jay Barlow (NOAA SWFSC) and two reviewers for their comments on an earlier version of the manuscript. The views expressed are those of the authors and do not necessarily reflect the views of the Lenfest Ocean Program or the Pew Charitable Trusts.
Footnotes
- ^ https://www.iucnredlist.org/
- ^ https://www.federalregister.gov/documents/2016/08/15/2016-19158/fish-andfish-product-import-provisions-of-the-marine-mammal-protection-act
- ^ Wade, P. R., Long, K. J., Francis, T. B., Punt, A. E.,Hammond, P. S., Heinemann, D., et al. (in review). Best practices for assessing and managing bycatch of marine mammals. Front. Mar. Sci.
- ^ Moore, J. E., Heinemann, D., Francis, T. B., Hammond, P. S., Long, K. J., Punt, A. E., et al. (in review). Estimating bycatch mortality for marine mammal stock assessment: concepts and best practices. Front. Mar. Sci.
- ^ https://archive.iwc.int/pages/view.php?ref=3606&k=
- ^ https://msiple.shinyapps.io/mammaltool/
- ^ https://reijns.com/i3s/
- ^ https://www.wildbook.org/doku.php
- ^ https://happywhale.com/home
- ^ https://www.norwegianorca-id.no/
- ^ http://www.phidot.org/software/mark/
- ^ http://distancesampling.org/
References
Adame, K., Pardo, M. A., Beier, E., and Elorriaga-Pardo, F. (2017). Detectability and categorization of California sea lions using an unmanned aerial vehicle. Mar. Mamm. Sci. 33, 913–925. doi: 10.1111/mms.12403
Amstrup, C. S., McDonald, T. L., and Manly, B. F. J. (2005). Handbook of Capture-Recapture Analysis. Princeton, NJ: Princeton University Press.
Angliss, R. P., Ferguson, M. C., Hall, P., Helker, V., Kennedy, A., and Sformo, T. (2018). Comparing manned to unmanned aerial surveys for cetacean monitoring in the Arctic: methods and operational results. J. Unmanned Veh. Syst. 6, 109–127. doi: 10.1139/juvs-2018-0001
Aniceto, A. S., Biuw, M., Lindstrøm, U., Solbø, S. A., Broms, F., and Carroll, J. (2018). Monitoring marine mammals using unmanned aerial vehicles: quantifying detection certainty. Ecosphere 9:e02122. doi: 10.1002/ecs2.2122
Arso Civil, M., Quick, N., Cheney, B., Islas-Villanueva, V., Graves, J. A., Janik, V., et al. (2019a). Variations in age- and sex-specific survival rates could explain population trend in a discrete marine mammal population. Ecol. Evol. 9, 533–544. doi: 10.1002/ece3.4772
Arso Civil, M., Quick, N. J., Cheney, B., Pirotta, E., Thompson, P. M., and Hammond, P. S. (2019b). Changing distribution of the east coast of Scotland bottlenose dolphin population and the challenges of area-based management. Aquat. Conserv. Mar. Freshw. Ecosyst. 29, 178–196. doi: 10.1002/aqc.3102
Avila, I. C., Kaschner, K., and Dormann, C. F. (2018). Current global risks to marine mammals: taking stock of the threats. Biol. Conserv. 221, 44–58. doi: 10.1016/j.biocon.2018.02.021
Baker, J. D., Harting, A. L., Johanos, T. C., and Littnan, C. L. (2016). Estimating Hawaiian monk seal range-wide abundance and associated uncertainty. Endang. Species Res. 31, 317–324. doi: 10.3354/esr00782
Balmer, B. C., Wells, R. S., Nowacek, S. M., Nowacek, D. P., Schwacke, L. H., McLellan, W. A., et al. (2008). Seasonal abundance and distribution patterns of common bottlenose dolphins (Tursiops truncatus) near St. Joseph Bay, Florida, USA. J. Cetacean Res. Manage. 10, 157–167.
Barlow, J. (2015). Inferring trackline detection probabilities, g(0), for cetaceans from apparent densities in different survey conditions. Mar. Mamm. Sci. 31, 923–943. doi: 10.1111/mms.12205
Barlow, J., Calambokidis, J., Falcone, E. A., Baker, C. S., Burdin, A. M., Clapham, P. J., et al. (2011). Humpback whale abundance in the North Pacific estimated by photographic capture−recapture with bias correction from simulation studies. Mar. Mamm. Sci. 27, 793–818. doi: 10.1111/j.1748-7692.2010.00444.x
Barlow, J., and Forney, K. A. (2007). Abundance and population density of cetaceans in the California current ecosystem. Fish. Bull. U.S. 105, 509–526.
Barlow, J., Fregosi, S., Thomas, L., Harris, D., and Griffiths, E. T. (2021a). Acoustic detection range and population density of Cuvier’s beaked whales estimated from near-surface hydrophones. J. Acoust. Soc. Am. 149, 111–125. doi: 10.1121/10.0002881
Barlow, J., Trickey, J. S., Schorr, G. S., Rankin, S., and Moore, J. E. (2021b). Recommended snapshot length for acoustic point-transect surveys of intermittently available Cuvier’s beaked whales. J. Acoust. Soc. Am. 149, 3830–3840. doi: 10.1121/10.0005108
Barlow, J., Moore, J. E., McCullough, J. L. K., and Griffiths, E. T. (2021c). Acoustic-based estimates of Cuvier’s beaked whale (Ziphius cavirostris) density and abundance along the US West Coast from drifting hydrophone recorders. Mar. Mamm. Sci.
Barlow, J., and Taylor, B. L. (2005). Estimates of sperm whale abundance in the northeastern temperate Pacific from a combine acoustic and visual survey. Mar. Mamm. Sci. 21, 429–445. doi: 10.1111/j.1748-7692.2005.tb01242.x
Becker, E., Forney, K. A., Miller, D. L., Fiedler, P. C., Barlow, J., and Moore, J. E. (2020). Habitat-based Density Estimates for Cetaceans in the California Current Ecosystem based on 1991-2018 Survey Data. NOAA Technical Memorandum NMFS-SWFSC-638. Available online at: https://swfsc-publications.fisheries.noaa.gov/publications/CR/2020/2020Becker1.pdf (accessed September 10, 2021).
Begon, M., Harper, J. L., and Townsend, C. R. (1996). Ecology: Individuals, Populations and Communities, 3rd Edn. Oxford: Blackwell Science.
Bengtson, J. L., Hiruki-Raring, L. M., Simpkins, M. A., and Boveng, P. L. (2005). Ringed and bearded seal densities in the eastern Chukchi Sea, 1999–2000. Pol. Biol. 28, 833–845.
Bigg, M. (1982). An assessment of killer whale (Orcinus orca) stocks off Vancouver Island, British Columbia. Rep. Int. Whal. Commn. 32, 655–666.
Bogucki, R., Cygan, M., Khan, C. B., Klimek, M., Milczek, J. K., and Mucha, M. (2019). Applying deep learning to right whale photo identification. Conserv. Biol. 33, 676–684. doi: 10.1111/cobi.13226
Borchers, D. L., Nightingale, P., Stevenson, B. C., and Fewster, R. M. (2020). A latent capture history model for digital aerial surveys. Biometrics 2020, 1–12. doi: 10.1111/biom.13403
Borchers, D. L., Pike, D. G., Gunnlaugsson, T., and Víkingsson, G. A. (2009). Minke whale abundance estimation from the NASS 1987 and 2001 aerial cue–counting surveys taking appropriate account of distance estimation errors. NAMMCO Sci. Publ. 7, 95–110. doi: 10.7557/3.2708
Bortolotto, G. A., Danilewicz, D., Andriolo, A., Secchi, E. R., and Zerbini, A. N. (2016). Whale, whale, everywhere: increasing abundance of western South Atlantic humpback whales (Megaptera novaeangliae) in their wintering grounds. PLoS One 11:e0164596. doi: 10.1371/journal.pone.0164596
Bouchet, P. J., Miller, D. L., Roberts, J. J., Mannocci, L., Harris, C. M., and Thomas, L. (2020). dsmextra: extrapolation assessment tools for density surface models. Methods Ecol. Evol. 11, 1464–1469. doi: 10.1111/2041-210X.13469
Boyd, C., Hobbs, R. C., Punt, A. E., Shelden, K. E. W., Sims, C. L., and Wade, P. R. (2019). Bayesian estimation of group sizes for a coastal cetacean using aerial survey data. Mar. Mamm. Sci. 35, 1322–1346. doi: 10.1111/mms.12592
Boyd, C., and Punt, A. E. (2021). Shifting trends: detecting changes in cetacean population dynamics in shifting habitat. PLoS One 16:e0251522. doi: 10.1371/journal.pone.0251522
Boyd, I. L. (1993). Pup production and distribution of breeding Antarctic fur seals (Arctocephalus gazella) at South Georgia. Antarct. Sci. 5, 17–24. doi: 10.1017/S0954102093000045
Branch, T. A. (2007). Abundance of Antarctic blue whales south of 60°S from three complete circumpolar sets of surveys. J. Cetacean Res. Manage. 9, 253–262.
Branch, T. A. (2011). Humpback abundance south of 60°S from three complete circumpolar sets of surveys. J. Cetacean Res. Manage. 3, 53–69.
Branch, T. A., and Butterworth, D. S. (2001). Southern hemisphere minke whales: standardised abundance estimates from the 1978/79 to 1997/98 IDCR-SOWER surveys. J. Cetacean Res. Manage. 3, 143–174.
Brasseur, S. M. J. M., Reijnders, P. J. H., Cremer, J., Meesters, E., Kirkwood, R., Jensen, L. F., et al. (2018). Echoes from the past: regional variations in recovery within a harbour seal population. PLoS One 13:e0189674. doi: 10.1371/journal.pone.0189674
Braulik, G., Bhatti, Z. I., Ehsan, T., Hussain, B., Khan, A. R., Khan, A., et al. (2012). Robust abundance estimate for endangered river dolphin subspecies in South Asia. Endang. Spec. Res. 17, 201–215. doi: 10.3354/esr00425
Bravington, M. V., Skaug, H. J., and Anderson, E. C. (2016). Close-kin mark-recapture. Statist. Sci. 31, 259–274. doi: 10.1214/16-STS552
Brediñana-Romano, L., Viddi, F. A., Torres-Florez, J. P., Ruiz, J., Nery, M. F., Haro, D., et al. (2014). At-sea abundance and spatial distribution of South American sea lion (Otaria byronia) in Chilean Northern Patagonia: how many are there? Mamm. Biol. 79, 384–392. doi: 10.1016/j.mambio.2014.07.002
Brown, S. G. (1978). “Whale marking techniques,” in Animal Marking, ed. B. Stonehouse (London: Palgrave), 71–80. doi: 10.1007/978-1-349-03711-7_8
Brusa, J. L., Rotella, J. J., Garrott, R. A., Paterson, J. T., and Link, W. A. (2020). Variation of annual apparent survival and detection rates with age, year and individual identity in male Weddell seals (Leptonychotes weddellii) from long−term mark−recapture data. Popul. Ecol. 62, 134–150. doi: 10.1002/1438-390X.12036
Buckland, S. T., Anderson, D. R., Burnham, K. P., Laake, J. L., Borchers, D. L., and Thomas, L. (2001). Introduction to Distance Sampling: Estimating Abundance of Biological Populations. Oxford: Oxford University Press.
Buckland, S. T., Burt, M. L., Rexstad, E. A., Mellor, M., Williams, A. E., and Woodward, R. (2012). Aerial surveys of seabirds: the advent of digital methods. J. Appl. Ecol. 49, 960–967. doi: 10.2307/23259202
Buckland, S. T., Rexstad, E. A., Marques, T. S., and Oedekoven, C. S. (2015). Distance Sampling: Methods and Applications. New York, NY: Springer International Publishing.
Buckland, S. T., and York, A. E. (2018). “Abundance estimation,” in Encyclopedia of Marine Mammals, 3rd Edn, eds B. Würsig, J. G. M. Thewissen, and K. Kovacs (San Diego, CA: Academic Press), 1–6.
Burt, M. L., Borchers, D. L., Jenkins, K. J., and Marques, T. A. (2014). Using mark-recapture distance sampling methods on line transect surveys. Methods Ecol. Evol. 5, 1180–1191. doi: 10.1111/j.1365-2664.2012.02150.x
Butterworth, D. S., Punt, A. E., Oosthuizen, W. H., and Wickens, P. A. (1995). The effects of future consumption by the Cape fur seal on catches and catch rates of the Cape hakes. 3. Modelling the dynamics of the Cape fur seal population. S. Afr. J. Mar. Sci. 16, 161–183. doi: 10.2989/025776195784156511
Calambokidis, J., and Barlow, J. (2004). Abundance of blue and humpback whales in the eastern North Pacific estimated by capture-recapture and line-transect methods. Mar. Mamm. Sci. 20, 63–85. doi: 10.1111/j.1748-7692.2004.tb01141.x
Campbell, G. S., Thomas, L., Whitaker, K., Douglas, A. B., Calambokidis, J., and Hildebrand, J. A. (2015). Inter-annual and seasonal trends in cetacean distribution, density and abundance off southern California. Deep Sea Res. II 112, 143–157. doi: 10.1016/j.dsr2.2014.10.008
Cañadas, A., Desportes, G., and Borchers, D. (2004). The estimation of the detection function and g(0) for short-beaked common dolphins (Delphinus delphis), using double platform data collected during the NASS-95 Faroese survey. J. Cetacean Res. Manage. 6, 191–198.
Cañadas, A., and Hammond, P. S. (2006). Model-based abundance estimates for bottlenose dolphins off southern Spain: implications for conservation and management. J. Cetacean Res. Manage. 8, 13–27.
Cañadas, A., and Hammond, P. S. (2008). Abundance and habitat preferences of the short-beaked common dolphin (Delphinus delphis) in the South-western Mediterranean: implications for conservation. Endang. Species Res. 4, 309–331. doi: 10.3354/esr00073
Cardinale, B., Primack, R., and Murdoch, J. (2019). Conservation Biology. Oxford: Oxford University Press, 584.
Chan, S. C. Y., and Karczmarski, L. (2017). Indo-Pacific humpback dolphins (Sousa chinensis) in Hong Kong: modelling demographic parameters with mark-recapture techniques. PLoS One 12:e0174029. doi: 10.1371/journal.pone.0174029
Cheeseman, T., Southerland, K., Park, J., Olio, M., Flynn, K., Calambokidis, J., et al. (in press). “Advanced image recognition: a fully automated, high accuracy photo-identification matching system for humpback whales,” in Individual Identification and Photographic Techniques in Mammalian Ecological and Behavioural Research: Methods, Applications and Concepts. Mamm. Biol., eds L. Karczmarski, S. C. Y. Chan, D. I. ubenstein, S. Y. S. Chui, and E. Z. Cameron.
Cole, L. C. (1957). Sketches of general and comparative demography. Cold Springs Harb. Symp. Quant. Biol. 22, 1–15. doi: 10.1101/sqb.1957.022.01.004
Constantine, R., Jackson, J. A., Steel, D., Baker, C. S., Brooks, L., Burns, D., et al. (2012). Abundance of humpback whales in Oceania using photo−identification and microsatellite genotyping. Mar. Ecol. Prog. Ser. 453, 249–261. doi: 10.3354/meps09613
Cooch, E. G., and White, G. C. (2019). Program MARK – A Gentle Introduction, 19th Edn. Available online at: http://www.phidot.org/software/mark/docs/book/ (accessed September 10, 2021).
Cooke, J. G., Weller, D. W., Bradford, A. L., Burdin, A. M., and Brownell, R. L. Jr. (2005). “Estimates and projections of the western gray whale population using an individually-based population model,” in Paper Presented at the Scientific Committee of the International Whaling Commission SC/57/BRG22, Ulsan.
Cordes, L. S., and Thompson, P. M. (2015). Mark-resight estimates of seasonal variation in harbor seal abundance and site fidelity. Popul. Ecol. 57, 467–472. doi: 10.1007/s10144-015-0496-z
Crespo, E. A., Pedraza, S. N., Grandi, M. F., Dans, S. L., and Garaffo, G. V. (2010). Abundance and distribution of endangered franciscana dolphins in Argentine waters and conservation implication. Mar. Mamm. Sci. 26, 17–35. doi: 10.1111/j.1748-7692.2009.00313.x
Curtis, K. A., Falcone, E. A., Schorr, G. S., Moore, J. E., Moretti, D. J., Barlow, J., et al. (2021). Abundance, survival, and annual rate of change of Cuvier’s beaked whales (Ziphius cavirostris) on a Navy sonar range. Mar. Mamm. Sci. 37, 399-419. doi: 10.1111/mms.12747
Danilewicz, D., Moreno, I. B., Ott, P. H., Tavares, M., Azevedo, A. M., Secchi, E., et al. (2010). Abundance estimation for a threatened population of franciscana dolphins in southern Brazil: uncertainties and conservation considerations. J. Mar. Biol. Assoc. U.K. 90, 1649–1657. doi: 10.1017/S0025315409991482
Dawson, S., Wade, P. R., Slooten, E., and Barlow, J. (2008). Design and field methods for cetacean surveys in coastal and riverine habitats. Mamm. Rev. 38, 19–49. doi: 10.1111/j.1365-2907.2008.00119.x
Doi, T. (1974). “Further development of whale sighting theory. Chapter 16,” in The Whale Problem, ed. W. E. Schevill (Cambridge, MA: Harvard University Press), 359–368.
Doniol-Valcroze, T., Gosselin, J.-F., Pike, D. G., Lawson, J. W., Asselin, N. C., Hedges, K., et al. (2020). Narwhal abundance in the eastern Canadian High Arctic in 2013. NAMMCO Sci. Publ. 11, 1–26. doi: 10.7557/3.5100
Durban, J., Ellifrit, D., Dahlheim, M., Waite, J., Matkin, C., Barrett-Lennard, L., et al. (2010). Photographic mark-recapture analysis of clustered mammal-eating killer whales around the Aleutian Islands and Gulf of Alaska. Mar. Biol. 150, 1033–1045. doi: 10.1007/s00227-010-1432-6
European Union (2017). Regulation (EU) 2017/1004 of the European Parliament and of the Council of 17 May 2017 on the Establishment of a Union Framework for the Collection, Management and Use of Data in the Fisheries Sector and Support for Scientific Advice Regarding the Common Fisheries Policy and Repealing Council Regulation (EC) No 199/2008. Available online at: https://eur-lex.europa.eu/legal-content/EN/TXT/?uri=CELEX%3A32017R1004 (accessed September 10, 2021).
Felix, F., Castro, C., Laake, J. L., Haase, B., and Schiedat, M. (2011). Abundance and survival estimates of the southeastern Pacific humpback whale stock from 1991–2006 photo-identification surveys in Ecuador. J. Cetacean Res. Manage. 3, 301–307.
Ferguson, M. C., Angliss, R. P., Kennedy, A., Lynch, B., Willoughby, A., Helker, V., et al. (2018). Performance of manned and unmanned aerial surveys to collect visual data and imagery for estimating Arctic cetacean density and associated uncertainty. J. Unmanned Veh. Syst. 6, 128–154. doi: 10.1139/juvs-2018-0002
Findlay, K. P., Cockcroft, V. G., and Guissamulo, A. T. (2011). Dugong abundance and distribution in the Bazaruto Archipelago, Mozambique. Afr. J. Mar. Sci. 33, 441–452. doi: 10.2989/1814232X.2011.637347
Forcada, J., and Aguilar, A. (2000). Use of photographic identification in capture-recapture studies of Mediterranean monk seals. Mar. Mamm. Sci. 16, 767–793. doi: 10.1111/j.1748-7692.2000.tb00971.x
Forcada, J., and Robinson, S. L. (2006). Population abundance, structure and turnover estimates for leopard seals during winter dispersal combining tagging and photo-identification data. Pol. Biol. 29, 1052–1062. doi: 10.1007/s00300-006-0149-y
Forney, K. A., Moore, J. E., Barlow, J., Carretta, J. V., and Benson, S. R. (2021). A multidecadal Bayesian trend analysis of harbor porpoise (Phocoena phocoena) populations off California relative to past fishery bycatch. Mar. Mamm. Sci. 37, 546–560. doi: 10.1111/mms.12764
Friday, N. A., Zerbini, A. N., Waite, J. M., Moore, S. E., and Clapham, P. J. (2013). Cetacean distribution and abundance in relation to oceanographic domains on the eastern Bering Sea shelf, June and July of 2002, 2008, and 2010. Deep Sea Res. II 94, 244–256. doi: 10.1016/j.dsr2.2013.03.011
Frie, A. K., Stenson, G. B., and Haug, T. (2012). Long-term trends in reproductive and demographic parameters of female Northwest Atlantic hooded seals (Cystophora cristata): population responses to ecosystem change? Can. J. Zool. 90, 376–392. doi: 10.1139/z11-140
Galatius, A., Teilmann, J., Dähne, M., Ahola, M., Westphal, L., Kyhn, L. A., et al. (2020). Extrapolating cetacean densities to quantitatively assess human impacts on populations in the high seas. Wildl. Biol. 2020:wlb.00711. doi: 10.2981/wlb.00711
Galletti Vernazzani, B., Jackson, J. A., Cabrera, E., Carlson, C. A., and Brownell, R. L. Jr. (2017). Estimates of abundance and trend of Chilean blue whales off Isla de Chiloé, Chile. PLoS One 12:e0168646. doi: 10.1371/journal.pone.0168646
García-Aguilar, M., and Morales-Bojórquez, E. (2005). Estimating the haul-out population size of a colony of northern elephant seals Mirounga angustirostris in Mexico, based on mark-recapture data. Mar. Ecol. Prog. Ser. 297, 297–302. doi: 10.3354/meps297297
George, J. C., Zeh, J., Suydam, R., and Clark, C. (2004). Abundance and population trend (1978-2001) of western Arctic bowhead whales surveyed near Barrow, Alaska. Mar. Mamm. Sci. 20, 755–773. doi: 10.1111/j.1748-7692.2004.tb01191.x
Gerondeau, M., Barbraud, C., Ridoux, V., and Vincent, C. (2007). Abundance estimate and seasonal patterns of grey seal (Halichoerus grypus) occurrence in Brittany, France, as assessed by photo-identification and capture-mark-recapture. J. Mar. Biol. Assoc. U.K. 87, 365–372. doi: 10.1017/S0025315407054586
Gerrodette, T., Perryman, W. L., and Oedekoven, C. S. (2019). Accuracy and precision of dolphin group size estimates. Mar. Mamm. Sci. 35, 22–39. doi: 10.1111/mms.12506
Gilles, A., Gunnlaugsson, T., Mikkelsen, B., Pike, D. G., and Víkingsson, G. (2020). Summer abundance of harbour porpoises (Phocoena phocoena) in the coastal waters of Iceland and the Faroe Islands. NAMMCO Sci. Publ. 11, 1–9. doi: 10.7557/3.4939
Gilles, A., Viquerat, S., Becker, E. A., Forney, K. A., Geelhoed, S. C. V., Haelters, J., et al. (2016). Seasonal habitat-based density models for a marine top predator, the harbor porpoise, in a dynamic environment. Ecosphere 7:e01367. doi: 10.1002/ecs2.1367
Givens, G. H., Edmondson, S. L., George, J. C., Suydam, R., Charif, R. A., Rahamand, A., et al. (2016). Horvitz–Thompson whale abundance estimation adjusting for uncertain recapture, temporal availability variation, and intermittent effort. Environmetrics 27, 134–146. doi: 10.1002/env.2379
Goebel, M. E., Perryman, W. L., Hinke, J. T., Krause, D. J., Hann, N. A., Gardner, S., et al. (2015). A small unmanned aerial system for estimating abundance and size of Antarctic predators. Pol. Biol. 38, 619–630. doi: 10.1007/s00300-014-1625-4
Gomez-Salazar, C., Trujillo, F., Portocarrero-Aya, M., and Whitehead, H. (2012). Population, density estimates, and conservation of river dolphins (Inia and Sotalia) in the Amazon and Orinoco river basins. Mar. Mamm. Sci. 28, 124–153. doi: 10.1111/j.1748-7692.2011.00468.x
Gordon, J. (2001). Measuring the range to animals at sea from boats using photographic and video images. J. Appl. Ecol. 38, 879–887. doi: 10.1046/j.1365-2664.2001.00615.x
Gosselin, J.-F., Hammill, M. O., Mosnier, A., and Lesage, V. (2017). Abundance Index of St. Lawrence Estuary Beluga, Delphinapterus leucas, from Aerial Visual Surveys Flown in August 2014 and an Update on Reported Deaths. DFO Canadian Science Advisory Secretariat Research Document 2017/019. Available online at: http://www.dfo-mpo.gc.ca/csas-sccs/
Greig, D. J., Gulland, F. M. D., Harvey, J. T., Lonergan, M., and Hall, A. J. (2019). Harbor seal pup dispersal and individual morphology, hematology, and contaminant factors affecting survival. Mar. Mamm. Sci. 35, 187–209. doi: 10.1111/mms.12541
Guinet, C., Jouventin, P., and Georges, J.-Y. (1994). Long term population changes of fur seals Arctocephalus gazela and Arctocephalus tropicalis on subantarctic (Crozet) and subtropical (St. Paul and Amsterdam) islands and their possible relationship to El Nifio Southern Oscillation. Antarct. Sci. 6, 473–478. doi: 10.1017/S0954102094000714
Guzman, H. M., and Condit, R. (2017). Abundance of manatees in Panama estimated from side-scan sonar. Wildl. Soc. Bull. 41, 556–565. doi: 10.1002/wsb.793
Hagihara, R., Cleguer, C., Preston, S., Sobtzick, S., Hamann, M., Shimada, T., et al. (2016). Improving the Estimates of Abundance of Dugongs and Large Immature and Adult-Sized Green Turtles in Western and Central Torres Strait. Report to the National Environmental Science Programme. Cairns, QLD: Reef and Rainforest Research Centre Limited, 53.
Hammond, P. S. (1986). Estimating the size of naturally marked whale populations using capture-recapture techniques. Rep. Int. Whal. Commn. (Special Issue 8), 253–282.
Hammond, P. S. (2010). “Estimating the abundance of marine mammals,” in Marine Mammal Ecology and Conservation: A Handbook of Techniques, eds I. L. Boyd, W. D. Bowen, and S. Iverson (New York, NY: Oxford University Press), 42–67.
Hammond, P. S. (2018). “Mark-recapture,” in Encyclopedia of Marine Mammals, 3rd Edn, eds B. Würsig, J. G. M. Thewissen, and K. Kovacs (San Diego, CA: Academic Press), 580–584.
Hammond, P. S., Berggren, P., Benke, H., Borchers, D. L., Collet, A., Heide-Jørgensen, M. P., et al. (2002). Abundance of harbour porpoises and other cetaceans in the North Sea and adjacent waters. J. Appl. Ecol. 39, 361–376. doi: 10.1046/j.1365-2664.2002.00713.x
Hammond, P. S., Macleod, K., Berggren, P., Borchers, D. L., Burt, M. L., Cañadas, A., et al. (2013). Cetacean abundance and distribution in European Atlantic shelf waters to inform conservation and management. Biol. Conserv. 164, 107–122. doi: 10.1016/j.biocon.2013.04.010
Hammond, P. S., Mizroch, S. A., and Donovan, G. P. (1990). Individual Recognition of Cetaceans: Use of Photo-Identification and Other Techniques to Estimate Population Parameters. Rep. Int. Whal. Commn (Special Issue 12). Cambridge: International Whaling Commission, 440.
Hamner, R. M., Wade, P. R., Oremus, M., Stanley, M., Brown, P., Constantine, R., et al. (2014). Critically low abundance and limits to human-related mortality for the Maui’s dolphin. Endang. Species Res. 26, 87–92. doi: 10.3354/esr00621
Hansen, R. G., Boye, T. K., Larsen, R. S., Nielsen, N. H., Tervo, O., Nielsen, R. D., et al. (2018). Abundance of whales in West and East Greenland in summer 2015. NAMMCO Sci. Publ. 11, 1–17. doi: 10.7557/3.4689
Hansen, R. G., Pike, D., Thorgilsson, B., Gunnlaugsson, T., and Lawson, J. (2020). The geometer: a new device for recording angles in visual surveys. NAMMCO Sci. Publ. 11, 1–9. doi: 10.7557/3.5585
Hauksson, E. (2007). Abundance of grey seals in Icelandic waters, based on trends of pup-counts from aerial surveys. NAMMCO Sci. Publ. 6, 85–97. doi: 10.7557/3.2725
Heide-Jørgensen, M. P., and Laidre, K. L. (2015). Surfacing time, availability bias and abundance of humpback whales in West Greenland. J. Cetacean Res. Manage. 15, 1–8.
Hiby, A. R., and Hammond, P. S. (1989). Survey techniques for estimating abundance of cetaceans. Rep. Int. Whal. Commn. (Special Issue 11), 47–80.
Hiby, L. (1999). “The objective identification of duplicate sightings in aerial survey for porpoise,” in Marine Mammal Survey and Assessment Methods, eds G. W. Garner, S. C. Armstrup, J. L. Laake, B. F. J. Manly, L. L. McDonald, and D. G. Robertson (Rotterdam: Balkema), 179–189.
Hiby, L., and Lovell, P. (1990). Computer-aided matching of natural markings: a prototype system for grey seals. Rep. Int. Whal. Commn. (Special Issue 12), 57–61.
Hodgson, A., Kelly, N., and Peel, D. (2013). Unmanned aerial vehicles (UAVs) for surveying marine fauna: a dugong case study. PLoS One 8:e79556. doi: 10.1371/journal.pone.0079556
Hostetler, J. A., Edwards, H. H., Martin, J., and Schueller, P. (2018). Updated Statewide Abundance Estimates for the Florida Manatee. Florida Fish and Wildlife Conservation Commission, Fish and Wildlife Research Institute Technical Report No. 23. Available online at: https://f50006a.eos-intl.net/ELIBSQL12_F50006A_Documents/TR23-18Hostetler-USAEF.pdf (accessed September 10, 2021).
ICES (2014). General Advice on OSPAR Request on Implementation of MSFD for Marine Mammals. ICES Advice 2014, Book 1: 1.6.6.1. Available online at: https://www.ices.dk/sites/pub/Publication%20Reports/Forms/DispForm.aspx?ID=28807 (accessed September 10, 2021).
IUCN (2021). Glossary of Definitions. Available online at: https://www.iucn.org/sites/dev/files/iucn-glossary-of-definitions_en_2021.05.pdf (accessed May 3, 2021).
IWC (2012). Requirements and guidelines for conducting surveys and analysing data within the revised management scheme. J. Cetacean Res. Manage. 13(Suppl.), 509–517.
IWC (2020). Scientific committee procedures for submission, review and validation of abundance estimates. J. Cetacean Res. Manage. 21(Suppl.), 273–726.
Jefferson, T. A., and Moore, J. E. (2020). Abundance and trends of Indo-Pacific finless porpoises (Neophocaena phocaenoides) in Hong Kong waters, 1996-2019. Front. Mar. Sci. 7:574381. doi: 10.3389/fmars.2020.574381
Jessopp, M. J., Forcada, J., Reid, K., Trathan, P. N., and Murphy, E. J. (2004). Winter dispersal of leopard seals (Hydrurga leptonyx): environmental factors influencing demographics and seasonal abundance. J. Zool. 263, 251–258. doi: 10.1017/S0952836904005102
Jewell, R., Thomas, L., Harris, C. M., Kaschner, K., Wiff, R., Hammond, P. S., et al. (2012). Global analysis of cetacean line-transect surveys: detecting trends in cetacean density. Mar. Ecol. Prog. Ser. 453, 227–240. doi: 10.3354/meps09636
Johnston, D. W. (2019). Unoccupied aircraft systems in marine science and conservation. Ann. Rev. Mar. Sci. 11, 439–463. doi: 10.1146/annurev-marine-010318-095323
Jones, G. P., Pearlstine, L. G., and Percival, H. F. (2006). An assessment of small unmanned aerial vehicles for wildlife research. Wildl. Soc. Bull. 34, 750–758.
Keating, J. L., Barlow, J., Griffiths, E. T., and Moore, J. E. (2018). Passive Acoustics Survey of Cetacean abundance Levels (PASCAL-2016). Final Report. Honolulu, HI: US Department of the Interior, Bureau of Ocean Energy Management. OCS Study BOEM 2018-025.
Koivuniemi, M., Auttila, M., Niemi, M., Levänen, R., and Kunnasranta, M. (2016). Photo-ID as a tool for studying and monitoring the endangered Saimaa ringed seal. Endang. Species Res. 30, 29–36. doi: 10.3354/esr00723
Koivuniemi, M., Kurkilahti, M., Niemi, M., Auttila, M., and Kunnasranta, M. (2019). A mark-recapture approach for estimating population size of the endangered ringed seal (Phoca hispida saimensis). PLoS One 14:e0214269. doi: 10.1371/journal.pone.0214269
Krebs, C. J. (1972). Ecology: The Experimental Analysis of Distribution and Abundance. Harper International Edition. New York, NY: Harper & Row.
Kuit, S. H., Ponnampalam, L. S., Hammond, P. S., Chong, V. C., and Then, A. Y.-H. (2021). Abundance estimates of three cetacean species in the coastal waters of Matang, Perak, Peninsular Malaysia. Aquat. Conserv. Mar. Freshw. Ecosyst. 2021, 1–13. doi: 10.1002/aqc.3699
Kuningas, S., Similä, T., and Hammond, P. S. (2014). Population size, survival and reproductive rates of northern Norwegian killer whales (Orcinus orca) in 1986-2003. J. Mar. Biol. Assoc. U.K. 94, 1277–1291. doi: 10.1017/S0025315413000933
Laake, J., Borchers, D., Thomas, L., Miller, D., and Bishop, J. (2020). Mark-Recapture Distance Sampling. Available online at: https://cran.r-project.org/web/packages/mrds/mrds.pdf (accessed September 10, 2021).
Laake, J. L. (2013). RMark: An R Interface for Analysis of Capture-Recapture Data with MARK. AFSC Processed Rep. 2013-01. Seattle WA 98115: Alaska Fish. Sci. Cent., NOAA, Natl. Mar. Fish. Serv., 25.
Laake, J. L., Calambokidis, J., Osmek, S. D., and Rugh, D. J. (1997). Probability of detecting harbour porpoise from aerial surveys: estimating g(0). J. Wildl. Manage. 61, 63–75. doi: 10.2307/3802415
Laake, J. L., Punt, A. E., Hobbs, R., Ferguson, M., Rugh, D., and Breiwick, J. (2012). Gray whale southbound migration surveys 1967-2006: an integrated re-analysis. J. Cetacean Res. Manage. 12, 287–306.
Leaper, R., Burt, L., Gillespie, D., and Macleod, K. (2010). Comparisons of measured and estimated distances and angles from sightings surveys. J. Cetacean Res. Manage. 11, 229–237.
Leaper, R., and Gordon, J. (2001). Application of photogrammetric methods for locating and tracking cetacean movements at sea. J. Cetacean Res. Manage. 3, 131–141.
Lennert-Cody, C. E., Buckland, S. T., Gerrodette, T., Webb, A., Barlow, J., Fretwell, P. T., et al. (2018). Review of potential line-transect methodologies for estimating abundance of dolphin stocks in the eastern tropical Pacific. J. Cetacean Res. Manage. 19, 9–21.
Lewis, T., Gillespie, D., Lacey, C., Matthews, J., Danbolt, M., Leaper, R., et al. (2007). Sperm whale abundance estimates from acoustic surveys of the Ionian Sea and Straits of Sicily in 2003. J. Mar. Biol. Assoc. U.K. 87, 353–357. doi: 10.1017/S0025315407054896
Lonergan, M., Duck, C. D., Thompson, D., Moss, S., and McConnell, B. (2011). British grey seal (Halichoerus grypus) abundance in 2008: an assessment based on aerial counts and satellite telemetry. ICES J. Mar. Sci. 68, 2201–2209. doi: 10.1093/icesjms/fsr161
Lowry, M. S. (1999). Counts of California sea lions (Zalophus californianus) pups from aerial color photographs and from the ground: a comparison of two methods. Mar. Mamm. Sci. 15, 143–158. doi: 10.1111/j.1748-7692.1999.tb00786.x
Lowry, M. S., Condit, R., Hatfield, B., Allen, S. G., Berger, R., Morris, P. A., et al. (2014). Abundance, distribution, and population growth of the northern elephant seal (Mirounga angustirostris) in the United States from 1991 to 2010. Aquat. Mamm. 40, 20–31. doi: 10.1578/AM.40.1.2014.20
MacKenzie, D. L., and Clement, D. M. (2014). Abundance and Distribution of ECSI Hector’s Dolphin. New Zealand Aquatic Environment and Biodiversity Report No. 123, 79. Available online at: https://healthyharbour.org.nz/wp-content/uploads/2019/05/MacKenzie-Clement-2014-Hectors-dolphin.pdf (accessed September 10, 2021).
Madon, B., Garrigue, C., Pradel, R., and Gimenez, O. (2013). Transience in the humpback whale population of New Caledonia and implications for abundance estimation. Mar. Mamm. Sci. 29, 669–678.
Madon, B., Gimenez, O., McArdle, B., Baker, C. S., and Garrigue, C. (2011). A new method for estimating animal abundance with two sources of data in capture-recapture studies. Methods Ecol. Evol. 2, 390–400. doi: 10.1111/j.2041-210X.2011.00091.x
Mannocci, L., Roberts, J. J., Miller, D. L., and Halpin, P. N. (2017). Extrapolating cetacean densities to quantitatively assess human impacts on populations in the high seas. Conserv. Biol. 31, 601–614. doi: 10.1111/cobi.12856
Marine Mammal Commission (2016). Development and Use of UASs by the National Marine Fisheries Service for Surveying Marine Mammals. Bethesda, MD: Marine Mammal Commission.
Marques, T. A., Thomas, L., Ward, J., DiMarzio, N., and Tyack, P. L. (2009). Estimating cetacean population density using fixed passive acoustic sensors: an example with Blainville’s beaked whales. J. Acoust. Soc. Am. 125, 1982–1994. doi: 10.1121/1.3089590
Marsh, H., and Sinclair, D. F. (1989). Correcting for visibility bias in strip transect aerial surveys of aquatic fauna. J. Wildl. Manage. 53, 1017–1024. doi: 10.2307/3809604
Martin, J., Edwards, H. H., Fonnesbeck, C. J., Koslovsky, S. M., Harmak, C. W., and Dane, T. W. (2015). Combining information for monitoring at large spatial scales: first statewide abundance estimate of the Florida manatee. Biol. Conserv. 186, 44–51. doi: 10.1016/j.biocon.2015.02.029
Martin, M. J., Gridley, T., Roux, J.-P., and Elwen, S. H. (2020). First abundance estimates of Heaviside’s (Cephalorhynchus heavisidii) and dusky (Lagenorhynchus obscurus) dolphins off Namibia using a novel visual and acoustic line transect survey. Front. Mar. Sci. 7:555659. doi: 10.3389/fmars.2020.555659
Martínez-Jauregui, M., Tavecchia, G., Cedenilla, M. A., Coulson, T., Fernández de Larrinoa, P., Muñoz, M., et al. (2012). Population resilience of the Mediterranean monk seal Monachus monachus at Cabo Blanco peninsula. Mar. Ecol. Prog. Ser. 461, 273–281. doi: 10.3354/meps09811
McClintock, B. T. (2015). multimark: an R package for analysis of capture-recapture data consisting of multiple “noninvasive” marks. Ecol. Evol. 5, 4920–4931. doi: 10.1002/ece3.1676
McClintock, B. T., Conn, P. B., Alonso, R. S., and Crooks, K. R. (2013). Integrated modelling of bilateral photo-identification data in mark-recapture analysis. Ecology 94, 1464–1471. doi: 10.1890/12-1613.1
McIntosh, R. R., Arthur, A. D., Dennis, T., Berris, M., Goldsworthy, S. D., Shaughnessy, P. D., et al. (2013). Survival estimates for the Australian sea lion: negative correlation of sea surface temperature with cohort survival to weaning. Mar. Mamm. Sci. 29, 84–108. doi: 10.1111/j.1748-7692.2011.00558.x
McIntosh, R. R., Holmberg, R., and Dann, P. (2018). Looking without landing – using remote piloted aircraft to monitor fur seal populations without disturbance. Front. Mar. Sci. 5:202. doi: 10.3389/fmars.2018.00202
McLaren, I. A. (1961). Methods of determining the numbers and availability of ring seals in the eastern Canadian Arctic. Arctic 14, 162–175. doi: 10.3389/fmars.2018.00202
Miller, D. L., Burt, M. L., Rexstad, E. A., and Thomas, L. (2013). Spatial models for distance sampling data: recent developments and future directions. Methods. Ecol. Evol. 4, 1001–1010. doi: 10.1111/2041-210X.12105
Miller, D. L., Rexstad, E., Thomas, L., Marshall, L., and Laake, J. L. (2019). Distance sampling in R. J. Stat. Soft. 89, 1–28. doi: 10.18637/jss.v089.i01
Minton, G., Peter, C., Poh, A. N. Z., Ngeian, J., Braulik, G., Hammond, P. S., et al. (2013). Population estimates and distribution patterns of Irrawaddy dolphins (Orcaella brevirostris) and Indo-Pacific finless porpoises (Neophocaena phocaenoides) in the Kuching Bay, Sarawak. Raffles Bull. Zool. 61, 877–888.
Mizroch, S. A., Beard, J. A., and Lynde, M. (1990). Computer-assisted photo-identification of humpback whales. Rep. Int. Whal. Commn. (Special Issue 12), 63–70.
Moore, J. E., and Barlow, J. (2011). Bayesian state-space model of fin whale abundance trends from a 1991-2008 time series of line-transect surveys in the California Current. J. Appl. Ecol. 48, 195–205. doi: 10.1111/j.1365-2664.2011.02018.x
Moore, J. E., and Barlow, J. P. (2013). Declining abundance of beaked whales (Family Ziphiidae) in the California current large marine ecosystem. PLoS One 8:e52770. doi: 10.1371/journal.pone.0052770
Moore, J. E., and Barlow, J. P. (2014). Improved abundance and trend estimates for sperm whales in the eastern North Pacific from Bayesian hierarchical modelling. Endang. Species Res. 25, 141–150. doi: 10.3354/esr00633
Moreland, E. E., Cameron, M. F., Angliss, R. P., and Boveng, P. L. (2015). Evaluation of a ship-based unoccupied aircraft system (UAS) for surveys of spotted and ribbon seals in the Bering Sea pack ice. J. Unmanned Aerial Syst. 3, 114–122. doi: 10.1139/juvs-2015-0012
Moxley, J. H., Bogomolni, A., Hammill, M. O., Moore, K. M. T., Polito, M. J., Sette, L., et al. (2017). Google haul out: earth observation imagery and digital aerial surveys in coastal wildlife management and abundance estimation. Bioscience 67, 760–768. doi: 10.1093/biosci/bix059
Nachtsheim, D. A., Viquerat, S., Ramírez-Martínez, N. C., Unger, B., Siebert, U., and Gilles, A. (2021). Small cetacean in a human high-use area: trends in harbor porpoise abundance in the North Sea over two decades. Front. Mar. Sci. 7:606609. doi: 10.3389/fmars.2020.606609
Noad, M. J., Dunlop, R. A., Paton, D., and Cato, D. H. (2011). Absolute and relative abundance estimates of Australian east coast humpback whales (Megaptera novaeangliae). J. Cetacean Res. Manage. (Special Issue 3), 243–252.
Olesiuk, P. F., Bigg, M. A., and Ellis, G. M. (1990). Life history and population dynamics of resident killer whales (Orcinus orca) in the coastal waters of British Columbia and Washington State. Rep. Int. Whal. Commn. 12, 209–243.
Pace, R. M., Corkeron, P. J., and Kraus, S. D. (2017). State-space mark-recapture estimates reveal a recent decline in abundance of North Atlantic right whales. Ecol. Evol. 7, 8730–8741. doi: 10.1002/ece3.3406
Palka, D. L., and Hammond, P. S. (2001). Accounting for responsive movement in line transect estimates of abundance. Can. J. Fish. Aquat. Sci. 58, 777–787. doi: 10.1139/cjfas-58-4-777
Palsbøll, P., Allen, J., Bérubé, M., Clapham, P. J., Feddersen, T. P., Hammond, P. S., et al. (1997). Genetic tagging of humpback whales. Nature 388, 767–769. doi: 10.1038/42005
Panigada, S., Lauriano, G., Donovan, G., Pierantonio, N., Cañadas, A., Vazquez, J. A., et al. (2017). Estimating cetacean density and abundance in the Central and Western Mediterranean Sea through aerial surveys: implications for management. Deep Sea Res. II 141, 41–58.
Paschoalini, M., Almeida, R. M., Trujillo, F., Melo-Santos, G., Marmontel, M., Pavanato, H. J., et al. (2020). On the brink of isolation: population estimates of the Araguaian river dolphin in a human-impacted region in Brazil. PLoS One 15:e0231224. doi: 10.1371/journal.pone.0231224
Pike, D. G., Gunnlaugsson, T., Mikkelsen, B., Halldórsson, S. D., and Víkingsson, G. (2019). Estimates of the abundance of cetaceans in the central North Atlantic based on the NASS Icelandic and Faroese shipboard surveys conducted in 2015. NAMMCO Sci. Publ. 11, 1–22. doi: 10.7557/3.4941
Pike, D. G., Gunnlaugsson, T., Sigurjónsson, J., and Víkingsson, G. (2020). Distribution and abundance of cetaceans in Icelandic waters over 30 years of aerial surveys. NAMMCO Sci. Publ 11, 1–22. doi: 10.7557/3.4805
Pitcher, K. W., Olesiuk, P. E., Brown, R. F., Lowry, M. S., Jefries, S. J., Sease, J. L., et al. (2007). Abundance and distribution of the eastern North Pacific Steller sea lion (Eumetopias jubatus) population. Fish. Bull. U.S. 107, 102–115.
Pollock, K., Marsh, H. D., Lawler, I. R., and Alldredge, M. W. (2006). Estimating animal abundance in heterogeneous environments: an application to aerial surveys for dugongs. J. Wildl. Manage. 70, 255–262.
Preen, A. (2004). Distribution, abundance and conservation status of dugongs and dolphins in the southern and western Arabian Gulf. Biol. Conserv. 118, 205–218. doi: 10.1016/j.biocon.2003.08.014
Punt, A. E., Siple, M., Francis, T. B., Hammond, P. S., Heinemann, D., Long, K. J., et al. (2021). Can we manage marine mammal bycatch effectively in low data environments? J. Appl. Ecol. 58, 596–607. doi: 10.1111/1365-2664.13816
Punt, A. E., Siple, M., Sigurðsson, G. M., Víkingsson, G., Francis, T. B., Granquist, S. M., et al. (2020). Evaluating management strategies for marine mammal populations: an example for multiple species and multiple fishing sectors in Iceland. Can. J. Fish. Aquat. Sci. 77, 1316–1331. doi: 10.1139/cjfas-2019-0386
R Core Team (2020). R: A Language and Environment for Statistical Computing. Vienna: R Foundation for Statistical Computing.
Ramp, C., Delarue, J., Bérubé, M., Hammond, P. S., and Sears, R. (2014). Fin whale survival and abundance in the Gulf of St. Lawrence, Canada. Endang. Species Res. 23, 125–132. doi: 10.3354/esr00571
Rankin, S., Oedekoven, C., and Archer, F. (2020). Mark recapture distance sampling: using acoustics to estimate the fraction of dolphins missed by observers during shipboard line-transect surveys. Environ. Ecol. Stat. 27, 233–251.
Read, A. J., Drinker, P., and Northridge, S. (2006). Bycatch of marine mammals in U.S. and global fisheries. Conserv. Biol. 20, 163–169. doi: 10.1111/j.1523-1739.2006.00338.x
Read, A. J., Urian, K. W., Wilson, B., and Waples, D. M. (2003). Abundance of bottlenose dolphins in the bays, sounds and estuaries of North Carolina. Mar. Mamm. Sci. 19, 59–73. doi: 10.1111/j.1748-7692.2003.tb01092.x
Rogan, E., Cañadas, A., Macleod, K., Santos, M. B., Mikkelsen, B., Uriarte, A., et al. (2017). Distribution, abundance and habitat use of deep diving cetaceans in the North East Atlantic. Deep Sea Res. II 141, 8–19. doi: 10.1016/j.dsr2.2017.03.015
Rugh, D. J., Hobbs, R. C., Lerczak, J. A., and Breiwick, J. M. (2005). Estimates of abundance of the eastern North Pacific stock of gray whales (Eschrichtius robustus) 1997–2002. J. Cetacean Res. Manage. 7, 1–12.
Russell, D. J. F., Morris, C. D., Duck, C. D., Thompson, D., and Hiby, L. (2019). Monitoring long-term changes in UK grey seal pup production. Aquat. Conserv. Mar. Freshw. Ecosyst. 29, 24–39. doi: 10.1002/aqc.3100
Ruzzante, D. E., McCracken, G. R., Førland, B., MacMillan, J., Notte, D., Buhariwalla, C., et al. (2019). Validation of close-kin mark-recapture (CKMR) methods for estimating population abundance. Methods Ecol. Evol. 10, 1445–1453. doi: 10.1111/2041-210X.13243
Salgado Kent, C., Jenner, K., Jenner, M., Bouchet, P., and Rexstad, E. (2012). Southern hemisphere breeding stock D humpback whale population estimates from North West Cape, Western Australia. J. Cetacean Res. Manage. 12, 29–38.
Scheidat, M., Verdaat, H., and Aarts, G. (2012). Using aerial surveys to estimate density and distribution of harbour porpoises in Dutch waters. J. Sea Res. 69, 1–7. doi: 10.1016/j.seares.2011.12.004
Scott, M. D., Wells, R. S., and Irvine, A. B. (1990). “A long-term study of bottlenose dolphins on the west coast of Florida,” in The Bottlenose Dolphin, eds S. Leatherwood and R. R. Reeves (San Diego, CA: Academic Press), 235–244.
Seber, G. A. F. (1982). The Estimation of Animal Abundance and Related Parameters. London: Charles Griffin.
Sepúlveda, M., Oliva, D., Urra, A., and Perez-Alvarez, M. J. (2011). Distribution and abundance of the South American sea lion Otaria flavescens (Carnivora: Otariidae) along the central coast off Chile. Rev. Chilena Hist. Nat. 84, 97–106.
Sepúlveda, M., Quiñones, R. A., Carrasco, P., and Pérez-Alvarez, M. J. (2012). Daily and seasonal variation in the haul-out behavior of the South American sea lion. Mamm. Biol. 77, 288–292. doi: 10.1016/j.mambio.2012.03.008
Sharples, R. J., MacKenzie, M. L., and Hammond, P. S. (2009). Estimating seasonal abundance of a central place forager using counts and telemetry data. Mar. Ecol. Prog. Ser. 378, 289–298. doi: 10.3354/meps07827
Shaughnessy, P. D., Troy, S. K., Kirkwood, R., and Nicholls, A. O. (2000). Australian fur seals at Seal Rocks, Victoria: pup abundance by mark–recapture estimation shows continued increase. Wildl. Res. 27, 629–633. doi: 10.1071/WR99046
Sigourney, D. B., Chavez-Rosales, S., Conn, P. B., Garrison, L., Josephson, E., and Palka, D. (2020). Developing and assessing a density surface model in a Bayesian hierarchical framework with a focus on uncertainty: insights from simulations and an application to fin whales (Balaenoptera physalus). PeerJ 8:e8226. doi: 10.7717/peerj.8226
Siniff, D. B., DeMaster, D. P., Hofman, R. J., and Eberhardt, L. L. (1977). An analysis of the dynamics of a Weddell seal population. Ecol. Monogr. 47, 319–335. doi: 10.2307/1942520
Siple, M. C. (2021). mcsiple/mmrefpoints: First Release (v0.0.1). Genève: Zenodo. doi: 10.5281/zenodo.4758402
Skaug, H. J., Øien, N., Schweder, T., and Bøthun, G. (2004). Abundance of minke whales (Balaenoptera acutorostrata) in the Northeast Atlantic: variability in time and space. Can. J. Fish. Aquat. Sci. 61, 870–886. doi: 10.1139/f04-020
Slooten, E., Dawson, S. M., and Rayment, W. J. (2004). Aerial surveys for coastal dolphins: abundance of Hector’s dolphins off the South Island west coast, New Zealand. Mar. Mamm. Sci. 20, 477–490. doi: 10.1111/j.1748-7692.2004.tb01173.x
Smith, B. D., Braulik, G., Strindberg, S., Ahmed, B., and Mansur, R. (2006). Abundance of Irrawaddy dolphins (Orcaella brevirostis) and Ganges river dolphins (Platanista gangetica gangetica) estimated using concurrent counts made by independent teams in waterways of the Sundarbans mangrove forest in Bangladesh. Mar. Mamm. Sci. 22, 527–547. doi: 10.1111/j.1748-7692.2006.00041.x
Smith, H. C., Pollock, K., Waples, K., Bradley, S., and Bejder, L. (2013). Use of the robust design to estimate seasonal abundance and demographic parameters of a coastal bottlenose dolphin (Tursiops aduncus) population. PLoS One 8:e76574. doi: 10.1371/journal.pone.0076574
Smith, T. D. (1981). Line-transect techniques for estimating density of porpoise schools. J. Wildl. Manage. 45, 650–657. doi: 10.2307/3808698
Smith, T. D., Allen, J., Clapham, P. J., Hammond, P. S., Katona, S. K., Larsen, F., et al. (1999). An ocean-basin-wide mark-recapture study of the North Atlantic humpback whale (Megaptera novaeangliae). Mar. Mamm. Sci. 15, 1–32. doi: 10.1111/j.1748-7692.1999.tb00779.x
Speckman, S. G., Chernook, V. I., Burn, D. M., Udevitz, M. S., Kochnev, A. A., Vasilev, A., et al. (2011). Results and evaluation of a survey to estimate Pacific Walrus population size, 2006. Mar. Mamm. Sci. 27, 514–553. doi: 10.1111/j.1748-7692.2010.00419.x
Stenson, G. B., Gosselin, J.-F., Lawson, J. W., Buren, A., Goulet, P., Lang, S. L. C., et al. (2020). Estimating Pup Production of Northwest Atlantic Harp Seals, Pagophilus groenlandicus, in 2017. DFO Canadian Science Advisory Secretariat Research Document 2020/056. Available online at: https://www.dfo-mpo.gc.ca/csas-sccs/Publications/ResDocs-DocRech/2020/2020_056-eng.html (accessed September 10, 2021).
Stevenson, B. C., Borchers, D. L., and Fewster, R. M. (2018). Cluster capture-recapture to account for identification uncertainty on aerial surveys of animal populations. Biometrics 75, 326–336. doi: 10.1111/biom.12983
Stevick, P. T., Allen, J., Clapham, P. J., Friday, N., Katona, S. K., Larsen, F., et al. (2003). North Atlantic humpback whale abundance and rate of increase four decades after protection from whaling. Mar. Ecol. Prog. Ser. 258, 263–273. doi: 10.3354/meps258263
Sucunza, F., Danilewicz, D., Andriolo, A., Azevedo, A. F., Secchi, E. R., and Zerbini, A. N. (2020). Distribution, habitat use, and abundance of the endangered franciscana in southeastern and southern Brazil. Mar. Mamm. Sci. 36, 421–435. doi: 10.1111/mms.12650
Sucunza, F., Danilewicz, D., Cremer, M., Andriolo, A., and Zerbini, A. N. (2018). Refining estimates of availability bias to improve assessments of the conservation status of an endangered dolphin. PLoS One 13:e0194213. doi: 10.1371/journal.pone.0194213
Taylor, B. L., Martinez, M., Gerrodette, T., Barlow, J., and Hrovat, Y. N. (2007). Lessons from monitoring trends in abundance of marine mammals. Mar. Mamm. Sci. 23, 157–175. doi: 10.1111/j.1748-7692.2006.00092.x
Taylor, B. L., Rojas-Bracho, L., Moore, J., Jaramillo-Legorreta, A., Ver Hoef, J. M., Cardenas-Hinojosa, G., et al. (2017). Extinction is imminent for Mexico’s endemic porpoise unless fishery bycatch is eliminated. Conserv. Lett. 10, 588–595. doi: 10.1111/conl.12331
Taylor, M. K., Laake, J., McLoughlin, P. D., Cluff, H. D., and Messier, F. (2009). Demography and population viability of polar bears in the Gulf of Boothia, Nunavut. Mar. Mamm. Sci. 25, 778–796. doi: 10.1111/j.1748-7692.2009.00302.x
Thomas, L., Russell, D. J. F., Duck, C., Morris, C. D., Lonergan, M., Empacher, F., et al. (2019). Modelling the population size and dynamics of the British grey seal. Aquat. Conserv. Mar. Freshw. Ecosyst 29, 6–23. doi: 10.1002/aqc.3134
Thomas, L. T., Buckland, S. T., Rexstad, E. A., Laake, J. L., Strindberg, S., Hedley, S. L., et al. (2010). Distance software: design and analysis of distance sampling surveys for estimating population size. J. Appl. Ecol. 47, 5–14. doi: 10.1111/j.1365-2664.2009.01737.x
Thompson, D., Duck, C. D., Morris, C. D., and Russell, D. J. F. (2019). The status of harbour seals (Phoca vitulina) in the UK. Aquat. Conserv. Mar. Freshw. Ecosyst. 29, 40–60. doi: 10.1002/aqc.3110
Thompson, P. M., Tollit, D. J., Wood, D., Corpe, H. M., Hammond, P. S., and MacKay, A. (1997). Estimating harbour seal abundance and status in an estuarine habitat in N.E. Scotland. J. Appl. Ecol. 34, 43–52. doi: 10.2307/2404846
Trites, A. W., and Larkin, P. A. (1996). Changes in the abundance of Steller sea lions (Eumetopias jubatus) in Alaska from 1956 to 1992: how many were there? Aquat. Mamm. 22, 153–166.
Turnock, B. J., and Quinn, T. J. (1991). The effect of responsive movement on abundance estimation using line transect sampling. Biometrics 47, 701–715. doi: 10.2307/2532156
Udevitz, M. S., Chadwick, V. J., Fischbach, A. S., and Garlich-Miller, J. L. (2009). Modeling haul-out behavior of walruses in Bering Sea ice. Can. J. Zool. 87, 1111–1128. doi: 10.1139/Z09-098
Urian, K., Read, A., Gorgone, A., Balmer, B., Wells, R. S., Berggren, P., et al. (2015). Recommendations for photo-identification methods used in capture-recapture models with cetaceans. Mar. Mamm. Sci. 31, 298–321. doi: 10.1111/mms.12141
Ver Hoef, J. M., Cameron, M. F., Boveng, P. L., London, J. M., and Moreland, E. E. (2014). A spatial hierarchical model for abundance of three ice-associated seal species in the eastern Bering Sea. Stat. Methodol. 17, 46–66. doi: 10.1016/j.stamet.2013.03.001
Vidal, O., Barlow, J., Hurtado, L. A., Torre, J., Cendrón, P., and Ojeda, Z. (1997). Distribution and abundance of the Amazon river dolphin (Inia geoffrensis) and the tucuxi (Sotalia fluviatilis) in the upper Amazon River. Mar. Mamm. Sci. 13, 427–445. doi: 10.1111/j.1748-7692.1997.tb00650.x
Víkingsson, G. A., Pike, D. G., Desportes, G., Øien, N., Gunnlaugsson, T., and Bloch, D. (2013). Distribution and abundance of fin whales (Balaenoptera physalus) in the Northeast and Central Atlantic as inferred from the North Atlantic Sightings Surveys 1987-2001. NAMMCO Sci. Publ. 7, 49–72. doi: 10.7557/3.2705
Wade, P. R. (1998). Calculating limits to the allowable human-caused mortality of cetaceans and pinnipeds. Mar. Mamm. Sci. 14, 1–37. doi: 10.1111/j.1748-7692.1998.tb00688.x
Wade, P. R., Kennedy, A., LeDuc, R., Barlow, J., Carretta, J., Shelden, K., et al. (2011). The world’s smallest whale population. Biol. Lett. 7, 83–85. doi: 10.1098/rsbl.2010.0477
Wege, M., Etienne, M.-P., Oosthuizen, W. C., Reisinger, R. R., Bester, M. N., and de Bruyn, N. (2016). Trend changes in sympatric Subantarctic and Antarctic fur seal pup populations at Marion Island, Southern Ocean. Mar. Mamm. Sci. 32, 960–982. doi: 10.1111/mms.12306
Westlake, R. L., Perryman, W. L., and Ono, K. A. (1997). Comparison of vertical aerial photographic and ground censuses of Steller sea lions at Año Nuevo Island, July 1990-1993. Mar. Mamm. Sci. 13, 207–218. doi: 10.1111/j.1748-7692.1997.tb00628.x
Whitehead, H., and Gordon, J. (1986). Methods of obtaining data for assessing and modelling sperm whale populations which do not depend on catches. Rep. Int. Whal. Commn. (Special Issue 8), 149–165.
Whitehead, H. P. (1982). Populations of humpback whales in the northwest Atlantic. Rep. Int. Whal. Commn. 32, 345–353.
Whitehead, H. P., Payne, R., and Payne, M. (1986). Population estimate for right whales off Peninsula Valdes, Argentina, 1971-1976. Rep. Int. Whal. Commn. (Special Issue 10), 169–171.
Williams, R., Ashe, E., Gaut, K., Gryba, R., Moore, J. E., Rexstad, E., et al. (2017). Animal counting toolkit: a practical guide to small-boat surveys for estimating abundance of coastal marine mammals. Endang. Species Res. 34, 149–165. doi: 10.3354/esr00845
Williams, R., Burgess, M. G., Ashe, A., Gaines, S. D., and Reeves, R. R. (2016a). U.S. seafood import restriction presents opportunity and risk. Science 354, 1372–1374. doi: 10.1126/science.aai8222
Williams, R., Hedley, S. L., Branch, T. A., Bravington, M. V., Zerbini, A. N., and Findlay, K. P. (2011). Chilean blue whales as a case study to illustrate methods to estimate abundance and evaluate conservation status of rare species. Conserv. Biol. 25, 526–535. doi: 10.1111/j.1523-1739.2011.01656.x
Williams, R., Hedley, S. L., and Hammond, P. S. (2006). Modeling distribution and abundance of Antarctic baleen whales using ships of opportunity. Ecol. Soc. 11:1.
Williams, R., Leaper, R., Zerbini, A. N., and Hammond, P. S. (2007). Methods for investigating measurement error in cetacean line-transect surveys. J. Mar. Biol. Assoc. U.K. 87, 313–320. doi: 10.1017/S0025315407055154
Williams, R., Moore, J. E., Gomez-Salazar, C., Trujillo, F., and Burt, L. (2016b). Searching for trends in river dolphin abundance: designing surveys for looming threats, and evidence for opposing trends of two species in the Colombian Amazon. Biol. Conserv. 195, 136–145. doi: 10.1016/j.biocon.2015.12.037
Williams, R., and Thomas, L. (2007). Distribution and abundance of marine mammals in the coastal waters of British Columbia, Canada. J. Cetacean Res. Manage. 9, 15–28.
Williams, R., and Thomas, L. (2009). Cost-effective abundance estimation of rare animals: testing performance of small-boat surveys for killer whales in British Columbia. Biol. Conserv. 142, 1542–1547. doi: 10.1016/j.biocon.2008.12.028
Williamson, L. D., Brookes, K. L., Scott, B. E., Graham, I. M., Bradbury, G., Hammond, P. S., et al. (2016). Echolocation detections and digital video surveys provide reliable estimates of the relative density of harbour porpoises. Methods Ecol. Evol. 7, 762–769. doi: 10.1111/2041-210X.12538
Wilson, B., Hammond, P. S., and Thompson, P. M. (1999). Estimating size and assessing trends in a coastal bottlenose dolphin population. Ecol. Appl. 9, 288–300. doi: 10.2307/2641186
Zerbini, A. N., Waite, J. M., Durban, J. W., LeDuc, R., Dahlheim, M. E., and Wade, P. R. (2007). Estimating abundance of killer whales in nearshore waters of the Gulf of Alaska and Aleutian Islands using line-transect sampling. Mar. Biol. 150, 1033–1045. doi: 10.1007/s00227-006-0347-8
Zerbini, A. N., Waite, J. M., Laake, J. L., and Wade, P. R. (2006). Abundance, trends and distribution of baleen whales off Western Alaska and the central Aleutian Islands. Deep Sea Res. I 53, 1772–1790. doi: 10.1016/j.dsr.2006.08.009
Keywords: abundance, cetaceans, pinnipeds, sirenians, population size
Citation: Hammond PS, Francis TB, Heinemann D, Long KJ, Moore JE, Punt AE, Reeves RR, Sepúlveda M, Sigurgsson GM, Siple MC, Víkingsson G, Wade PR, Williams R and Zerbini AN (2021) Estimating the Abundance of Marine Mammal Populations. Front. Mar. Sci. 8:735770. doi: 10.3389/fmars.2021.735770
Received: 03 July 2021; Accepted: 23 August 2021;
Published: 27 September 2021.
Edited by:
Jeremy Kiszka, Florida International University, United StatesReviewed by:
Luis Cardona, University of Barcelona, SpainChandra Paulina Salgado Kent, Edith Cowan University, Australia
Copyright © 2021 Hammond, Francis, Heinemann, Long, Moore, Punt, Reeves, Sepúlveda, Sigurðsson, Siple, Víkingsson, Wade, Williams and Zerbini. This is an open-access article distributed under the terms of the Creative Commons Attribution License (CC BY). The use, distribution or reproduction in other forums is permitted, provided the original author(s) and the copyright owner(s) are credited and that the original publication in this journal is cited, in accordance with accepted academic practice. No use, distribution or reproduction is permitted which does not comply with these terms.
*Correspondence: Philip S. Hammond, psh2@st-andrews.ac.uk