Oxygen and Nutrient Trapping in the Southern Benguela Upwelling System
 Tim Rixen1,2*
  Niko Lahajnar2
  Tarron Lamont3,4,5
  Rolf Koppelmann6 Bettina Martin6 Justus E. E. van Beusekom7
  Claire Siddiqui1 Keshnee Pillay3
  Luisa Meiritz2
- 1Leibniz Centre for Tropical Marine Research—ZMT, Bremen, Germany
- 2Institute of Geology, Universität Hamburg, Hamburg, Germany
- 3Oceans and Coasts Research Branch, Department of Environment, Forestry and Fisheries, Cape Town, South Africa
- 4Marine Research Institute and Department of Oceanography, University of Cape Town, Cape Town, South Africa
- 5Bayworld Centre for Research and Education, Cape Town, South Africa
- 6Institute of Marine Ecosystem and Fishery Science, Universität Hamburg, Hamburg, Germany
- 7Helmholtz-Zentrum Hereon, Geesthacht, Germany
The Benguela Upwelling System in the southeast Atlantic Ocean is of crucial socio-economic importance due to its high productivity. However, predicting its response to global change and understanding past changes are still great challenges. Here, we compile data obtained from a research cruise and an oceanographic mooring to demonstrate that a topographically steered nutrient trapping zone develops in a narrow belt along the coast during the main upwelling season in austral spring and summer in the southern Benguela Upwelling System. High nutrient concentrations within this zone increase the impact of upwelling on the productivity of the southern Benguela Upwelling System, but the efficient nutrient trapping operates at the expense of decreasing oxygen concentrations. This enhances the probability of anoxic events emerging toward the end of the upwelling season. However, at the end of the upwelling season, the front that separates the coastally trapped waters from open shelf waters weakens or even collapses due to upwelling cessation and the reversing current regime. This, in addition to a stronger vertical mixing caused by winter cooling, fosters the ventilation of the nutrient trapping zone, which reestablishes during the following upwelling season. The postulated intensification of upwelling and changes in the ecosystem structure in response to global warming seem to reduce the nutrient trapping efficiency by increasing offshore advection of surface waters and plankton blooms. The intensified upwelling and resulting lower biological oxygen consumption appears to mask the expected impacts of global warming on the oxygen minimum zone (OMZ) in the southern Benguela Upwelling System. In contrast to other OMZs, including those in northern Benguela Upwelling Systems, the OMZ in the southern Benguela Upwelling System reveals so far no detectable long-term decrease in oxygen. Thus, the nutrient trapping efficiency seems to be a critical feature mitigating global change impacts on the southern Benguela Upwelling System. Since it is topographically steered, regional impacts on the nutrient trapping efficiency appear also to explain varying responses of upwelling systems to global change as the comparison between southern and northern Benguela Upwelling System shows. This emphasizes the need for further and more comparable studies in order to better understand the response of Eastern Boundary Upwelling Systems and their ecosystem services to global change.
Introduction
Coastal upwelling regions associated with Eastern Boundary Upwelling Systems and the monsoon-driven circulation in the Arabian Sea are the ocean’s most productive ecosystems (Carr, 2001; Messié et al., 2009). They support ∼20% of the global fish catch and are associated with pronounced oxygen minimum zones (OMZ, Pauly and Christensen, 1995; Monteiro et al., 2011). The Benguela Upwelling System in the southeast Atlantic Ocean is the most productive system of all Eastern Boundary Upwelling Systems in terms of primary production (Carr, 2001; Messié et al., 2009). The strong Lüderitz Upwelling cell at 26°40′S divides the region into a northern (NBUS) and southern subsystem (SBUS, Figure 1), which are located off Namibia and South Africa, respectively (e.g., Shannon, 1985; Duncombe Rae, 2005; Hutchings et al., 2009). Even though the intensity of upwelling, as indicated by the wind-driven Ekman transport, is an order of magnitude stronger in the NBUS than in the SBUS, net primary production rates are similar between the two subsystems (Wasmund et al., 2005; Barlow et al., 2009; Verheye et al., 2016; Lamont et al., 2018). Nutrient concentrations, in addition to stable nitrogen and oxygen isotopic ratios, indicate that on-shelf trapping of regenerated nutrients strongly increases the effects of upwelling on the productivity in the SBUS (Flynn et al., 2020). Regenerated nutrients are released during the remineralization of organic matter while preformed nutrients are biologically unused nutrients, which are carried along with sinking surface water masses mostly at high latitudes into the deep sea (Broecker et al., 1985; Ito and Follows, 2005). Sub-Antarctic Mode Water loaded with preformed nutrients feeds the BUS and is further enriched with regenerated nutrients within the upwelling system (Figure 2). This occurs due to the export of organic matter from the euphotic zone into subsurface waters by offshore advecting upwelling-driven plankton blooms and its remineralization within the upwelling source waters (Dittmar and Birkicht, 2001; Tyrrell and Lucas, 2002). Since the remineralization of exported organic matter within the upwelling source waters limits lateral and vertical losses of nutrients from the upwelling system, it is called nutrient trapping and it strengthens the impact of upwelling on the productivity by increasing nutrient concentrations in the upwelled waters. In contrast, lateral and vertical nutrient losses lower the nutrient trapping efficiency and the influence of upwelling on the productivity. The offshore advection of upwelling-driven phytoplankton blooms and the resulting export of organic matter outside the upwelling region represent a lateral nutrient loss. Similarly, the remineralization of exported organic matter above and below the upwelling source waters, as well as the burial of organic matter in sediments, is considered as a vertical nutrient loss.
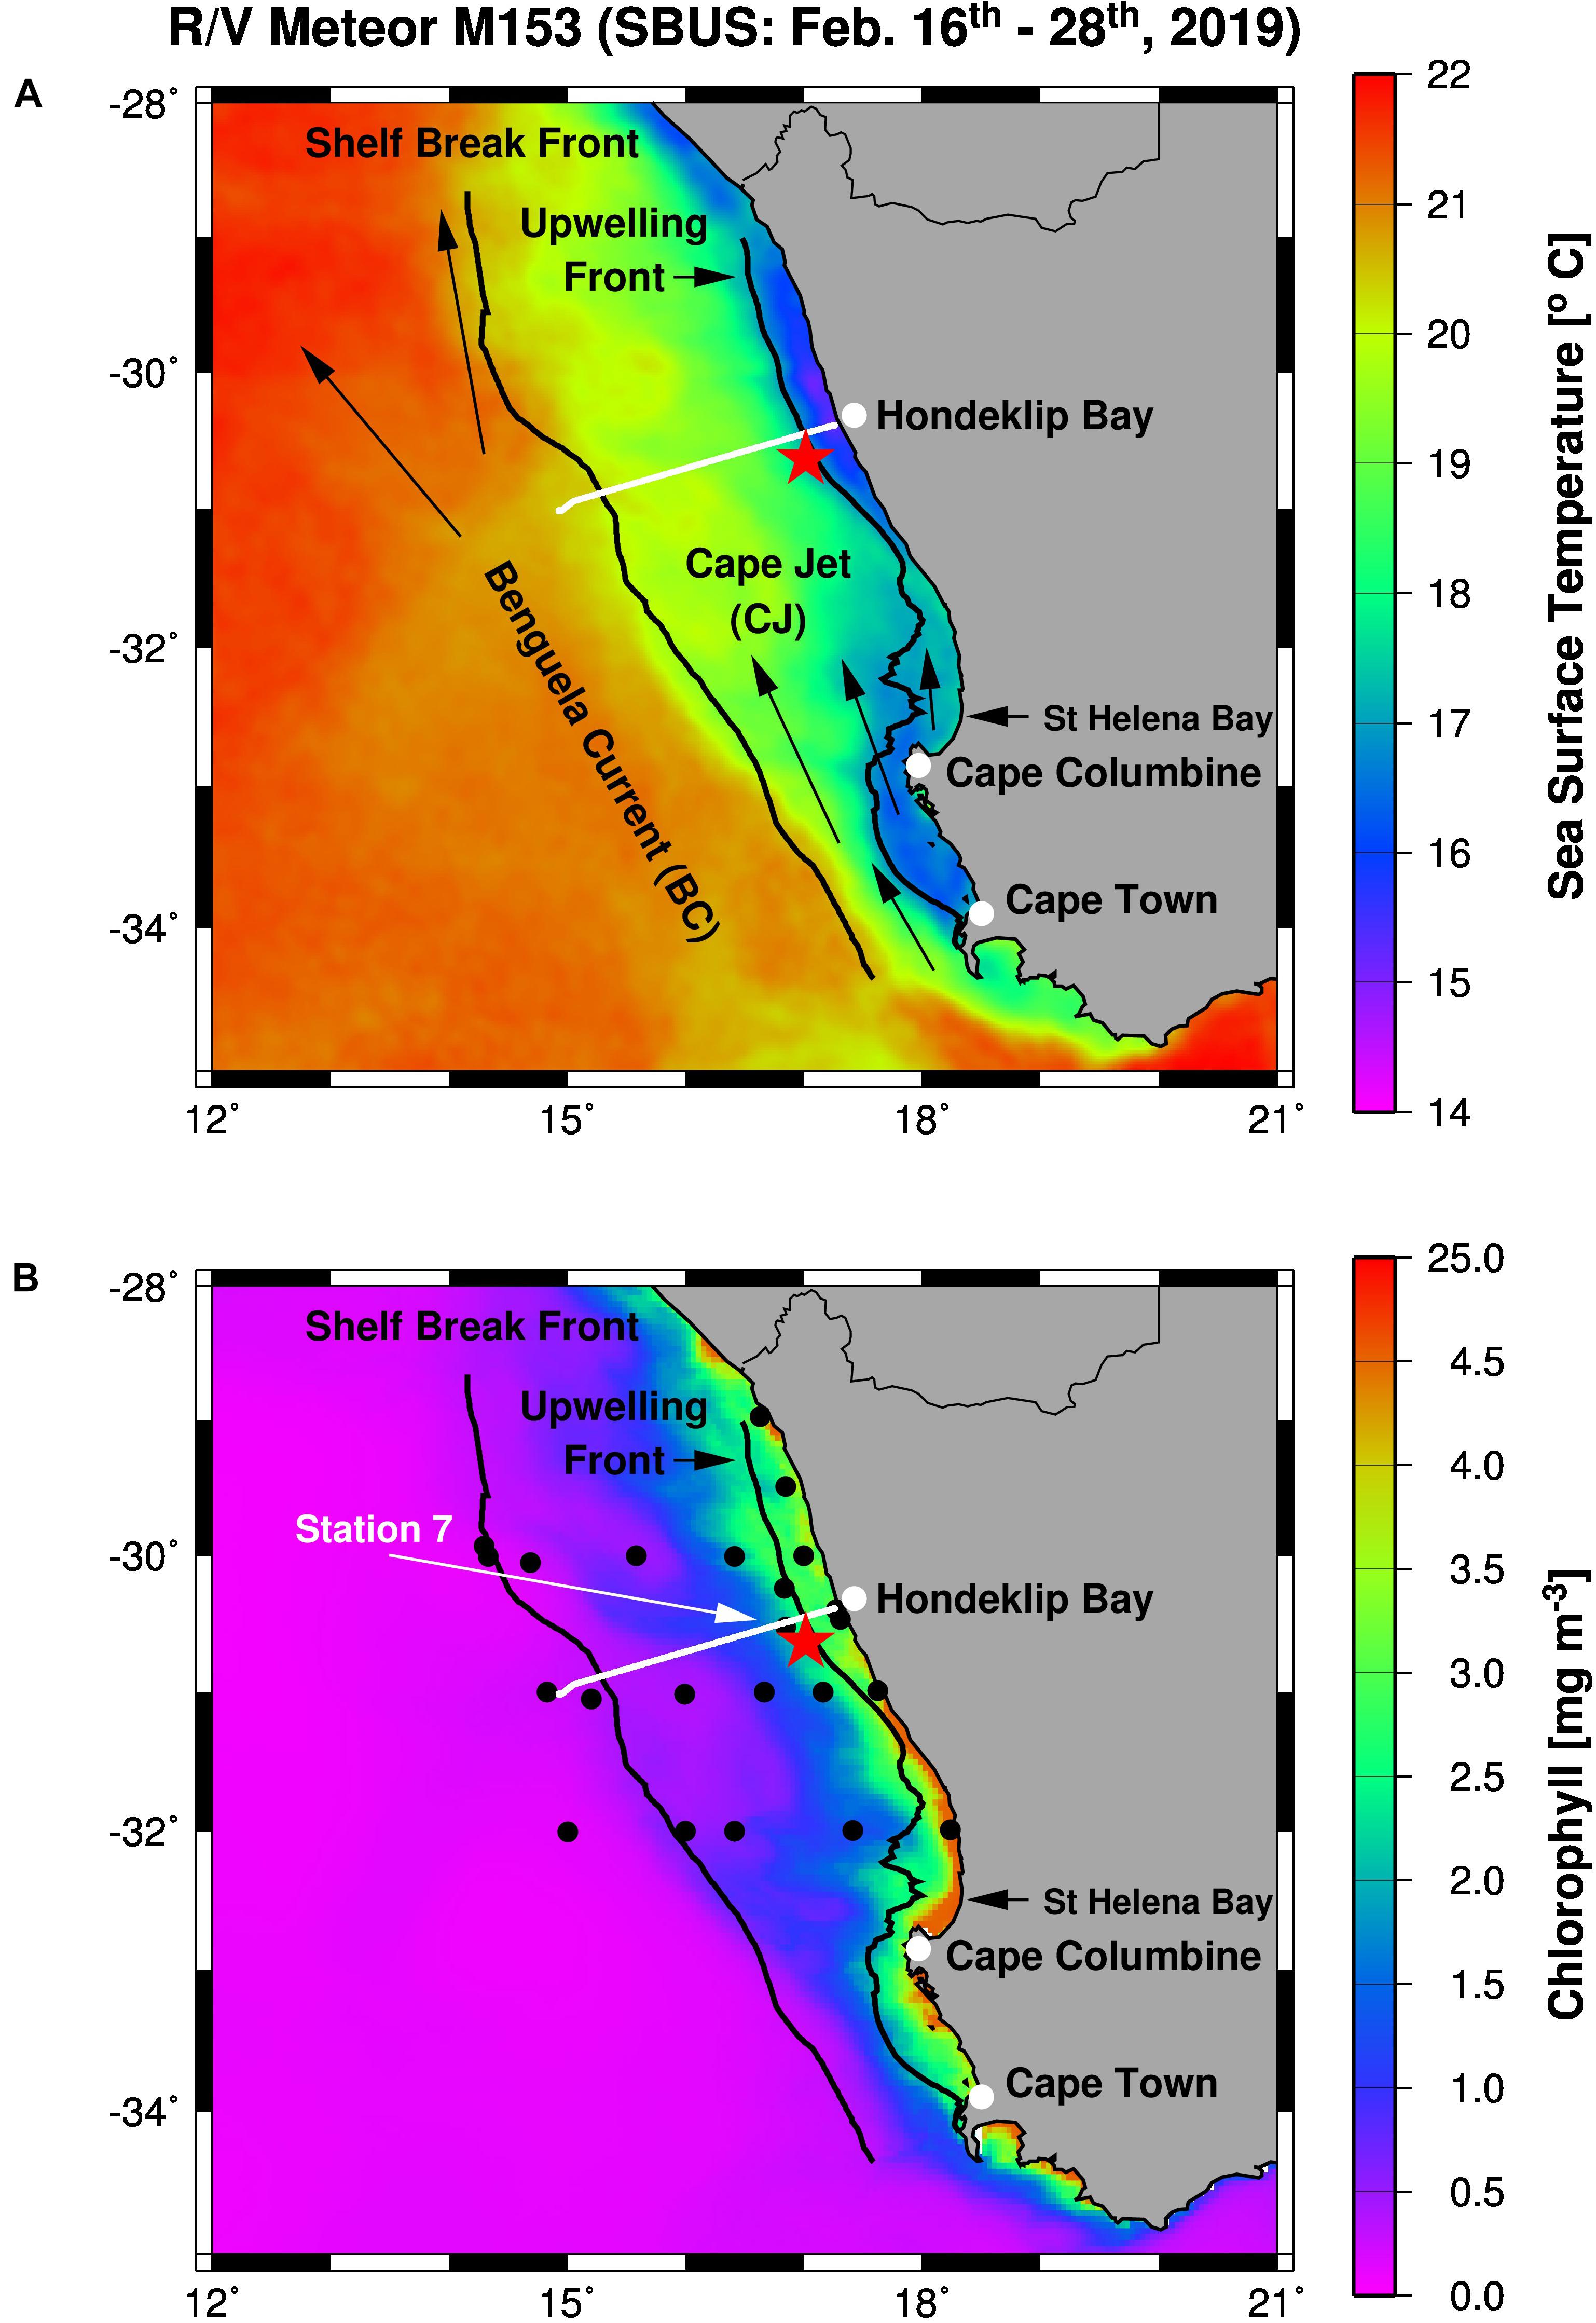
Figure 1. Working area (A) and station map (B) showing the mooring site (red star), and the TRIAXUS transect (white line) as well as satellite-derived sea surface temperatures (A) and chlorophyll-a concentrations (B) averaged for the period of the cruise M153. Furthermore, arrows indicate the Benguela Current and the Cape Jet (A) and the black lines mark the 1,000 m depth contour line and the 17.2°C isotherm in (A,B). The Shelf Break Front (∼20°C isotherm) almost follows the 1,000 m depth contour line whereas the 17.2°C isotherm defines the Upwelling Front. Black circles show CTD stations while the white arrow highlight the location of Station 7.
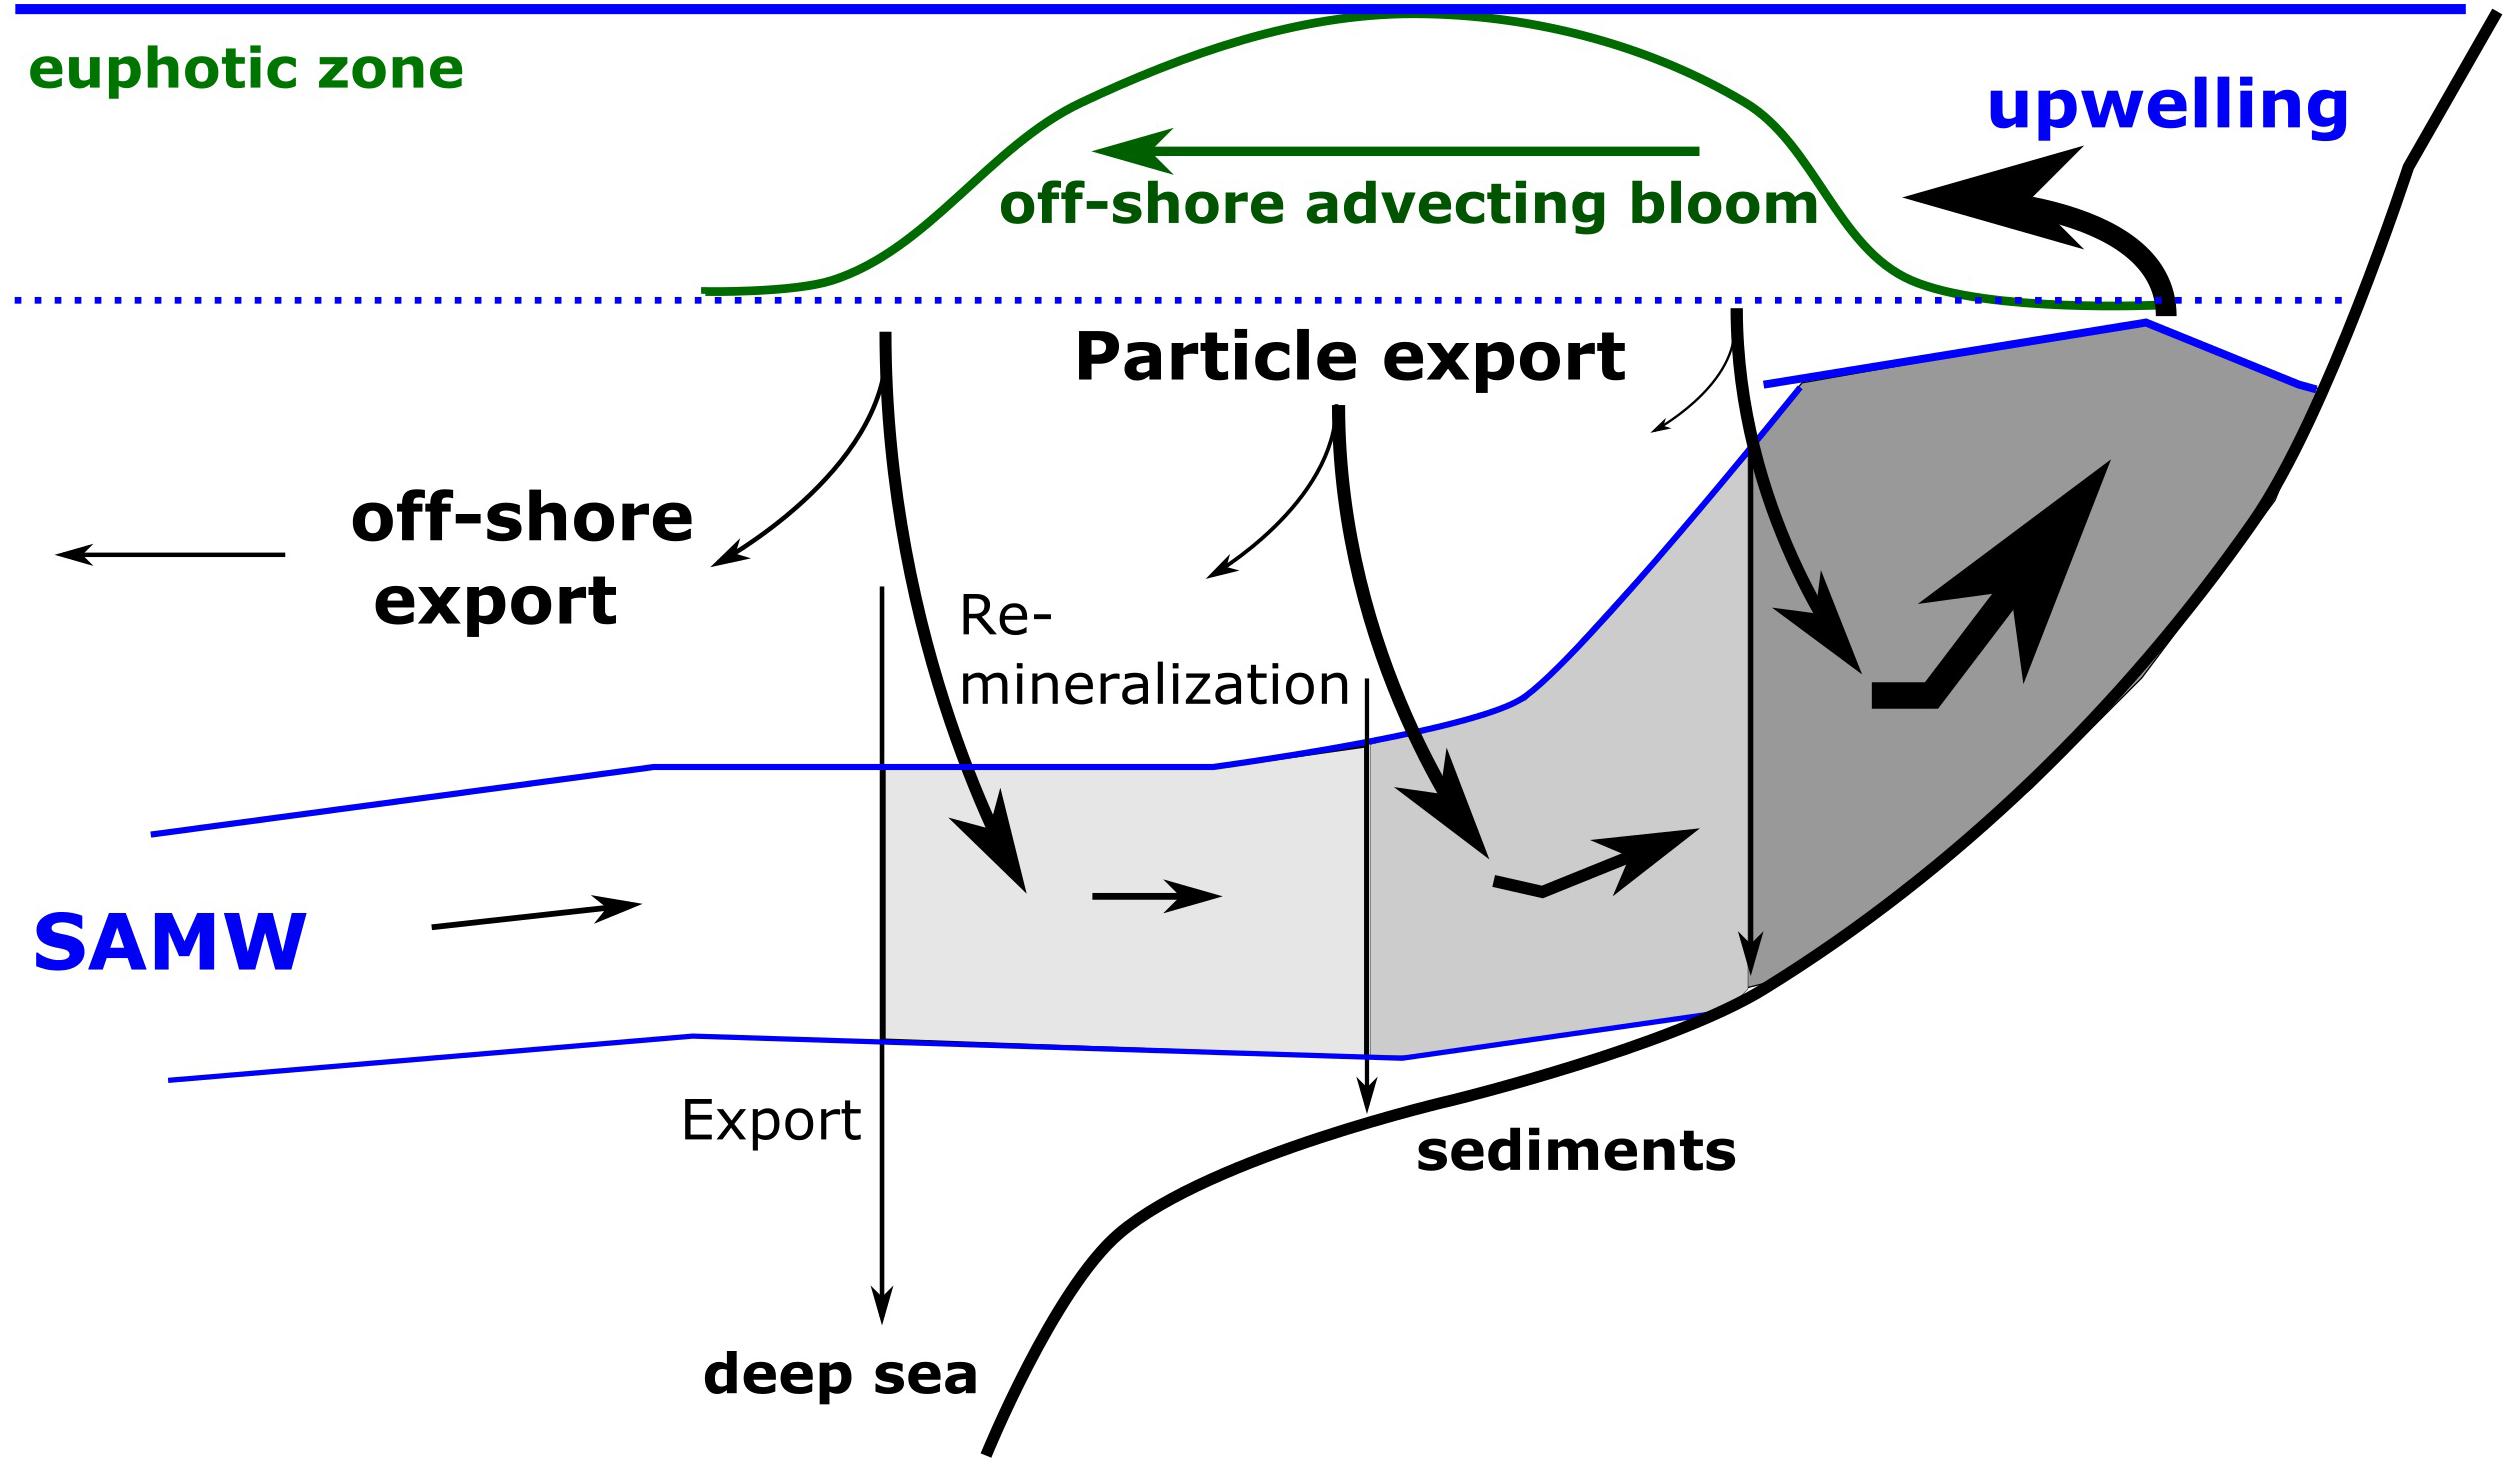
Figure 2. Schematic illustration of nutrient trapping. The figure shows the supply of Sub-Antarctic Mode Water (SAMW), its upwelling at the coast, the development of an offshore advecting bloom due to the utilization of upwelled nutrients and the export of organically bound nutrients within sinking particles. The remineralization of organic matter within the onshore flowing SAMW increases the nutrient concentrations and lowers oxygen concentrations in the upwelling water and prevents the export of nutrients into the open ocean, the deep sea and sediments. The darkening gray areas indicate decreasing oxygen and increasing nutrient concentrations.
Since dissolved oxygen is utilized during the remineralization of organic matter, the nutrient trapping efficiency links the productivity of an upwelling system to the intensity of the subsurface OMZ. However, a slowdown of remineralization rates and a decreasing oxygen-inhibition of anaerobic processes at low oxygen concentrations is assumed to prevent the development of anoxia by reducing the nutrient trapping efficiency (Rixen et al., 2019, 2020). Decreasing remineralization rates lower the nutrient trapping efficiency by deepening the main zone of remineralization, which represents a vertical loss of nutrients from the upwelling system. During anaerobic processes oxygen bound to nitrogen is used to drive metabolic processes with the consequence that nitrate and nitrite are converted into elemental nitrogen (N2). This form of nitrogen is inaccessible for eukaryotic plankton, such as diatoms and dinoflagellates, which dominate the phytoplankton community in the Benguela Upwelling System (e.g., Fawcett et al., 2007; Pitcher et al., 2014; Postel et al., 2014). Hence, a reduction of nitrate to N2 lowers the nutrient trapping efficiency by decreasing the availability of nutrients within the upwelling system.
In contrast to the OMZ in the NBUS, which is largely driven by the inflow of oxygen-poor waters from the Angola basin, the OMZ in the SBUS is mainly produced locally by the balance between physical oxygen supply and biological oxygen consumption (Monteiro et al., 2006, 2011; Mohrholz et al., 2008; Pitcher et al., 2014). The SBUS OMZ is most pronounced in bottom waters of St Helena Bay (Figure 1). Studies since the 1970s (De Decker, 1970; Bailey and Chapman, 1985) revealed an upwelling-driven seasonality with lower oxygen concentrations and an associated expansion of the OMZ at the end of the main upwelling season in summer (January to April), and higher values between June and October when upwelling is weaker or absent (Bailey, 1991; Pitcher and Probyn, 2011; Pitcher et al., 2014; Lamont et al., 2015). In contrast to many other OMZ in the world’s ocean (Stramma et al., 2008), oxygen concentrations in the SBUS reveal no trend during the last 50 years, but an increase in the frequency of periodic anoxic events was observed (Pitcher et al., 2014). They are often associated with the development of massive blooms of dinoflagellates referred to as red tides (Fawcett et al., 2007; Pitcher and Probyn, 2011; Pitcher et al., 2014). These blooms emerge at the end of the upwelling season and are confined to near shore calm conditions which develop in the shadow of wind-driven upwelling plumes (Pitcher and Nelson, 2006). During such events, the OMZ expands vertically over the entire water column. In contrast to the bottom water OMZ, decreasing oxygen concentrations in the upper water column were inferred from a southward shift of the rock lobster distribution and an increased frequency of rock lobster walkouts in response to anoxic events (Cockcroft, 2001; Cockcroft et al., 2008; Hutchings et al., 2009).
Here we compile data obtained from a research cruise with the German research vessel RV Meteor (M153) and a moored oxygen sensor (Figure 1) to demonstrate that nutrient trapping occurs in a quite stable and narrow strip along the coast, and that its seasonal cycle and response to global changes stabilizes the SBUS OMZ.
Study Area
The BUS stretches from the north of Cape Frio (∼15°S) to Cape Agulhas (∼35°S), while south-easterly trade winds emanating from the interplay between the South Atlantic Anticyclone and the continental low pressure trough, cause the emergence of distinct upwelling cells along the coast (e.g., Shannon and Nelson, 1996; Veitch et al., 2009; Kämpf and Chapman, 2016). However, South Atlantic Central Water feeds upwelling, which is a Sub-Antarctic Mode Water. It can be considered as a mixture of mainly Antarctic Intermediate Water and Subtropical Mode Water (McCartney, 1977; Karstensen and Quadfasel, 2002; Souza et al., 2018). These water masses are subducted beneath subtropical surface waters north of the Sub-Antarctic Front at about 36°S–54°S and are fed via the South Atlantic Current into the Benguela Current (e.g., Gordon, 1981; Donners et al., 2005). The Benguela Current splits into the Benguela Oceanic Current and the Benguela Coastal Current in the northern part of the SBUS (e.g., Hardman-Mountford et al., 2003; Veitch et al., 2010). In the southern part of the SBUS, the Benguela Current follows the shelf break toward the equator while the Cape Jet flushes the SBUS shelf (Figure 1A). The Cape Jet originates from the Agulhas Current and carries also Indian Ocean Central water into the SBUS (Durgadoo et al., 2017). It has a similar origin as the South Atlantic Central Water and both share almost the same temperature and salinity (θ-S) characteristics (McCartney, 1977; Harms et al., 2019). However, mostly in summer, the Cape Jet splits into two branches at Cape Columbine. The Columbine Front separates the inshore and offshore Cape Jet, whereas the Shelf Break Front separates Benguela Current from the Cape Jet (Shannon, 1985). According to the θ-S characteristics and the resulting density, the wide shelf north of Cape Columbine is flushed by Sub-Antarctic Mode Water and Modified Upwelled Water (Lamont et al., 2015). The latter is upwelled Sub-Antarctic Mode Water that was modified by its interaction with the atmosphere and is subducted beneath Open Ocean Surface Water at the oceanic front (Duncombe Rae, 2005; Lamont et al., 2015). This front separates the Benguela Current from the subtropical gyre and is considered as the outer boundary of the BUS (Barange and Pillar, 1992; Shannon and Nelson, 1996). However, some authors include the Modified Upwelled Water into their definition of South Atlantic Subtropical Mode Water (Flynn et al., 2020), whereas other authors suggest that the core properties of South Atlantic Subtropical Mode Water occurs only in a small wedge between the Sub-Antarctic Mode Water and Modified Upwelled Water at the outer shelf (Lamont et al., 2015).
During the last two decades satellite data indicate no significant trends in productivity (Demarcq, 2009; Verheye et al., 2016; Lamont et al., 2019) but there is a tendency toward an intensification of upwelling in the SBUS (Sydeman et al., 2014; Tim et al., 2015; Wang et al., 2015; Lamont et al., 2018, 2019). Associated with this trend are shifts in the ecosystem structure such as an overall decrease in zooplankton abundance and a shift from large to smaller zoo- and phytoplankton species (Hutchings et al., 2012; Jarre et al., 2015; Verheye et al., 2016; Lamont et al., 2019). However, as mentioned before, oxygen concentrations within the bottom water OMZ reveal no clear trend.
Materials and Methods
During the RV Meteor cruise M153 shipboard measurements were conducted along a station grid in the SBUS between February 16th and 28th, 2019 (Figure 1B). This included 25 stations, continuous underway measurements by the use of on-board underway systems, as well as one TRIAXUS transect and the deployment of one mooring. CTD casts were carried out to characterize spatial and depth-related changes of the environmental conditions (temperature, salinity, and dissolved oxygen concentrations). In order to study the diurnal cycle, four CTD casts were conducted between February 18th and 19th at station 7 close to the mooring location.
Water samples were collected with Niskin bottles attached to a rosette water sampler. The profiling SEABIRD ELECTRONICS (SBE) 911plus CTD system was equipped with a DIGIQUARTZ pressure sensor, a SBE3 temperature and SBE4 conductivity sensor within a double sensor setup, a PAR sensor (QSR 2300) and a SBE43 dissolved oxygen sensor. In order to calibrate the SBE43, concentrations of dissolved oxygen were analyzed in 63 water samples by using the Winkler titration method.
Additionally, water samples were taken to analyze nutrient concentrations. All nutrient samples were filtered immediately after sampling, using 0.45 μm disposable syringe filters, filled in pre-rinsed 50 ml PE bottles and frozen at −20°C. Subsequently, samples were sent to Germany to be analyzed by means of a continuous flow injection system (SKALAR SAN PLUS SYSTEM) according to methods described by Grasshoff et al. (1999).
The TRIAXUS was equipped with a SEABIRD FASTCAT, SBE 49, AANDERAA OXYGEN OPTODE 4330 F, and a SEASCAN SUNADeep Nitrate Sensor. This high speed remotely operated towed vehicle was towed at a speed of 8 knots with a horizontal offset out of the vessel’s wake. It undulated vertically between 5 and 180 m, depending on the water depth. In order to calibrate sensors attached to TRIAXUS and the underway system, their records were correlated with CTD data collected approximately at the same sites and water-depths (Figure 3). This calibration included additional data obtained in the NBUS, which are not further discussed in this paper.
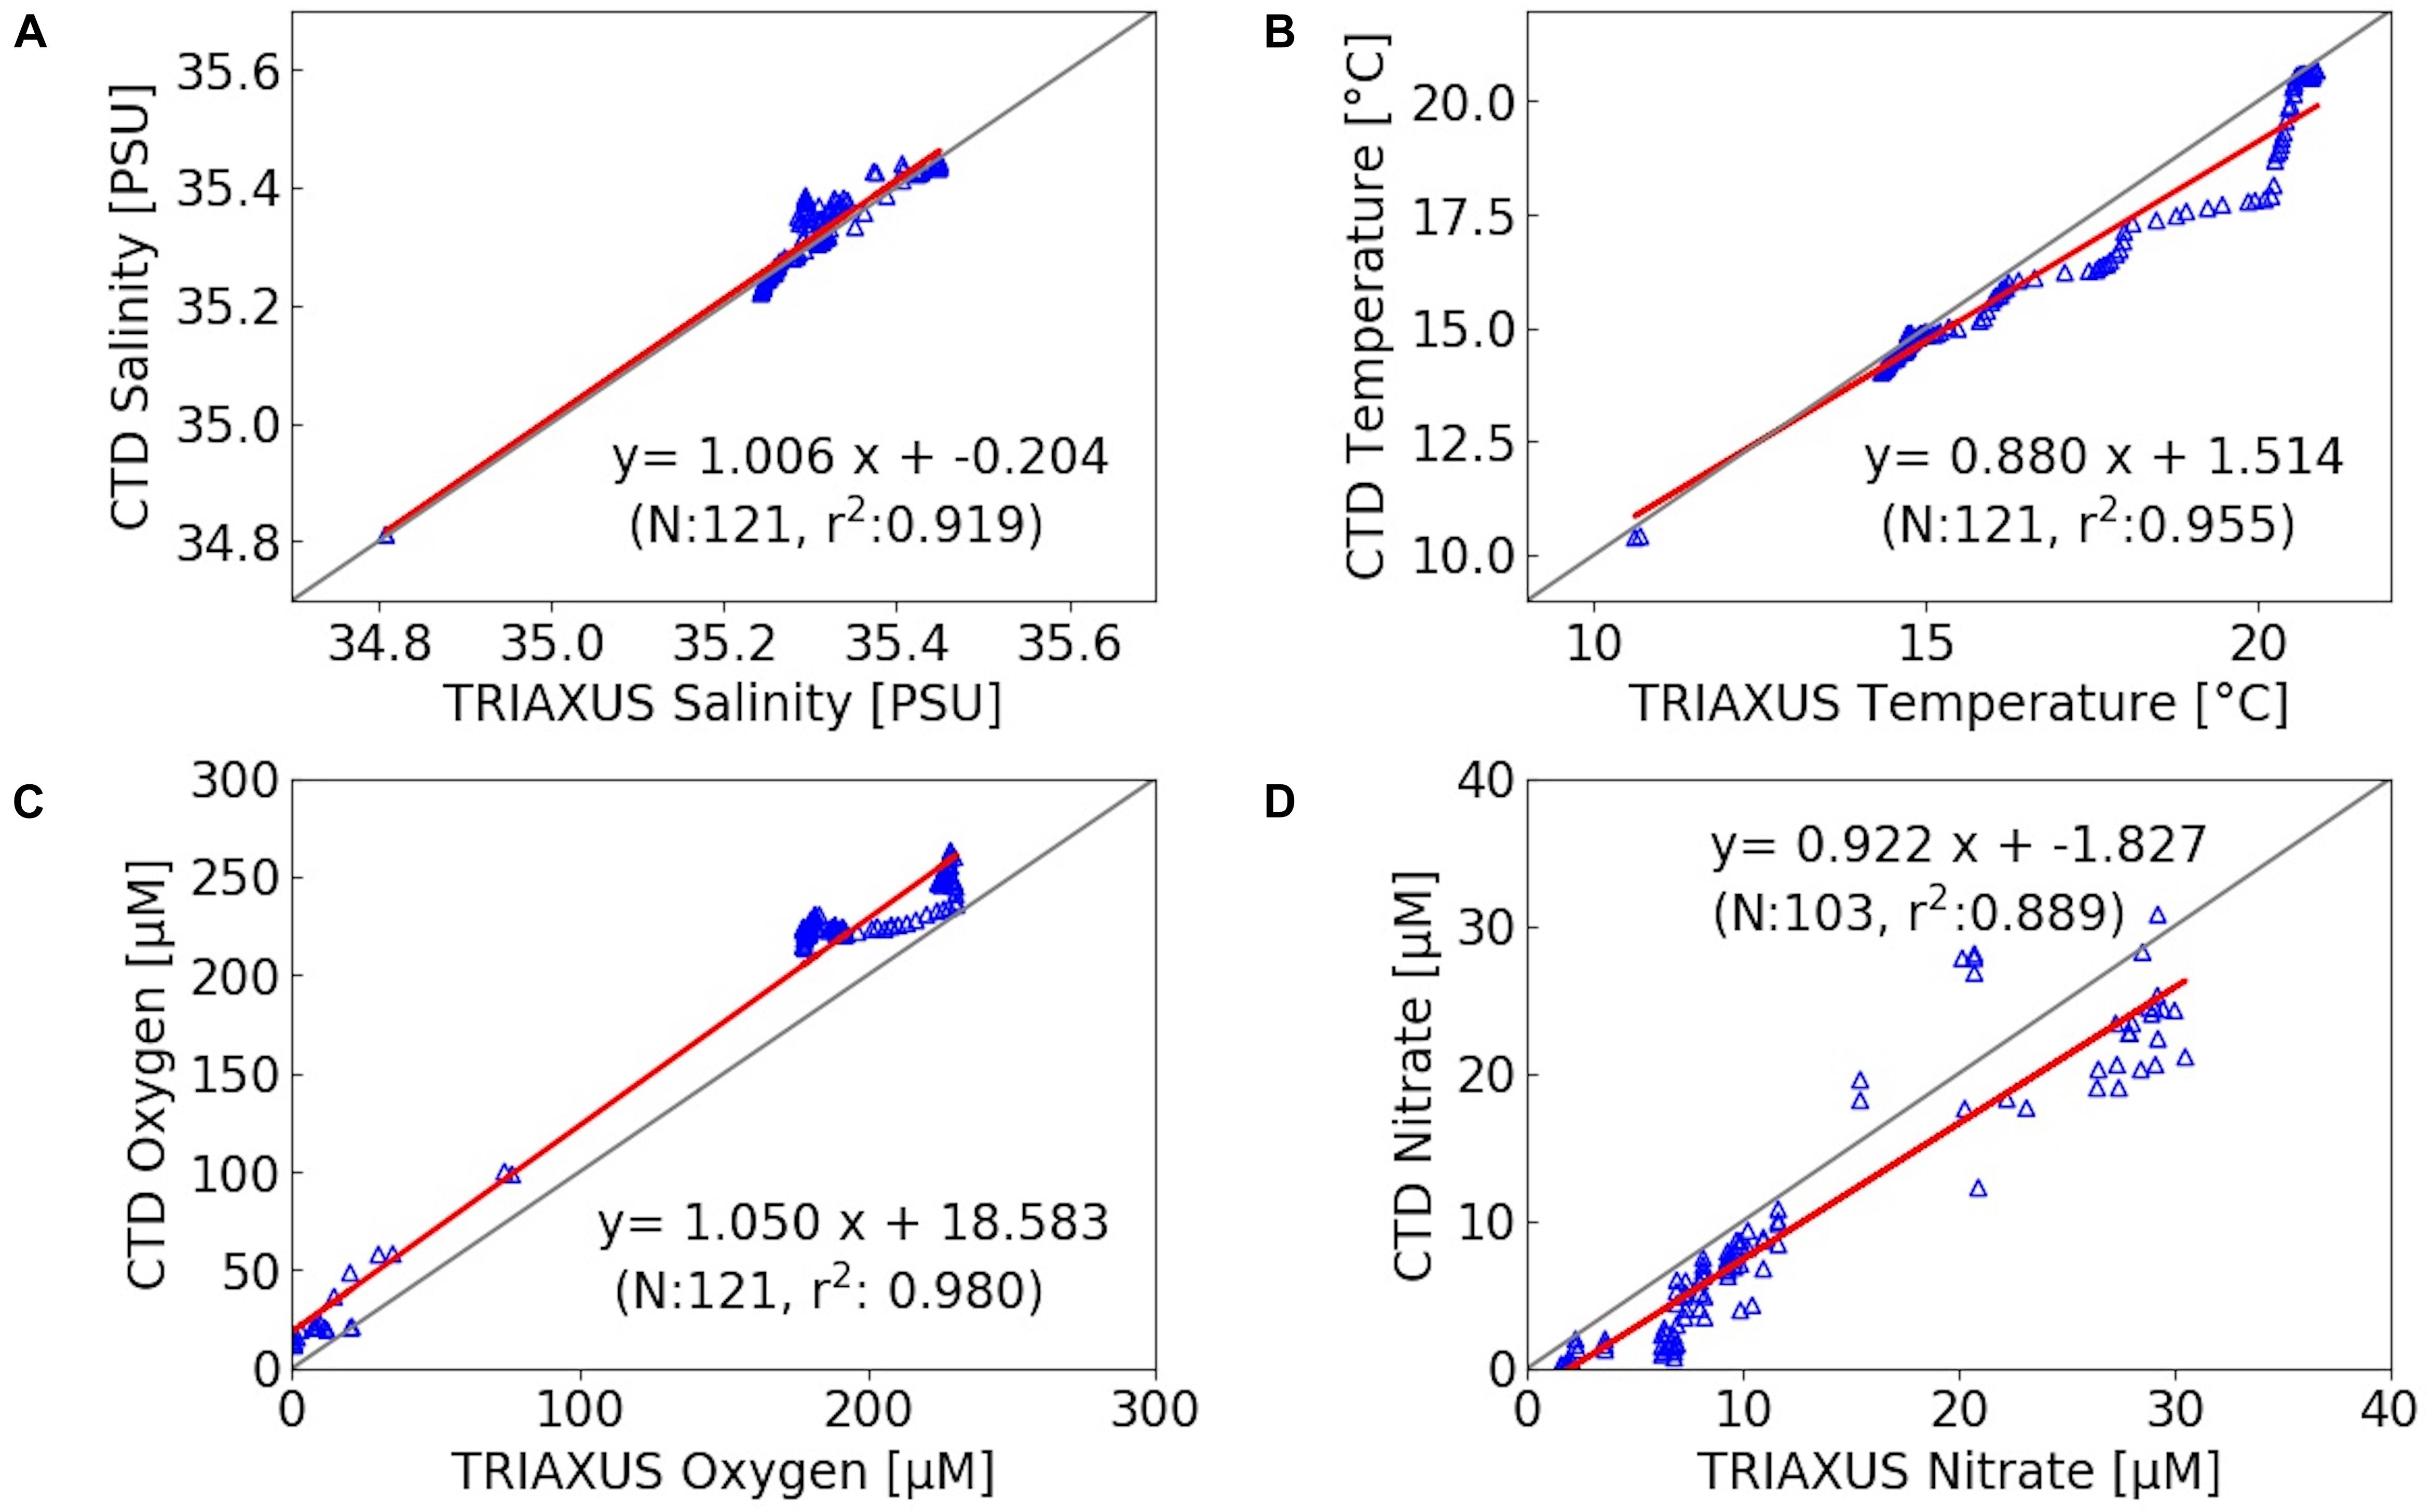
Figure 3. Correlation between TRIAXUS records and data from CTD stations within a 2 km radius (at equal water depths) of salinity (A), temperature (B), oxygen (C) and nitrate (D), with N as number of observations and r2 as correlation coefficient. The gray and red lines indicate the expected 1:1 line and observed correlation, respectively. Due to a limited number of observations in nitrate, all CTD stations within a radius of approximately 30 km were used. This includes also data from the NBUS where oxygen concentrations were lower than in the SBUS. NBUS observations are not further discussed within this work.
The mooring was deployed off Hondeklip Bay (17.02°E/30.64°S) and equipped with an oxygen and temperature sensor (Mini Dot Oxygen Sensor, MDO) and Hydrobios MST-12 sediment trap at 95 and 96 m, respectively (∼74 m above the sea floor). The mooring was recovered during a research cruise with the South African research vessel RS Algoa (ALG 269) in October 2020. The mooring recorded dissolved oxygen concentrations and seawater temperatures with a temporal resolution of 10 min (Figure 4). The Hydrobios MST-12 sediment trap was equipped with 12 sample bottles which were filled with a NaCl (35 g/l) and poisoned with HgCl2 (3.3 g/l) to prevent degradation of the trapped material. The sampling covered the period between March 2019 and May 2020 with an interval of 40 days. After recovery, the samples were shipped to Germany and, according to common sediment trap processing procedures, split into fractions of > and < 1 mm (Haake et al., 1993; Honjo et al., 2008). The > 1 mm fraction contained larger swimmers and the < 1 mm fraction was assumed to represent the gravitationally driven export of particles (= particle flux).
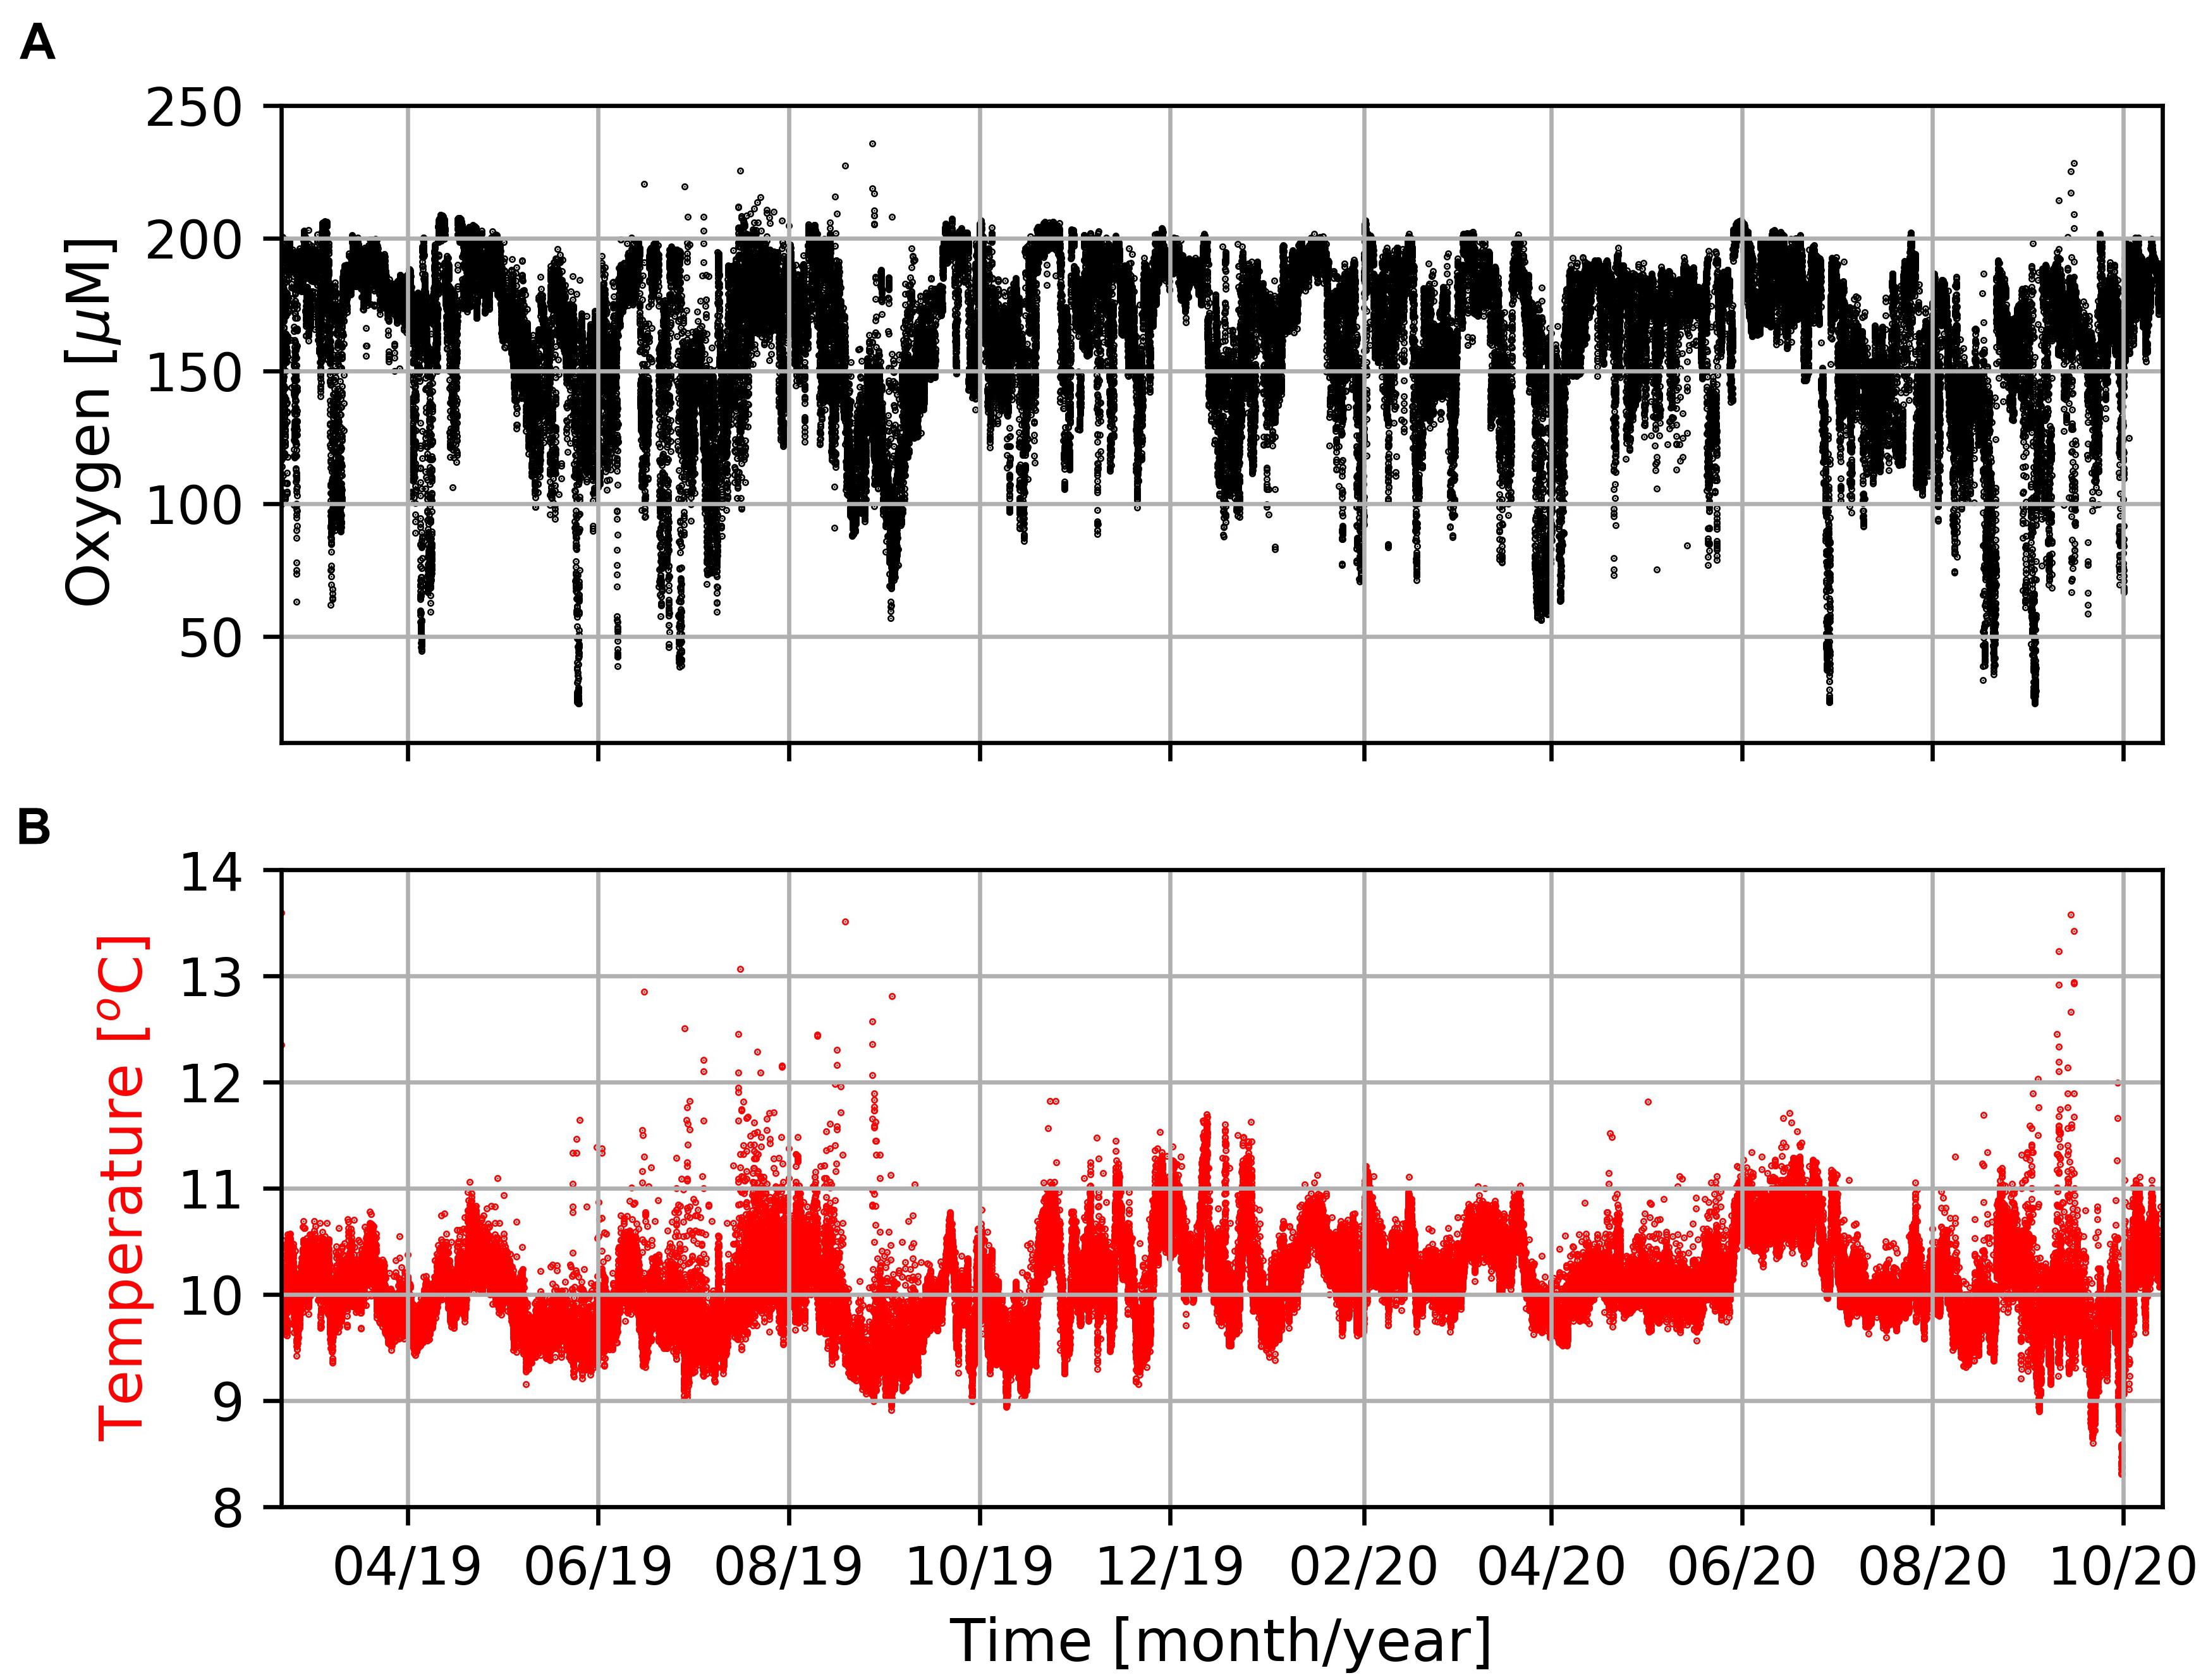
Figure 4. Concentrations of dissolved oxygen (A) and seawater temperature (B) measured by the MDO sensor at the mooring site (Figure 1) in a water-depth of 96 m during the entire period of observation.
Near real-time satellite-derived concentrations of chlorophyll a and sea surface temperature were obtained from CERSAT (Centre de Recherche et d’Exploitation Satellitaire) at IFREMER Plouzane (France) and CMEMS (Copernicus Marine Environment Monitoring Services), respectively, and used to identify oceanographic features during cruise M153 (Figure 1). Furthermore, satellite-derived sea surface temperature (SST) and primary production rates (PP) were and downloaded from the MODIS-Aqua website in August 20211 and the ocean primary production website in August 20202. These data sets cover the periods between 2002 and 2021 (MODIS-Aqua) as well as 2019 (ocean primary production) and were used to calculate monthly means and illustrate seasonal cycles. Therefore, SST and PP were averaged for an area of approximately ± 1° around the mooring site. Additionally, the one arc-minute global relief model data of the Earth’s surface (ETOPO1)3 were downloaded in August 2020 and used to map the 1000 m depth counter line in order to identify the shelf break (Figure 1).
Results and Discussion
Diurnal Cycle
CTD data obtained from station 7 exhibits well-oxygenated surface waters with oxygen concentrations of about 200 μM down to 80 m water-depth and hypoxic (oxygen concentrations < 63 μM; Vaquer-Sunyer and Duarte, 2008) bottom water OMZ with oxygen concentrations down to 50 μM at water-depths > 120 m (Figure 5). Between the well-oxygenated surface water (water-depth < 80 m) and the OMZ at water-depths > 120 m, emerged a pronounced mixing zone (water-depth between 80 and 120 m) in which the Mini Dot Oxygen Sensor was deployed.
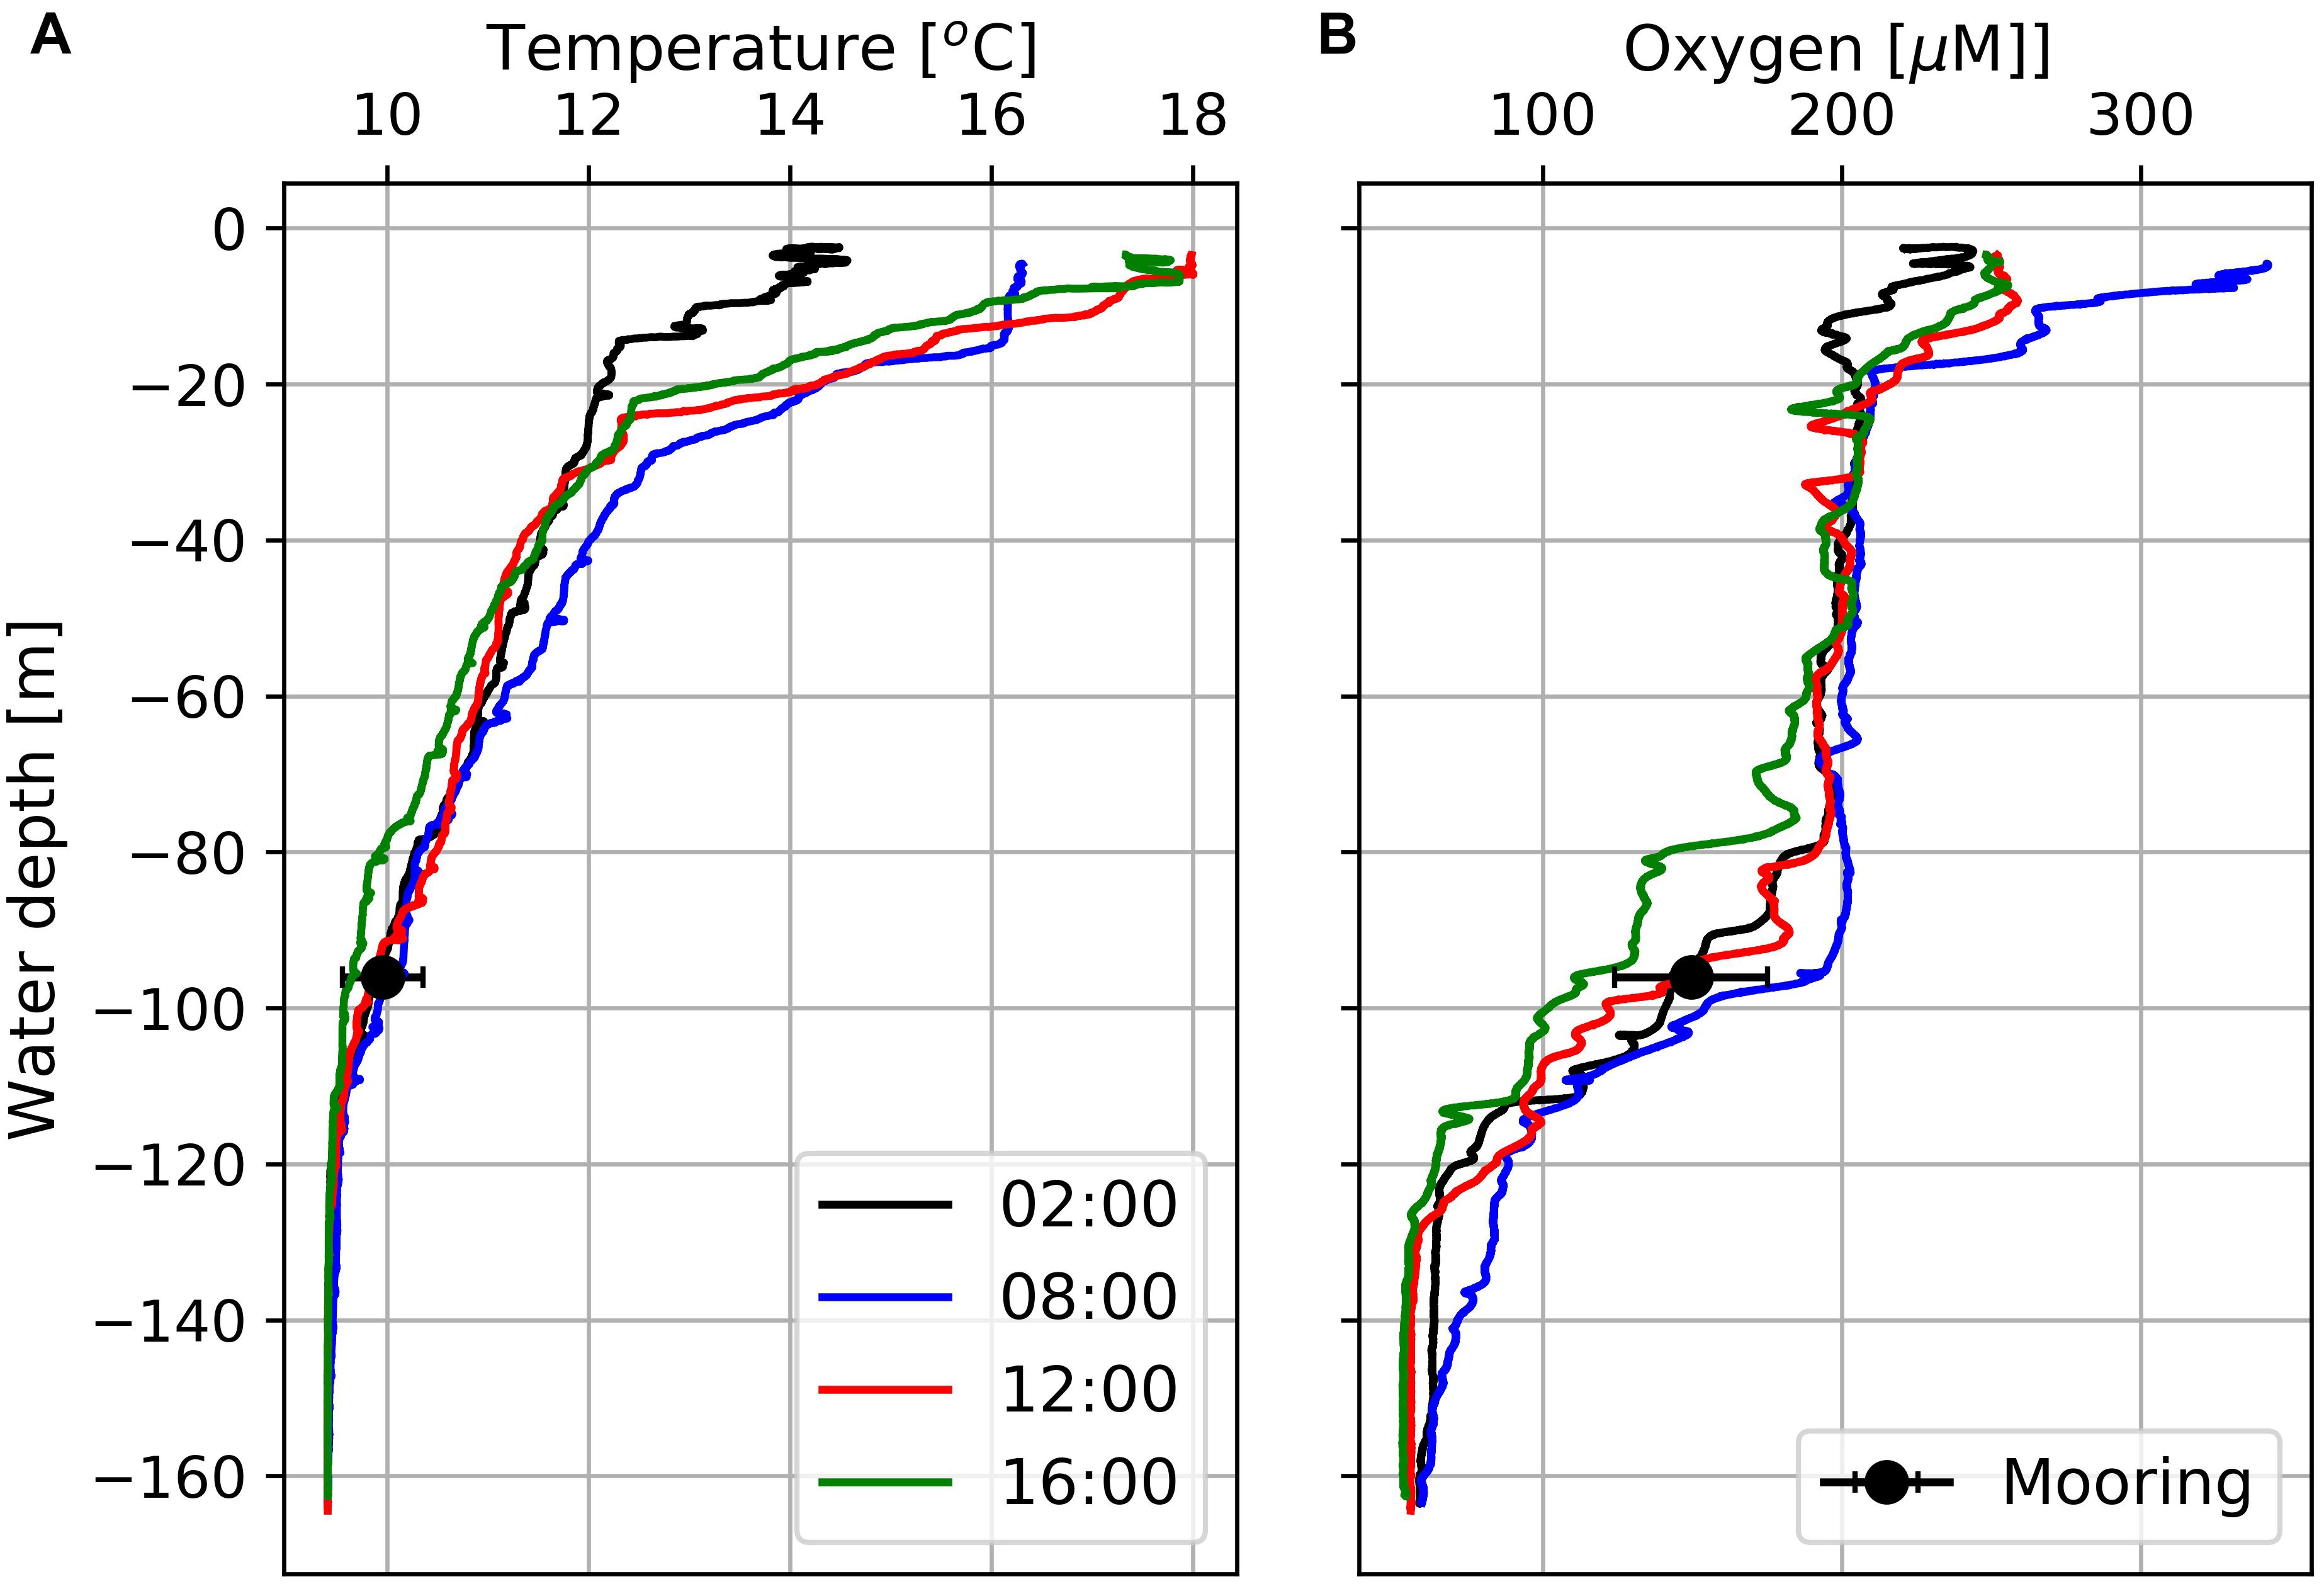
Figure 5. Temperature (A) and dissolved oxygen (B) profiles at Station 7 (Figure 1) obtained at four different times between February 18th and 19th, 2019. Black circles indicate daily mean temperatures and oxygen concentrations including standard deviations as derived from data measured by the deployed MDO sensor at a water depth of 96 m the day after the CTD casts.
The diurnal cycle affected the entire water-column including the OMZ. At the deployment depth (96 m) of the Mini Dot Oxygen Sensor and within the OMZ, temperature and especially oxygen concentrations reached their daily maxima at 9 o’clock in the morning and their minima during the late afternoon (Figures 5, 6). This implies an enhanced downward mixing of warm and well-ventilated surface waters, favored by late afternoon and night-time cooling and the resulting reduced stratification in surface waters. However, further south in St Helena Bay, time series observations within the upper 40 m in March 2011 showed that a diurnal cycle with deepening and shoaling of surface mixed layer during the night is not always present (Pitcher et al., 2014). There are days on which the establishment of a warm surface layer suppresses the diurnal cycle.
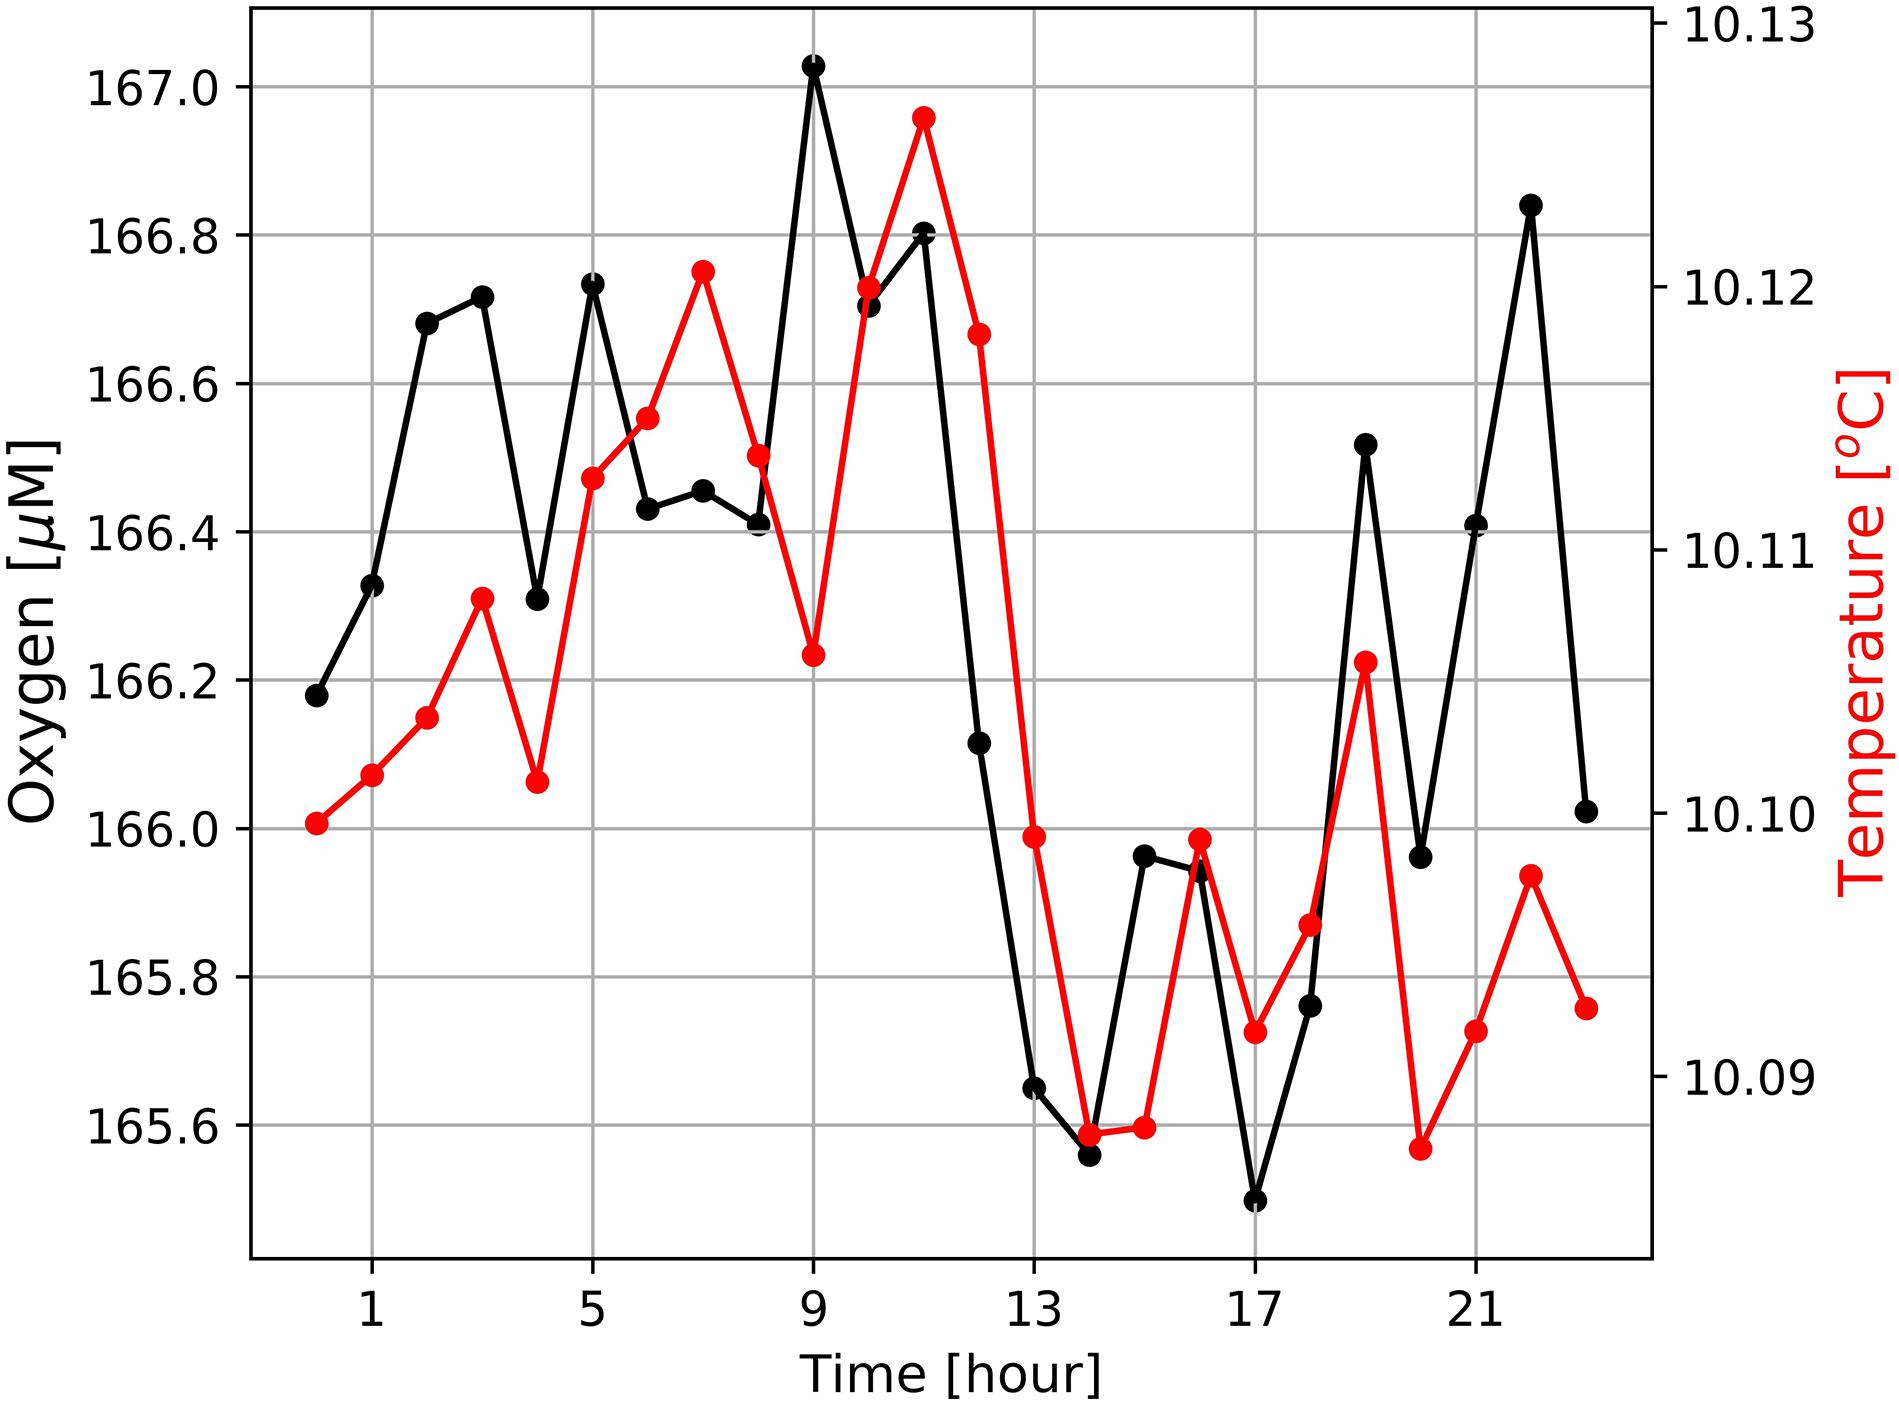
Figure 6. Diurnal cycles of dissolved oxygen and sea water temperatures at the mooring site (Figure 1) averaged over the entire period of observation from February 19th 2019 to October 13th 2020. Mean standard deviations of ± 24.5 μM (oxygen) and ± 0.45°C (temperature) are large and not shown as this would have masked the general trends.
In addition, data obtained from the Mini Dot Oxygen Sensor showed, that there are also periods, during which sea water temperatures followed their expected diurnal cycle, while oxygen concentrations frequently dropped by ∼100 μM (Figures 4, 7). During these periods, oxygen concentrations showed rapid and dramatic fluctuations, but subsequently stabilized at high levels (∼180–200 μM) after a couple of days. Figure 7 shows the occurrence of such a period during the first half of March 2019. Such periods point toward lateral isopycnal mixing during which oxygen depleted water from the coastal region propagates offshore along isopycnal surfaces. Daily Ekman Transport indices (Figure 7C), computed according to Lamont et al. (2018), indicated offshore transport (positive values) of waters throughout the first half of March 2019. The smallest offshore transport occurred on March 6th 2019 due to weaker upwelling-favorable winds on that day. However, much higher offshore transport during March 7th–11th, 2019, matched the period of low oxygen observed at the mooring (Figure 7A), supporting the interpretation that oxygen depleted waters from the coastal region were advected offshore during this period. Even though such events cause a high standard deviation (oxygen: ± 24 μM), on average over the period of observation the Mini Dot Oxygen Sensor data revealed higher temperatures and oxygen concentrations during the night and vice versa lower temperatures and oxygen concentrations during the day (Figure 6). This indicates that overall the enhanced night mixing is an important oxygen source to the SBUS OMZ.
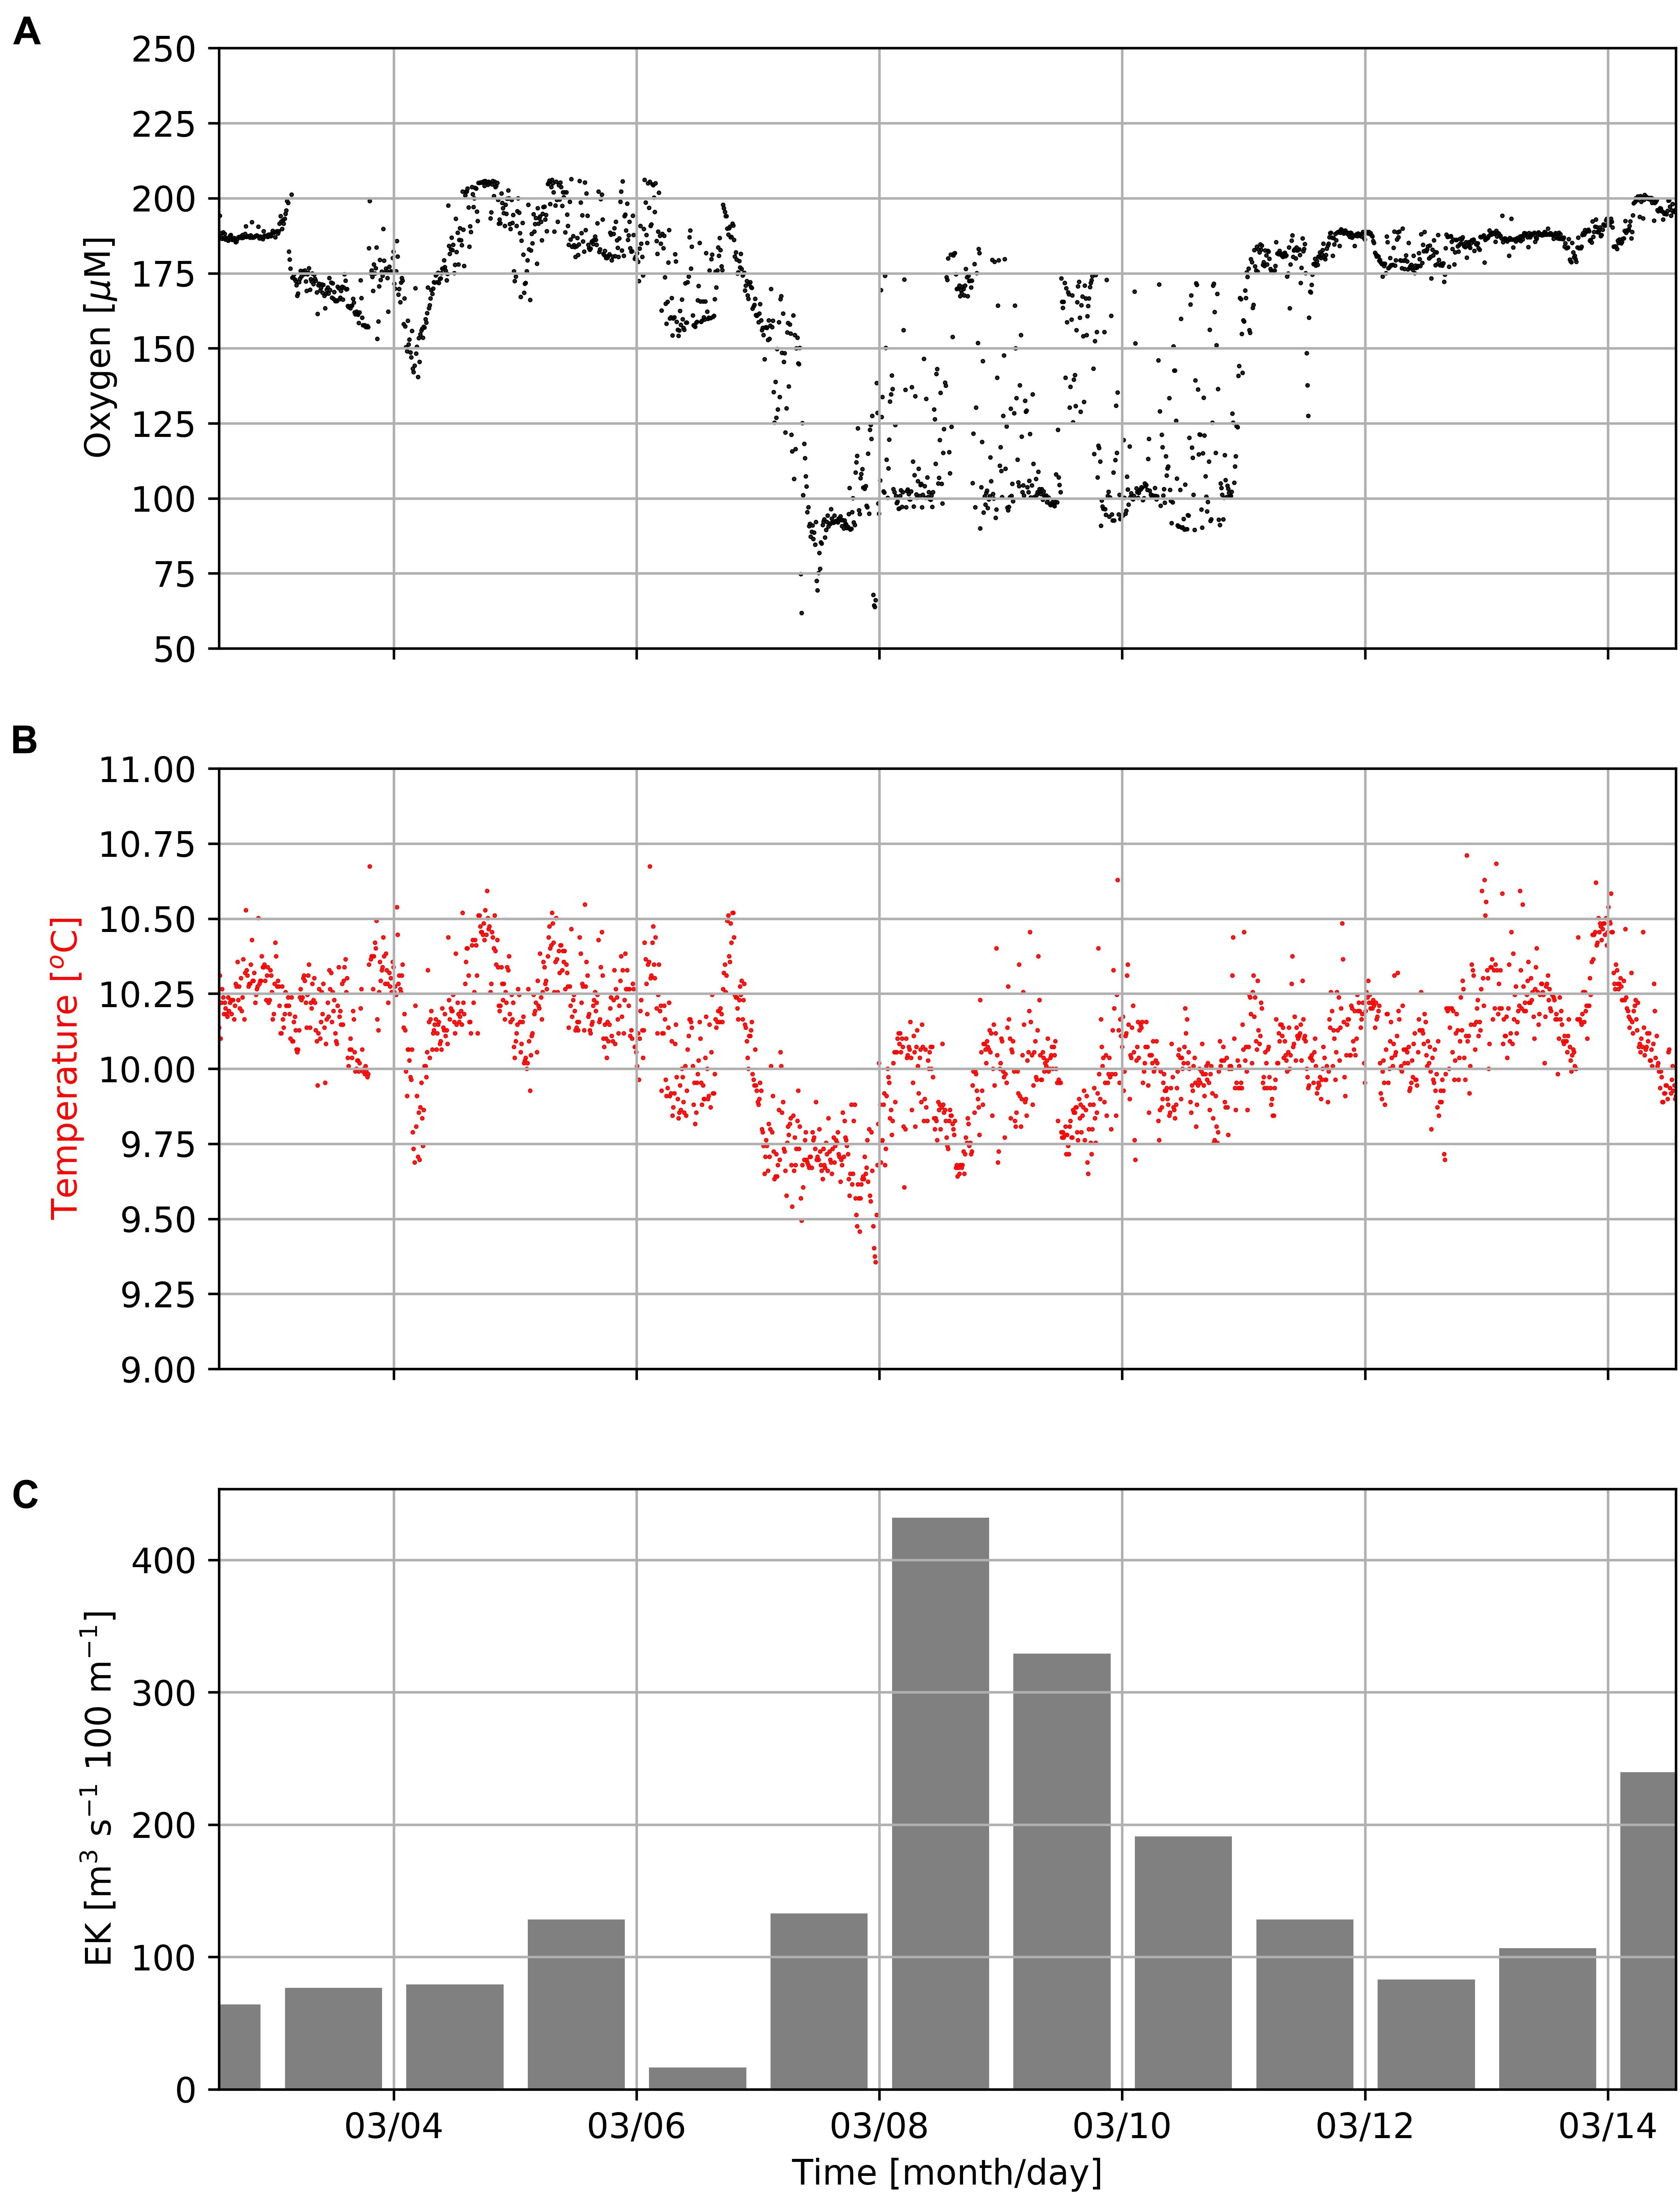
Figure 7. Concentrations of dissolved oxygen (A) and seawater temperature (B) measured by the MDO sensor at the mooring site (Figure 1) in a water-depth of 96 m as well as daily Ekman Transport indices (EK, C) as computed according to Lamont et al. (2018) during the first half of March 2019. Positive EK values indicate offshore transport.
Seasonality
On larger spatial and temporal scales satellite-derived primary production rates reflect the seasonally varying upwelling intensity with enhanced production rates during the summer and lower production rates during winter (Figure 8; Verheye et al., 2016). Our sediment trap data showed a similar seasonality. The obtained particle flux rate increased at the beginning of the upwelling season in September and decreased toward its end in February and March. The decrease of particle fluxes at high primary production rates between November and March might reflect an increasing offshore transport of plankton blooms and a decreasing nutrient trapping efficiency during the upwelling season. However, winter cooling and the associated enhanced vertical mixing might explain the slight increase in particle fluxes between April and June, particularly at the relatively shallow (96 m) mooring deployment location.
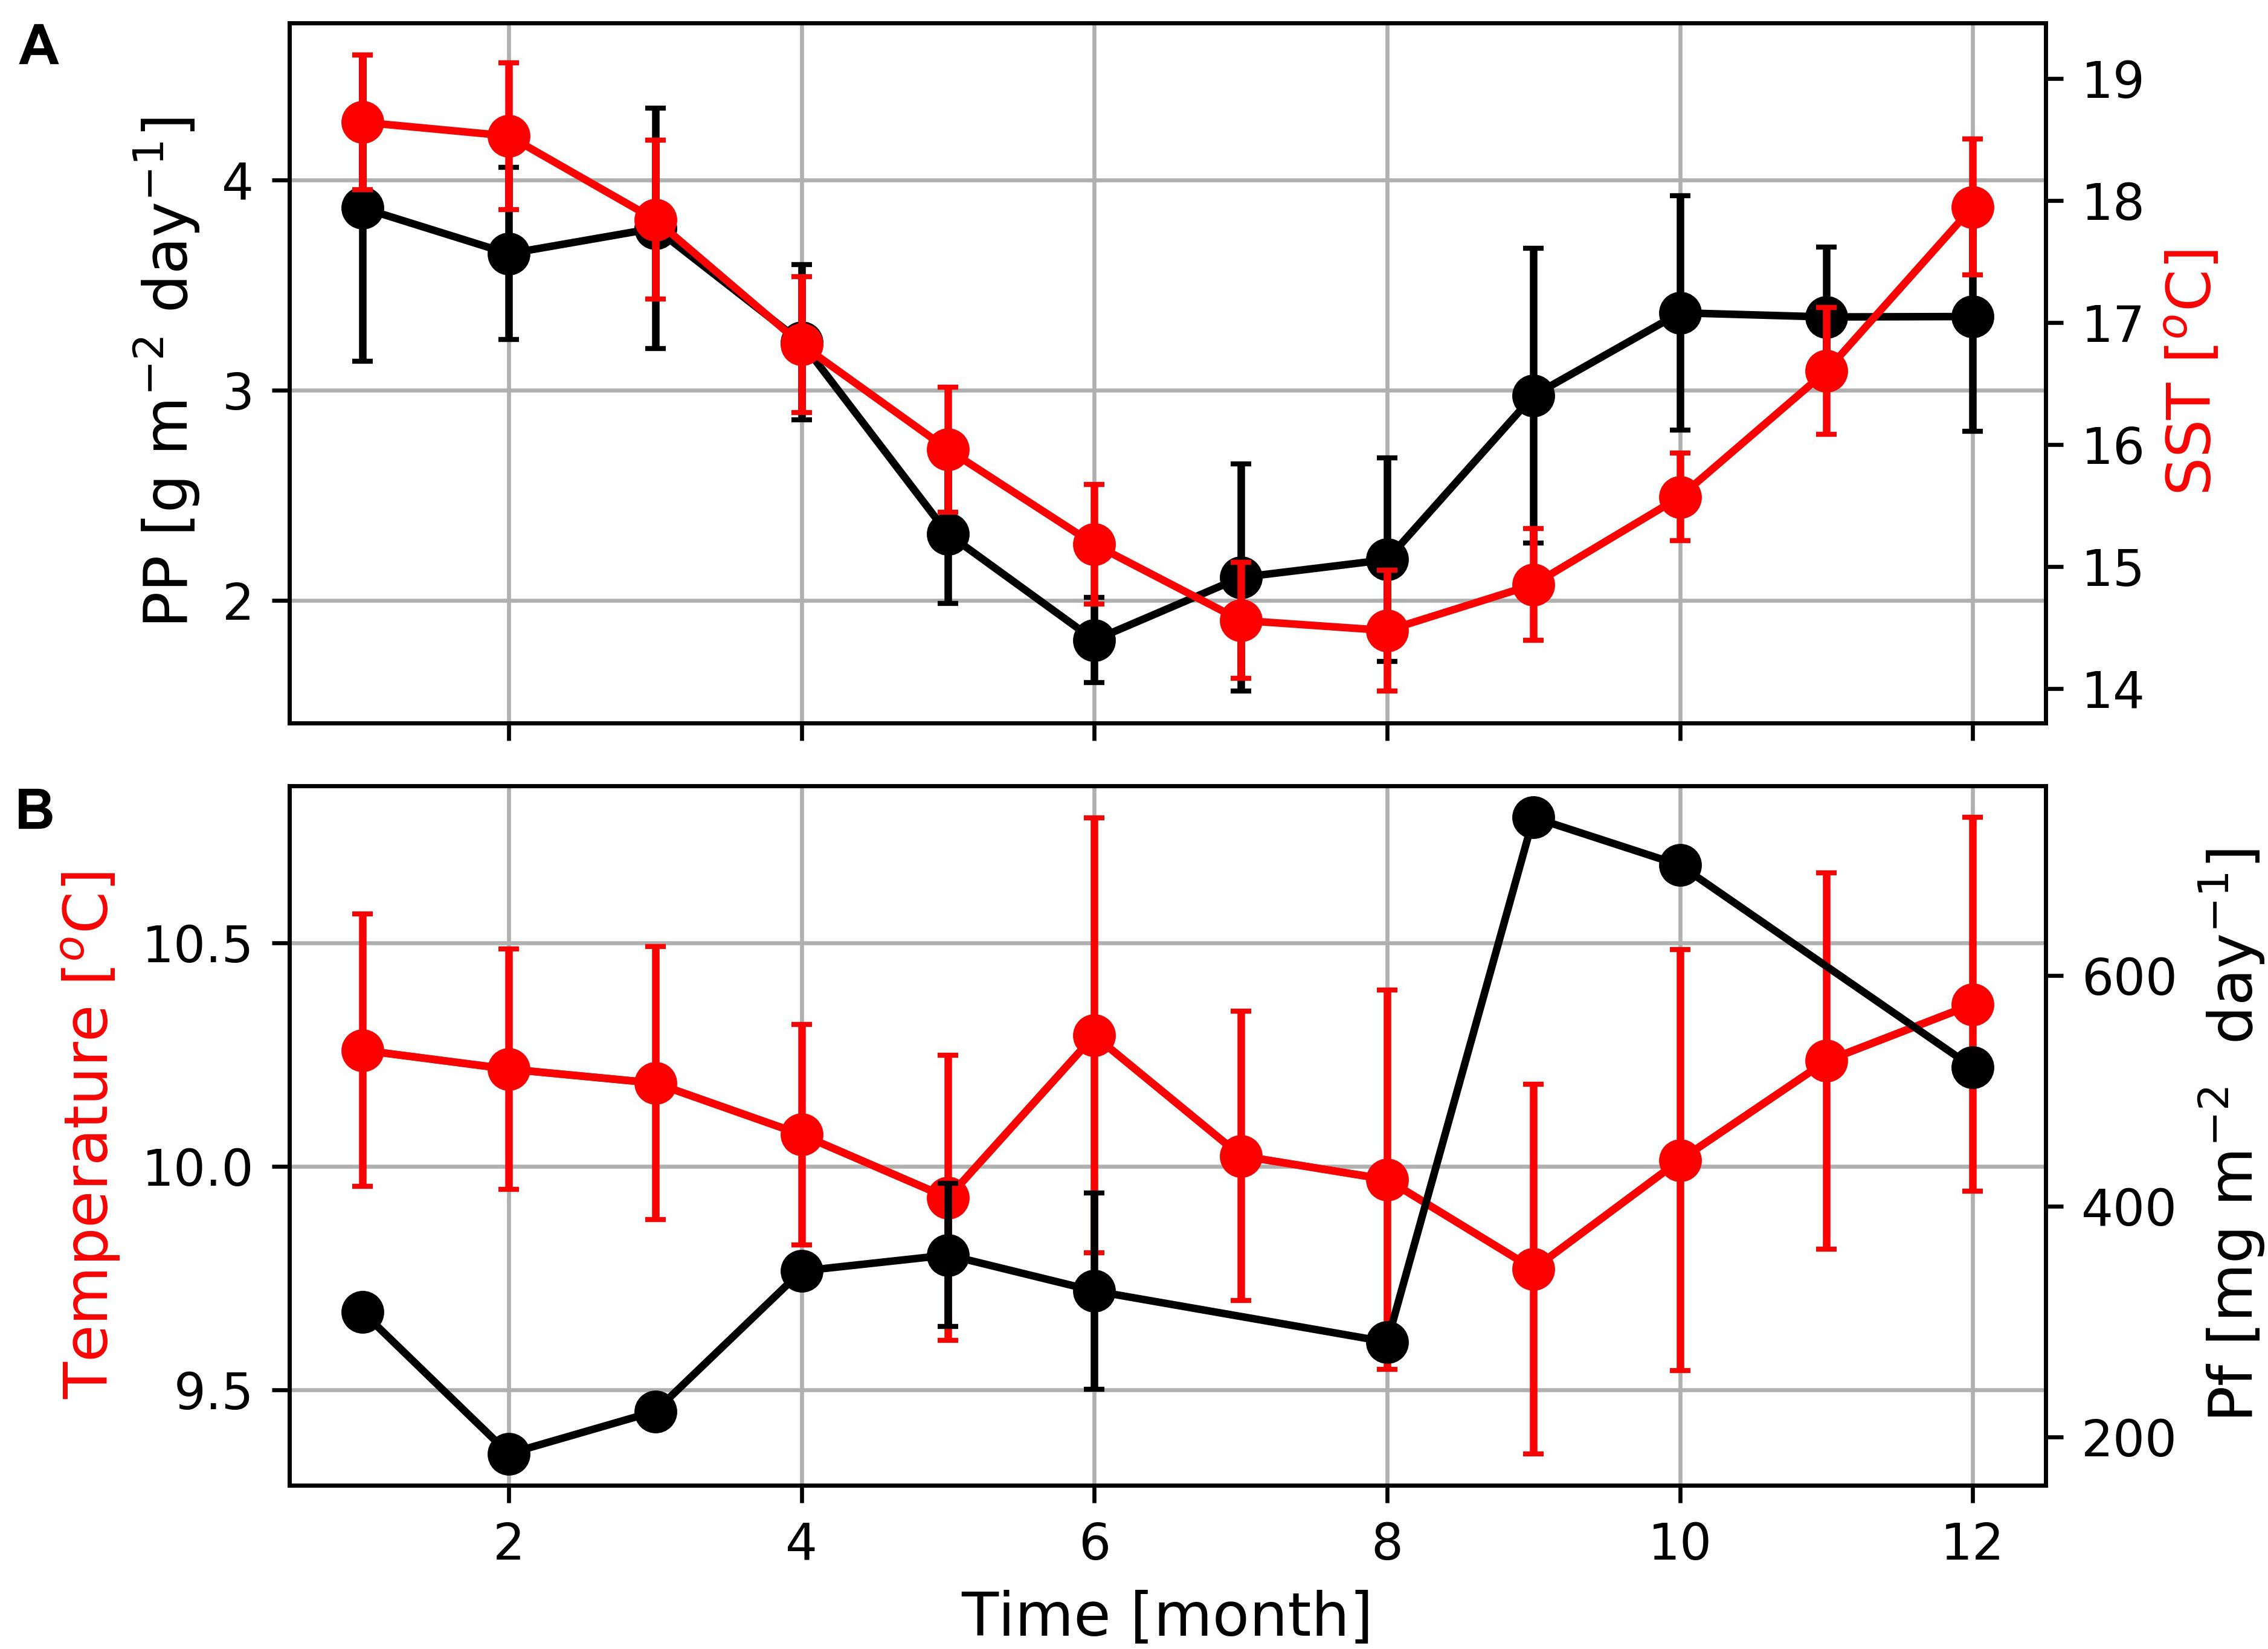
Figure 8. (A) Seasonal variations of primary production (PP) and sea surface temperatures (SST) at the mooring position as well as (B) mean seawater temperature and particle fluxes (PF) measured by the deployed MDO sensor and sediment trap. The absence of error bars indicates that only one data point was available due to long sampling of 40 days.
In contrast to expectations, but as also shown in earlier studies (e.g., Demarcq et al., 2003; Hardman-Mountford et al., 2003) summer warming and winter cooling rather than upwelling seem to dominate the seasonal satellite-derived SST cycle in the study region. Hence, SSTs are low in winter and high during the main upwelling season in summer (Figure 8A). Seawater temperatures recorded by the Mini Dot Oxygen Sensor generally follow the seasonal SST cycle, whereas winter cooling (between June and August) is more pronounced at the surface than at the deployment depth of the Mini Dot Oxygen Sensor (Figure 8B). This might be caused by the reversal of the surface current regime and development of the poleward current that carries warmer water southwards during this time of the year (Fawcett et al., 2008). However, upwelling of cold water is assumed to lower the amplitude of the seasonal SST cycle by decreasing sea water temperatures in summer (Demarcq et al., 2003; Hardman-Mountford et al., 2003) which according to in situ SST data even reversed the seasonal SST cycle in south close to Cape Columbine (Lamont et al., 2015). The Upwelling Front is, in turn, known to separate the cold and newly upwelled water close to the coast from older upwelled water on the shelf (Shannon and Nelson, 1996; Lamont et al., 2015).
Similar to the diurnal cycle, dramatic increases and decreases at the event-scale also mask the seasonal oxygen cycle at our sampling site. On average, the seasonal oxygen cycle followed the one seen in the seawater temperature with a minimum oxygen concentration in winter and a maximum oxygen concentration in summer (Figure 9). Oxygen concentrations measured further south in St Helena Bay, revealed an opposing pattern, which is inverse to the seasonal productivity and upwelling cycles (Pitcher et al., 2014; Lamont et al., 2015). Hence, lower productivity and lower biological oxygen consumption as well as stronger winter mixing increased oxygen concentrations in winter and vice versa, higher production and stronger stratification decreased oxygen concentrations in summer (Pitcher et al., 2014; Lamont et al., 2015). The opposing seasonal pattern measured by the Mini Dot Oxygen Sensor seems to be caused by the more frequent occurrence of periods of enhanced lateral mixing and the associated pronounced drops of oxygen in summer (Figure 9). However, it is important to note that since the mooring was deployed for only a relatively short period (February 2019 to October 2020), we are unable to make inferences on the reproducibility of this oxygen seasonal cycle from 1 year to the next. This stresses the need for continuous, long-term high temporal resolution observations to adequately capture the variability of environmental conditions.
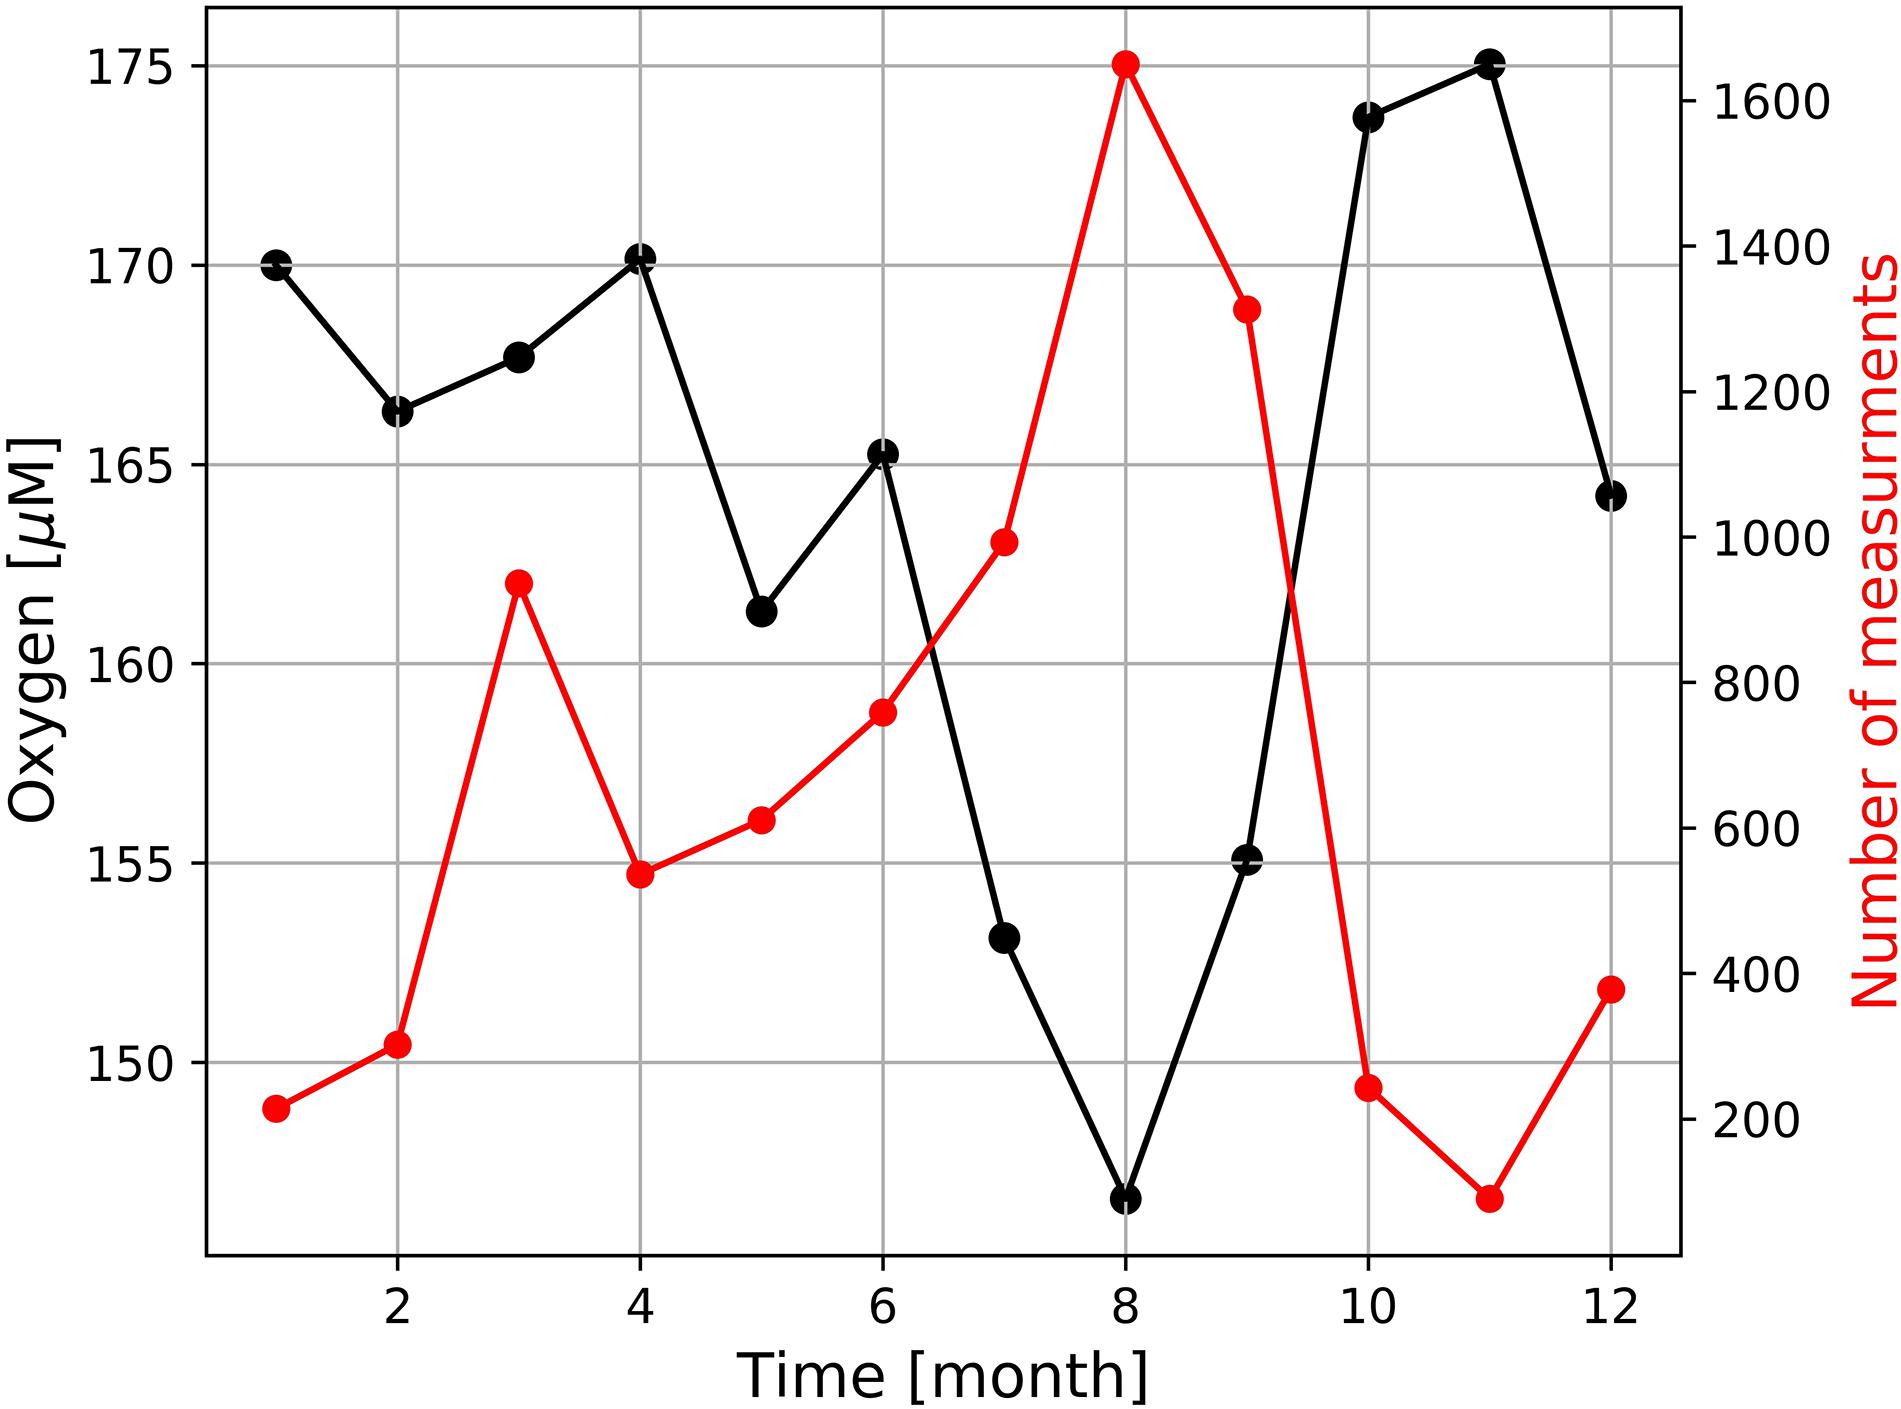
Figure 9. Seasonal variation of dissolved oxygen measured by the deployed MDO sensor and the number of measures at which oxygen concentration were < 120 μM.
Spatial Displacements
Oxygen values obtained by the high resolution TRIAXUS transect (Figure 1) showed hypoxic waters (oxygen concentrations < 63 μM) close to the coast, which were separated by a clear front from the better-ventilated water masses on the open shelf (Figure 10). Its nearly vertical position implies a strongly reduced exchange between oxygen poor coastal waters and the well-ventilated water masses on the open shelf. A comparison of the TRIAXUS to the South African Monitoring Line transects (Flynn et al., 2020) suggests that this is the Columbine Front. However, north of the St Helena Bay area the Columbine Front seems to merge with the Upwelling Front, trapping northward flowing oxygen poor waters in the shadow zone that emerges downstream Cape Columbine in summer (Shannon, 1985; Shannon and Nelson, 1996; Lamont et al., 2015). In order to map the location of the Upwelling Front during the cruise M153, we averaged the satellite-derived SSTs and considered the 17.2°C isotherm as indicator of the Upwelling Front (Figure 1A). This temperature represented the mean daytime sea surface temperature at the frontal zone as shown by the CTD cast at station 7 (Figure 5A). The ∼20°C isotherm in turn, almost followed the shelf break as indicated by the 1,000 m depth contour line and is assumed to mark the boundary between the upwelling region on the shelf and the open ocean.
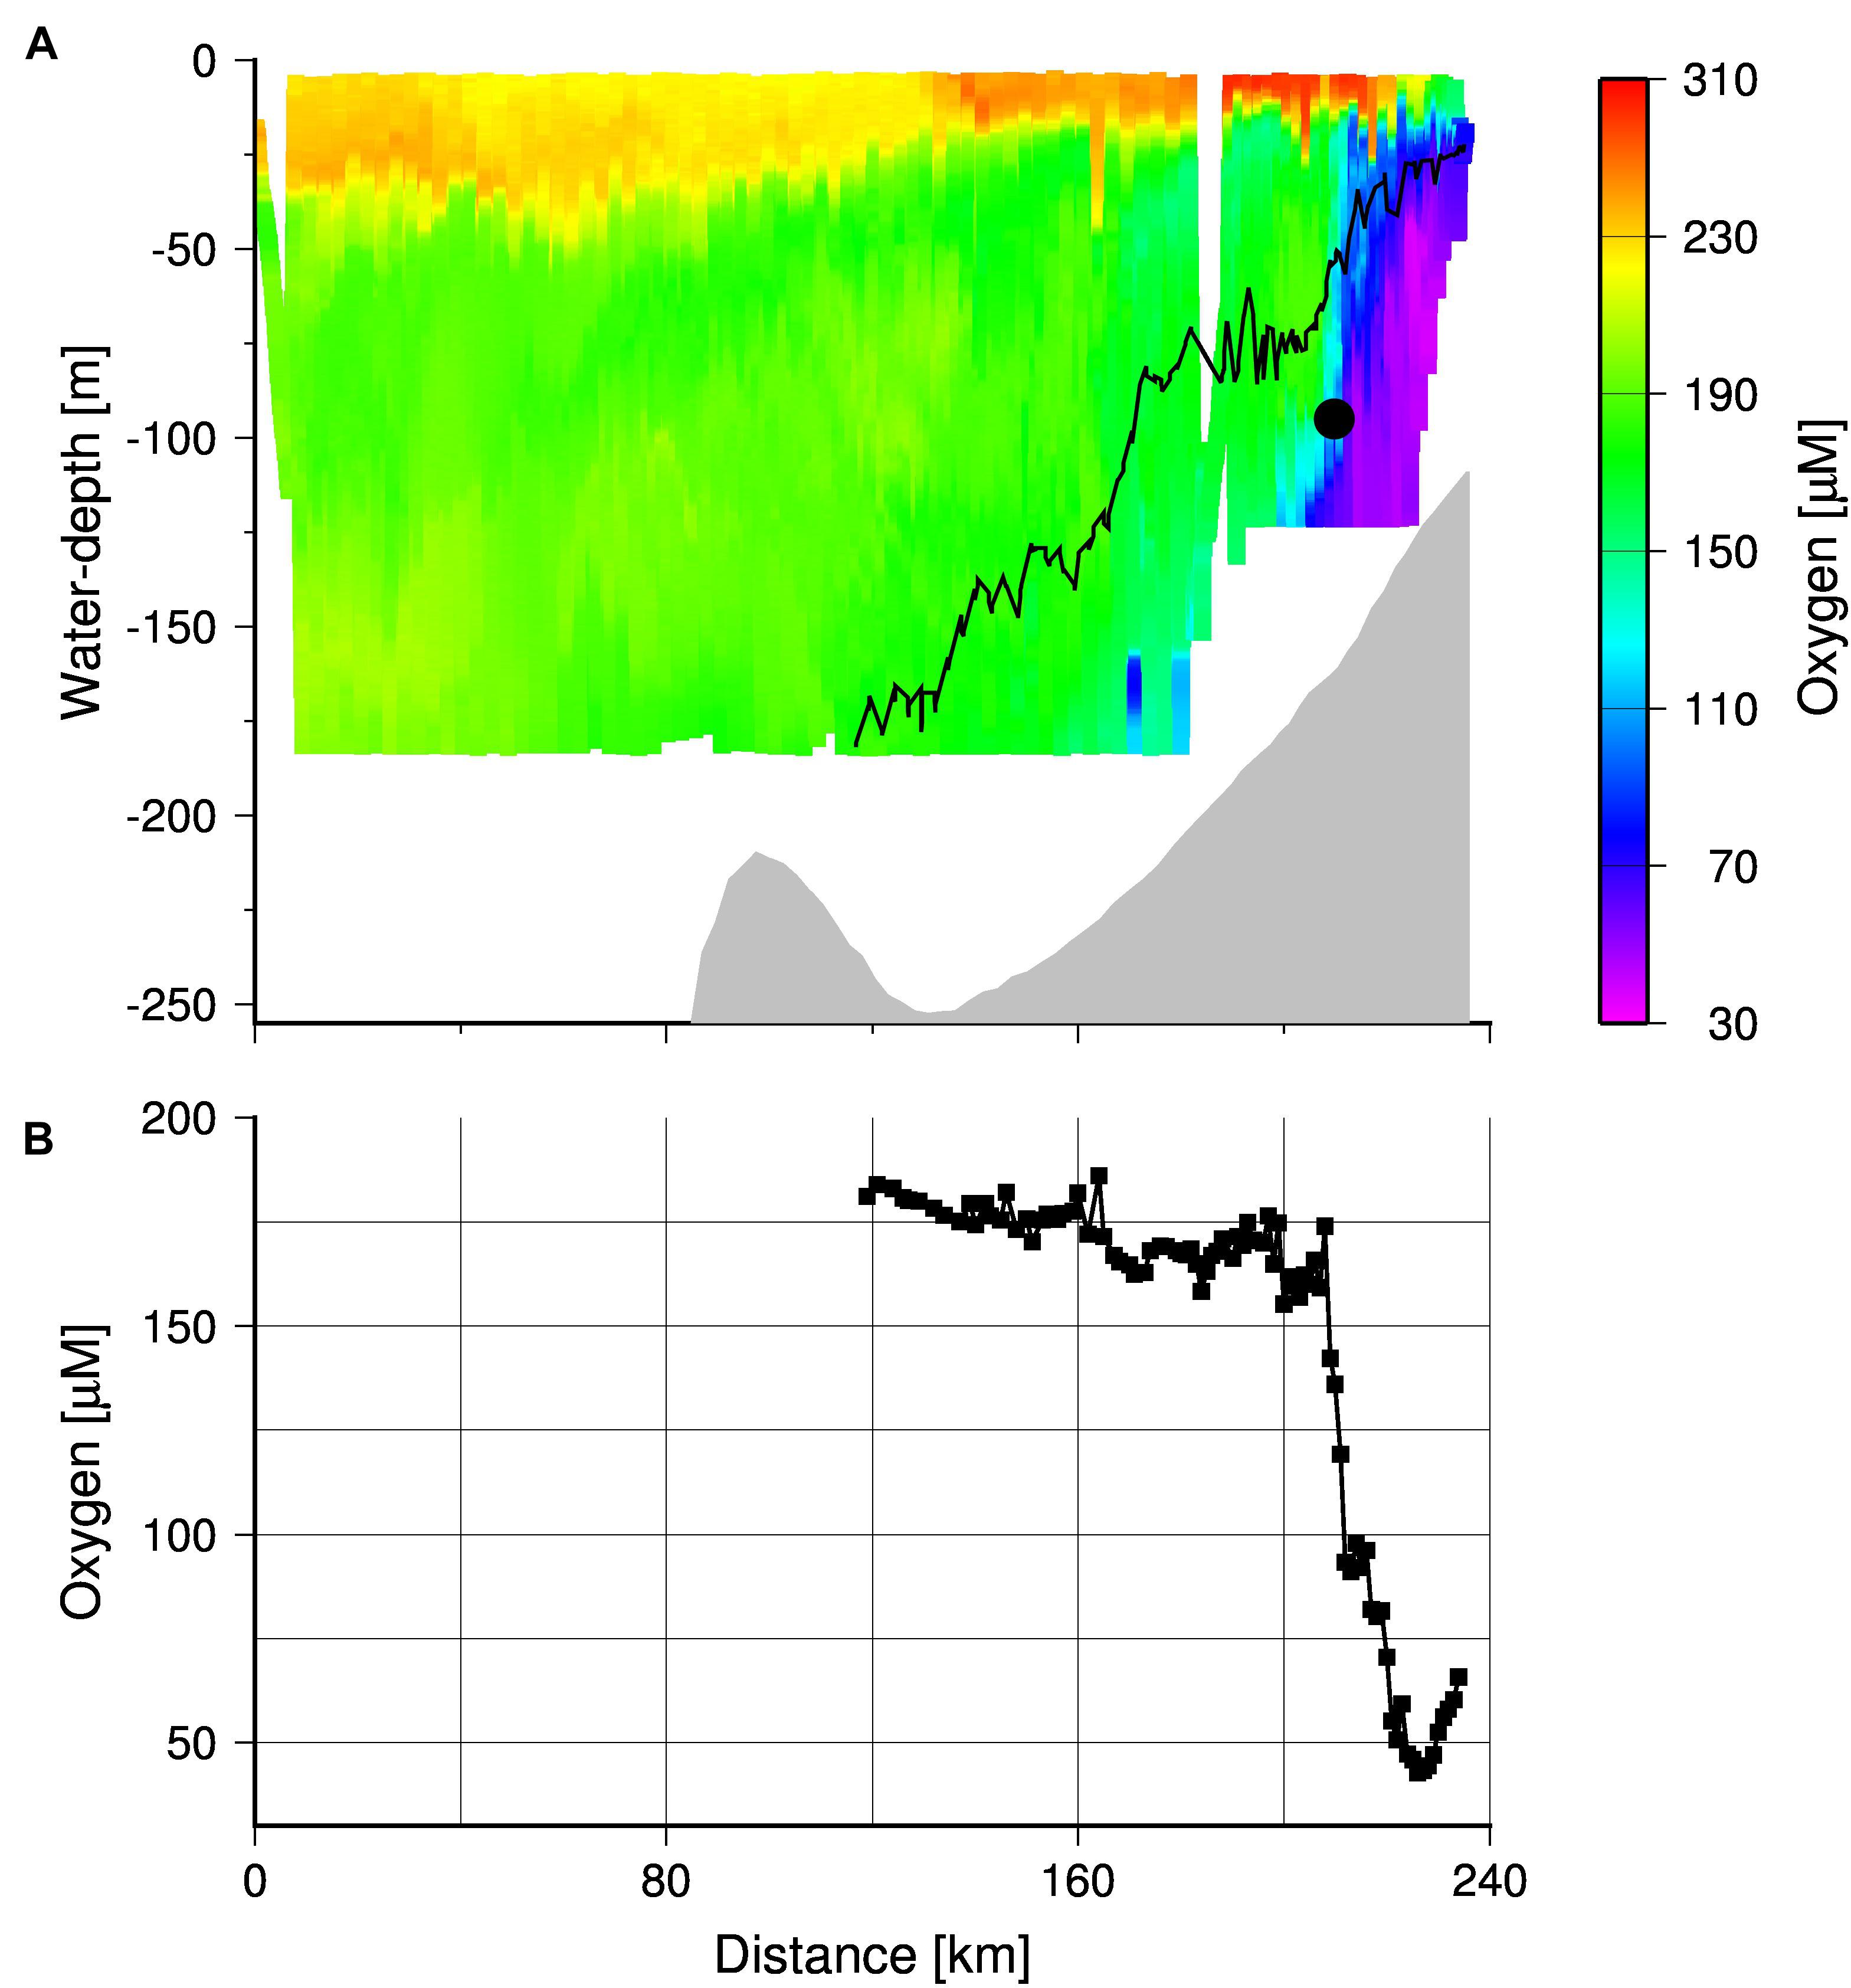
Figure 10. (A) TRIAXUS transect showing the cross-shelf distribution of dissolved oxygen. The gray shading the bottom and black contour line shows the density isopleth 26.6 kg m–3, which separates the MUW and SAMW. The black circle indicates the position of the MDO sensor. (B) Dissolved oxygen concentrations averaged within density range of 26.6–26.9 kg m–3 along the transect. The coast is located at kilometer 240.
However, during cruise M153 the Mini Dot Oxygen Sensor was placed almost directly into the Upwelling Front at a density horizon of 26.9, which is within the density range of the newly upwelled Sub-Antarctic Mode Water (∼26.6, Figure 10A). Within the density range between 26.6 and 26.9, the mean oxygen concentrations decreased sharply toward the coast with a minimum at the transect kilometer 226 where the mean oxygen concentrations dropped down to 40 μM (Figure 10B). This minimum value occurred only 15 km east of the Upwelling Front, which implies that only small spatial variations of the Upwelling Front are sufficient to explain the observed abrupt drops in oxygen concentrations as recorded by the Mini Dot Oxygen Sensor. The enhanced occurrence of these events at the end of winter (August) is in line with the generally lower oxygen concentrations (Figure 9) suggesting, in turn, a more unstable or non-existent Upwelling Front at this time of the year. The reversal and reorganization of the surface current regime, associated with minimal or no upwelling in winter, is assumed to cause the collapse of the Upwelling Front (Fawcett et al., 2008; Lamont et al., 2015) and as mentioned before, the occurrence of the warm poleward current during this time of the year supports this view.
Nutrient Trapping
Due to the opposing effects of nutrient trapping on the oxygen and nutrient concentrations, nitrate concentrations measured by the TRIAXUS were high (Figure 11B) where oxygen concentrations were low (Figure 10). Hence, both the enhanced accumulation of nitrate and low oxygen concentrations between Upwelling Front and the coast reflects the efficient nutrient trapping. The low exchange across the Upwelling Front, as indicated by its vertical structure, sets a precondition for the nutrient trapping by reducing or even preventing cross-shelf export of nutrients during the main upwelling season. Consequently, decreasing oxygen concentrations in summer show an enhanced nutrient trapping which increases the impact of upwelling on the productivity during the upwelling season. In winter, increasing oxygen concentrations (Pitcher et al., 2014; Lamont et al., 2015) in line with the collapse of the Upwelling Front as discussed before implies a reset of the system, which re-establishes with the development of the Upwelling Front at the beginning of the following upwelling season. According to our sediment trap data from 2019, this started with an increase in particle fluxes followed by a decrease as discussed before (Figure 8).
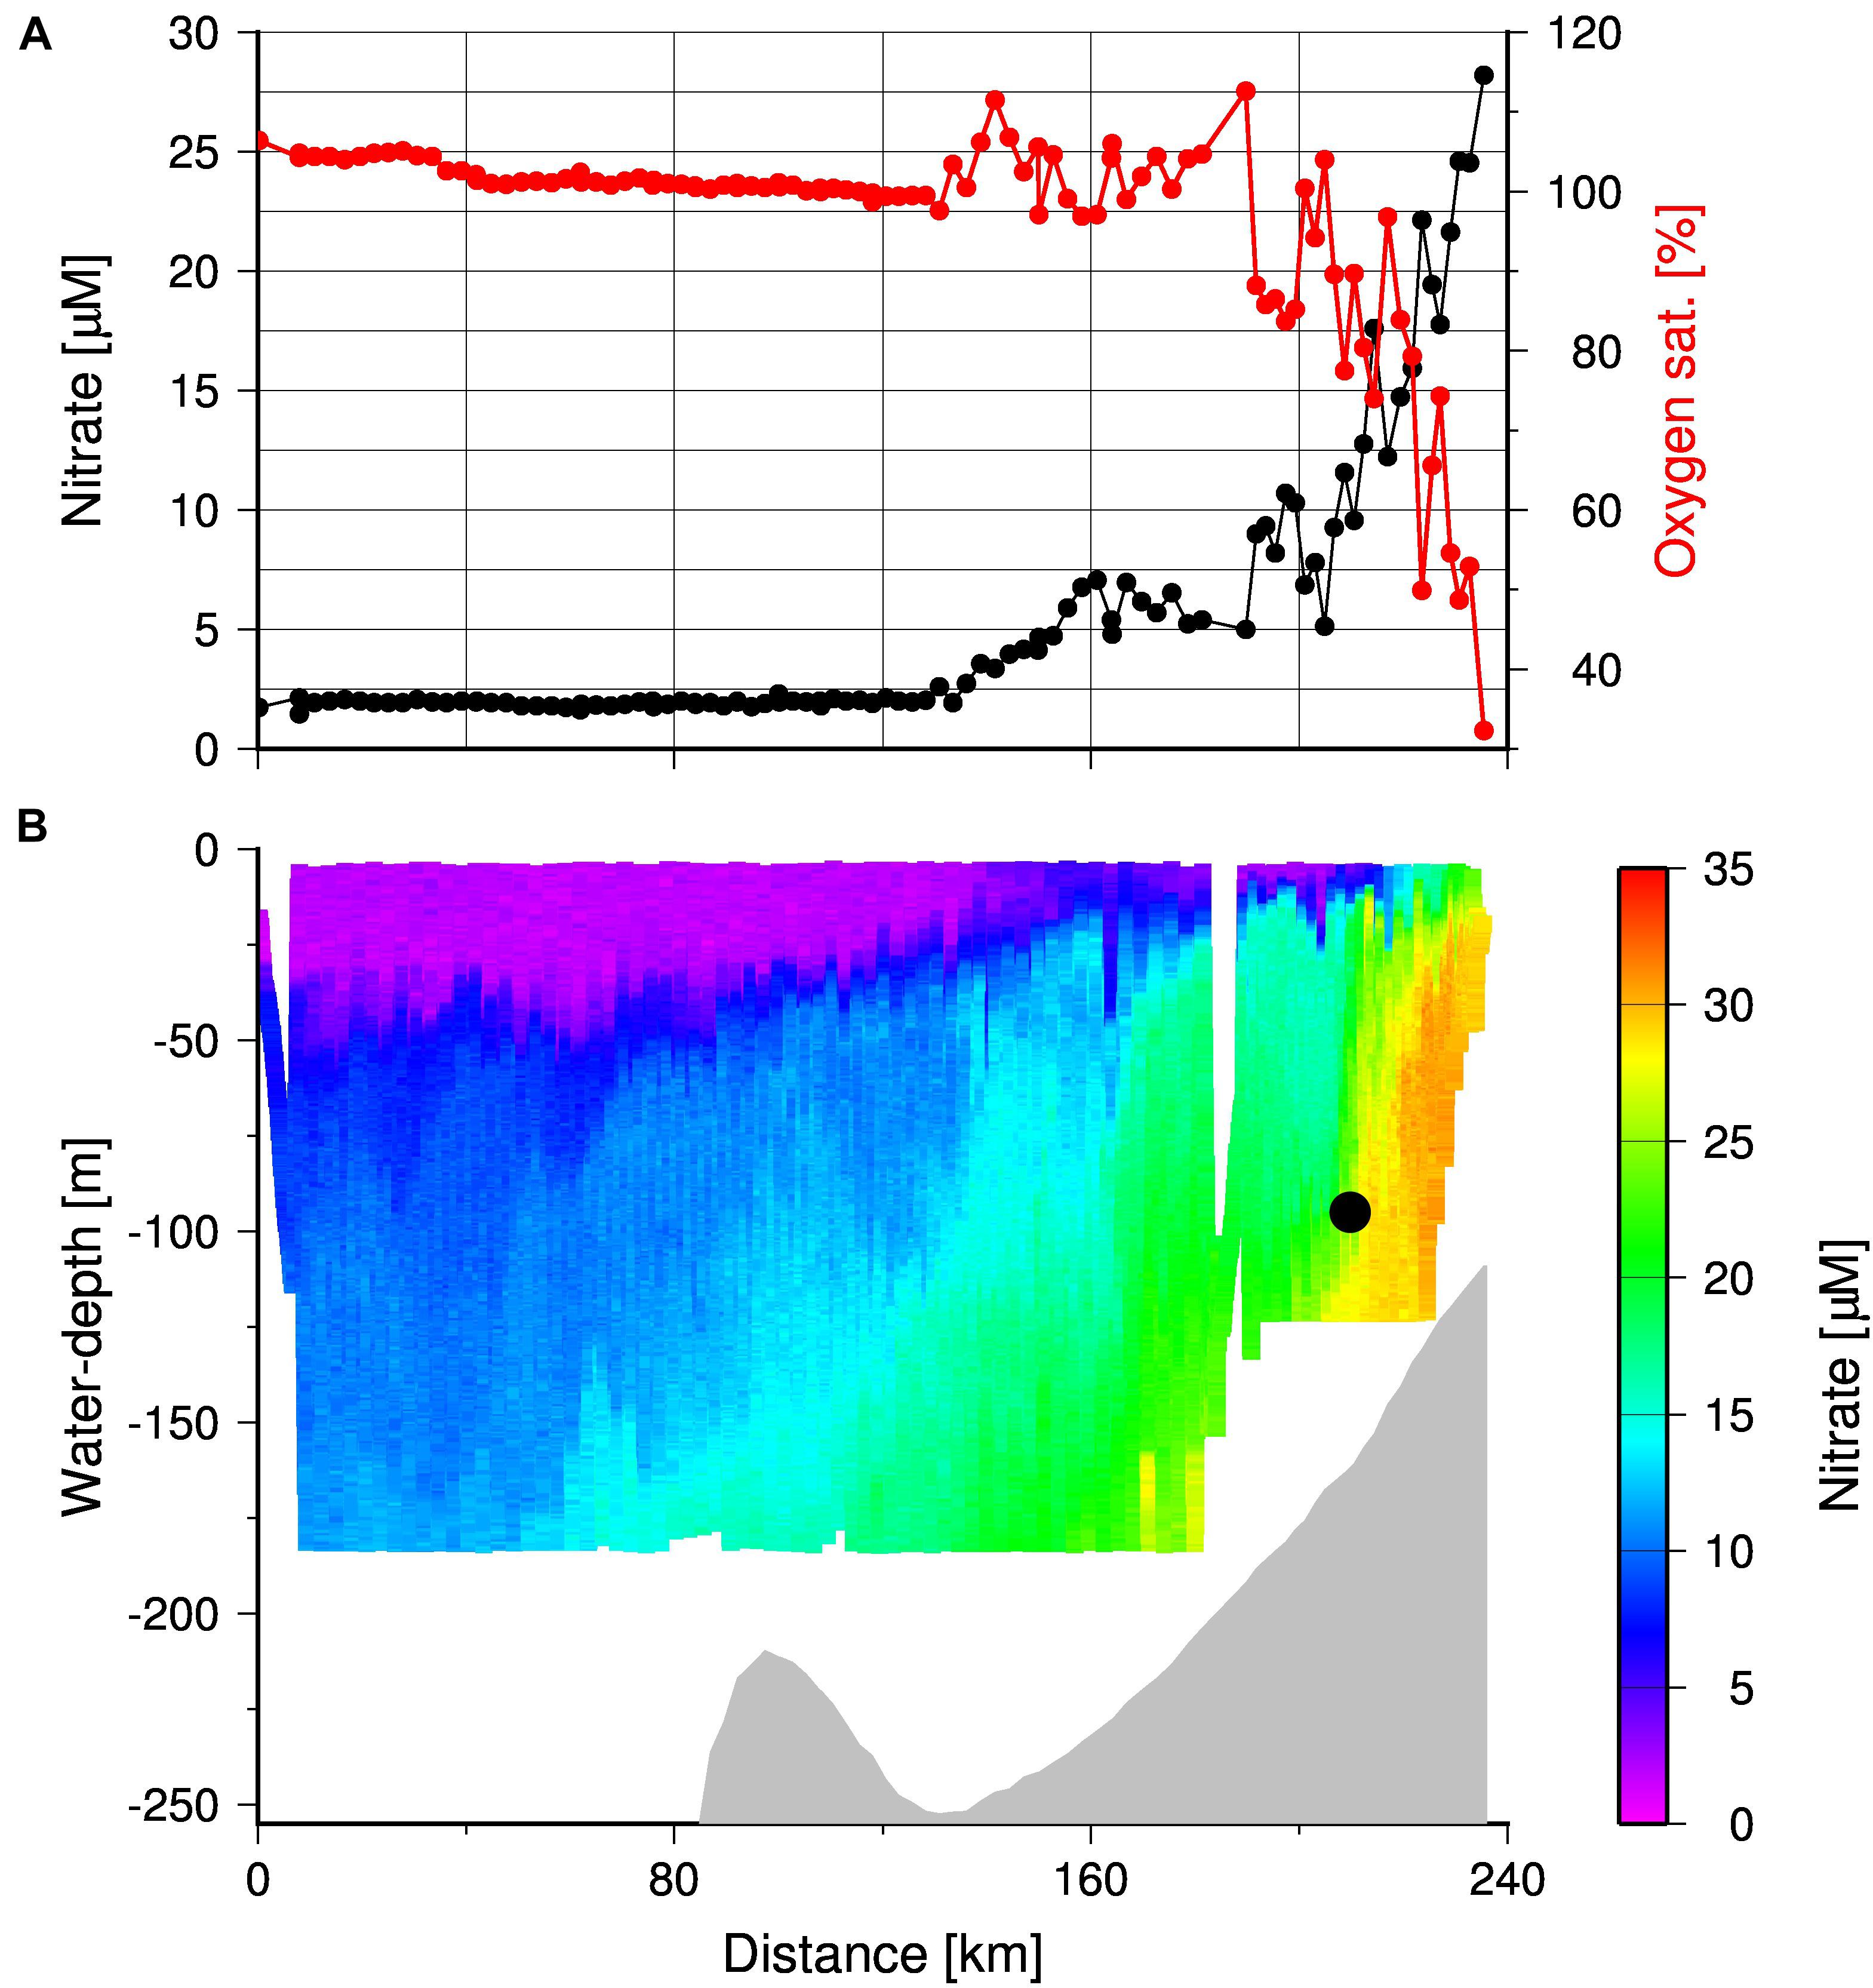
Figure 11. (A) Oxygen saturation and nitrate concentrations in surface waters (water-depth < 10 m) and (B) TRIAXUS transect showing the cross-shelf distribution of nitrate in the entire water column down to water-depth of 180 m. The gray shading indicates the bottom and the black circle indicates the position of the MDO sensor.
During the cruise M153 at the end of the upwelling season in 2019, upwelling was still active as shown by the positive Ekman Transport values, as well as the occurrence of oxygen-poor and nitrate-enriched subsurface water near the coast. The offshore decrease in surface nitrate and the enrichment of oxygen indicated autotrophic conditions (Figure 11A). However, the gradients in nitrate and oxygen were strongest between the Upwelling Front and the coast. Beyond the Upwelling Front, nutrient availability and consumption decreased until nitrate was depleted and surface waters were oxygen saturated, around the 135 km distance along the transect (i.e., 105 km from the coast). The change in nutrient consumption was also reflected in satellite-derived chlorophyll concentrations with a decrease from > 2.5 to < 2.0 mg m–3 at the mooring position (Figure 1). This implies a high inshore and low mid-shelf production due to decreasing nutrient concentrations in offshore advecting surface waters. Organically bound nutrients exported from this low productive mid-shelf system will be introduced into the Cape Jet or even into the Benguela Current, which increases the probability of their export out of the SBUS. Vice versa, nutrients are efficiently trapped within the high productive inshore system and increase the impact of upwelling on the productivity during the upwelling season. Since this is associated with decreasing oxygen concentrations, it increases the vulnerability of the inshore nutrient trapping system to anoxia. Coastally trapped red tides, which develop at the end of the upwelling season, could accordingly be the straw that breaks the camel’s back, as their decay would rapidly consume any remaining oxygen at the end of the upwelling season. These events are usually very short-lived and individually do not appear to have a detectable long-term impact on the intensity of the OMZ in the SBUS (Pitcher et al., 2014). However, numerous studies have predicted that the frequency of red tide occurrences would increase as a result of overall warming and increased stratification, and that such conditions would favor dinoflagellates (usually associated with red tides) over other phytoplankton (Moore et al., 2008).
Feedback on the Oxygen Minimum Zone
Global warming and the resulting reduced solubility of oxygen in water is assumed to be a dominant process causing the intensification of OMZs in other major upwelling systems (Rixen et al., 2020 and references therein). It affects the physical oxygen supply along with the Sub-Antarctic Mode Water but should also strongly influence the local oxygen supply in the SBUS. The general positive correlation between oxygen concentration and temperature as also shown by Pitcher et al. (2014) suggests that downward mixing of well-ventilated and warmer surface water, is a dominant physical oxygen supply mechanism in the SBUS OMZ. Hence, a warming should have lowered the oxygen supply. The postulated intensification of upwelling and associated changes in the plankton composition could have balanced such an expected trend by lowering the nutrient trapping efficiency. A stronger offshore transport of plankton blooms could cause this, which in turn could be a consequence of more intense upwelling favorable winds as well as smaller and slower sinking particles due to decreasing plankton sizes and abundances of fecal pellets produced by zooplankton.
Conclusion
In line with data obtained from the literature, our data indicate that the Upwelling Front strongly reduces the cross shelf exchange and traps northward flowing waters in a shadow zone that emerged downstream of Cape Columbine in summer during the main upwelling season. Nevertheless, the SST seasonality is more strongly modulated by the seasonal cycle of solar insolation, with warming in summer and cooling in winter whereas upwelling of cold water reduces its amplitude by lowering water temperatures in summer. In the south around Cape Columbine this even reversed the seasonal SST cycle as indicated by in situ data. However, the pronounced Upwelling Front separates coastally trapped hypoxic waters from the still better-ventilated shelf waters west of the Upwelling Front, even though an increased stratification in association with enhanced export and decay of offshore advecting upwelling-driven plankton blooms decrease oxygen concentrations on the entire shelf in summer. High nitrate concentrations associated with the low oxygen concentrations and a rapid nutrient consumption in surface waters between the Upwelling Front and the coast indicate an efficient nutrient trapping. It explains the high upwelling-driven productivity and the preferential occurrence of anoxic events toward the end of the upwelling season in the SBUS. However, in winter, a weakening or even a collapse of the Upwelling Front favors the cross shelf exchange, which in addition to a reduced winter stratification and a lower productivity increases the ventilation of the coastally trapped waters. This reduces the risk of anoxia, which again gains momentum with the development of Upwelling Front at the beginning of following upwelling season. The proposed future intensification of upwelling and the observed changes in the ecosystem structure could reduce the nutrient trapping efficiency by favoring the advection of plankton blooms offshore across the Upwelling Front and even the Shelf Break Front. The resulting lower biological oxygen consumption on the shelf could mask the de-oxygenation trend that has been observed in other OMZ including those in the NBUS. Hence, the nutrient trapping efficiency appears to be a key element mitigating, so far, global change impacts on the SBUS and explains differing responses of upwelling systems to global change as seen e.g., in the comparison between the SBUS and NBUS. Underlying mechanisms seem to be the topographically steered and therewith locally varying physical boundary conditions and their influence on the development of frontal zones and the supply of upwelling feed waters as well as biogeochemical response to these boundary conditions. However essential biogeochemical processes, which in addition to physical boundary conditions control the nutrient trapping efficiency such as the export of organic carbon from offshore advecting plankton blooms and its decay in the water column, are still poorly understood. This in addition to the lack of long-term observations stresses the need for further studies in order to better understand the response of Eastern Boundary Upwelling Systems to global change.
Data Availability Statement
The datasets presented in this study can be found in online repositories. The names of the repository/repositories and accession number(s) can be found below: https://doi.org/10.1594/PANGAEA.935648.
Author Contributions
TR, NL, TL, and KP designed the mooring experiment. RK, BM, and JvB conducted the TRIAXUS operations. LM and CS analyzed the data and samples obtained from the mooring. TL additionally evaluated satellite data. TR led the writing of the manuscript. All authors discussed the results and contributed to the writing of the manuscript.
Funding
This research was funded by the German Federal Ministry of Education and Research (BMBF) under the grant no. 03F0797A (ZMT) and 03F0797C (Universität Hamburg).
Conflict of Interest
The authors declare that the research was conducted in the absence of any commercial or financial relationships that could be construed as a potential conflict of interest.
Publisher’s Note
All claims expressed in this article are solely those of the authors and do not necessarily represent those of their affiliated organizations, or those of the publisher, the editors and the reviewers. Any product that may be evaluated in this article, or claim that may be made by its manufacturer, is not guaranteed or endorsed by the publisher.
Acknowledgments
We would like to thank all scientists, technicians, captains and crew members of the German and South African research vessels Meteor and Algoa for their support during the cruises M153 and ALG 269. In particular, we are very grateful to the DFFE mooring team, led by TL and Mr. Marcel van den Berg, for successful recovery of the mooring during the RS Algoa cruise ALG269. André and Rachel Harmer are acknowledged for their support during the TRIAXUS deployments and we are also very grateful to F. Hüge and M. Birkicht for analyzing the nutrient samples. All calculations were executed with the Python software and generic mapping tools (GMT) was used to produce Figures 1, 10, 11.
Footnotes
- ^ https://oceandata.sci.gsfc.nasa.gov/directaccess/MODIS-Aqua/Mapped/Monthly/4km/sst/
- ^ http://www.science.oregonstate.edu/ocean.productivity/
- ^ https://www.ngdc.noaa.gov/mgg/global/relief/ETOPO1/data/ice_surface/grid_registered/netcdf/
References
Bailey, G. W. (1991). “Organic carbon flux and development of oxygen deficiency on the modern Benguela continental shelf south of 22°S: spatial and temporal variability,” in Modern and Ancient Continental Shelf Anoxia, eds R. V. Tyson and T. H. Pearson (London: Geological Society), 171–183. doi: 10.1144/gsl.sp.1991.058.01.12
Bailey, G. W., and Chapman, P. (1985). “The nutrient status of the St Helena Bay region in February 1979,” in South African Ocean Colour and Upwelling Experiment, ed. L. V. Shannon (Cape Town: Sea Fisheries Research Institute), 125–145.
Barange, M., and Pillar, S. C. (1992). Cross-shelf circulation, zonation and maintenance mechanisms of Nyctiphanes capensis and Euphausia hanseni (Euphausiacea) in the northern Benguela upwelling system. Cont. Shelf Res. 12, 1027–1042. doi: 10.1016/0278-4343(92)90014-b
Barlow, R., Lamont, T., Mitchell-Innes, B., Lucas, M., and Thomalla, S. (2009). Primary production in the Benguela ecosystem, 1999 – 2002. Afr. J. Mar. Sci. 31, 97–101. doi: 10.2989/ajms.2009.31.1.9.780
Broecker, W. S., Takahashi, T., and Takahashi, T. (1985). Sources and flow patterns of deep-ocean waters as deduced from potential temperature, salinity, and initial phosphate concentration. J. Geophys. Res. 90, 6925–6939. doi: 10.1029/jc090ic04p06925
Carr, M.-E. (2001). Estimation of potential productivity in Eastern boundary currents using remote sensing. Deep Sea Res. II 49, 59–80. doi: 10.1016/s0967-0645(01)00094-7
Cockcroft, A. C. (2001). Jasus lalandii ‘walkouts’ or mass strandings in South Africa during the 1990s: an overview. Mar. Freshw. Res. 52, 1085–1093. doi: 10.1071/mf01100
Cockcroft, A. C., van Zyl, D., and Hutchings, L. (2008). Large-scale changes in the spatial distribution of South African West Coast rock lobsters: an overview. Afr. J. Mar. Sci. 30, 149–159. doi: 10.2989/ajms.2008.30.1.15.465
De Decker, A. H. B. (1970). Notes on An Oxygen-Depleted Subsurface Current Off the West Coast of South Africa. Invest. Rep. 84. Cape Town: Div. of Sea Fish, 1–24.
Demarcq, H. (2009). Trends in primary production, sea surface temperature and wind in upwelling systems (1998-2007). Prog. Oceanogr. 83, 376–385. doi: 10.1016/j.pocean.2009.07.022
Demarcq, H., Barlow, R. G., and Shillington, F. A. (2003). Climatology and variability of sea surface temperature and surface chlorophyll in the Benguela and Agulhas ecosystems as observed by satellite imagery. Afr. J. Mar. Sci. 25, 363–372. doi: 10.2989/18142320309504022
Dittmar, T., and Birkicht, M. (2001). Regeneration of nutrients in the northern Benguela upwelling and the Angola-Benguela Front areas. S. Afr. J. Sci. 97, 239–246.
Donners, J., Drijfhout, S. S., and Hazeleger, W. (2005). Water mass transformation and subduction in the South Atlantic. J. Phys. Oceanogr. 35, 1841–1860. doi: 10.1175/jpo2782.1
Duncombe Rae, C. M. (2005). A demonstration of the hydrographic partition of the Benguela upwelling ecosystem at 26° 40’S. Afr. J. Mar. Sci. 27, 617–628. doi: 10.2989/18142320509504122
Durgadoo, J. V., Rühs, S., Biastoch, A., and Böning, C. W. B. (2017). Indian Ocean sources of Agulhas leakage. J. Geophys. Res. 122, 3481–3499. doi: 10.1002/2016jc012676
Fawcett, A. L., Pitcher, G. C., and Shillington, F. A. (2008). Nearshore currents on the southern Namaqua shelf of the Benguela upwelling system. Cont. Shelf Res. 28, 1026–1039. doi: 10.1016/j.csr.2008.02.005
Fawcett, A., Pitcher, G. C., Bernard, S., Cembella, A. D., and Kudela, R. M. (2007). Contrasting wind patterns and toxigenic phytoplankton in the southern Benguela upwelling system. Mar. Ecol. Prog. Ser. 348, 19–31. doi: 10.3354/meps07027
Flynn, R. F., Granger, J., Veitch, J. A., Siedlecki, S., Burger, J. M., Pillay, K., et al. (2020). On-shelf nutrient trapping enhances the fertility of the southern Benguela upwelling system. J. Geophys. Res. 125:e2019JC015948.
Gordon, A. L. (1981). South Atlantic thermocline ventilation. Deep Sea Res. A Oceanogr. Res. Pap. 28, 1239–1264. doi: 10.1016/0198-0149(81)90033-9
Grasshoff, K., Kremling, K., and Ehrhardt, M. (1999). Methods of Seawater Analysis. Weinheim: Verlag Chemie.
Haake, B., Ittekkot, V., Rixen, T., Ramaswamy, V., Nair, R. R., and Curry, W. B. (1993). Seasonality and interannual variability of particle fluxes to the deep Arabian Sea. Deep Sea Res. I 40, 1323–1344. doi: 10.1016/0967-0637(93)90114-i
Hardman-Mountford, N. J., Richardson, A. J., Agenbag, J. J., Hagen, E., Nykjaer, L., Shillington, F. A., et al. (2003). Ocean climate of the South East Atlantic observed from satellite data and wind models. Prog. Oceanogr. 59, 181–221. doi: 10.1016/j.pocean.2003.10.001
Harms, N. C., Lahajnar, N., Gaye, B., Rixen, T., Dähnke, K., Ankele, M., et al. (2019). Nutrient distribution and nitrogen and oxygen isotopic composition of nitrate in water masses of the subtropical southern Indian Ocean. Biogeosciences 16, 2715–2732. doi: 10.5194/bg-16-2715-2019
Honjo, S., Manganini, S. J., Krishfield, R. A., and Francois, R. (2008). Particulate organic carbon fluxes to the ocean interior and factors controlling the biological pump: a synthesis of global sediment trap programs since 1983. Prog. Oceanogr. 76, 217–285. doi: 10.1016/j.pocean.2007.11.003
Hutchings, L., Jarre, A., Lamont, T., van den Berg, M., and Kirkman, S. P. (2012). St Helena Bay (southern Benguela) then and now: muted climate signals, large human impact. Afr. J. Mar. Sci. 34, 559–583. doi: 10.2989/1814232x.2012.689672
Hutchings, L., van der Lingen, C. D., Shannon, L. J., Crawford, R. J. M., Verheye, H. M. S., Bartholomae, C. H., et al. (2009). The Benguela current: an ecosystem of four components. Prog. Oceanogr. 83, 15–32. doi: 10.1016/j.pocean.2009.07.046
Ito, T., and Follows, M. J. (2005). Preformed phosphate, soft tissue pump and atmospheric CO2. J. Mar. Res. 63, 813–839. doi: 10.1357/0022240054663231
Jarre, A., Hutchings, L., Kirkman, S. P., Kreiner, A., Tchipalanga, P. C. M., Kainge, P., et al. (2015). Synthesis: climate effects on biodiversity, abundance and distribution of marine organisms in the Benguela. Fish. Oceanogr. 24, 122–149. doi: 10.1111/fog.12086
Kämpf, J., and Chapman, P. (2016). “The Benguela current upwelling system,” in Upwelling Systems of the World, eds J. Kämpf, and P. Chapman (Cham: Springer Nature Switzerland AG), 251–361.
Karstensen, J., and Quadfasel, D. (2002). Formation of Southern Hemisphere thermocline waters: water mass conversion and subduction. J. Phys. Oceanogr. 32, 3020–3038. doi: 10.1175/1520-0485(2002)032<3020:foshtw>2.0.co;2
Lamont, T., Barlow, R. G., and Brewin, R. J. W. (2019). Long-term trends in phytoplankton chlorophyll a and size structure in the Benguela upwelling system. J. Geophys. Res. 124, 1170–1195. doi: 10.1029/2018jc014334
Lamont, T., García-Reyes, M., Bograd, S. J., van der Lingen, C. D., and Sydeman, W. J. (2018). Upwelling indices for comparative ecosystem studies: variability in the Benguela upwelling system. J. Mar. Syst. 188, 3–16. doi: 10.1016/j.jmarsys.2017.05.007
Lamont, T., Hutchings, L., van den Berg, M. A., Goschen, W. S., and Barlow, R. G. (2015). Hydrographic variability in the St. Helena Bay region of the southern Benguela ecosystem. J. Geophys. Res. 120, 2920–2944. doi: 10.1002/2014jc010619
McCartney, M. S. (1977). “Subantarctic mode water,” in A Voyage of Discovery: George Deacon 70th Anniversary Volume, ed. M. V. Angel (Oxford: Supplement to Deep-Sea Research, Pergamon Press), 103–119. doi: 10.1007/s10236-010-0352-9
Messié, M., Ledesma, J., Kolber, D. D., Michisaki, R. P., Foley, D. G., and Chavez, F. P. (2009). Potential new production estimates in four eastern boundary upwelling ecosystems. Prog. Oceanogr. 83, 151–158. doi: 10.1016/j.pocean.2009.07.018
Mohrholz, V., Bartholomaeb, C. H., and van der Plas, A. K. (2008). The seasonal variability of the northern Benguela undercurrent and its relation to the oxygen budget on the shelf. Cont. Shelf Res. 28, 424–441. doi: 10.1016/j.csr.2007.10.001
Monteiro, P. M. S., Dewitte, B., Scranton, M. I., Paulmier, A., and van der Plas, A. K. (2011). The role of open ocean boundary forcing on seasonal to decadal-scale variability and long-term change of natural shelf hypoxia. Environ. Res. Lett. 6:025002. doi: 10.1088/1748-9326/6/2/025002
Monteiro, P. M. S., van der Plas, A., Mohrholz, V., Mabille, E., Pascall, A., and Joubert, W. (2006). Variability of natural hypoxia and methane in a coastal upwelling system: oceanic physics or shelf biology? Geophys. Res. Lett. 331:L16614. doi: 10.1029/2006GL026234
Moore, S. K., Trainer, V. L., Mantua, N. J., Parker, M. S., Laws, E. A., Backer, L. C., et al. (2008). Impacts of climate variability and future climate change on harmful algal blooms and human health. Environ. Health 7:S4.
Pauly, D., and Christensen, V. (1995). Primary production required to sustain global fisheries. Nature 374, 255–257. doi: 10.1038/374255a0
Pitcher, G. C., and Nelson, G. (2006). Characteristics of the surface boundary layer important to the development of red tide on the southern Namaqua shelf of the Benguela upwelling system. Limnol. Oceanogr. 51, 2660–2674. doi: 10.4319/lo.2006.51.6.2660
Pitcher, G. C., and Probyn, T. A. (2011). Anoxia in southern Benguela during the autumn of 2009 and its linkage to a bloom of the dinoflagellate Ceratium balechii. Harmful Algae 11, 23–32. doi: 10.1016/j.hal.2011.07.001
Pitcher, G. C., Probyn, T. A., du Randt, A., Lucas, A. J., Bernard, S., Evers-King, H., et al. (2014). Dynamics of oxygen depletion in the nearshore of a coastal embayment of the southern Benguela upwelling system. J. Geophys. Res. 119, 2183–2200. doi: 10.1002/2013jc009443
Postel, L., Mohrholz, V., and Packard, T. T. (2014). Upwelling and successive ecosystem response in the Northern Benguela region – an in situ experiment. J. Mar. Syst. 140(Part B), 73–81. doi: 10.1016/j.jmarsys.2014.07.014
Rixen, T., Cowie, G., Gaye, B., Goes, J., do Rosário Gomes, H., Hood, R. R., et al. (2020). Reviews and syntheses: present, past, and future of the oxygen minimum zone in the northern Indian Ocean. Biogeosciences 17, 6051–6080. doi: 10.5194/bg-17-6051-2020
Rixen, T., Gaye, B., and Emeis, K.-C. (2019). The monsoon, carbon fluxes, and the organic carbon pump in the northern Indian Ocean. Prog. Oceanogr. 175, 24–39. doi: 10.1016/j.pocean.2019.03.001
Shannon, L. V. (1985). “The Benguela ecosystem 1. Evolution of the Benguela, physical features and processes,” in Oceanography and Marine Biology, ed. M. Barnes (Aberdeen: University Press), 105–182.
Shannon, L. V., and Nelson, G. (1996). “The Benguela: large scale features and processes and system variability,” in The South Atlantic: Present and Past Circulation, eds G. Wefer, W. H. Berger, G. Siedler, and D. J. Webb (Berlin: Springer Berlin Heidelberg), 163–210. doi: 10.1007/978-3-642-80353-6_9
Souza, A. G. Q. D., Kerr, R., and Azevedo, J. L. L. D. (2018). On the influence of subtropical mode water on the South Atlantic Ocean. J. Mar. Syst. 185, 13–24. doi: 10.1016/j.jmarsys.2018.04.006
Stramma, L., Johnson, G. C., Sprintall, J., and Mohrholz, V. (2008). Expanding oxygen-minimum zones in the tropical oceans. Science 320, 655–658. doi: 10.1126/science.1153847
Sydeman, W. J., García-Reyes, M., Schoeman, D. S., Rykaczewski, R. R., Thompson, S. A., Black, B. A., et al. (2014). Climate change and wind intensification in coastal upwelling ecosystems. Science 345:77. doi: 10.1126/science.1251635
Tim, N., Zorita, E., and Hünicke, B. (2015). Decadal variability and trends of the Benguela upwelling system as simulated in a high-resolution ocean simulation. Ocean Sci. 11, 483–502. doi: 10.5194/os-11-483-2015
Tyrrell, T., and Lucas, M. I. (2002). Geochemical evidence of denitrification in the Benguela upwelling system. Cont. Shelf Res. 22, 2497–2511. doi: 10.1016/s0278-4343(02)00077-8
Vaquer-Sunyer, R., and Duarte, C. M. (2008). Thresholds of hypoxia for marine biodiversity. Proc. Natl. Acad. Sci. U.S.A. 105:15452. doi: 10.1073/pnas.0803833105
Veitch, J., Penven, P., and Shillington, F. (2009). The Benguela: a laboratory for comparative modeling studies. Prog. Oceanogr. 83, 296–302. doi: 10.1016/j.pocean.2009.07.008
Veitch, J., Penven, P., and Shillington, F. (2010). Modeling equilibrium dynamics of the Benguela current system. J. Phys. Oceanogr. 40, 1942–1964. doi: 10.1175/2010jpo4382.1
Verheye, H. M., Lamont, T., Huggett, J. A., Kreiner, A., and Hampton, I. (2016). Plankton productivity of the Benguela current large marine ecosystem (BCLME). Environ. Dev. 17, 75–92.
Wang, D., Gouhier, T. C., Menge, B. A., and Ganguly, A. R. (2015). Intensification and spatial homogenization of coastal upwelling under climate change. Nature 518:390.
Keywords: Eastern Boundary Upwelling Systems, Benguela Upwelling System, nutrient trapping, oxygen minimum zones (OMZs), oxygen
Citation: Rixen T, Lahajnar N, Lamont T, Koppelmann R, Martin B, van Beusekom JEE, Siddiqui C, Pillay K and Meiritz L (2021) Oxygen and Nutrient Trapping in the Southern Benguela Upwelling System. Front. Mar. Sci. 8:730591. doi: 10.3389/fmars.2021.730591
Received: 25 June 2021; Accepted: 31 August 2021;
Published: 23 September 2021.
Edited by:
Alejandro Jose Souza, Center for Research and Advanced Studies - Mérida Unit, MexicoReviewed by:
Laura Carrillo, The South Border College (ECOSUR), MexicoJesus Dubert, University of Aveiro, Portugal
Copyright © 2021 Rixen, Lahajnar, Lamont, Koppelmann, Martin, van Beusekom, Siddiqui, Pillay and Meiritz. This is an open-access article distributed under the terms of the Creative Commons Attribution License (CC BY). The use, distribution or reproduction in other forums is permitted, provided the original author(s) and the copyright owner(s) are credited and that the original publication in this journal is cited, in accordance with accepted academic practice. No use, distribution or reproduction is permitted which does not comply with these terms.
*Correspondence: Tim Rixen, Tim.Rixen@leibniz-zmt.de