Large Vessel Activity and Low-Frequency Underwater Sound Benchmarks in United States Waters
 Samara M. Haver1,2*
  Jeffrey D. Adams3
  Leila T. Hatch4
  Sofie M. Van Parijs5
  Robert P. Dziak6 Joseph Haxel7
  Scott A. Heppell1
  Megan F. McKenna8
  David K. Mellinger2,9 Jason Gedamke10
- 1Department of Fisheries, Wildlife, and Conservation Sciences, Oregon State University, Corvallis, OR, United States
- 2Cooperative Institute for Marine Ecosystem and Resources Studies, National Oceanic and Atmospheric Administration Pacific Marine Environmental Laboratory and Oregon State University, Newport, OR, United States
- 3Office of Protected Resources, National Oceanic and Atmospheric Administration Fisheries, Silver Spring, MD, United States
- 4Stellwagen Bank National Marine Sanctuary, National Oceanic and Atmospheric Administration Office of National Marine Sanctuaries, Scituate, MA, United States
- 5National Oceanic and Atmospheric Administration Northeast Fisheries Science Center, Woods Hole, MA, United States
- 6National Oceanic and Atmospheric Administration Pacific Marine Environmental Laboratory, Hatfield Marine Science Center, Newport, OR, United States
- 7Coastal Sciences Division, Pacific Northwest National Laboratory, Sequim, WA, United States
- 8Hopkins Marine Station, Stanford University, Pacific Grove, CA, United States
- 9Marine Mammal Institute, Oregon State University, Newport, OR, United States
- 10Office of Science and Technology, National Oceanic and Atmospheric Administration Fisheries, Silver Spring, MD, United States
Chronic low-frequency noise from commercial shipping is a worldwide threat to marine animals that rely on sound for essential life functions. Although the U.S. National Oceanic and Atmospheric Administration recognizes the potential negative impacts of shipping noise in marine environments, there are currently no standard metrics to monitor and quantify shipping noise in U.S. marine waters. However, one-third octave band acoustic measurements centered at 63 and 125 Hz are used as international (European Union Marine Strategy Framework Directive) indicators for underwater ambient noise levels driven by shipping activity. We apply these metrics to passive acoustic monitoring data collected over 20 months in 2016–2017 at five dispersed sites throughout the U.S. Exclusive Economic Zone: Alaskan Arctic, Hawaii, Gulf of Mexico, Northeast Canyons and Seamounts Marine National Monument (Northwest Atlantic), and Cordell Bank National Marine Sanctuary (Northeast Pacific). To verify the relationship between shipping activity and underwater sound levels, vessel movement data from the Automatic Identification System (AIS) were paired to each passive acoustic monitoring site. Daily average sound levels were consistently near to or higher than 100 dB re 1 μPa in both the 63 and 125 Hz one-third octave bands at sites with high levels of shipping traffic (Gulf of Mexico, Northeast Canyons and Seamounts, and Cordell Bank). Where cargo vessels were less common (the Arctic and Hawaii), daily average sound levels were comparatively lower. Specifically, sound levels were ∼20 dB lower year-round in Hawaii and ∼10-20 dB lower in the Alaskan Arctic, depending on the season. Although these band-level measurements can only generally facilitate differentiation of sound sources, these results demonstrate that international acoustic indicators of commercial shipping can be applied to data collected in U.S. waters as a unified metric to approximate the influence of shipping as a driver of ambient noise levels, provide critical information to managers and policy makers about the status of marine environments, and to identify places and times for more detailed investigation regarding environmental impacts.
Introduction
Underwater acoustic environments are composed of many complex sound sources, collectively defined as the soundscape. Within a soundscape, underwater sound sources can be grouped into three main components: biological (e.g., whales, fish), natural abiotic (e.g., wind, underwater earthquakes) and anthropogenic (e.g., vessels, sonar, airguns). Sounds emanating from these biological, physical, and anthropogenic sources vary by intensity and duration as well as frequency range and temporal occurrence. As technological advances in underwater monitoring have facilitated the ease and duration with which we can record and analyze underwater sound, researchers and conservation-oriented organizations have recognized the importance and value of monitoring underwater soundscapes (Firestone and Jarvis, 2007; Gedamke et al., 2016; Tyack, 2018; McKenna, 2020). Combined with research focused on the effects of increasing underwater sound levels on marine species (including whales, fish, and invertebrates), monitoring and documenting underwater sound levels provides critical information about the status of marine environments to managers and policy makers.
In the United States of America (U.S.), increasing noise in underwater soundscapes is both a concern and a priority research topic for the National Oceanic and Atmospheric Administration (NOAA), the government agency responsible for managing and conserving marine ecosystems and resources (Gedamke et al., 2016). Within a soundscape, species that rely on sound for critical life functions (e.g., foraging, reproduction, navigation, predator avoidance) share acoustic space with other natural, physical, and anthropogenic sound sources. These species evolved to use sound as their primary sensory modality in the presence of natural physical sound sources, but only in the past century have they had to adapt to the presence of anthropogenic sound sources. Additionally, anthropogenic sounds are often both higher in intensity and longer in duration (or chronic) compared to pulsed disturbances from natural physical and other biological sound sources (Duarte et al., 2021). Decades of research on the effects of noise on marine animals has established that exposure to anthropogenic noise such as shipping, seismic airguns, construction, and sonar, can be detrimental to acoustic habitats and have negative impacts on the life history of soniferous species (Richardson et al., 1995; Thomsen et al., 2020).
Over the past few decades, NOAA, the U.S. National Park Service, and conservation-focused non-governmental organizations have prioritized monitoring ocean noise and global soundscapes, guiding underwater acoustic research efforts toward quantifying long-term sound level trends. Numerous studies have focused on quantifying and comparing changing underwater ambient soundscape conditions, and while they have arrived at different conclusions regarding the current state of underwater noise (Andrew et al., 2002; McDonald et al., 2006; Chapman and Price, 2011; Miksis-Olds and Nichols, 2016), all agree that commercial shipping is a significant and growing global noise source.
The overwhelming majority of goods traded worldwide travel by ship at some point in the journey from origin to destination. There are very few areas of the ocean that are not affected by vessel traffic, but locations that are isolated from major ports and shipping lanes are typically quieter than those areas that are not (Haver et al., 2019). Cargo vessels in particular are bigger, louder, and faster than other vessels—and the global fleet is growing rapidly both in terms of vessel number and vessel size and power (Frisk, 2012; Erbe et al., 2019; UNCTAD, 2020). For example, compared to vessels constructed around the year 2000, container ships being built today are overall four times as large and new oil tankers are nine times bigger (UNCTAD, 2020) and commercial shipping activity is predicted to continue to increase in coming years (Kaplan and Solomon, 2016).
Vessel noise contributes to underwater soundscapes from frequencies as low as 10 Hz to as high as 10 kHz, depending on vessel size and speed (Wenz, 1962; National Research Council, 2003). Cargo shipping is prevalent throughout the northern hemisphere (Pirotta et al., 2018), contributing low-frequency noise (< 1 kHz) near port cities and along shipping routes. In high-use areas of heavily trafficked shipping lanes near large port cities, additive energy from multiple vessels can chronically increase ambient sound levels over distances of tens to hundreds of kilometers depending on environmental variables (e.g., bathymetry, water temperature profile) that facilitate sound propagation efficiency (Wenz, 1962; Urick, 1983; Andrew et al., 2002). Persistent presence of low-frequency shipping noise can chronically interfere with the life history of marine animals that vocalize within the same range (e.g., whales, pinnipeds) (Erbe et al., 2019). Therefore, it is important to monitor underwater sound in areas that are in close proximity to shipping lanes and large ports, as well as important environments for the life history of protected species [e.g., marine protected areas (see: Hatch et al., 2016) and biologically important areas (see: Van Parijs et al., 2015)].
In 2020, abrupt economic fluctuations and disruptions to human activities related to the COVID-19 pandemic changed the natural world, including acoustic environments (Derryberry et al., 2020; Thomson and Barclay, 2020). This disruption provided soundscape researchers the unprecedented opportunity of a natural experiment to measure how ocean sound levels may have changed in tandem with a volatile economy and shifts in human activities. However, to quantify changes for managers and policy makers as well as facilitate international research collaboration, 2020 fluctuations must be evaluated with standardized metrics and baseline data of historical conditions.
Monitoring low-frequency shipping noise can be challenging due to coinciding biological sound sources (e.g., whales, seals); however, energy detectors are an effective and adequate tool that can be applied to discriminate distinctive biological, anthropogenic, and natural physical sounds and then determine the approximate energy contribution of each source. There are currently no established U.S. standards for monitoring shipping noise in U.S. waters, though 40–60 Hz is a historically used frequency range regularly selected as proxy for all shipping noise (see: McDonald et al., 2006; McKenna et al., 2012b; Miksis-Olds et al., 2012; Širović et al., 2013). However, in the European Union, two one-third octave bands, centered at 63 and 125 Hz, are used as sound pressure level indicators for underwater ambient noise levels driven by shipping activity (EC Decision 2017/848).
Here we calculate 63 and 125 Hz one-third octave band sound levels across an array of marine soundscapes to evaluate whether they are indicative of commercial shipping activity in U.S. waters. Specifically, we follow the metrics outlined in the Marine Strategy Framework Directive (European Union, 2008; Tasker et al., 2010; Van der Graaf et al., 2012) to quantify sound levels during 20 months (2016–2017) of temporally aligned calibrated acoustic data sampled from five locations across the U.S. Exclusive Economic Zone. To evaluate if the 63 and 125 Hz one-third octave bands are an accurate proxy for nearby shipping activity, we compare these octave band sound levels to Automatic Identification System (AIS) vessel tracking data collected from each monitoring location. Since 2015, the U.S. Coast Guard requires most commercial, towing, passenger, and fishing industry vessels to carry AIS transponders1 which emit position and identification information that can be read by satellite and terrestrial receivers. These individual data points can be composed to provide records of individual vessel movement throughout the ocean. The five sites selected for comparison span all regions of the U.S. Exclusive Economic Zone in the North Atlantic, Gulf of Mexico, Western Arctic, Northeastern Pacific, and central North Pacific, and include a National Marine Sanctuary and a National Marine Monument, and are all established monitoring sites included in the NOAA and National Park Service Noise Reference Station Network (Haver et al., 2018).
Materials and Methods
Passive Acoustic Instrumentation
Temporally overlapping acoustic data were collected from 1 January 2016 through 31 August 2017 at five locations dispersed throughout the U.S. EEZ (Figure 1): Beaufort Sea, Alaskan Arctic (72.44° N, 156.55° W), North of Oahu Island, Hawaii (22.33° N, 157.67° W), Gulf of Mexico (28.25° N, 86.83° W), Northeast Canyons and Seamounts Marine National Monument, North Atlantic (39.01° N, 67.27° W), and Cordell Bank National Marine Sanctuary (37.8° N, 123.4° W). Each site was selected for inclusion based on general conservation concerns for potential use conflicts between humans and endangered marine species, as well as site-specific management needs such as shifting seasonal sea-ice conditions in the Arctic due to climate change. The five sites are all part of a calibrated U.S.-wide system of autonomous underwater hydrophone (AUH) moorings, the NOAA/National Park Service Noise Reference Station Network (Haver et al., 2018). To maintain comparable datasets, a single calibrated AUH was deployed at each site. Each AUH was programmed to sample at 5 kHz and suspended from a bottom-mounted mooring in the deep sound channel (see Haver et al., 2018 for equipment details). During the 20-month data collection period, approximately 13 months of data gaps exist across three sites (Hawaii: 23 December 2016–31 August 2017, Gulf of Mexico: 14 March 2016–12 April 2016, and Northeast Canyons and Seamounts National Monument: 1 January 2016–25 April 2016). There were no data gaps in the data collected in the Beaufort Sea or Cordell Bank National Marine Sanctuary. In total, 87 months of acoustic data were included in analysis.
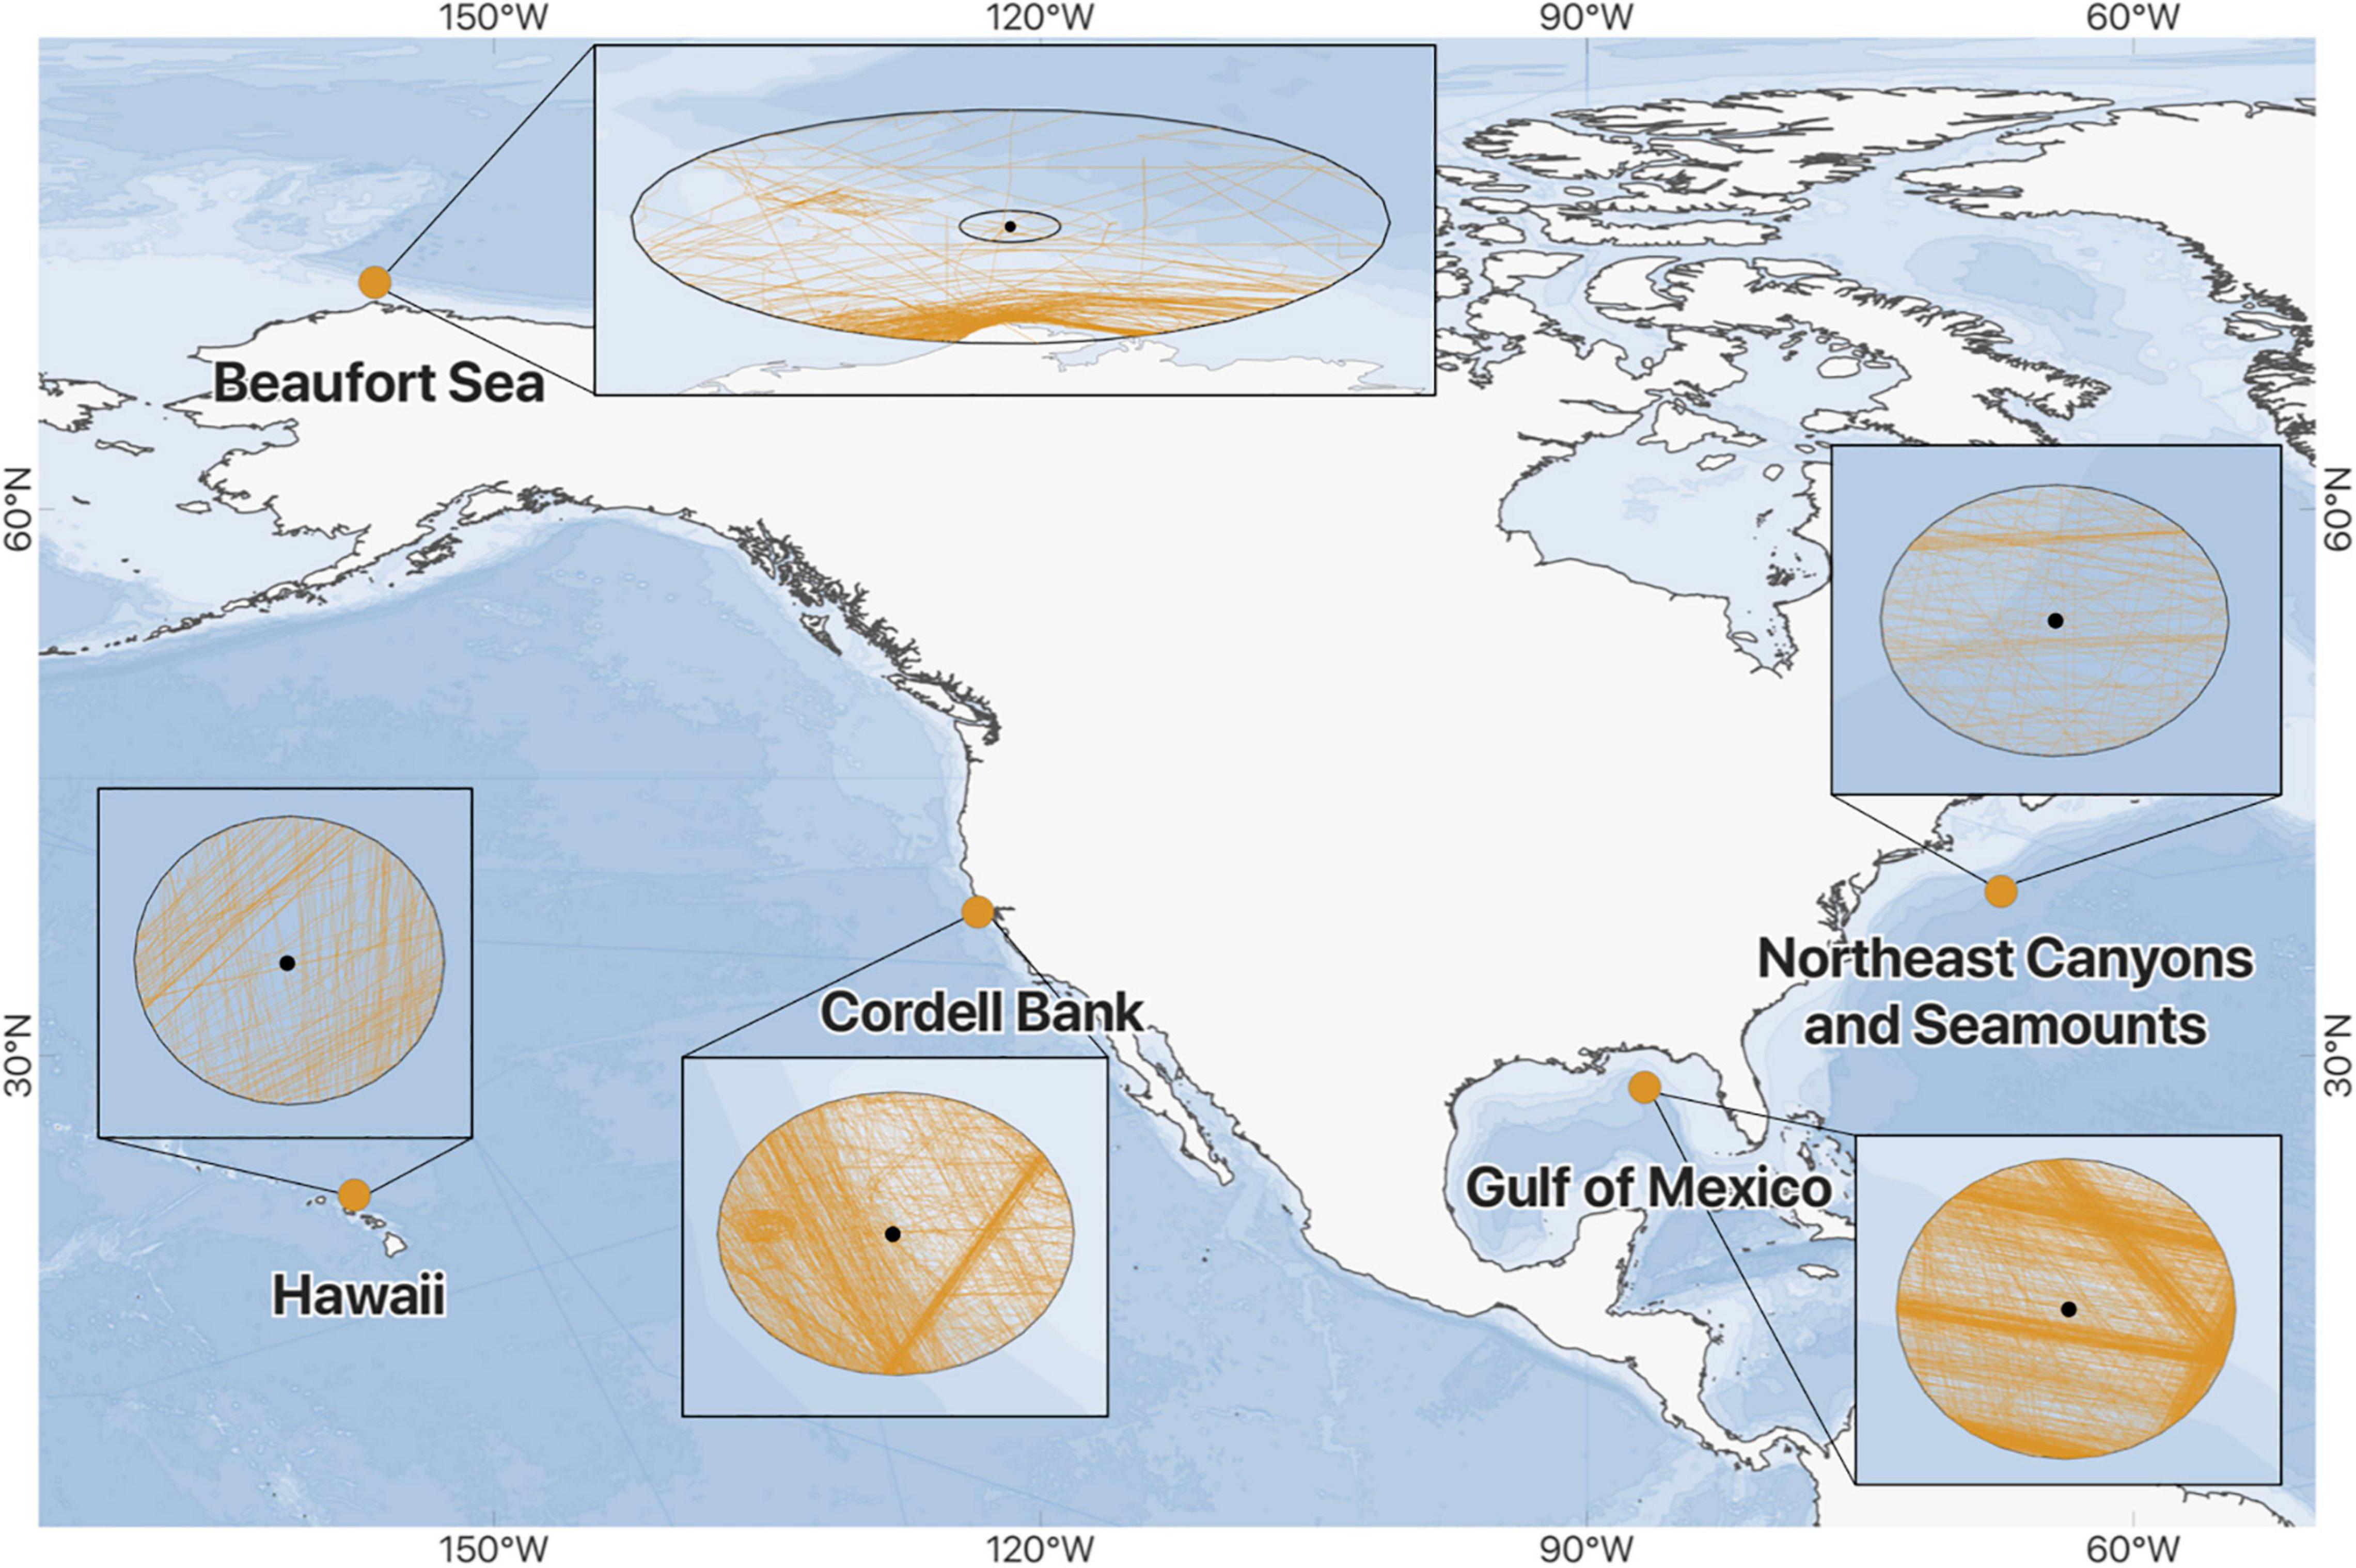
Figure 1. Locations of the five NOAA/NPS Noise Reference Station Network sites where passive acoustic and vessel transit data were sampled between 1 January 2016 and 31 August 2017. A magnified image for each site shows AIS vessel track lines (orange) within each 20 km buffer radius, except at the Beaufort Sea site where both 20 and 150 km buffer circles are shown (see section “Materials and Methods”). The small black dot within each buffer represents the location of the hydrophone. Note that the shape of each buffer varies due to map projection.
Quantifying Sound Levels
To calculate 63 and 125 Hz one-third octave band (TOB) sound levels, hourly averaged narrow-band (1 Hz) power spectral density levels were summed across the two TOBs of interest (56–71 Hz and 112–141 Hz, respectively), averaged (mean) in 24-h bins to obtain daily values, and converted to decibels (dB re 1 μPa, hereafter dB). A 14-day moving average was calculated for each site from daily mean values.
Extracting Automatic Identification System Vessel Tracking Data
Buffer Radius
Satellite and terrestrial-based AIS data records from January 2016 through August 2017, within a 20 km circular buffer around each AUH deployment location, were queried for activity mirroring the timeline of acoustic data collection. As vessel noise is not directionally consistent, and also varies significantly with speed and tonnage (Wenz, 1962; Urick, 1983; Zhang et al., 2020; Zobell et al., 2021), we selected a conservative buffer radius to ensure that a commercial shipping vessel tracked within the buffer via AIS would also increase the 63 and 125 Hz TOB sound levels at a hydrophone site. A buffer of 20 km was determined using the passive sonar equation (∼67 dB transmission loss for 63 and 125 Hz at 500 m depth) to be the approximate range that noise from a typical commercial shipping vessel would be received at the hydrophone in excess of ambient sound levels at all of the five unique acoustic environments (see example source level calculations in Gassmann et al., 2017 and Zhang et al., 2020). The variation in ambient sound levels across sites and time would either increase distance at which vessel noise contributes to the sound field when sound levels are lower from other sources (e.g., wind) or decrease distance when sound levels are higher from other sources. Although vessel noise from further afield could be detected above ambient sound under certain conditions at some locations (e.g., a deep-water convergence zone could amplify vessel noise), limiting the standardized buffer to 20 km across all sites minimized the probability of tracking vessel movement that may not impact the sound field at the hydrophone (Bassett et al., 2012).
Following initial data query, results of vessel movement within the Beaufort Sea 20 km buffer zone was determined to be misleading due to distance between the hydrophone and the majority of regional vessel activity occurring very close to shore and the relatively low ambient sound levels. Furthermore, sound propagates much more efficiently in high-latitude waters (surface duct propagation) compared to the mid- and low-latitudes where the other sites were located. Therefore, a secondary buffer of 150 km (inclusive of the entire distance from Alaskan shoreline to the hydrophone site) was queried for the Beaufort Sea site. Using the passive sonar equation, we calculated that transmission loss of a signal in the study frequency bands would be ∼75 dB over 150 km at the Beaufort Sea hydrophone depth of 500 m. Given the distinctive acoustic environment of the Beaufort Sea, inclusion of a second expanded buffer was determined to be important for capturing vessel presence at this site; however, the buffer size for other sites was not revised as 150 km is generally too large a radius to reliably detect vessel activity over ambient sound levels in more densely trafficked and lower-latitude regions.
Vessel Types
AIS records for all Type A and Type B2 vessels (including ships > 300 gross tons and commercial passenger vessels) within each buffer zone were queried into unique transits defined by the start and end times for entering and exiting the buffer radius around each recording site. In addition to start and ends time, we collated the name, size (length, tonnage), and vessel type for each entry. The nineteen vessel types were grouped into nine categories for analysis according to NOAA Marine Cadastre codes3: tanker, fishing, cargo, towing (including tug vessels), pleasure (including sailing vessels), passenger, other (including vessel types high-speed craft, search and rescue, military, law, dredging, Resol-18, and spare), reserved, and unknown. Vessel names for all entries with the vessel type “Unknown” were queried on in the Marine Traffic4 database to identify the type and relabeled. In a few instances no vessel type was available, and those entries remain classified as “Unknown.”
Monthly Vessel Activity Summaries
The monthly sum of vessel transits within the buffer radius of each hydrophone site were identified by querying the AIS data for unique results of date, vessel name, trip segment, and start and end time. Entries were flagged and ultimately excluded if the transit time or speed indicated an AIS transponder malfunction (e.g., impossibly fast speed over ground or distanced traveled) or in the case of duplicate entries where both satellite and terrestrial AIS logged a vessel’s movement. The total sum of vessel transits, distance traveled within the buffer (nautical miles), and time spent within buffer zone (counted in cumulative days) were calculated for each site and categorized by vessel type.
Environmental Variables
Sea Ice Coverage in the Beaufort Sea
Monthly records of sea ice extent at the Beaufort Sea site (72.443° W, 156.5517° N) from January 2016 through August 2017 were retrieved from the University of Alaska Historical Sea Ice Atlas (University of Alaska, 2020).
Wind Noise
Although wind can significantly increase sound levels in underwater soundscapes via surface agitating, the impact to ambient sound levels is primarily detected > 500 Hz (though sometimes as low as 100 Hz) (Wenz, 1962; Urick, 1983; Širović et al., 2013). Because the 63 and 125 Hz TOBs measured in this comparison are primarily below the ∼100–500 Hz lower limit for wind driven noise, we did not take extra steps to quantify the acoustic impact of wind in this comparison.
Results
Sound Levels
Daily 63 and 125 Hz one-third octave frequency band (TOB) sound levels measured in the Gulf of Mexico, Northeast Canyons, and Cordell Bank were of higher energy compared to Hawaii and the Beaufort Sea (Figure 2). Moving average (14-day) TOB sound levels for both 63 and 125 Hz varied (minimum to maximum) by ∼5 dB throughout the 20-month time period at the Northeast Canyons and Hawaii sites, and by ∼10 dB at the Cordell Bank site. In the Gulf of Mexico and Beaufort Sea, 63 and 125 Hz TOBs had a range of ∼15 dB across time periods. In the Gulf of Mexico, 63 and 125 Hz TOB sound levels were highest between January-March 2017, and lowest in January-March 2016 in the 63 Hz TOB and July–August 2017 in the 125 Hz TOB. Additionally, the highest sound levels measured in the Gulf of Mexico were also the highest sound levels observed across all sites. Across all sites, 63 and 125 Hz TOB sound levels varied over the widest range of dB in the Beaufort Sea; at that site sound levels were highest in both boreal spring (March-April) and late summer to early fall (August-October), and lowest in early summer (June-July) and November in both 2016 and 2017. The lowest sound levels measured in the Beaufort Sea were also the lowest sound levels observed across all sites (Supplementary Table 1).
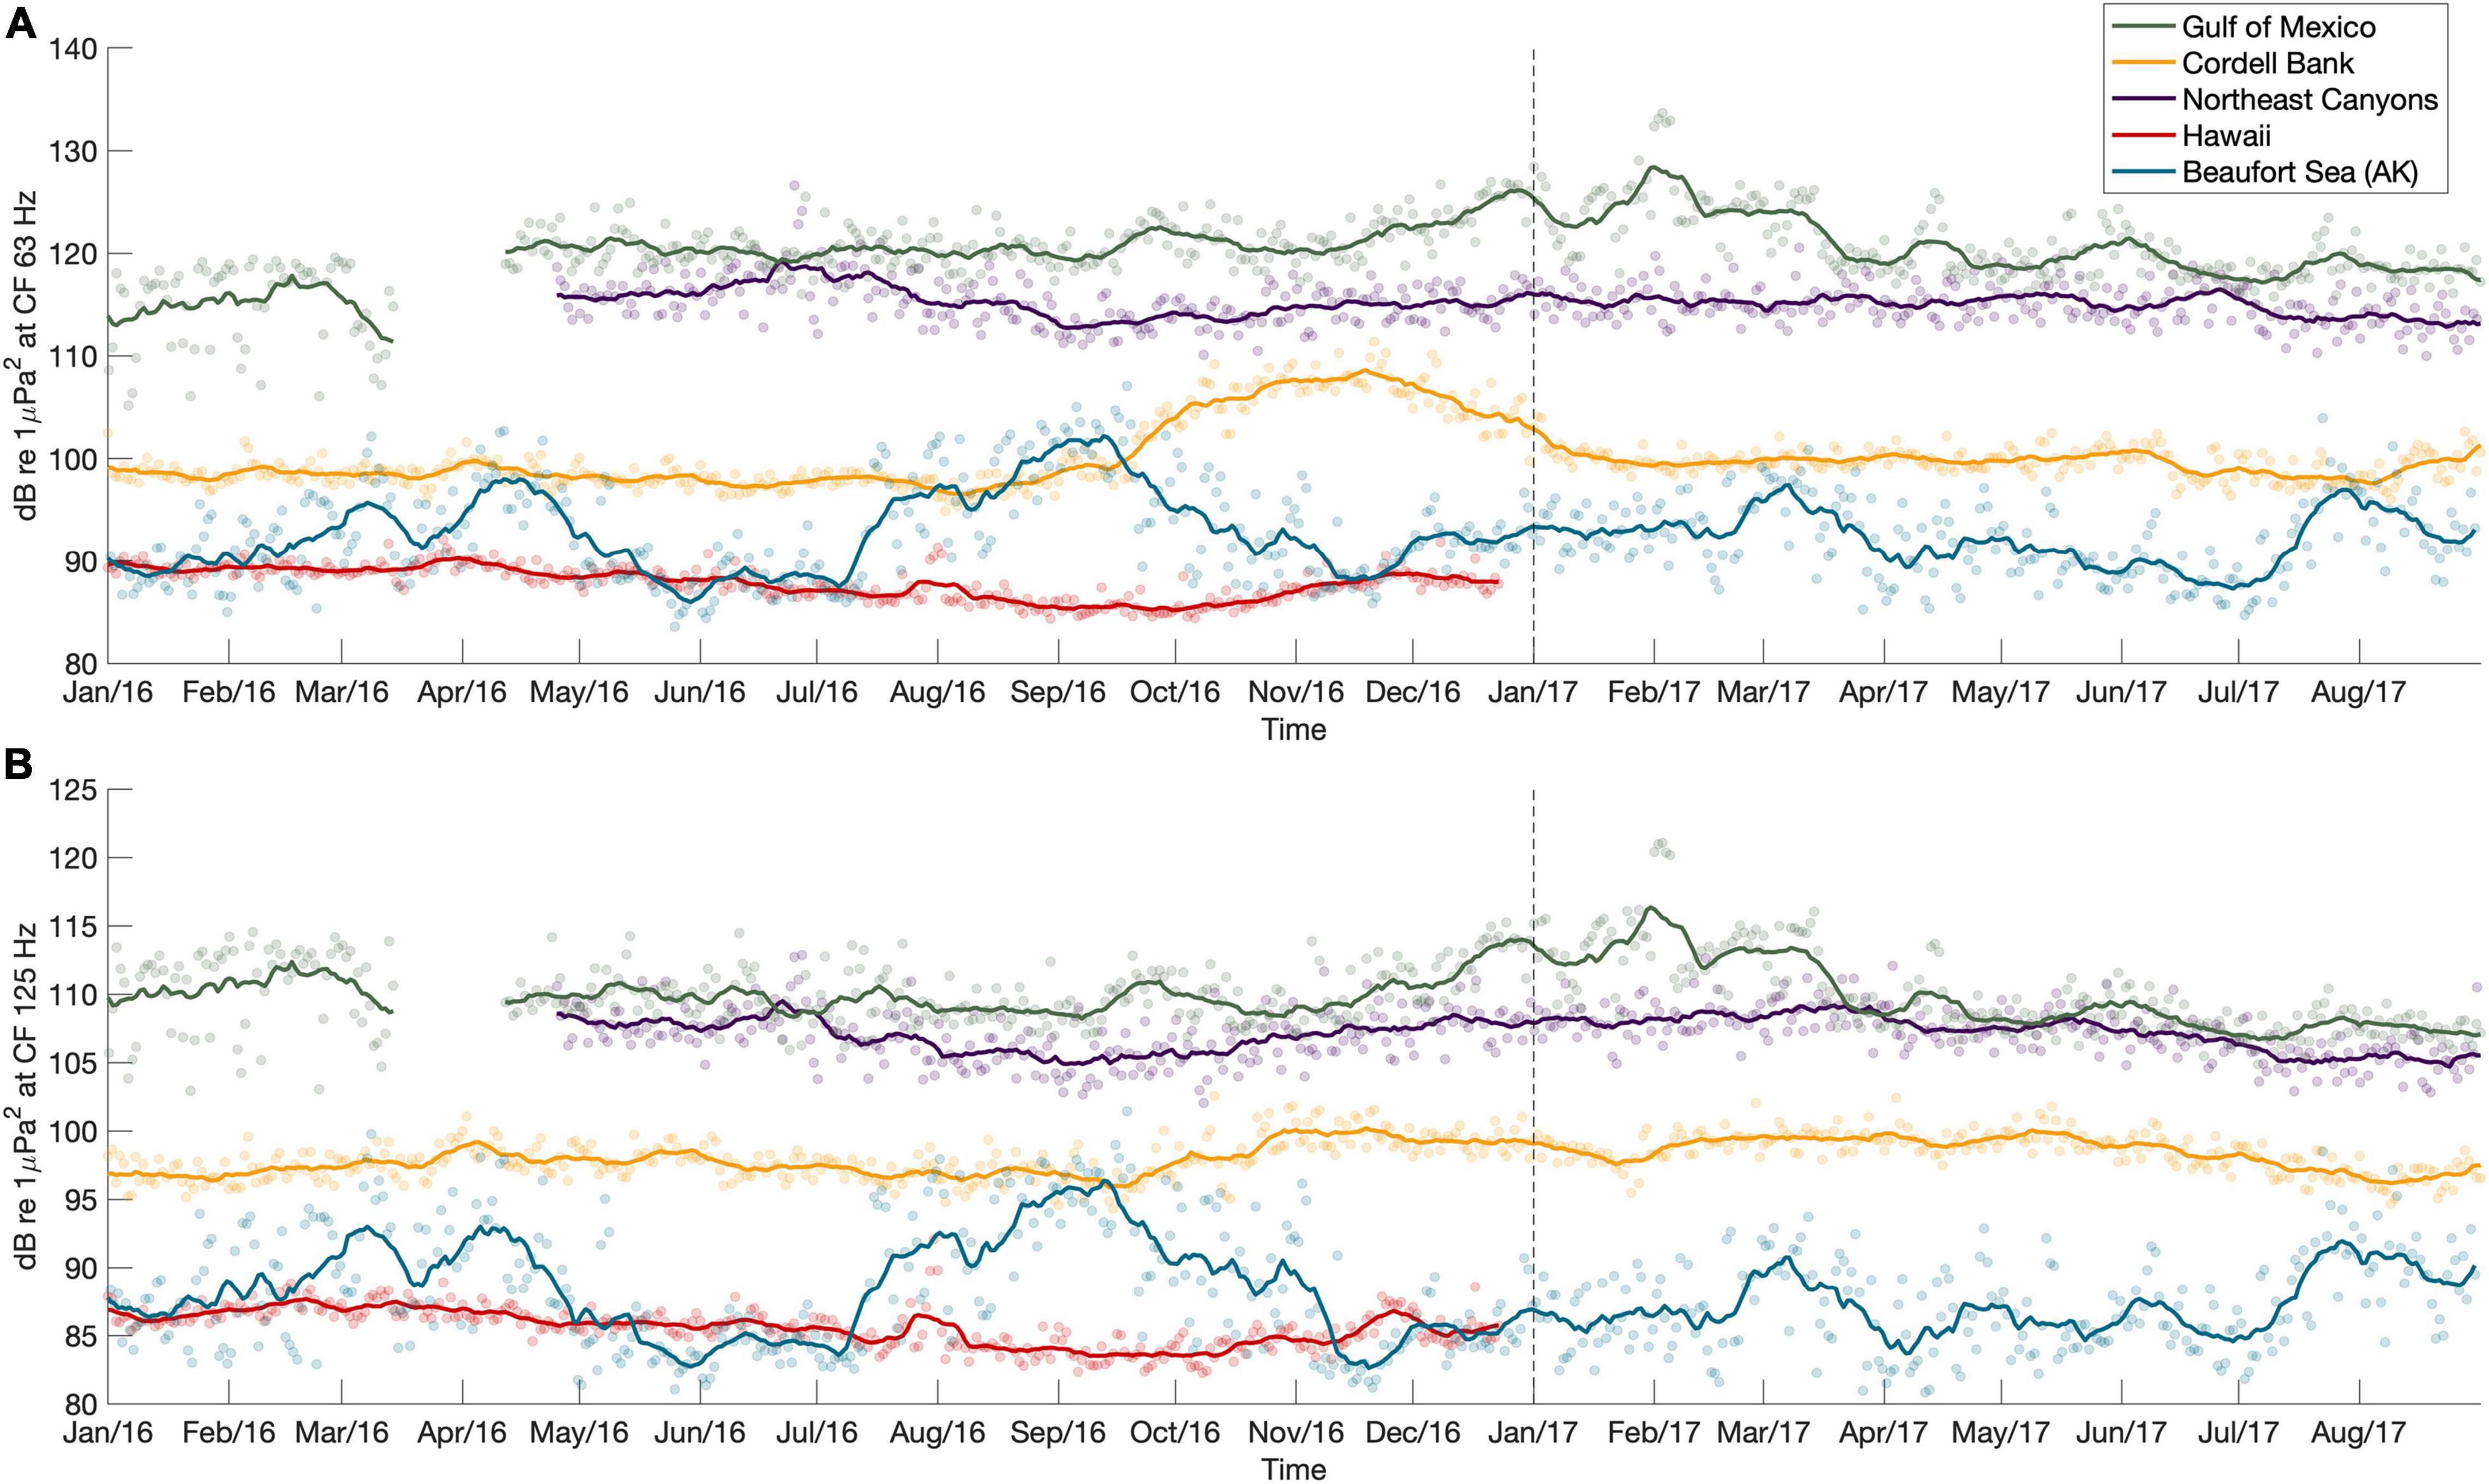
Figure 2. Daily one-third octave band sound pressure level measurements for 63 Hz (A) and 125 Hz (B) center frequencies (scatter plot) and overlaid 14-day moving average for five deep-water autonomous underwater hydrophone moorings from January 2016 through August 2017. Each mooring site is color-coded: Gulf of Mexico-green, Cordell Bank National Marine Sanctuary-yellow, Northeast Canyons and Seamounts National Monument-purple, Hawaii-red, Beaufort Sea Alaskan Arctic-blue.
Automatic Identification System Vessel Tracking
Monthly vessel activity at each site was summarized by the number of transits within a buffer, total nautical miles traveled within a buffer, and total time spent within a buffer (Figures 3, 4). The Gulf of Mexico site had the highest number of overall transits, more than double the number of cargo transits, and five times as many tanker transits as any other site (Figures 3, 4). The average number of monthly vessel transits in the Gulf of Mexico was 91, with a minimum of 59; 8 months had over 100 transits each (Figure 3). Cordell Bank had the second highest number of transits, averaging 41 transits per month, excluding an outlier of 166 transits observed in August 2017. Detailed review of AIS data revealed that half of the vessel transits detected in August 2017 were from three tug vessels transiting back and forth through the buffer repeatedly (83 transits). Monthly mean transits were comparatively much lower at the other three sites (Hawaii—14 transits/month, Northeast Canyons—9.2 transits/month, Beaufort Sea—0.5/month). With the increased 150 km buffer radius in the Beaufort Sea, the monthly mean number of transits increased to 34.5, still lower than the monthly mean number of transits in both the Gulf of Mexico and Cordell Bank.
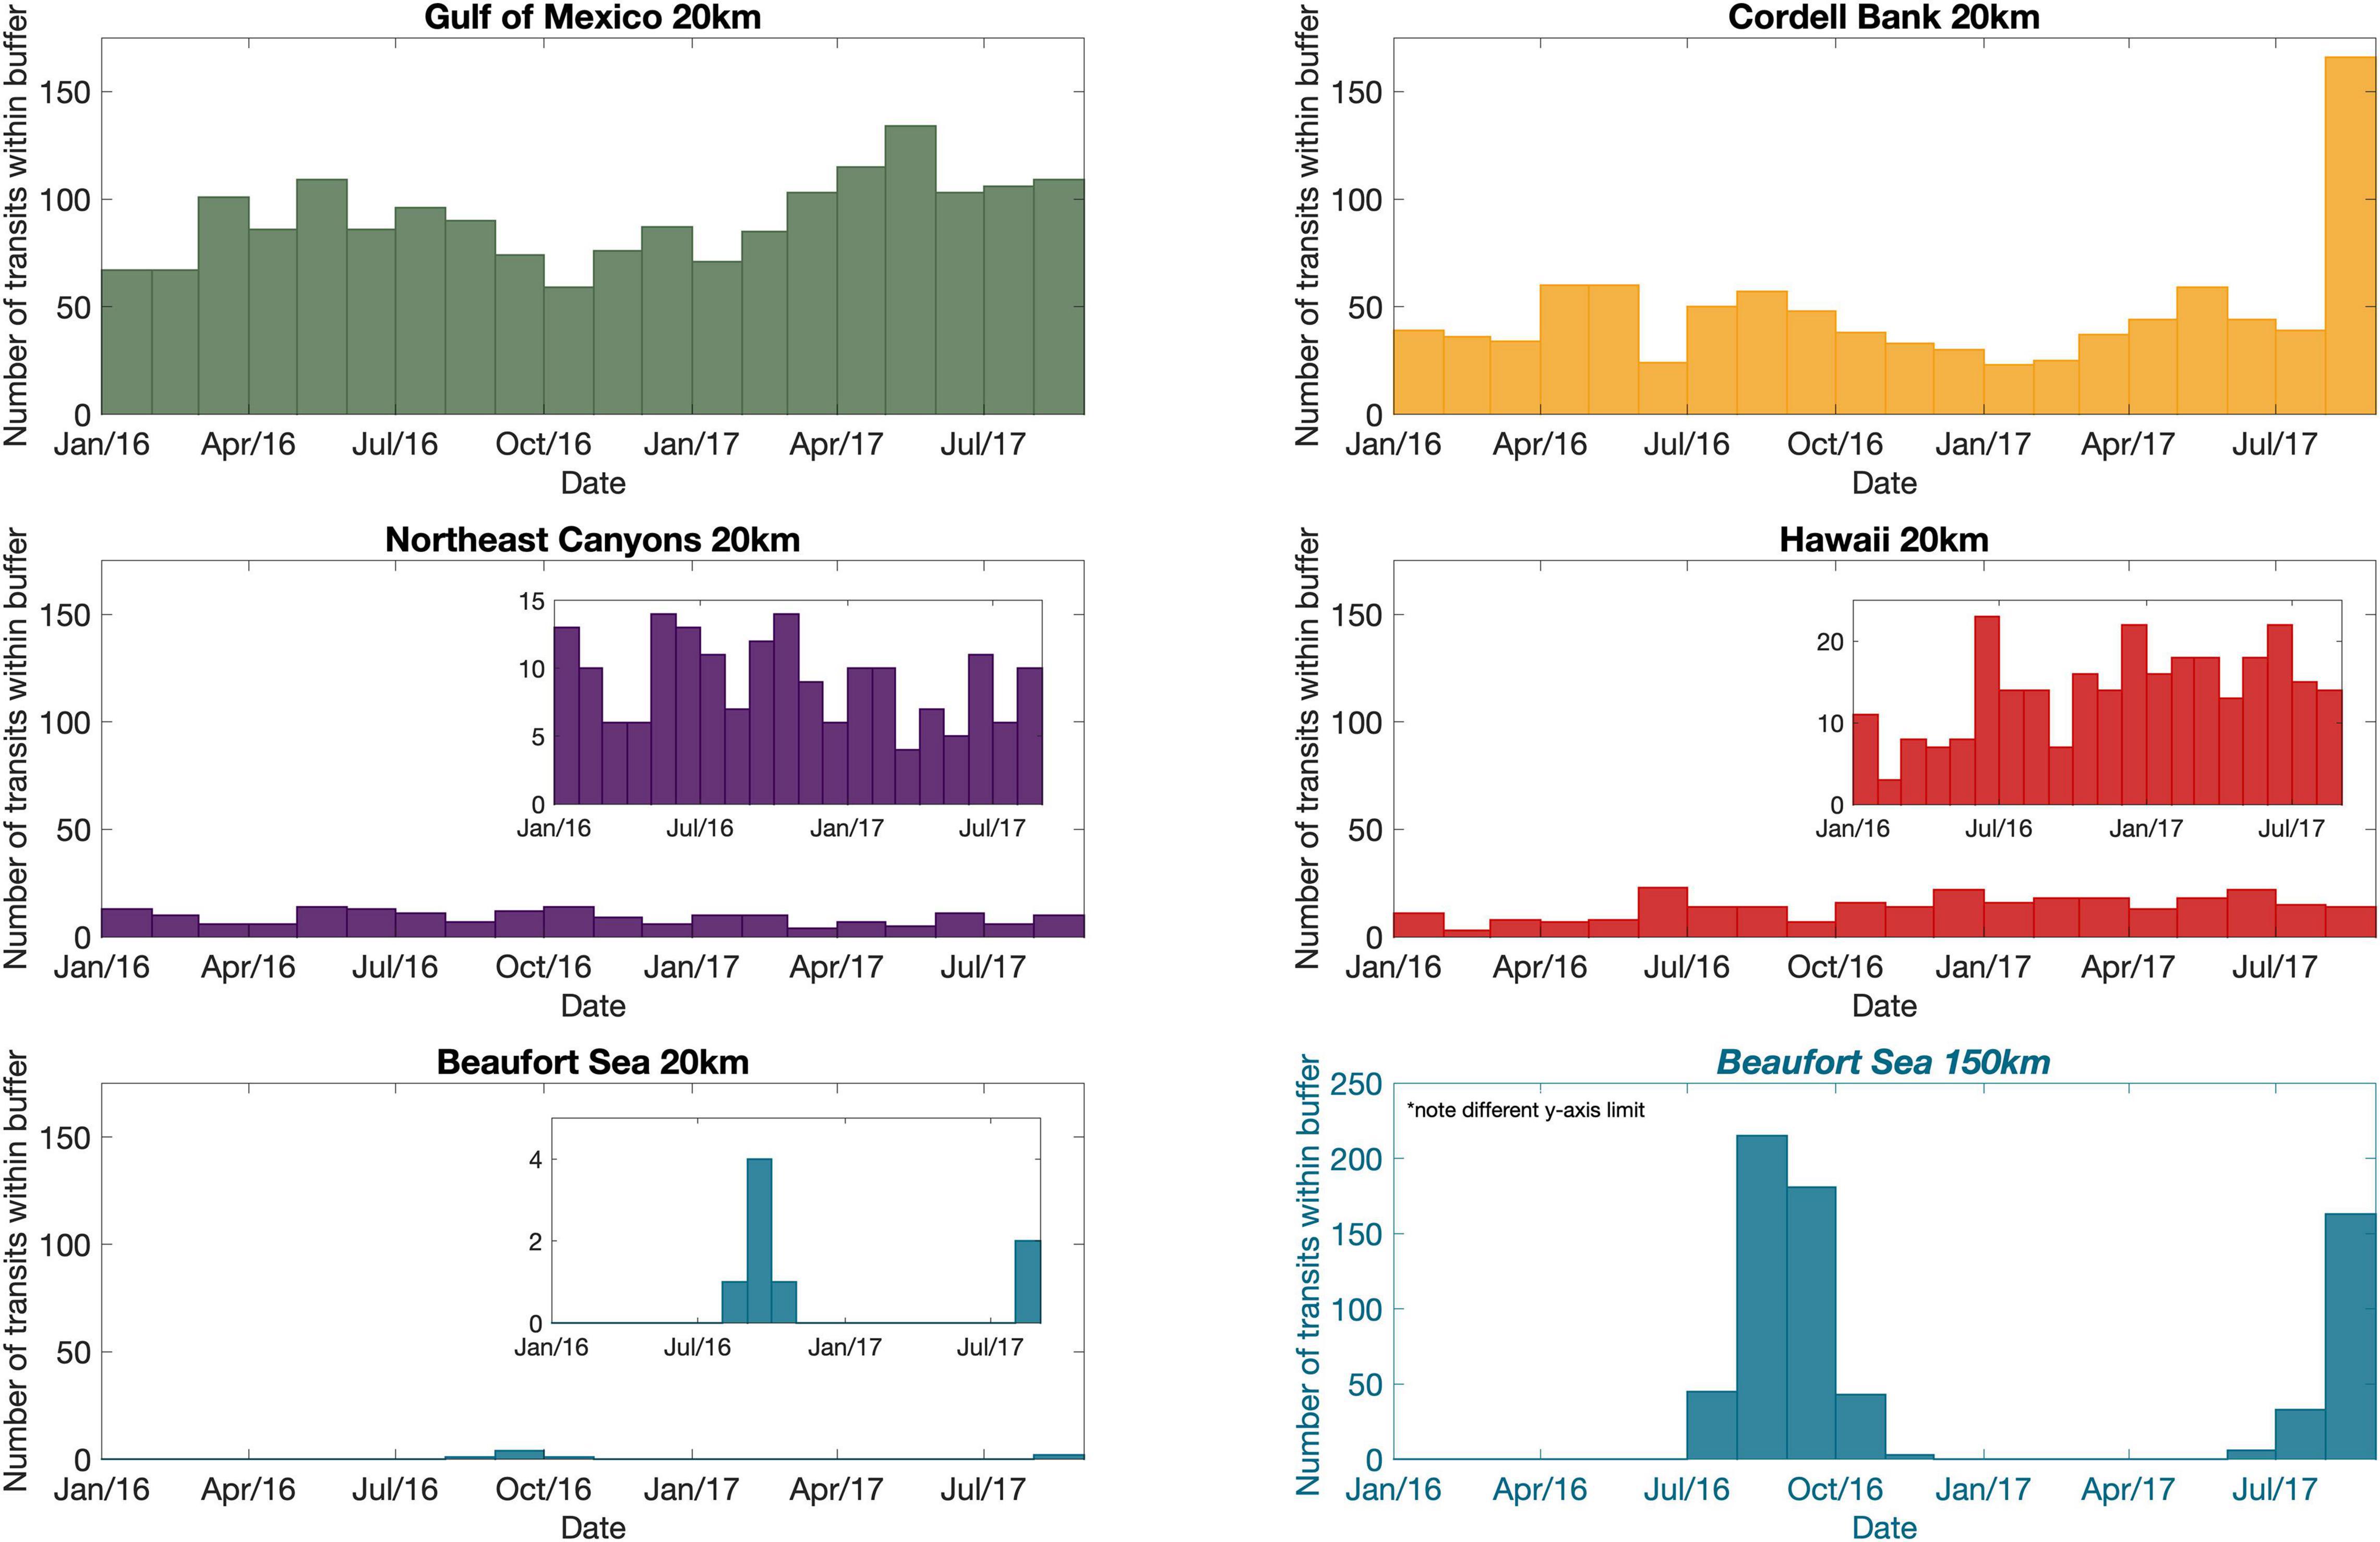
Figure 3. Site-specific histograms of the monthly sum of unique vessel transits within the buffer zone at each of the five deep-water autonomous underwater hydrophone moorings from January 2016 through August 2017. Inset histograms with lower y-axis limits show detail for the Northeast Canyons and Seamounts National Monument, Hawaii, and Beaufort Sea 20 km buffer zones. Results from the Beaufort Sea 150 km buffer zone are included in the bottom right panel histogram with blue axis and text.
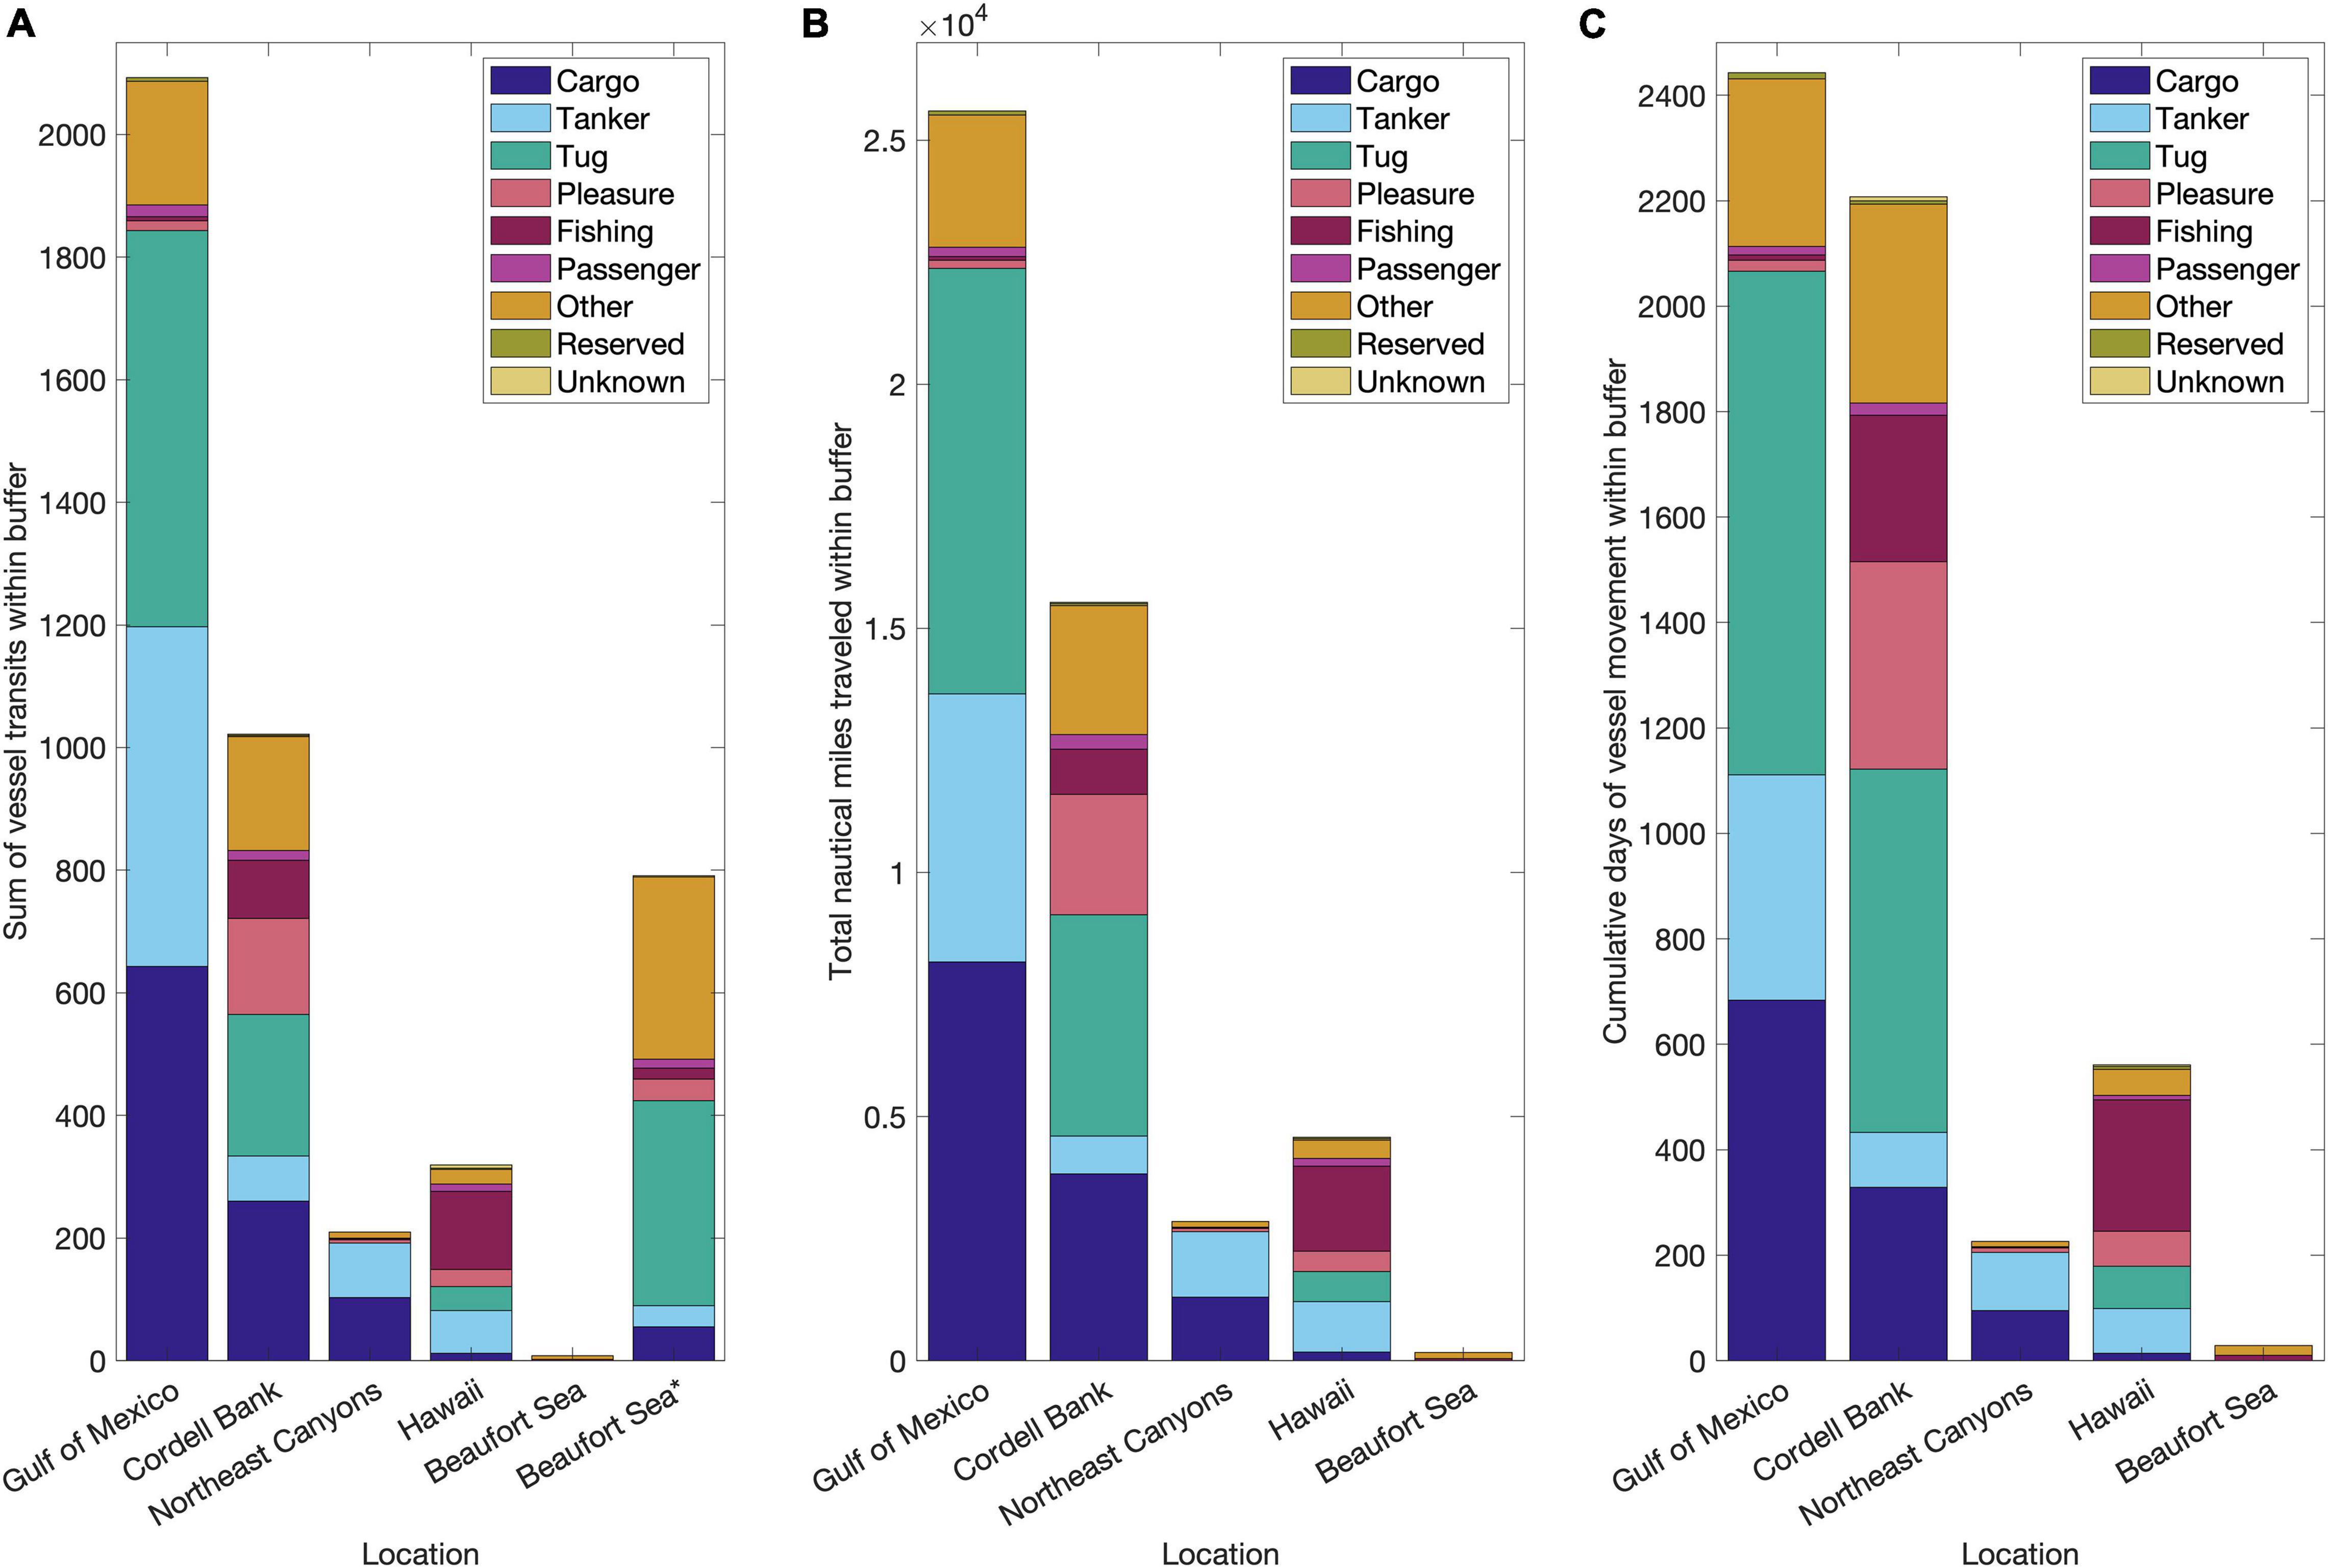
Figure 4. Site-specific histograms of the monthly sum of unique vessel transits (A), total distance traveled in nautical miles (B), and cumulative time measured in days (C) within the buffer zone at each of the five deep-water autonomous underwater hydrophone moorings from January 2016 through August 2017. Each vessel type is color-coded: cargo-indigo, tanker-cyan, tug-teal, pleasure-rose, fishing-wine, passenger-purple, other-ochre, reserved-olive, unknown-sand. Note that the Beaufort Sea 150 km buffer zone is included in the plot of number of transits (A) denoted with asterisk, but not on the total distance (B) or sum of time plot (C) due to the unequal comparison of the amount time spent within 150 km compared to 20 km for the other sites.
Distance traveled and total time within each site’s buffer radius, in additional to total number of transits, varied across the nine vessel types identified from the AIS data (Figure 4). The Gulf of Mexico, Cordell Bank, and Northeast Canyons saw mostly cargo vessels in transit. However, at these three sites, cargo vessels did not travel the most miles, nor did they spend the most time within the buffer. In the Gulf of Mexico and Cordell Bank, tug vessels traveled farther and spent more time within the buffer, while at Northeast Canyons, tanker vessels traveled comparatively further and spent more time within the buffer compared to cargo vessels. In Hawaii, fishing vessels were the most common, traveling more miles and also spending the most time inside the buffer area. Tankers were the second most common vessel type detected in Hawaii across all three variables of total transits, miles traveled, and time spent. The eight vessels that were detected within the Beaufort Sea 20 km radius were either fishing (two vessels) or classified as other, including three military, one search and rescue, one research, and one icebreaker. Within the Beaufort Sea 150 km radius, tug vessels transited through the larger buffer more than other vessel types.
Environmental Variables: Sea Ice Coverage in the Beaufort Sea
The Beaufort Sea is the only study site affected by seasonal ice coverage, which drives presence of both biological and anthropogenic sound sources (Moore and Laidre, 2006; Roth et al., 2012; Jones et al., 2014; Southall et al., 2020), as well as contributing significantly to the soundscape during seasonal freeze-up and melting (Milne and Ganton, 1964; Urick, 1971; Matsumoto et al., 2014; Menze et al., 2017). Monthly sea ice conditions at the Beaufort Sea site (72.443° W, 156.5517° N) varied seasonally, with peak ice coverage in the boreal winter and spring and open ocean in the late summer through early fall. Specifically, sea ice was compact/very close pack from January 2016 through May 2016, and December 2016 through May 2017. In June and July 2016, November 2016, and June 2017 sea ice was open drift/close pack. During July 2017 conditions were open water/very open drift, and from August 2016 through October 2016 and in August 2017 no sea ice coverage was detected (University of Alaska, 2020).
Discussion
Our results show that internationally standardized sound level indicators for commercial shipping activity can be applied to acoustic recordings of U.S. marine environments to assess the relative contribution of shipping (primarily cargo, but also tanker) activity within the soundscapes. By separating vessel activity by vessel type, we were able to observe a positive linear correlation between mean 63 and 125 Hz one-third octave frequency band (TOB) sound levels and the number of cargo vessel transits at each site. Specifically, mean TOB sound levels were higher at the sites with cargo vessel activity within the buffer radius compared to sites with much less or no cargo vessel activity (R2 = 0.6, Supplementary Figure 1). Furthermore, we found that at the sites with cargo vessel activity, the TOB sound levels measured were consistently near to or higher than the international 100 dB threshold for environmentally healthy levels of low-frequency continuous sound (Tasker et al., 2010). We found that the three sites with consistent cargo vessel activity met or exceeded this sound level threshold year-round, whereas sound levels were lower at sites with very limited or no cargo vessel activity.
Commercial Shipping Traffic Increases Indicator Sound Levels
The sum of vessel activity for all vessel types (i.e., transits, nautical miles traveled, and/or time spent) within the buffer did not necessarily predict sound levels. For example, at the Hawaii site, more vessel activity was observed compared to the Northeast Canyons site, yet the sound levels measured at the Northeast Canyons site were much higher than at the Hawaii site. This difference was driven by the types of vessels active at each of these sites, as the vessel activity within the Northeast Canyons buffer radius was nearly entirely shipping (cargo and tanker), whereas in Hawaii fishing vessels were the majority of tracked vessel activity; they were nearly 18 times more common than cargo vessels. The specific frequencies included in the 63 and 125 Hz center frequency TOBs are better suited to predict large cargo vessel activity compared to other smaller vessel types, due to the average size and speed of cargo vessels. Cargo vessels (i.e., dry goods transport) are the largest vessel type transiting the ocean, followed closely by tankers, which transport only liquid goods. In general, larger vessels generate lower frequency sound and vessels moving at faster speeds generate more acoustic energy (i.e., higher sound levels) (Gassmann et al., 2017; Veirs et al., 2018). To apply a TOB measurement to predict movement of comparatively smaller vessels (e.g., pleasure, fishing vessels), higher frequencies need to be measured (ANSI/ASA, 2009).
Indicator Band Sound Levels Increase With Proximity to Commercial Shipping Lanes
The AIS records used to capture vessel movement near the site were limited to a standardized 20 km buffer radius around each hydrophone to capture the relationship between local vessel activity and sound levels; however, in some conditions and sites, noise from very large and fast-moving vessels (and other high-energy sound sources) could propagate to the hydrophone from outside the buffer. The 20 km range was selected to ensure that all vessel sound within the radius would be detected even at the sites with highest ambient sound levels and used as proxy for local vessel traffic. To accurately account for the influence of distant shipping noise, detailed sound propagation models would be necessary to quantify the maximum distance vessels could be detected at the site; such detailed modeling is outside the scope of this paper.
In the comparison between more local ship traffic and sound levels, we observed different relationships between not just the movement of vessels but the proximity to designated commercial shipping lanes. For example, the 63 and 125 Hz TOB sound levels measured at the Northeast Canyons sites were higher than those measured at the Cordell Bank site, but more vessel movement was observed at the Cordell Bank site compared to the Northeast Canyons (Figure 4). This difference can be at least partially attributed to the specific location of each site in relation to shipping lanes and major port cities; the Northeast Canyons site is in very deep water (∼3,500 m) in the North Atlantic, offshore of New York City, and the Cordell Bank site is on the continental shelf in the North Pacific, within approximately 100 km of the entrance to the San Francisco Bay. Because of the proximity of the Cordell Bank site to shore, more vessels traveled within the narrow buffer radius, but at a quieter, slower speed as they approached port. In comparison, the offshore location of the Northeast Canyons site is within listening range of many louder, faster-moving vessels that did not transit through the 20 km buffer radius. This listening range is also impacted by the immediate environment of the hydrophone site. For example, compared to the Cordell Bank site on the continental shelf, sound propagates more efficiently in the deep, shelf-adjacent environment of the Northeast Canyons site. Additionally, the precise location of the Northeast Canyons site between commercial shipping lanes may have created a convergence zone at the hydrophone. If the hydrophone site was within a convergence zone, the hydrophone would sample concentrated acoustic energy from vessels, similar to if the vessel sound sources originated much closer to the hydrophone (Urick, 1983). While these variations of the immediate environments of each monitoring site complicate cross-site comparisons, there is minimal impact to our ability to track within site trends unless shipping routes change.
Seasonal and Location-Specific Non-vessel Sound Sources May Increase Indicator Sound Levels at Specific Times
Seismic Airgun Activity
Vessels are not the only chronic, anthropogenic low-frequency contributors to underwater soundscapes. In addition to the higher amounts of shipping traffic likely transiting just outside of the buffer radius (but within acoustic detection range), nearly 250 h of seismic airguns were detected in the North Atlantic near the Northeast Canyons site in 2016 alone, likely increasing sound levels recorded at the Northeast Canyons site (Van Parijs, unpublished data; see methods in Wiggins et al., 2016). Arrays of seismic airguns generate, for weeks or months at a time, intense and repetitive low-frequency sounds (via large air bubbles) that are utilized to locate oil and gas under the seafloor, and have been repeatedly linked to increased sound levels in the Atlantic and the Gulf of Mexico (Klinck et al., 2012; Nieukirk et al., 2012; Wiggins et al., 2016; Haver et al., 2017).
Across the sites included in this comparison, the highest sound levels were recorded in the Gulf of Mexico. Although we did not specifically analyze the data for the presence of seismic airguns, it is highly likely that seismic airguns contributed to the 63 and 125 Hz TOB sound levels measured at the Gulf of Mexico site in addition to shipping vessel activity (Wiggins et al., 2016). In the Gulf of Mexico, sound levels were highest in both TOBs between January and March 2017, while the lowest levels in the 63 Hz TOB were observed between January and March 2016, and from July and August 2017 in the 125 Hz TOB. As the Gulf of Mexico is a high-use area for both shipping and seismic airguns, these seasonal differences are likely related to fluctuation of those activities. Although the Gulf of Mexico is home to many marine species, large whales that vocalize within the 63 and 125 Hz TOBs are rare (Širović et al., 2014; Garrison and Aichinger Dias, 2020). Additionally, hurricanes are common between late May and early November and have the potential to impact low-frequency soundscapes; however, no hurricanes overlapped with the times of elevated sound levels in the Gulf of Mexico (NOAA National Hurricane Center, 2017).
Seasonal Impact of Whale Vocalizations
Mysticetes (baleen whales) contributed to sound levels within the 63 and 125 Hz TOBs across the environments included in this study. Energy band measurements such as TOBs are often an efficient and reliable method of identifying and monitoring persistent sound sources, but the presence of multiple sound sources with overlapping frequency ranges (such as whales and vessels) can impede identification of individual sources at fine temporal scales and hinder the ability to detect what is driving differences over space and time. However, unlike shipping vessels, the highest-intensity whale vocalizations that overlap the frequencies of the 63 and 125 Hz TOBs are seasonal rather than year-round contributors to the soundscape. For example, Northeast Pacific blue whale (Balaenoptera musculus) vocalizations (specifically A and B call types; McDonald et al., 1995) overlap with the frequencies of commercial shipping noise and are the likely cause of the increased 63 Hz TOB sound levels we observed at the Cordell Bank site from October through December (Haver et al., 2020). Depending on the number and location of the whales and vessels, and the relative location of the hydrophone to the sound sources, the whales and vessels can overshadow each other. However, by nature the loudest reproductive-function vocalizations of migratory species like whales are a seasonal behavior. Therefore, it is often possible to discern when these biological sounds increase sound levels compared to vessel-generated sounds that are less likely to vary on the same predictable seasonal time scales unless extraordinary conditions occur such as a major storm or economically related supply and demand disruptions (McKenna et al., 2012a; Thomson and Barclay, 2020).
Vocalizations of other mysticetes that overlap with the frequencies of the 63 Hz and/or 125 Hz TOBs across the different sites in this comparison are either less intense than vessel sound [e.g., gray whales (Eschrichtius robustus); Burnham and Duffus, 2019], uncommon [e.g., Bryde’s whale (Balaenoptera edeni); Garrison and Aichinger Dias, 2020], or distributed across a wider range of frequencies [e.g., humpback whales (Megaptera novaeangliae); Au et al., 2006] such that the energy within the shipping indicator bands is likely to be minimal. These species-specific differences contribute to the reliability of both shipping indicator band sound levels to measure vessel activity, as opposed to whale vocalizations. For example, the Hawaii site is near winter breeding habitat for humpback whales (Megaptera novaeangliae) (Palacios et al., 2019), where males display long, complex, and high-intensity vocalizations known as song (Payne and McVay, 1971). Yet, the acoustic properties of song are such that the energy is distributed across frequencies between ∼50 Hz–1.5 kHz (fundamental frequencies), so despite the repetitive vocalization behavior, the majority of singers did not impact averaged sound levels in the 63 and 125 Hz TOBs. Finally, the location of the Hawaii site north of Oahu is separated from the highest density humpback whale wintering habitat by volcanic islands. While it is possible for sound to travel around these submerged masses, significant energy is lost during propagation from the humpback whale source to the spatially distant hydrophone receiver, such that the vocalizations would be less likely to increase sound levels above ambient.
Sea Ice and Arctic Climate
The Beaufort Sea site is located within the Arctic circle and is the only site in this comparison to be seasonally affected by sea ice coverage, which can significantly impact underwater sound levels by physically blocking vessels, as well as limiting wave and wind noise. Specifically, when sea ice is compact, it has a noise-damping effect at the air-sea barrier, compared to relatively noisier time periods of freeze up, melt, and open ocean. Changing sea ice conditions also drive presence of specific marine mammal species throughout the year (Southall et al., 2020). These non-anthropogenic sources likely contribute to sound levels within the 63 and 125 Hz TOBs, affecting the reliability for isolating sound impacts from vessel activity (Blondel et al., 2020; Southall et al., 2020). Nevertheless, at this site we observed the highest sound levels within the 63 and 125 Hz TOBs (over 100 dB) during August and September 2016, corresponding to the times that the highest number of vessel transits was detected in the area. In August 2017 the sound levels were slightly lower, matching a reduction in vessel transits compared to the previous year. The lowest sound levels were observed below 90 dB in January-February, May–July, and November corresponding with times of compact or close pack ice (University of Alaska, 2020). An increase in sound levels in March (∼5 dB at peak) and April (∼7 dB at peak) was likely driven by bearded seal (Erignathus barbatus) vocalizations, which fall within the frequency range of the 63 and 125 Hz TOBs (Risch et al., 2007) and have been observed to peak during April (Jones et al., 2014). Bowhead whales (Balaena mysticetus) migrate to and from a wintering area in Bering Sea to a summer feeding area in the eastern Beaufort Sea in the spring and late fall when sea ice conditions are moderate to lightly packed (Moore and Laidre, 2006). Bowhead whale vocalizations are generally between 50 and 200 Hz, and thus likely increased sound levels at this site during migration passages in April-May and October-November (Clark and Johnson, 1984; Moore et al., 2010; Stafford et al., 2018), accounting for observed sound level increases during months with no vessel movement.
Conservation Concerns of Anthropogenic Noise in Marine Protected and Biological Areas of Interest
Commercial shipping noise and noise from other vessel types that generate high-intensity low-frequency sound is a high-priority conservation focus because of the frequency overlap between vessel noise and mysticete vocalizations. All of the sites included in this comparison are important animal habitats; two are designated as Marine Protected Areas (Northeast Canyons and Seamounts Marine National Monument and Cordell Bank National Marine Sanctuary), and the other three are within habitats that are important to large whale vocal behavior (Gulf of Mexico, Hawaii, Beaufort Sea). Within U.S. waters, NOAA is responsible for managing marine environments to conserve, among other things, habitat for threatened and endangered species; increased ocean noise is a domestic and international marine pollution issue of high concern (Gedamke et al., 2016; MSFD Common Implementation Strategy Technical Group on Underwater Noise [TG-Noise], 2019).
For decades, passive acoustic monitoring tools have offered relatively economical and low-environmental impact means of documenting underwater sound levels and sources (Richardson et al., 1995; National Research Council, 2003; Au and Hastings, 2008). These technological developments complement decades of marine animal research that show anthropogenic noise can have dramatic behavioral and physiological impacts on mammals, fish, and invertebrates and we continue to learn more through numerous ongoing efforts across multiple scales and species. For example, determining species-specific impacts of noise is essential to defining the thresholds of problematic noise exposure. Simultaneously, it is critical to document current baselines of sound levels and drivers of these levels in a standardized way so that coordinated conservation efforts can be implemented as needs are revealed.
Unlike take regulations for short-duration, high-intensity sounds, currently the U.S. does not have specific conservation policies regarding chronic ocean noise. In part, this is because it is challenging to control for chronic noise in observational research to test for behavioral and/or physiological changes of protected marine mammals in response to exposure. Although scientists, managers, and policymakers agree that chronic noise is problematic for marine animals, specific impacts are difficult to isolate, and the scope and severity of the issue remains uncertain. Additionally, despite decades of research, many questions remain regarding the life history of marine mammals. For example, since we do not know the distances over which whales need to communicate, we cannot fully understand how increasing chronic background noise may affect sensory capacity. Working in tandem with research on the effects of noise on marine species, efforts to monitor underwater noise conditions and track potential changes over time supports mutual goals to protect marine mammals and their habitats.
Building on ecosystem-based management conservation strategies, monitoring acoustic pressure indictor bands as a proxy for commercial shipping traffic could be combined with established marine mammal monitoring programs. For example, acoustic vessel monitoring data streams can be evaluated in tandem with real-time marine mammal alert networks (e.g., Baumgartner et al., 2020) to provide managers with estimated likelihood of whale-vessel spatial and temporal overlap. Adaptive management of high animal- and anthropogenic-use areas could simultaneously maximize conservation and economic priorities. Similarly, coordination of vessel noise monitoring metrics at established cabled real-time ambient sound monitoring sites (e.g., Ryan et al., 2016; Vancouver Fraser Port Authority, 2017) can produce comparable results of long-term ambient sound level trends.
Passive Acoustic Monitoring Is More Informative With Standardized Reporting
Coordinated long-term passive acoustic monitoring provides data on the status and trends of ambient sound levels, which can be compared to animal research to provide clues about how different species may respond to changes in their acoustic environments. The first step toward these research efforts is to establish monitoring sites and consistent data collection methods, as well as standardized metrics for comparison across spatial and temporal scales. The European Union standard pressure indicator frequency bands are an efficient and straightforward internationally accepted starting point for these comparisons. Additionally, widespread adoption of standardized metrics will simplify comparisons across different recording platforms and research projects (Miksis-Olds et al., 2021), and can provide managers with information that is necessary for making decisions about protecting acoustic habitats (for example, see IQOE, 2019). Current international standards for ambient sound levels dictate that sound pressure in the indicator frequency bands should not exceed an average of 100 dB re 1μPa or the baseline levels within the indicator bands over a year (Tasker et al., 2010). Establishing baseline levels in U.S. waters is the first step toward implementing comparative methods for widespread monitoring of ambient noise associated with commercial shipping.
Conclusion
Although a perfect proxy for measuring the impacts of commercial shipping activities in soundscapes will likely never exist, the 63 and 125 Hz TOB pressure indicator bands provide an initial step to identifying when and where to direct more thorough investigations. Coordinated metrics can facilitate comparisons across different monitoring platforms and research projects to compose a global picture of how human activities impact the ocean (Chou et al., 2021). For example, calibrated passive acoustic monitoring can be used to quantify sound levels across space and time to provide on-going information about conditions in underwater environments. Additionally, acoustic monitoring can be utilized to track the efficacy of vessel designs with quieter, more efficient propulsion technology, even as consumer demand continues to drive increases in fleet size and carrying capacity. The baselines we lay forth here are a starting point to demonstrate the application of international pressure indicators to approximate the acoustic impact of commercial shipping activity in U.S. territorial waters.
Data Availability Statement
The datasets presented in this study can be found in online repositories. The names of the repository/repositories and accession number(s) can be found below: https://www.ncei.noaa.gov/maps/passive_acoustic_data/.
Author Contributions
LH, SV, RD, JH, MM, DM, and JG conceived and designed the Noise Reference Station Network and contributed passive acoustic data. JA contributed Automatic Information System vessel data for all sites. SMH designed the current study with JA, JG, LH, and SV. SMH analyzed and synthesized the data with support from JA, LH, SV, SAH, and JG. SMH prepared the figures and drafted the manuscript. All authors edited the manuscript.
Funding
This work was supported by the NOAA Pacific Marine Environmental Laboratory (OAR), Office of Science and Technology (NMFS), Office of National Marine Sanctuaries (NOS), and the Dr. Nancy Foster Scholarship Program (SMH). Additional resources were provided by Oregon State University and the Hatfield Marine Science Center. Publication of this manuscript was supported by the Mamie L. Markham Endowment Award (SMH).
Conflict of Interest
The authors declare that the research was conducted in the absence of any commercial or financial relationships that could be construed as a potential conflict of interest.
The reviewer DP declared a past co-authorship with one of the author DM to the handling editor.
Publisher’s Note
All claims expressed in this article are solely those of the authors and do not necessarily represent those of their affiliated organizations, or those of the publisher, the editors and the reviewers. Any product that may be evaluated in this article, or claim that may be made by its manufacturer, is not guaranteed or endorsed by the publisher.
Acknowledgments
The authors thank their collaborators: Haru Matsumoto, T. K. Andy Lau, Lauren Roche, Brian Kahn, Tim Rowell, Genevieve Davis, Melissa Soldevilla, Erin Oleson, Danielle Lipski, Michael Craig, Chris Meinig, Carrie Wall Bell, and Charles Anderson. This is NOAA/PMEL contribution #5192.
Supplementary Material
The Supplementary Material for this article can be found online at: https://www.frontiersin.org/articles/10.3389/fmars.2021.669528/full#supplementary-material
Supplementary Figure 1 | Scatter plot of both the 125 Hz (blue) and 63 Hz (orange) one-third octave frequency band (TOB) sound levels and the sum of cargo vessel transits from each of the five sites. Both 125 and 63 Hz TOB sound levels were positively correlated with number of cargo vessel transits.
Supplementary Table 1 | Median, maximum, and minimum daily sound pressure levels (dB re 1 μPa) for both 63 Hz and 125 Hz one-third octave bands at each of the five sites during the 2016-2017 sampling time period.
Footnotes
- ^ https://www.navcen.uscg.gov/?pageName=AISRequirementsRev. Last accessed 10/01/2020.
- ^ https://www.federalregister.gov/documents/2015/01/30/2015-01331/vessel-requirements-for-notices-of-arrival-and-departure-and-automatic-identification-system. Last accessed 10/01/2020.
- ^ https://coast.noaa.gov/data/marinecadastre/ais/VesselTypeCodes2018.pdf. Last accessed 08/26/2020.
- ^ https://www.marinetraffic.com. Last accessed 08/26/2020.
References
Andrew, R. K., Howe, B. M., Mercer, J. A., and Dzieciuch, M. A. (2002). Ocean ambient sound: comparing the 1960s with the 1990s for a receiver off the California coast. Acoust. Res. Lett. Online 3:65. doi: 10.1121/1.1461915
ANSI/ASA (2009). ANSI S12.64-2009, Quantities and Procedures for Description and Measurement of Underwater Sound from Ships–Part 1: General Requirements. New York, NY: ANSI/ASA.
Au, W. W. L., and Hastings, M. C. (2008). Principles of Marine Bioacoustics. New York, NY: Springer.
Au, W. W. L., Pack, A. A., Lammers, M. O., Herman, L. M., Deakos, M. H., and Andrews, K. (2006). Acoustic properties of humpback whale songs. J. Acoust. Soc. Am. 120, 1103–1110. doi: 10.1121/1.2211547
Bassett, C., Polagye, B., Holt, M. M., and Thomson, J. (2012). A vessel noise budget for Admiralty Inlet, Puget Sound, Washington (USA). J. Acoust. Soc. Am. 132, 3706–3719. doi: 10.1121/1.4763548
Baumgartner, M. F., Bonnell, J., Corkeron, P. J., Van Parijs, S. M., Hotchkin, C., Hodges, B. A., et al. (2020). Slocum gliders provide accurate near real-time estimates of baleen whale presence from human-reviewed passive acoustic detection information. Front. Mar. Sci. 7:100. doi: 10.3389/fmars.2020.00100
Blondel, P., Dell, B., and Suriyaprakasam, C. (2020). Acoustic signatures of shipping, weather and marine life: comparison of NE Pacific and Arctic Soundscapes. Proc. Meet. Acoust. Acoust. Soc. Am. ASA 40:070011. doi: 10.1121/2.0001312
Burnham, R. E., and Duffus, D. A. (2019). The use of passive acoustic monitoring as a census tool of gray whale (Eschrichtius robustus) migration. Ocean Coast. Manag. 188:105070. doi: 10.1016/j.ocecoaman.2019.105070
Chapman, N. R., and Price, A. (2011). Low frequency deep ocean ambient noise trend in the Northeast Pacific Ocean. J. Acoust. Soc. Am. 129, EL161–EL165. doi: 10.1121/1.3567084
Chou, E., Southall, B. L., Robards, M., and Rosenbaum, H. C. (2021). International policy, recommendations, actions and mitigation efforts of anthropogenic underwater noise. Ocean Coast. Manag. 202:105427. doi: 10.1016/j.ocecoaman.2020.105427
Clark, C. W., and Johnson, J. (1984). Bowhead whale (Balaena mysticetus) sounds during the spring migrations of 1979 and 1980. Can. J. Zool. 62:1. doi: 10.5962/p.241258
Derryberry, E. P., Phillips, J. N., Derryberry, G. E., Blum, M. J., and Luther, D. (2020). Singing in a silent spring: birds respond to a half-century soundscape reversion during the COVID-19 shutdown. Science 370, 575–579. doi: 10.1126/science.abd5777
Duarte, C. M., Chapuis, L., Collin, S. P., Costa, D. P., Devassy, R. P., Eguiluz, V. M., et al. (2021). The soundscape of the anthropocene ocean. Science 371, 1–10. doi: 10.1126/science.aba4658
Erbe, C., Marley, S. A., Schoeman, R. P., Smith, J. N., Trigg, L. E., and Embling, C. B. (2019). The effects of ship noise on marine mammals—a review. Front. Mar. Sci. 6:606. doi: 10.3389/fmars.2019.00606
European Union (2008). Marine Strategy Framework Directive. Directive 2008/56/EC. Brussels: European Union
Firestone, J., and Jarvis, C. (2007). Response and responsibility: regulating noise pollution in the marine environment. J. Int. Wildl. Law Policy 10, 109–152. doi: 10.1080/13880290701347408
Frisk, G. V. (2012). Noiseonomics: the relationship between ambient noise levels in the sea and global economic trends. Sci. Rep. 2:437. doi: 10.1038/srep00437
Garrison, L. P., and Aichinger Dias, L. (2020). Distribution and Abundance of Cetaceans in the Northern Gulf of Mexico. NOAA Technical Memorandum NMFS-SEFSC-747. Washington, DC: National Oceanic and Atmospheric Administration, 40. doi: 10.25923/M41H-SC54
Gassmann, M., Wiggins, S. M., and Hildebrand, J. A. (2017). Deep-water measurements of container ship radiated noise signatures and directionality. J. Acoust. Soc. Am. 142, 1563–1574. doi: 10.1121/1.5001063
Gedamke, J., Harrison, J., Hatch, L., Angliss, R., Barlow, J., Berchok, C., et al. (2016). Ocean Noise Strategy Roadmap. 144. Available online at: http://cetsound.noaa.gov/road-map (accessed October 24, 2018).
Hatch, L., Wahle, C., Gedamke, J., Harrison, J., Laws, B., Moore, S., et al. (2016). Can you hear me here? Managing acoustic habitat in US waters. Endanger. Species Res. 30, 171–186. doi: 10.3354/esr00722
Haver, S. M., Fournet, M. E. H., Dziak, R. P., Gabriele, C., Gedamke, J., Hatch, L. T., et al. (2019). Comparing the underwater soundscapes of four U.S. National Parks and marine Sanctuaries. Front. Mar. Sci. 6:500. doi: 10.3389/fmars.2019.00500
Haver, S. M., Gedamke, J., Hatch, L. T., Dziak, R. P., Van Parijs, S., McKenna, M. F., et al. (2018). Monitoring long-term soundscape trends in U.S. Waters: the NOAA/NPS Ocean Noise Reference Station Network. Mar. Policy 90, 6–13. doi: 10.1016/j.marpol.2018.01.023
Haver, S. M., Klinck, H., Nieukirk, S. L., Matsumoto, H., Dziak, R. P., and Miksis-Olds, J. L. (2017). The not-so-silent world: measuring Arctic, Equatorial, and Antarctic soundscapes in the Atlantic Ocean. Deep Sea Res. Part I Oceanogr. Res. Pap. 122, 95–104. doi: 10.1016/j.dsr.2017.03.002
Haver, S. M., Rand, Z., Hatch, L. T., Lipski, D., Dziak, R. P., Gedamke, J., et al. (2020). Seasonal trends and primary contributors to the low-frequency soundscape of the Cordell Bank National Marine Sanctuary. J. Acoust. Soc. Am. 148, 845–858. doi: 10.1121/10.0001726
IQOE (2019). Guidelines for Observation of Ocean Sound. 1–18. Available online at: https://scor-int.org/IQOE/IQOE_2019_Standards_Workshop_Report.pdf (accessed November 10, 2020).
Jones, J. M., Thayre, B. J., Roth, E. H., Mahoney, M., Sia, I., Merculief, K., et al. (2014). Ringed, bearded, and ribbon seal vocalizations north of Barrow, Alaska: seasonal presence and relationship with sea ice. Arctic 67, 203–222. doi: 10.14430/arctic4388
Kaplan, M. B., and Solomon, S. (2016). A coming boom in commercial shipping? The potential for rapid growth of noise from commercial ships by 2030. Mar. Policy 73, 119–121. doi: 10.1016/j.marpol.2016.07.024
Klinck, H., Nieukirk, S. L., Mellinger, D. K., Klinck, K., Matsumoto, H., and Dziak, R. P. (2012). Seasonal presence of cetaceans and ambient noise levels in polar waters of the North Atlantic. J. Acoust. Soc. Am. 132:EL176. doi: 10.1121/1.4740226
Matsumoto, H., Bohnenstiehl, D. R., Tournadre, J., Dziak, R. P., Haxel, J. H., Lau, T.-K. A., et al. (2014). Antarctic icebergs: a significant natural ocean sound source in the Southern Hemisphere. Geochem. Geophys. Geosyst. 15, 4692–4711. doi: 10.1002/2014GC005563
McDonald, M. A., Hildebrand, J. A., and Webb, S. C. (1995). Blue and find whales observed on a seafloor array in the Northeast Pacific. J. Acoust. Soc. Am. 98, 712–721. doi: 10.1121/1.413565
McDonald, M. A., Hildebrand, J. A., and Wiggins, S. M. (2006). Increases in deep ocean ambient noise in the Northeast Pacific west of San Nicolas Island, California. J. Acoust. Soc. Am. 120, 711–718. doi: 10.1121/1.2216565
McKenna, M. F., Ross, D., Wiggins, S. M., and Hildebrand, J. A. (2012b). Underwater radiated noise from modern commercial ships. J. Acoust. Soc. Am. 131, 92–103. doi: 10.1121/1.3664100
McKenna, M. F., Katz, S. L., Wiggins, S. M., Ross, D., and Hildebrand, J. A. (2012a). A quieting ocean: unintended consequence of a fluctuating economy. J. Acoust. Soc. Am. 132, EL169–EL175. doi: 10.1121/1.4740225
Menze, S., Zitterbart, D., van Opzeeland, I., and Boebel, O. (2017). The influence of sea ice, wind speed and marine mammals on Southern Ocean ambient sound. R. Soc. Open Sci. 4:160370. doi: 10.1098/rsos.160370
Miksis-Olds, J. L., and Nichols, S. M. (2016). Is low frequency ocean sound increasing globally? J. Acoust. Soc. Am. 139, 501–511. doi: 10.1121/1.4938237
Miksis-Olds, J. L., Dugan, P. J., Martin, S. B., Klinck, H., Mellinger, D. K., Mann, D. A., et al. (2021). Ocean sound analysis software for making ambient noise trends accessible (MANTA). Front. Mar. Sci. 8:703650. doi: 10.3389/fmars.2021.703650
Miksis-Olds, J., Smith, C. M., Hawkins, R. S., and Bradley, D. L. (2012). Seasonal soundscapes from three ocean basins: what is driving the differences? Proc. Meet. Acoust. 17, 1–6. doi: 10.1121/1.4772730
Milne, A. R., and Ganton, J. H. (1964). Ambient noise under Arctic-Sea Ice. J. Acoust. Soc. Am. 36, 855–863. doi: 10.1098/rspb.2020.2712
Moore, S. E., and Laidre, K. L. (2006). Trends in sea ice cover within habitats used by bowhead whales in the western Arctic. Ecol. Appl. 16, 932–944. doi: 10.1890/1051-0761(2006)016[0932:tisicw]2.0.co;2
Moore, S. E., Stafford, K. M., and Munger, L. M. (2010). Acoustic and visual surveys for bowhead whales in the western Beaufort and far northeastern Chukchi seas. Deep Sea Res. Part II Top. Stud. Oceanogr. 57, 153–157. doi: 10.1016/J.DSR2.2009.08.013
MSFD Common Implementation Strategy Technical Group on Underwater Noise [TG-Noise] (2019). Management and Monitoring of Underwater Noise in European Seas – Overview of Main European-Funded Projects and Other Relevant Initiatives. 2nd Communication Report. December 2019. Available online at: https://www.eucc.net/uploads/12/Management%20and%20monitoring%20of%20underwater%20noise%20in%20European%20Seas%20-%20Overview%20of%20main%20European-funded%20projects%20and%20other%20relevant%20initiatives_FINAL.pdf
National Research Council (2003). Ocean Noise and Marine Mammals. Committee on Potential Impacts of Ambient Noise in the Ocean on Marine Mammals. Washington, DC: National Academies Press.
Nieukirk, S. L., Mellinger, D. K., Moore, S. E., Klinck, K., Dziak, R. P., and Goslin, J. (2012). Sounds from airguns and fin whales recorded in the mid-Atlantic Ocean, 1999–2009. J. Acoust. Soc. Am. 131:1102. doi: 10.1121/1.3672648
NOAA National Hurricane Center (2017). Atlantic Hurricane Season. US Dep. Commer., 1. Available online at: https://www.nhc.noaa.gov/data/tcr/index.php?season=2017&basin=atl (accessed October 26, 2020).
Palacios, D. M., Mate, B. R., Baker, C. S., Hayslip, C. E., Follett, T. M., Steel, D., et al. (2019). Tracking North Pacific Humpback Whales To Unravel Their Basin-Wide Movements. Final Technical Report. Prepared for Pacific Life Foundation. Newport, OR: Marine Mammal Institute, Oregon State University. doi: 10.5399/osu/1117
Pirotta, V., Grech, A., Jonsen, I. D., Laurance, W. F., and Harcourt, R. G. (2018). Consequences of global shipping traffic for marine giants. Front. Ecol. Environ. 17:1987. doi: 10.1002/fee.1987
Richardson, W. J., Greene, C. R., Malme, C. I., and Thomson, D. H. (1995). Marine Mammals and Noise. San Diego, CA: Academic Press.
Risch, D., Clark, C. W., Corkeron, P. J., Elepfandt, A., Kovacs, K. M., Lydersen, C., et al. (2007). Vocalizations of male bearded seals, Erignathus barbatus: classification and geographical variation. Anim. Behav. 73, 747–762. doi: 10.1016/j.anbehav.2006.06.012
Roth, E. H., Hildebrand, J. A., Wiggins, S. M., and Ross, D. (2012). Underwater ambient noise on the Chukchi Sea continental slope from 2006–2009. J. Acoust. Soc. Am. 131, 104–110. doi: 10.1121/1.3664096
Ryan, J., Cline, D., Dawe, C., Mcgill, P., Zhang, Y., Joseph, J., et al. (2016). “New passive acoustic monitoring in Monterey bay national marine sanctuary: exploring natural and anthropogenic sounds in a deep soundscape,” in Proceedings of the OCEANS 2016 MTS/IEEE Monterey, Monterey, CA, 1–8. doi: 10.1016/s0025-3227(01)00258-4
Širović, A., Bassett, H. R., Johnson, S. C., Wiggins, S. M., and Hildebrand, J. A. (2014). Bryde’s whale calls recorded in the Gulf of Mexico. Mar. Mammal Sci. 30, 399–409. doi: 10.1111/mms.12036
Širović, A., Wiggins, S. M., and Oleson, E. M. (2013). Ocean noise in the tropical and subtropical Pacific Ocean. J. Acoust. Soc. Am. 134, 2681–2689. doi: 10.1121/1.4820884
Southall, B. L., Southall, H., Antunes, R., Nichols, R., Rouse, A., Stafford, K. M., et al. (2020). Seasonal trends in underwater ambient noise near St. Lawrence Island and the Bering Strait. Mar. Pollut. Bull. 157:111283. doi: 10.1016/j.marpolbul.2020.111283
Stafford, K. M., Castellote, M., Guerra, M., and Berchok, C. L. (2018). Seasonal acoustic environments of beluga and bowhead whale core-use regions in the Pacific Arctic. Deep Sea Res. Part II Top. Stud. Oceanogr. 152, 108–120. doi: 10.1016/J.DSR2.2017.08.003
Tasker, M. L., Amundin, M., André, M., Hawkins, A., Lang, W., Merck, T., et al. (2010). Marine Strategy Framework Directive Task Group 11 Report: Underwater Noise and Other Forms of Energy. Ispra: Joint Research Centre. doi: 10.2788/87079
Thomsen, F., Erbe, C., Hawkins, A., Lepper, P., Popper, A. N., Scholik-Schlomer, A., et al. (2020). Introduction to the special issue on the effects of sound on aquatic life. J. Acoust. Soc. Am. 148, 934–938. doi: 10.1121/10.0001725
Thomson, D. J. M., and Barclay, D. R. (2020). Real-time observations of the impact of COVID-19 on underwater noise. J. Acoust. Soc. Am. 147, 3390–3396. doi: 10.1121/10.0001271
Tyack, P. L. (2018). Ocean Sound. Essent. Ocean Var. Biol. Ecosyst. 1–16. Available online at: https://www.goosocean.org/components/com_oe/oe.php?task=download&id=40209&version=1.0&lang=1&format=15 (accessed October 24, 2018).
University of Alaska (2020). Historical Sea Ice Atlas. Available online at: http://seaiceatlas.snap.uaf.edu/ (accessed September 4, 2020).
Urick, R. J. (1971). The noise of melting icebergs. J. Acoust. Soc. Am. 50, 337–341. doi: 10.1121/1.1912637
Van der Graaf, A., Ainslie, M., André, M., Brensing, K., Dalen, J., Dekeling, R., et al. (2012). European Marine Strategy Framework Directive - Good Environmental Status (MSFD GES): Report of the Technical Subgroup on Underwater Noise and Other Forms of Energy. Brussels: TSG Noise & Milieu Ltd.
Van Parijs, S. M., Curtice, C., and Ferguson, M. C. eds (2015). Biologically Important Areas for cetaceans within U.S. waters. Aquatic Mammals (Special Issue). Aquat. Mamm. 41, 1–128. doi: 10.1578/AM.41.1.2015.1
Vancouver Fraser Port Authority (2017). Enhancing Cetacean Habitat and Observation (ECHO) Program 2016 Annual Report. Vancouver, BC: Vancouver Fraser Port Authority.
Veirs, S., Veirs, V., Williams, R., Jasny, M., and Wood, J. (2018). A key to quieter seas: half of ship noise comes from 15% of the fleet. PeerJ 6:e26525v1. doi: 10.7287/peerj.preprints.26525v1
Wenz, G. M. (1962). Acoustic ambient noise in the ocean: spectra and sources. J. Acoust. Soc. Am. 34, 1936–1956. doi: 10.1121/1.1909155
Wiggins, S. M., Hall, J. M., Thayre, B. J., and Hildebrand, J. A. (2016). Gulf of Mexico low-frequency ocean soundscape impacted by airguns. J. Acoust. Soc. Am. 140, 176–183. doi: 10.1121/1.4955300
Zhang, G., Forland, T. N., Johnsen, E., Pedersen, G., and Dong, H. (2020). Measurements of underwater noise radiated by commercial ships at a cabled ocean observatory. Mar. Pollut. Bull. 153:110948. doi: 10.1016/j.marpolbul.2020.110948
Keywords: passive acoustic monitoring, anthropogenic noise, soundscape, automatic information systems, biologically important areas
Citation: Haver SM, Adams JD, Hatch LT, Van Parijs SM, Dziak RP, Haxel J, Heppell SA, McKenna MF, Mellinger DK and Gedamke J (2021) Large Vessel Activity and Low-Frequency Underwater Sound Benchmarks in United States Waters. Front. Mar. Sci. 8:669528. doi: 10.3389/fmars.2021.669528
Received: 19 February 2021; Accepted: 20 October 2021;
Published: 17 November 2021.
Edited by:
Sabrina Speich, École Normale Supérieure, FranceReviewed by:
Christoph Waldmann, University of Bremen, GermanyDimitri William Ponirakis, Cornell University, United States
Copyright © 2021 Haver, Adams, Hatch, Van Parijs, Dziak, Haxel, Heppell, McKenna, Mellinger and Gedamke. This is an open-access article distributed under the terms of the Creative Commons Attribution License (CC BY). The use, distribution or reproduction in other forums is permitted, provided the original author(s) and the copyright owner(s) are credited and that the original publication in this journal is cited, in accordance with accepted academic practice. No use, distribution or reproduction is permitted which does not comply with these terms.
*Correspondence: Samara M. Haver, samara.haver@oregonstate.edu; samara.haver@noaa.gov