Temperature Fluctuation Attenuates the Effects of Warming in Estuarine Microbial Plankton Communities
 Marco J. Cabrerizo1,2*
  Emilio Marañón1,2
  Cristina Fernández-González1,2
  Adrián Alonso-Núñez2
  Henrik Larsson3
  María Aranguren-Gassis1,2
- 1Centro de Investigación Mariña da Universidade de Vigo (CIM-UVigo), Vigo, Spain
- 2Department of Ecology and Animal Biology, Faculty of Marine Sciences, University of Vigo, Vigo, Spain
- 3Umeå Marine Sciences Center, Umeå University, Hörnefors, Sweden
Sea surface warming has the potential to alter the diversity, trophic organization and productivity of marine communities. However, it is unknown if temperature fluctuations that ecosystems naturally experience can alter the predicted impacts of warming. We address this uncertainty by exposing a natural marine plankton community to warming conditions (+3°C) under a constant vs. fluctuating (±3°C) temperature regime using an experimental mesocosm approach. We evaluated changes in stoichiometry, biomass, nutrient uptake, taxonomic composition, species richness and diversity, photosynthetic performance, and community metabolic balance. Overall, warming had a stronger impact than fluctuating temperature on all biological organization levels considered. As the ecological succession progressed toward post-bloom, the effects of warming on phytoplankton biomass, species richness, and net community productivity intensified, likely due to a stimulated microzooplankton grazing, and the community metabolic balance shifted toward a CO2 source. However, fluctuating temperatures reduced the negative effects of warming on photosynthetic performance and net community productivity by 40%. Our results demonstrate that temperature fluctuations may temper the negative effect of warming on marine net productivity. These findings highlight the need to consider short-term thermal fluctuations in experimental and modeling approaches because the use of constant warming conditions could lead to an overestimation of the real magnitude of climate change impacts on marine ecosystems.
Introduction
Global warming constitutes one of the most pervasive environmental changes that the biosphere is undergoing (Steffen et al., 2015). Sea surface temperature has increased 0.05–0.07°C per decade, and models forecast a global sea surface temperature rise between 1 and 3.7°C by 2100 (IPCC, 2013). Although the effects of warming have been extensively studied on organisms and ecosystems for at least half a century, such impacts have been mostly assessed under constant-temperature conditions (Doney, 2006). However, early theoretical work and recent observations highlight the importance of fluctuating conditions on ecosystem functioning. Already in 1906, Jensen suggested that the response of a given system to mean conditions may be different from the system’s mean response to fluctuating conditions (Jensen, 1906). More recently, other works have shown that temperature variation poses a greater risk for species than warming itself, highlighting the importance of temperature fluctuations rather than mean trends to understand the vulnerability of marine ecosystems to future changes (Vasseur et al., 2014; Bates et al., 2018). This is ecologically relevant because, while many species are naturally adapted to fluctuating environments (Kroeker et al., 2020), the increase in the frequency and intensity of extreme climatic events (i.e., marine heatwaves, MHW; Smale et al., 2019) may compromise their ability to cope with the new conditions.
This could be the case for phytoplankton, which are considered as sentinel organisms to study the effects of global change on marine ecosystems. Phytoplankton play a vital role in regulating the nutrients and organic matter cycling, trophic interactions, and gas exchange in the atmosphere-water interphase (Chavez et al., 2011), hence any impact on them may be propagated to other trophic levels. We also know that phytoplankton respond to both warming and temperature fluctuation as individual drivers. For example, recent results found that fluctuating temperatures can modify phytoplankton growth (Kremer et al., 2018; Gerhard et al., 2019), increase the oxidative stress (Nepper-Davidsen et al., 2019) or the turnover rates in communities (Righetti et al., 2019), and favor the dominance of diatoms over other phytoplankton groups (Kling et al., 2020). Furthermore, previous experimental studies have reported that warming can promote changes toward smaller cells when nutrient stress intensifies (Peter and Sommer, 2013), increase carbon:nitrogen (C:N) ratios (Biermann et al., 2015), primary productivity and biodiversity (Yvon-Durocher et al., 2015), and reduce the efficiency of energy transfer from primary producers to herbivores and detritivores (Ullah et al., 2018). Also, warming can strengthen the predator-consumer interaction (Schaum et al., 2018b; Garzke et al., 2019), and ultimately weaken the C-sink capacity, as shown in experimental microbial plankton communities (Yvon-Durocher et al., 2017). Surprisingly, it is still poorly understood how the interaction between warming and temperature fluctuation affects the composition, dynamics and metabolism of microbial food webs. The scarce available evidence shows contrasting outcomes. For instance, Wang et al. (2019) reported that both drivers acting simultaneously reduced the rates of growth and carbon fixation in marine phytoplankton populations. Rasconi et al. (2017) also showed a decrease of diversity and evenness in natural freshwater phytoplankton communities when exposed to a fluctuating temperature × warming regime. By contrast, under fluctuating warming temperatures, Kling et al. (2020) showed fourfold phytoplankton growth stimulation, and Schaum et al. (2018a) found evidence of acceleration of phytoplankton adaptation.
Considering that global warming is expected to modify both the annual mean temperature and its variability (IPCC, 2019), we need more empirical evidence quantifying the impacts of its combination on microbial plankton communities to achieve a more comprehensive understanding of the consequences for marine ecosystems.
In the present work, we address two key questions to better understand the effects of warming and fluctuating temperature on food webs and ecosystems: (a) how do the species richness, size distribution and structure of marine phytoplankton communities respond to these interacting drivers?; and (b) what is the effect of a future scenario of warming on the metabolic balance of the microbial plankton community when temperature fluctuations (which mimic natural environmental dynamics) are also considered? Our approach consisted in manipulating both mean temperatures and their variation (± 3°C from the mean temperature) over diel cycles in an indoor-mesocosm experiment. We used a natural marine phytoplankton community from a coastal site in the Gulf of Bothnia (Baltic Sea), and examined the interactive effects of both drivers (warming and temperature fluctuation) over different biological organization levels including phytoplankton stoichiometry, community structure and productivity and the metabolic balance of the microbial plankton community.
Materials and Methods
Study Design: Site and Experimental Setup
We collected 24,000 L of surface seawater early in the morning on 30 July 2019 from a coastal station (63°33.905′N, 19°50.898′E) off the Umeå Marine Sciences Center (Umeå University), located in the Gulf of Bothnia, off the Swedish east coast. The initial conditions in the study area were oligo/mesotrophic, according to nutrient and chlorophyll a (Chl a) concentration (Supplementary Table 1). We used an automatic pumping system to collect the sea water, and pre-filtered it through 180 μm mesh to eliminate the mesozooplankton before filling the mesocosms. The indoor mesocosms at Umeå Marine Sciences Center consist of 12 double-mantled high-density polyethylene (HDPE) cylinders (5 × 0.74–m diameter) with spatially controlled temperature via a sectioned outer layer of glycol, and equipped with Valoya LED lamps (R-258, LightDNA) as light sources (Supplementary Figure 1; see below).
To assess the combined impact of warming and fluctuating temperature on plankton communities, a 2 × 2 (in triplicate) full-factorial design was implemented with (a) two temperature treatments: Control (i.e., in situ temperature at the sampling moment [15°C], and median values registered in the study area during summer [15.17 ± 0.51, 2000–2019 period]; Swedish Meteorological and Hydrobiological Institute]) and Warming (in situ temperature + 3°C), and (b) two temperature regimes: Constant, in which the mean temperature was maintained constant over the experiment (i.e., 15 or 18°C), and Fluctuating, in which mean temperature varied ± 3°C over the mean temperature considered, i.e., between 12 and 18°C for the control conditions, and between 15 and 21°C for the warming scenario (see Supplementary Figure 2). We chose Controlconstant as our control treatment because most of previous studies have precisely focused on large-scale averages across space and time (Bates et al., 2018), comparing control vs. manipulated conditions using a constant temperature regime, and ignoring the effect of natural fluctuations respect mean conditions.
All experimental treatments were randomly assigned to the mesocosms, and were exposed to the corresponding single or interactive effect of both drivers for 29 days. The light lamps mimicked the light:dark cycle (16 h L:8 h D), and the daily cumulative photosynthetically active radiation light flux in the photic zone during summer in the Bothnian Sea (Andersson et al., 1994 and Supplementary Figure 2). To ensure that the water column was well oxygenated, air was continuously bubbled into the mesocosms (20 mL s–1). The temperature of the water column was continuously controlled by an automated heating/cooling system (± 0.5°C) in the three sections of the mesocosms to induce a complete and constant mixing of the water column over the experimental period (full mixing of each mesocosm in ca. 2–4 h). This complete mixing prevented particle settling and accumulation in the bottom of the mesocosms. Vertical profiles of Chl a and turbidity measured using a Seaguard® -CTD (Aanderaa Instr. AS, Bergen Norway) at different stages over the experiment showed a homogeneous distribution of biomass and similar turbidity with depth inside each experimental treatment (Supplementary Figure 3). The two fluctuating temperature treatments, which had the same mean as the constant treatments, alternated between a warm phase above (+ 3°C) and a cold phase below (−3°C) the mean value sequentially every 48 h, yielding a 96 h complete thermal cycle (Supplementary Figure 2). These temperature changes, which mimic natural thermal fluctuations that usually occur in the study area (Supplementary Figure 4), were programmed to take place at a fixed time (i.e., 7 a.m. local hour) in both fluctuating treatments hence temperature would remain stable over a few hours once the target conditions were reached, before entering the next step of the temperature cycle.
The time scale used in the fluctuating temperature treatments was based on the fact that surface nearshore waters experience, particularly during summer, strong fluctuations in temperature over a diel basis (Kaplan et al., 2003), while the magnitude of the temperature increase imposed to the communities was based in the mean MHW severity registered over the 1993–2018 period in the study area (Supplementary Figure 5). To avoid any potential effect of the nutrient status on the susceptibility of the phytoplankton community to the drivers tested, we maintained constant the inorganic nutrient concentrations (i.e., phosphate, ammonium, nitrate, nitrite). To do so, over the experimental period, we added after sampling (i.e., two times per week) NH4+ (as NH4Cl), NO32– (as NaNO3), or PO43– (as NaH2PO4) to the mesocosms as required to maintain concentrations similar to those measured at the moment of mesocosms filling (hereafter, seawater; Supplementary Figure 5). Water exchange (∼20 L, inclusive of sampling water collection) was carried out after every sampling day and replacement consisted of natural Bothnian seawater filtered through patron depth filters of 20, 5, 3, 1, and 0.2 μm connected in series to minimize breakage of organisms by pressure gradients during filtration. Such replacements with 0.2 μm filtered seawater did not alter the dissolved organic carbon (DOC) concentration in any treatment over the experimental period (Supplementary Figure 6).
Mesocosms were sampled twice per week for inorganic nutrients and dissolved organic carbon, particulate organic carbon and nitrogen, photosytem II photochemistry, phytoplankton species counts and oxygen rates variables, and five times per week for Chl a (see below). All water samples were taken from a depth of 0.5 m because biomass distribution was homogeneous with depth (Supplementary Figure 3), and stored in acid-washed buckets (for less than 1 h) before being processed for each response variable.
Dissolved Inorganic Nutrients
Fifty-mL samples from each mesocosm were taken, and concentrations of nutrients [NH4+, NO2–, NO32–, PO43–, and Si(OH)4] were immediately determined after sampling using standard analytical methods (Grasshoff et al., 2009) with a Quaatro systems (Seal Analystics, United States). From nutrient (Supplementary Figure 7) and Chl a concentrations (see “Results” section), we calculated the cumulative Chl a specific P and N-uptake by the microbial community, as a measure of net community production using a budget approach independent of bottle incubations. Both cumulative nutrient uptakes were obtained through the sum of the uptakes computed for each individual time period, and calculated as follow:
where Xt and Chl at is the nutrient concentration and Chl a, respectively, measured at time t (days), and Xt+1 and Chl at+1 is the nutrient concentration and Chl a measured the following sampling day. We normalized nutrient uptakes by the change in Chl a concentration registered during this period in order to have comparable cumulative uptake among treatments.
Dissolved Organic Carbon (DOC)
Fifty-mL samples were taken, placed in acid-washed Corning vessels (Corning Inc., United States), fixed with HCl 1.2 M, and stored at 4°C in darkness until analyzed. Concentrations of DOC were determined using a Shimadzu TOC-L high temperature catalytic oxidation instrument with NDIR detection.
Particulate Organic (POC) Carbon and Nitrogen (PON)
One hundred fifty mL samples from each mesocosm were filtered through pre-combusted (500°C for 5 h) GF/F (Whatman Inc., United Kingdom) filters, and stored at −20°C in darkness until analyzed. Before the analysis, filters were thawed and desiccated at 60°C for 24 h. Samples were analyzed with a Vario Macro Cube elemental analyzer (Elementar Analyses system GmbH, Germany). GF/F blanks were treated as samples to determine background C and N contents.
Chl a
Samples (100–200 mL) from each mesocosm were sequentially filtered through 5 μm pore size polycarbonate (Merck Millipore CO, United States) and GF/F (Whatman Inc., United Kingdom) filters, and extracted with 96% ethanol for 24 h at 4°C in darkness after 10 min of sonication (VWR, Ultrasonic Cleaner USC300T, United States). After that, samples were centrifuged at 3,500 rpm for 10 min (Hreaeus® Instruments Labofuge® 400, Thermo Fisher Scientific, United States) and Chl a concentration was fluorimetrically determined using a fluorometer (Perkin Elmer, LS 30, United States) calibrated with pure Chl a pigment from DHI (Water and Environment, Hoersholm, DK). From fractionated Chl a concentrations (i.e., > and < 5 μm), we calculated the dominant biomass-size index in the community over the experimental period as the ratio between both fractions. This index, which oscillates between values >, < or = 1, indicates whether plankton community was dominated by micro/nanophytoplankton (i.e., values > 1), nano/picophytoplankton (i.e., values < 1) species or both groups had the same contribution (i.e., values = 1) to the total biomass of the community.
Hourly sea-surface temperature and Chl a concentrations were measured using a water quality monitor (WQM) Sea-Bird probe anchored to an oceanographic buoy (Techworks Marine®, Ireland) in the study area. Data are shown in the supplementary information (Supplementary Figure 4) to contextualize the results of the present work.
Plankton Identification and Enumeration
One hundred-mL samples were taken from each mesocosm for analysis of nano- and microplankton, and fixed with 2% acidic Lugol’s solution. 25 mL sub-samples were settled for 24 h in sedimentation chambers (Utermöhl, 1958). Then, the cells were counted and identified to a genus (and species level when possible) level using an inverted microscope (Nikon Eclipse TE3000, United States). Microplankton (>20 μm) and nano-plankton (2–20 μm) samples were counted at 100× and 400× magnification, respectively. For ciliates, 200× magnification was used. Different taxa were identified from the cell morphology and size, and cell biovolume was calculated according to Olenina et al. (2006). Biovolumes were converted into carbon biomass using the relationships proposed by Verity et al. (1992). Because Chl a and carbon biomass exhibited a linear relationship (Supplementary Figure 8A and Supplementary Table 2) and biomass (Supplementary Figure 8B) had a similar temporal response pattern to Chl a in all treatments, we assumed that Chl a was a realistic proxy of community biomass. Carbon biomass proportions of species were used to estimate Pielou’s evenness (Pielou, 1966), whereas species richness was used as diversity estimate.
Photosystem II (PSII) Photochemistry
To determine the quantum yield of PSII, 3 mL samples were taken from each mesocosm over different days using an acid-washed silicone tube inserted in a syringe. Samples were taken every 1.5–2 h during the light phase, and every 4 h during the dark phase (96 samples in total per day) to measure the in vivo PSII photochemical parameters over diel light-darkness cycles using a pulse amplitude modulated (PAM) fluorometer (Walz, Water PAM, Effeltrich, Germany). Each sample was measured six times immediately after sampling (without any dark-adaptation) with each measurement lasting 10 s; thus the total time for measuring each sample was 1 min. The effective photochemical quantum yield of PSII (ΦPSII) was calculated using the equations of Genty et al. (1989) as:
where F′m is the maximum fluorescence induced by a saturating light pulse (ca. 5300 μmol photons m–2 s–1in 0.8 s) and Ft the current steady-state fluorescence induced by a red actinic light pulse (250 μmol photons m–2 s–1– peak at 660 nm) in light-adapted cells. From the ΦPSII measurements, we calculated the rate of electrons transported through the PSII (rETR, in μmol photons m–2 s–1) i.e., an estimation of the photosynthetic rate, as:
where ΦPSII is the effective photochemical quantum yield, EPAR is the instantaneous PAR energy received by phytoplankton in the measurement time, and 0.5 is a correction factor as half of the absorbed light energy is diverted to the PSII (Suggett et al., 2003). Daily rETRs were calculated for each experimental condition and day integrating the area under the rETR vs. time curve.
Net Community Production (NCP) and Respiration (CR) Rates
Before the start of the light period, samples were taken from each mesocosm, transferred to 150 mL Winkler bottles (Lenz Laborglas, Germany) equipped with sensor-spots (SP-PSt3-NAU-D5-YOP), ensuring that no bubbles formed, and exposed over the diel light:dark cycle (total of 24 bottles: 12 for light-dark and 12 for dark incubations) inside the corresponding mesocosm at the same depth where samples has been collected. Dark bottles were additionally placed inside customized opaque bags to avoid any potential interference of radiation during the light exposure period. Oxygen concentration was measured using an optode-probe system (Fibox 3, Presens GmbH, Germany) equipped with an optic fiber and the Oxyview 6.02 software to register the data. Each sample was measured during 1 min, collecting one datum per second. The system was calibrated before the measurements using a two-point calibration for 100% and 0% oxygen saturation, at the desired temperature and at atmospheric pressure. Oxygen concentration measurements were done at the beginning of the diel cycle (t0) and after 24 h of incubation at the sampling depth. NCP and CR rates were calculated from changes in dissolved oxygen concentrations after incubation of samples under light and dark conditions, respectively. From the daily NCP and CR rates we calculated the mean rates over the entire experimental period. These rates were normalized by the mean Chl a concentration, used here as a general proxy for microbial plankton biomass, to have comparable estimates between treatments. Gross primary production was calculated as the sum of NCP and CR. We estimated the metabolic balance of the microbial community as the GPP to CR ratio. The GPP:rETR ratio was used as a proxy for the fraction of energy absorbed via photochemical pathway that is converted into community production.
Marine Heatwaves (MHW)
To understand to what extent global warming and climatic variability are important drivers currently affecting the occurrence of MHW in local/regional areas, we examined the frequency, duration, mean, maxima, and cumulative intensity (in °C) of MHW for the Northern Baltic Sea during the last three decades (i.e., 1993–2018). We used data extracted from the Hadley Center Sea Ice and Sea Surface Temperature v1.1 (Rayner et al., 2003). A MHW event was defined as the seawater temperature that exceeded the 90th percentile of the seasonally varying threshold for at least five consecutive days (Hobday et al., 2016). Based on this premise, the frequency of MHW is the total number of MHW events per year, and the cumulative intensity of MHW is the cumulative number of °C per year that exceeded the seasonally varying threshold. The duration is the number of days per year with MHW, and the severity is the difference between the mean and the maximum intensity registered in temperature of all MHW that took place each year.
Data Treatment and Statistics
We fitted linear regression models for frequency, duration, cumulative intensity, and severity of the MHW vs. time for the 1993–2018 period to evaluate long-term trends in the study area. Also, linear regression models were fit to assess the relationship between Chl a and carbon biomass in each experimental treatment. Non-linear regression models were used to assess for the dominant biomass-size index in the community over the experimental period under each experimental treatment.
We calculated the effect size of warming, fluctuating temperature, and their interaction on GPP:CR and GPP: rETR ratios as:
where Treatmentsingle represents: (1) samples under the Warmingconstant treatment for warming effects, and (2) samples under the Controlfluctuating treatment for fluctuation temperature effects; and
where Warmingfluctuating represents samples exposed under the simultaneous effect of warming and temperature fluctuation, and Controlconstant samples under in situ constant temperatures. We used the GPP:CR ratio instead of the NCP for the effect size analyses for two reasons: (1) it avoids the use of negative NCP values on the calculations, and (2) it facilitates the comparison with GPP:rETR ratios.
Finally, the additive effect of both drivers was calculated as the sum of the single effect size of warming and fluctuating temperature. Based on this, an interactive effect was considered synergistic or antagonistic when their values were higher or lower, respectively, than the expected additive effect.
Two-way repeated measures (RM-ANOVA) analyses were used to test the interactions between temperature and fluctuating temperature on Chl a (total, > 5 and < 5 μm), C:N ratios, species richness, species evenness, contribution of different phytoplankton groups to the total biomass (i.e., relative composition,%), total biomass, cumulative Chl a-specific P and N-uptake, and rETR rates. The two-way ANOVA was used to test the interactions between warming and fluctuating temperature on mean Chl a-specific NCP, and CR rates, GPP:CR and GPP:rETR ratios, and inorganic nutrients (i.e., phosphate, ammonium, nitrite, nitrate, and silicate), as the factor “time” was implicitly considered by integrating together all the values measured for each response variable over the experimental period. The one-way ANOVA was used to test significant differences among warming, fluctuating temperature, their interaction and the additive effect on GPP:CR and GPP:rETR ratios. Temperature and temperature regime represented the factors between subjects, whereas time as well as interactions involving time were analyzed within subjects. Normality (by Kolmogorov Smirnov and Shapiro Wilk’s test) and homoscedasticity (by Levene’s test) were checked to verify the linear regression, ANOVA and RM-ANOVA assumptions. When interactive effects were significant, least significant differences (LSD) Fisher post hoc test was performed. Because multiple ANOVA (and comparisons) were performed, we applied a Benjamini and Hochberg (B-H) correction to our statistical results to control if it affected the type I error rate and consequently, the false discovery rate; however, we did not find changes in the significance compared with those originally obtained (i.e., B-H corrected p < 0.05 for all variables, ranging between 2.56 × 10⁻¹⁵ and 4.93 × 10⁻²). All data are reported as mean and standard deviation, whereas error propagation was used to calculate the error for the effect size of single, interactive and additive effects of the drivers tested (i.e., warming and fluctuating temperature) on GPP:CR, and GPP:rETR ratios. All statistical analyses were performed in Rstudio® v.1.1.463 (RStudio, Inc.).
Results
Thermal Ecological Context in the Northern Baltic Sea
The frequency, duration and intensity of MHWs have increased by 8-, 10-, and 40-fold, respectively, in the study area over the last 25 years (Supplementary Figures 5A–C and Supplementary Table 3). In fact, the current mean duration of MHW in the Northern of Baltic Sea is 50 days y–1 compared to less than 10 days y–1 in 1993. The severity of these events (Supplementary Figure 5D) has also increased, with mean temperature during MHWs in the last 10 years being ∼3°C higher (with events up to 6°C higher) than the mean observed in the period 1990–2007.
Warming × Temperature Fluctuation Effects on Stoichiometry, Biodiversity and Community Structure
The phytoplankton community exhibited a clear pattern of ecological succession over the experimental period, with pre-bloom, bloom and post-bloom periods (Supplementary Figure 1 and Supplementary Table 4). Although this pattern did not match with Chl a dynamics observed in natural conditions (Supplementary Figure 4) where mesozooplankton was not excluded, it allowed us to study the effect of temperature fluctuation on plankton community dynamics. During the pre-bloom period, we did not observe differences in total or fractionated Chl a regardless of the treatment considered (LSD post hoc test, p > 0.05). By contrast, during the other two periods, we found that, compared with the controlconstant treatment, Chl a decreased in the controlfluctuating, warmingconstant, and warmingfluctuating treatments. Both warming treatments caused a strong decrease of phytoplankton biomass, as shown by a 3–4-fold reduction in Chl a concentration. This negative effect was significantly stronger under warmingconstant than under controlfluctuating and/or warmingfluctuating treatments (Figure 1 and Supplementary Table 4; LSD post hoc test, p < 0.05), and similar in magnitude and response pattern to the effect on total phytoplankton carbon (Supplementary Figure 8B and Supplementary Table 4).
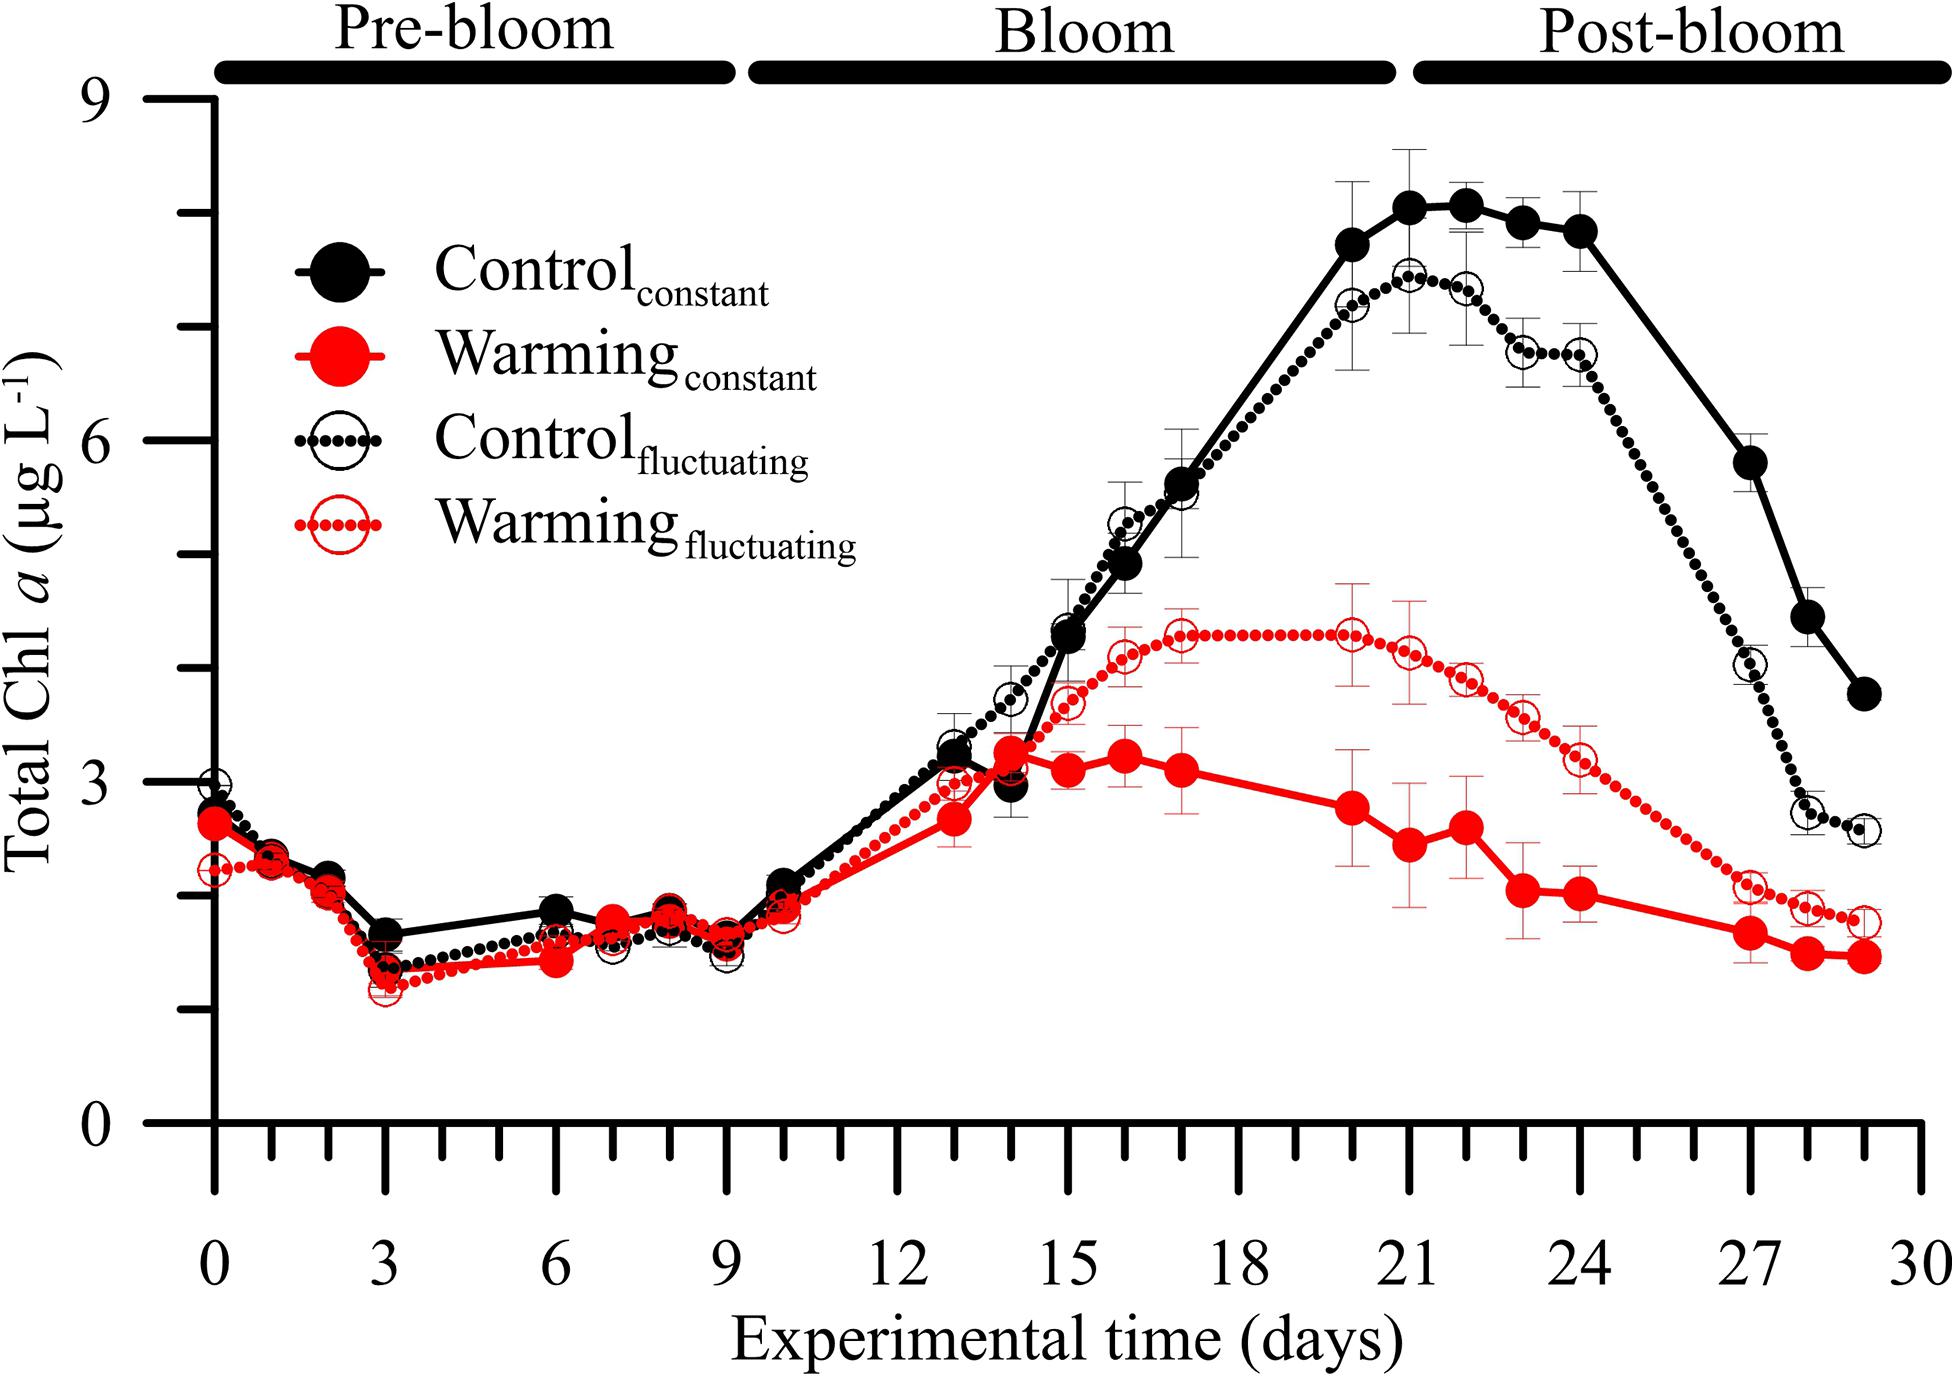
Figure 1. Mean (± SD) total chlorophyll a (Chl a, in μg L–1) concentrations in microbial plankton communities exposed to two temperature treatments [Control (15°C) and Warming (18°C)] and regimes [Constant and Fluctuating (± 3°C respect to Control and Warming)] over the experimental period.
The bloom phase, in terms of Chl a, peaked 5 days earlier under both warmingconstant or warmingfluctuating treatments compared to control ones. The dominant biomass-size index also varied over the experimental period (Figure 2A, Supplementary Figures 8C,D and Supplementary Table 5). For all treatments, the index was ∼1 (i.e., co-dominance of > and < 5 μm size classes) at the beginning of the experiment and increased during pre-bloom regardless of the condition considered. The highest mean index values (i.e., >1, dominance by 5 μm size class) were reached during bloom, particularly under the warmingconstant treatment. During the post-bloom, values decreased more strongly under warming conditions, reaching values of ∼0.5 (i.e., dominance by < 5 μm size class).
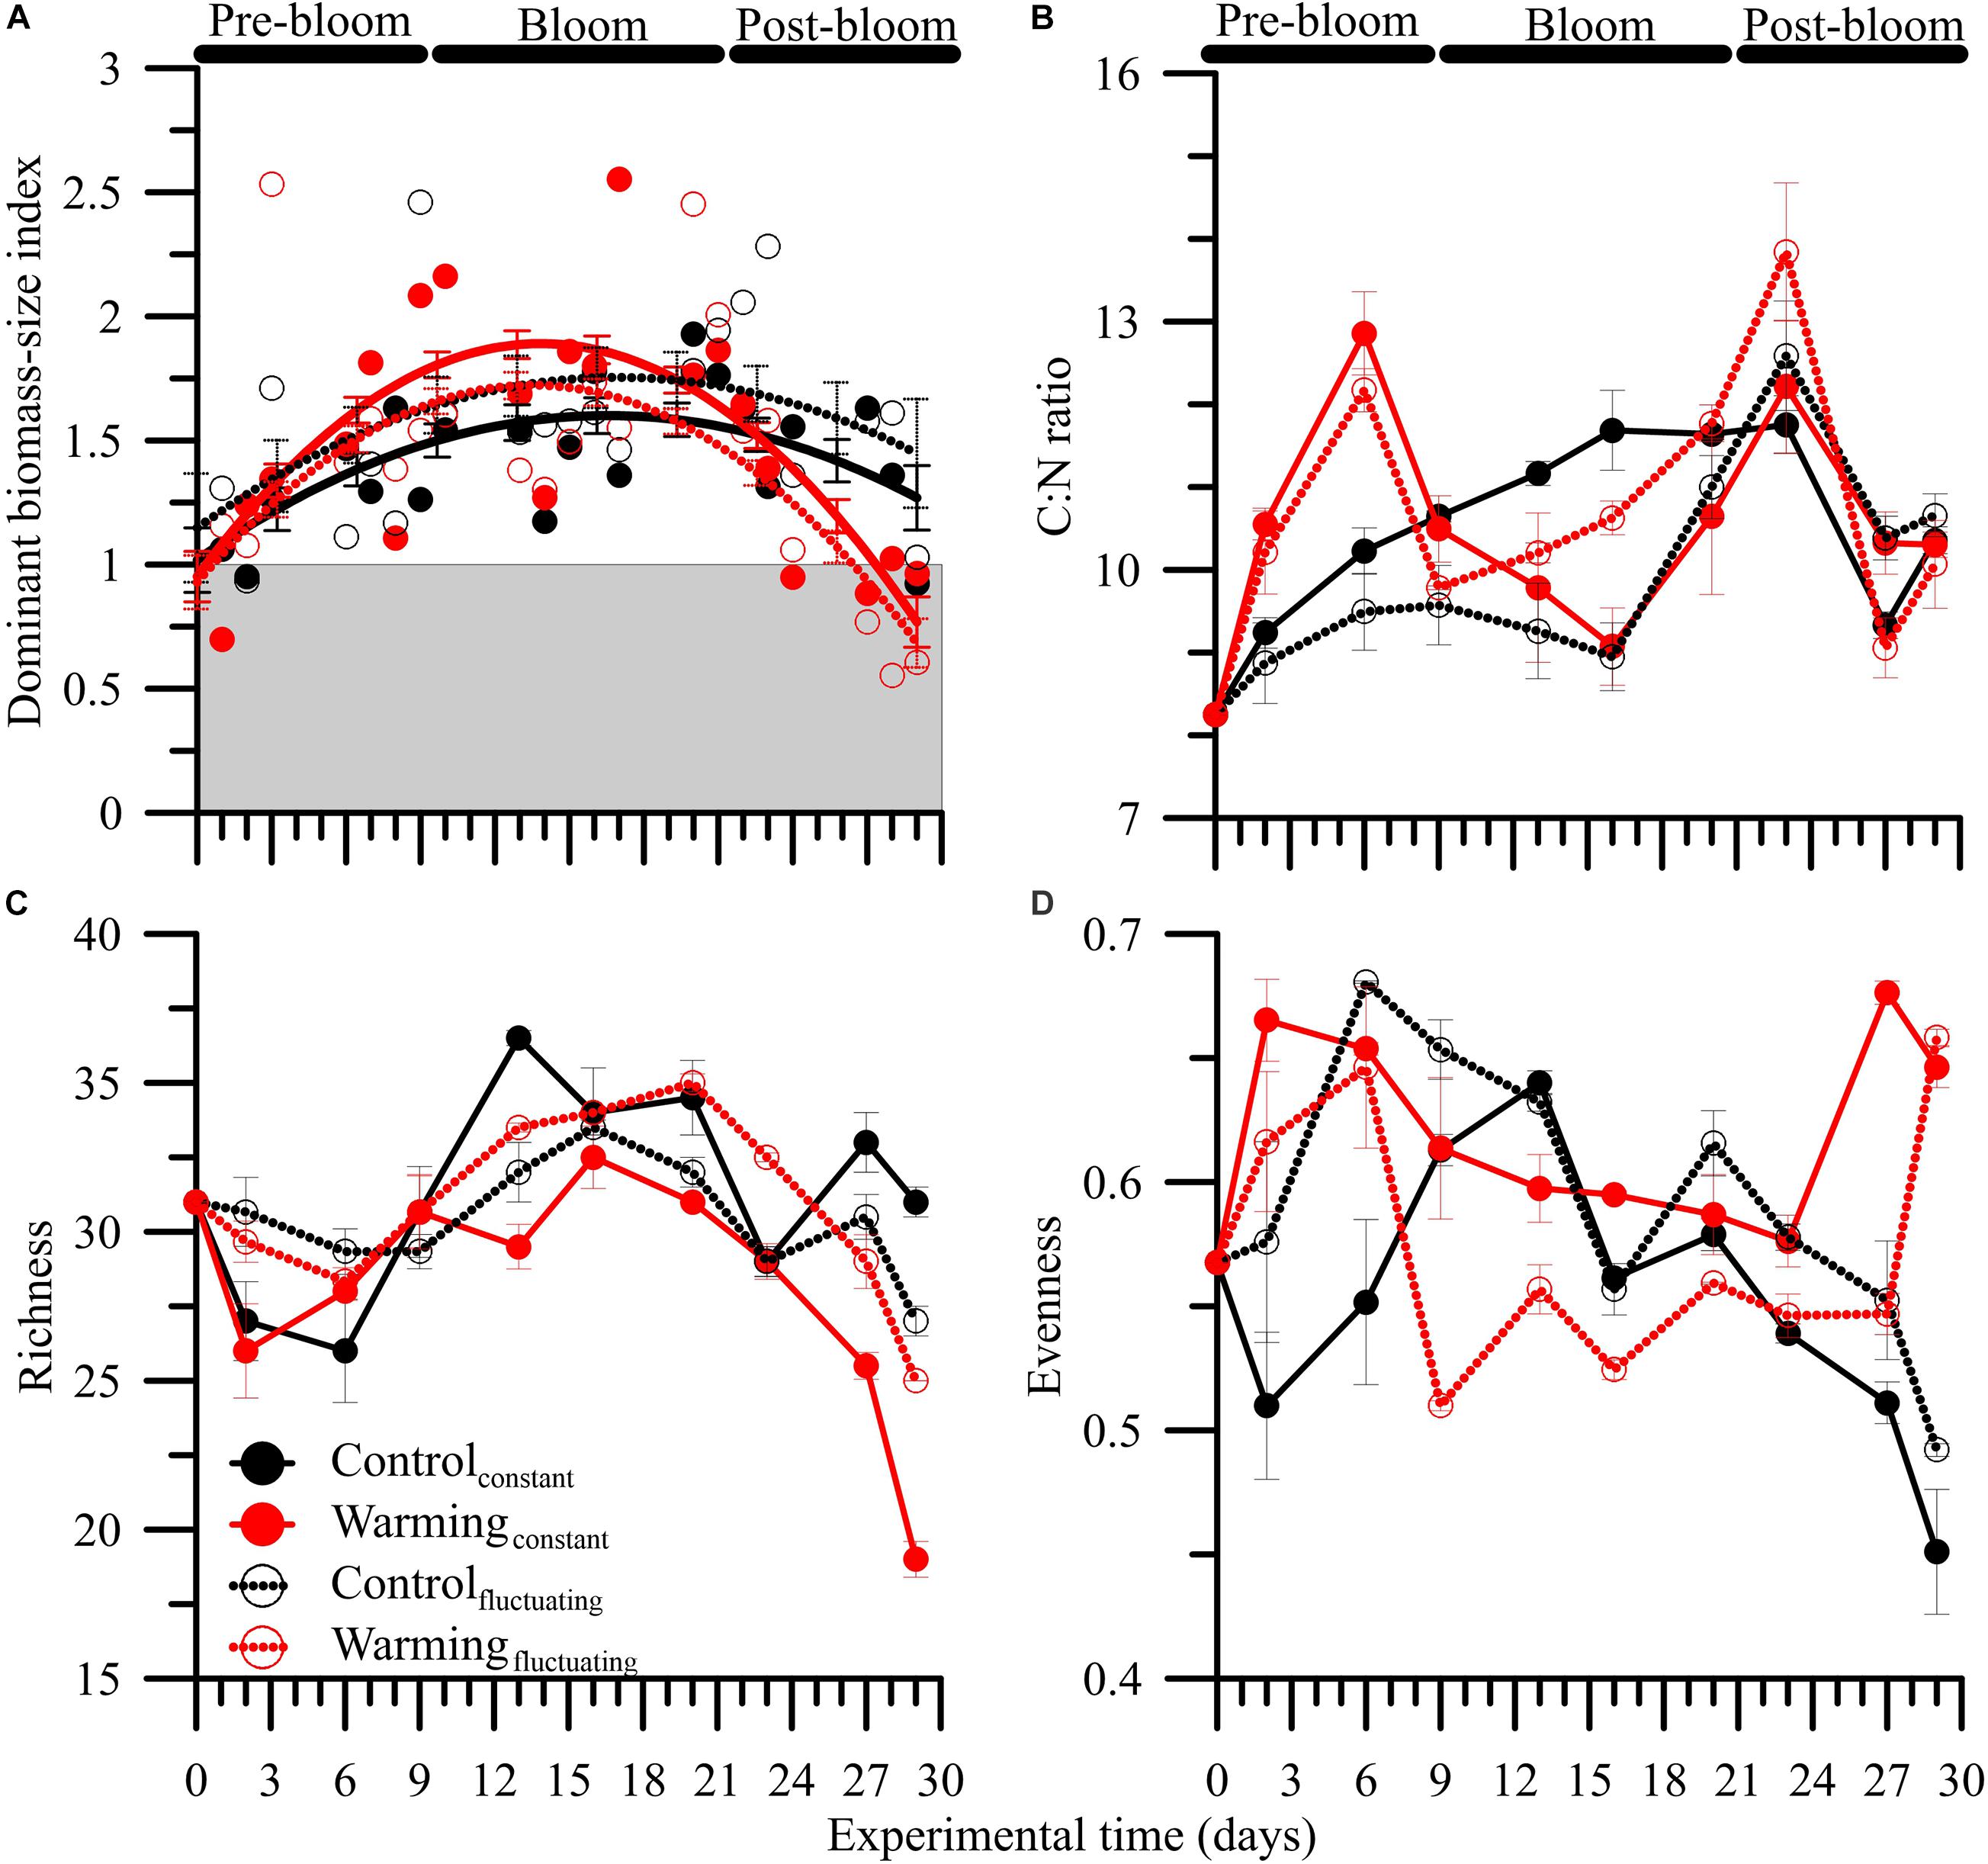
Figure 2. Mean (± SD) (A) dominant biomass-size index based on fractionated chlorophyll a (Chl a > 5 μ m : Chl a > 5 μ m :), (B) carbon:nitrogen (C:N) ratios, (C) species richness (total n° taxa), and (D) Pielou’s evenness in microbial plankton communities exposed to: two temperature treatments [Control (15°C) and Warming (18°C)] and regimes [Constant and Fluctuating (± 3°C respect to Present and Future)] over the experimental period. Solid lines in (A) represents non-linear regression fits, and vertical bars the 95% confidence intervals.
The C:N ratios did not exhibit a clear response pattern over the experimental period. Neither warming nor temperature fluctuation had a significant effect on such ratios (Figure 2B and Supplementary Table 4), although the highest (i.e., ∼12) and lowest (i.e., ∼9) values were found under pre- and post-bloom, and bloom, respectively.
Phytoplankton diversity metrics varied over the experimental period due to a warming × fluctuating temperature effect (Figures 2C,D and Supplementary Table 4). Regarding species richness, we found a unimodal response pattern over the phytoplankton succession with highest values during bloom, and lowest during the post-bloom. However, we also found that the decline in species richness started during mid-bloom under control treatments, whereas it occurred at the end of this period under warming treatments. Overall, species richness decreased ca. 20% on average through the experiment, with such decrease being significantly higher under warmingconstant than in the other three treatments (Figure 2C; LSD post hoc test, p < 0.001).
Pielou’s evenness index ranged between 0.57 and 0.45 and exhibited different trends between control and warming conditions. Under control treatments, Pielou’s evenness showed an inverted U-shaped response pattern with significantly higher values under fluctuating than constant conditions during the pre- and post-bloom periods (LSD post hoc test, p < 0.001). By contrast, under warming treatments, evenness showed a U-shaped response pattern with significantly higher values under constant than fluctuating conditions over the experimental period (except for the last day: LSD post hoc test, p > 0.05).
Regarding community composition, we found that filamentous cyanobacteria (i.e., Anabaena sp. Aphanizomenon cf flos-aquae, Pseudanabaena limnetica, and Spirullina sp. as main contributors) increased from 20 to 70–80% of the total biovolume of the community in all treatments over the experiment (Figure 3). By contrast, green algae (representing < 5% of the total community biomass at the beginning; i.e., Desmodesmus sp., Koliella longiseta and Monoraphidium sp. as main contributors) and dinoflagellates (representing ca. 50% of the total community biomass at the beginning; i.e., Dinophysis sp., Gymnodinium sp., Gyrodinium sp., Prorocentrum sp., and Protoperidinium sp.) virtually disappeared under the warmingconstant and warmingfluctuating treatments, respectively (Figure 3D). Other functional groups such as ciliates (i.e., Lohmanniella oviformis, and Strombilidium sp.), flagellates (i.e., Dinobryon faculiferum, Tetraselmis sp., Ochromonas sp., and Chrysochromulina sp.), and diatoms (Diatoma tenuis, Entomoneis sp., Lenoxia faveolata, and Skeletonema costatum) remained unchanged regardless of the treatment considered.
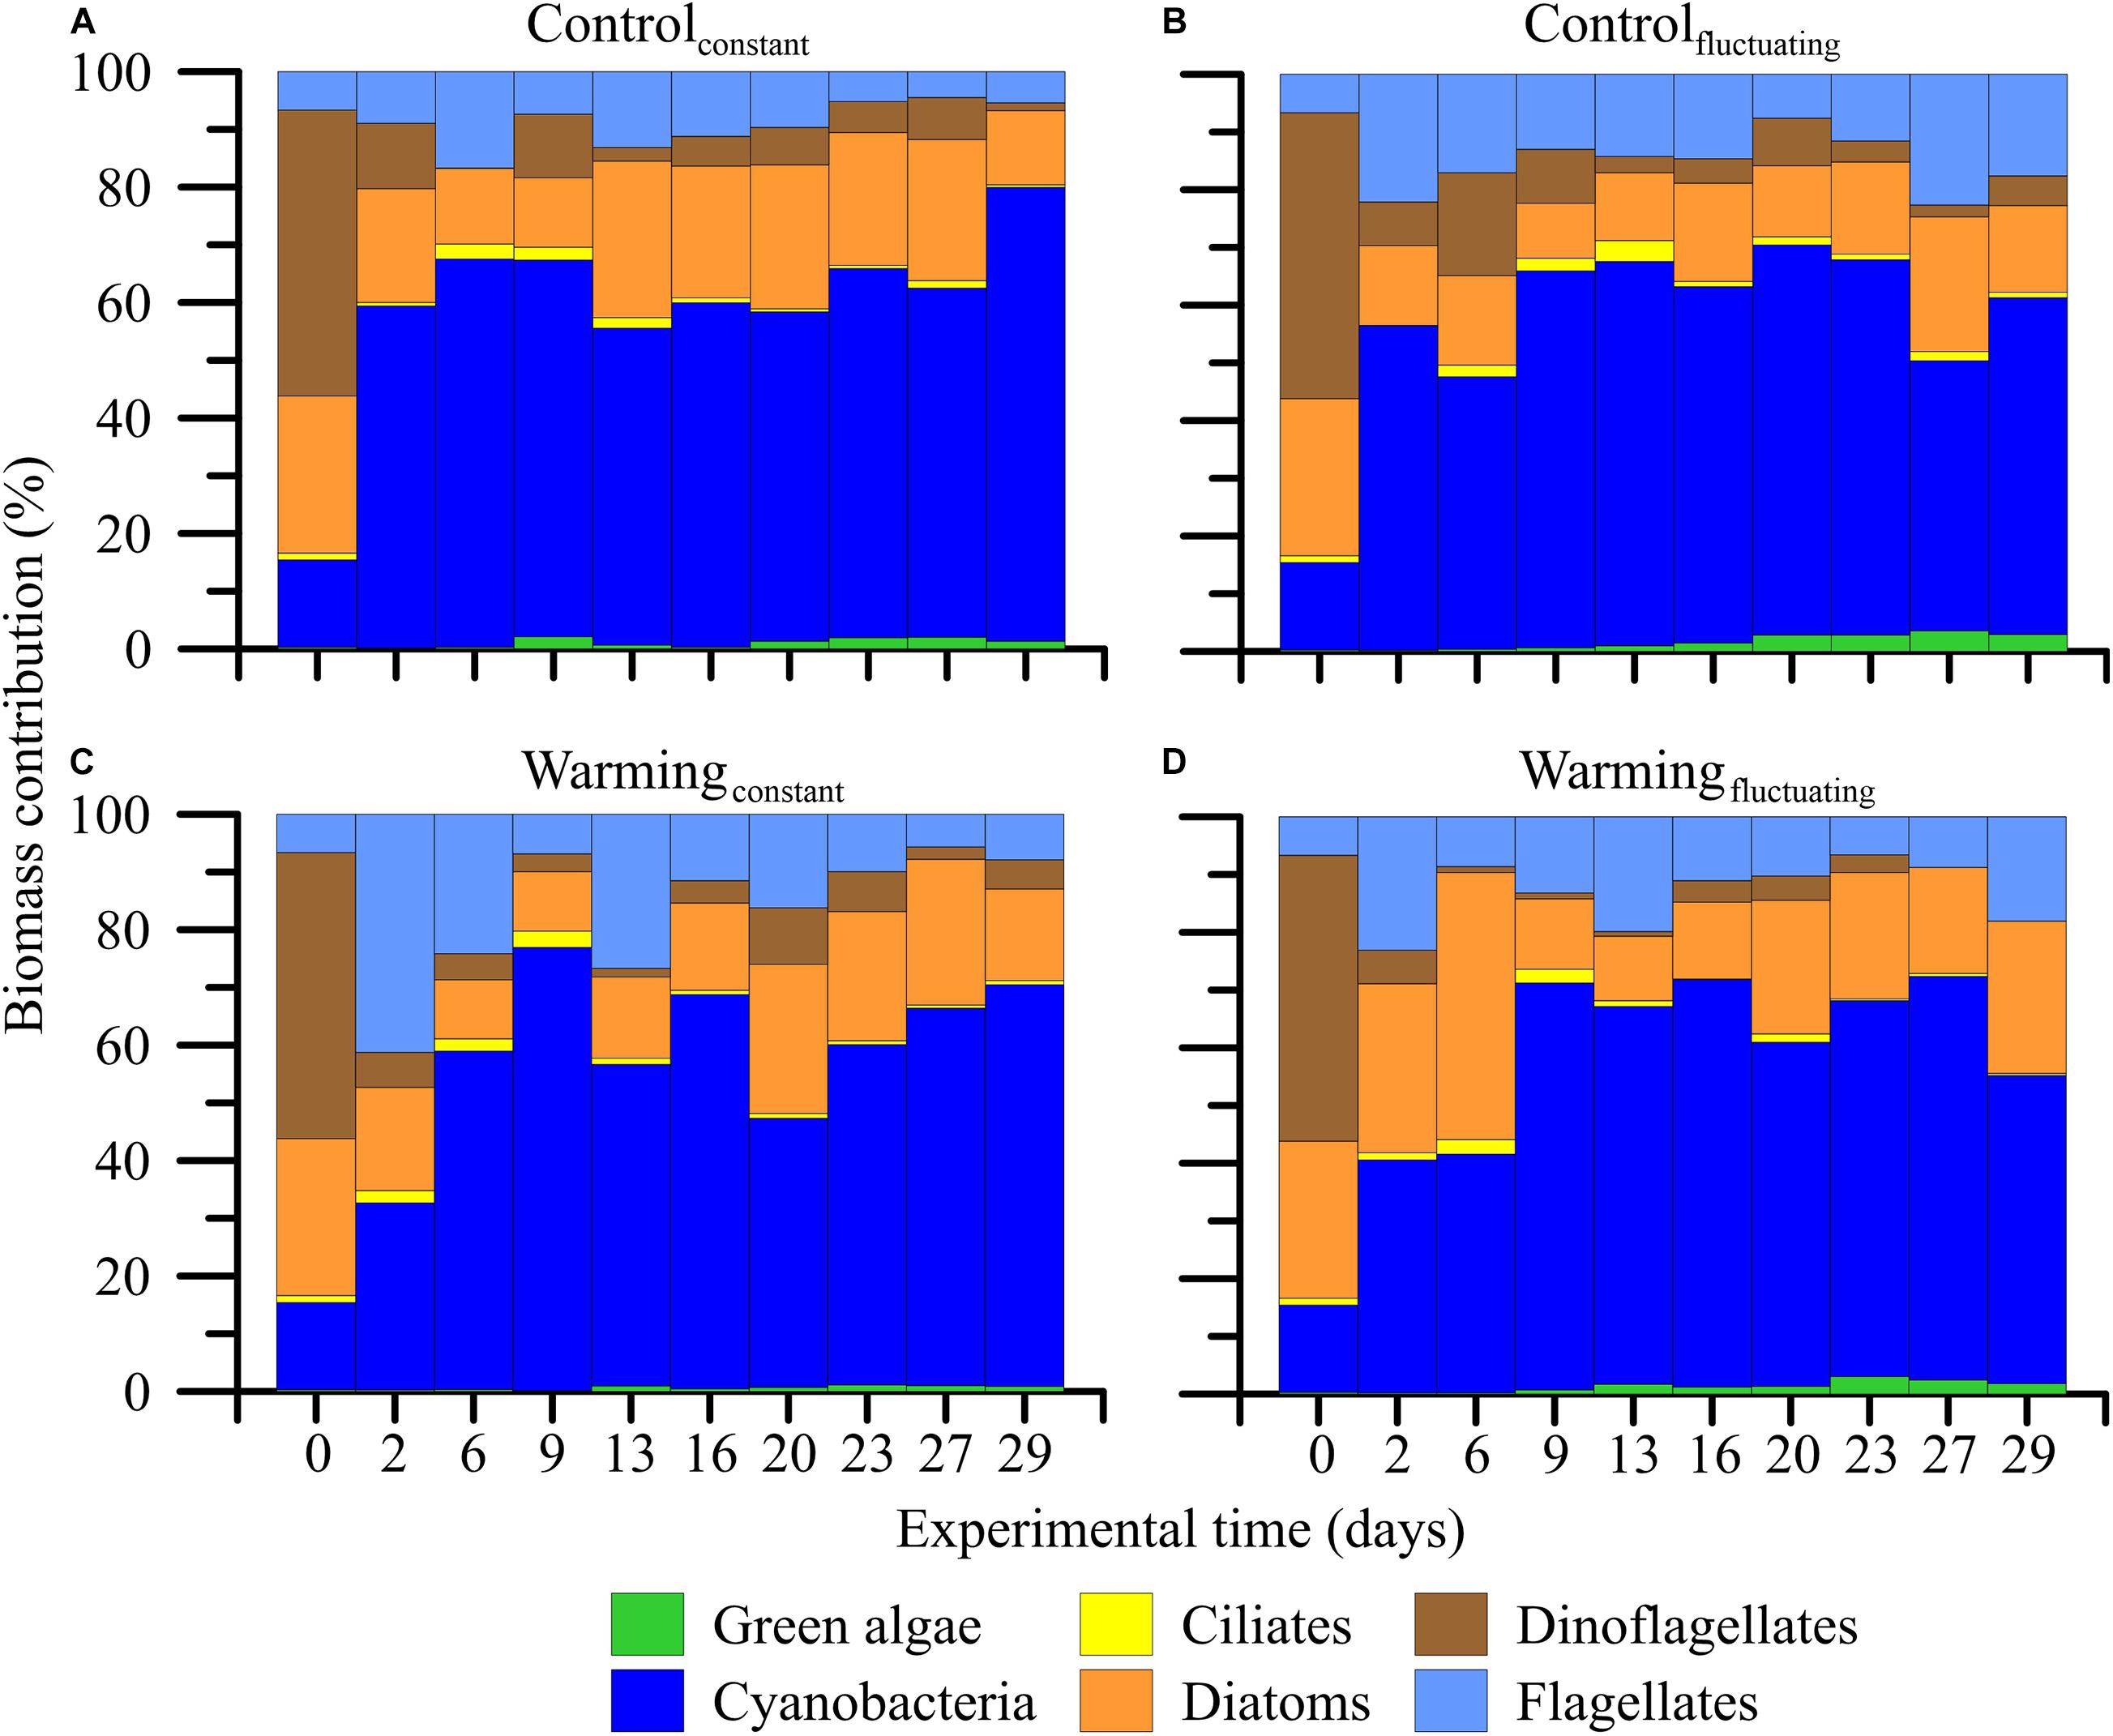
Figure 3. (A–D) Contribution of the microbial plankton groups to the total community biomass (%) when exposed to two temperature treatments [Control (15°C) and Warming (18°C)] and regimes [Constant and Fluctuating (±3°C respect to Present and Future)] over the experimental period.
Warming × Temperature Fluctuation Effects on Ecosystem Functioning
Community Chl a-specific metabolic rates (NCP and CR) describe the balance between photosynthesis and respiration. The metabolic balance of the microbial plankton community shifted from net autotrophic (NCP > 0) under controlconstant conditions to net heterotrophic (NCP < 0) in the other treatments (Figure 4A), even if CR rates decreased. These decreased NCP rates were coupled with increases in cumulative Chl a-specific N and P uptakes, which were significantly higher under warming than control treatments as the succession progressed (Supplementary Figures 8E,F and Supplementary Table 4). Fluctuating temperatures caused a decrease in P- and N-uptake under control treatments, when compared with controlconstant and regardless of the phytoplankton succession stage considered, whereas their effect was positive (e.g., pre-bloom), negative (i.e., post-bloom) or even null (i.e., bloom) when acting in concert with warming (Supplementary Figures 8E,F). Nevertheless, the magnitude of the effect exerted by warming or fluctuating temperature, relative to controlconstast, was lower for nutrient uptake than for total Chl a and carbon biomass. The decline in NCP mediated by warming, fluctuating temperatures and their interaction matched with decreasing rETR rates over the experimental period. Such rates were significantly lower under warming than under control treatments (Supplementary Figure 8G and Supplementary Table 4).
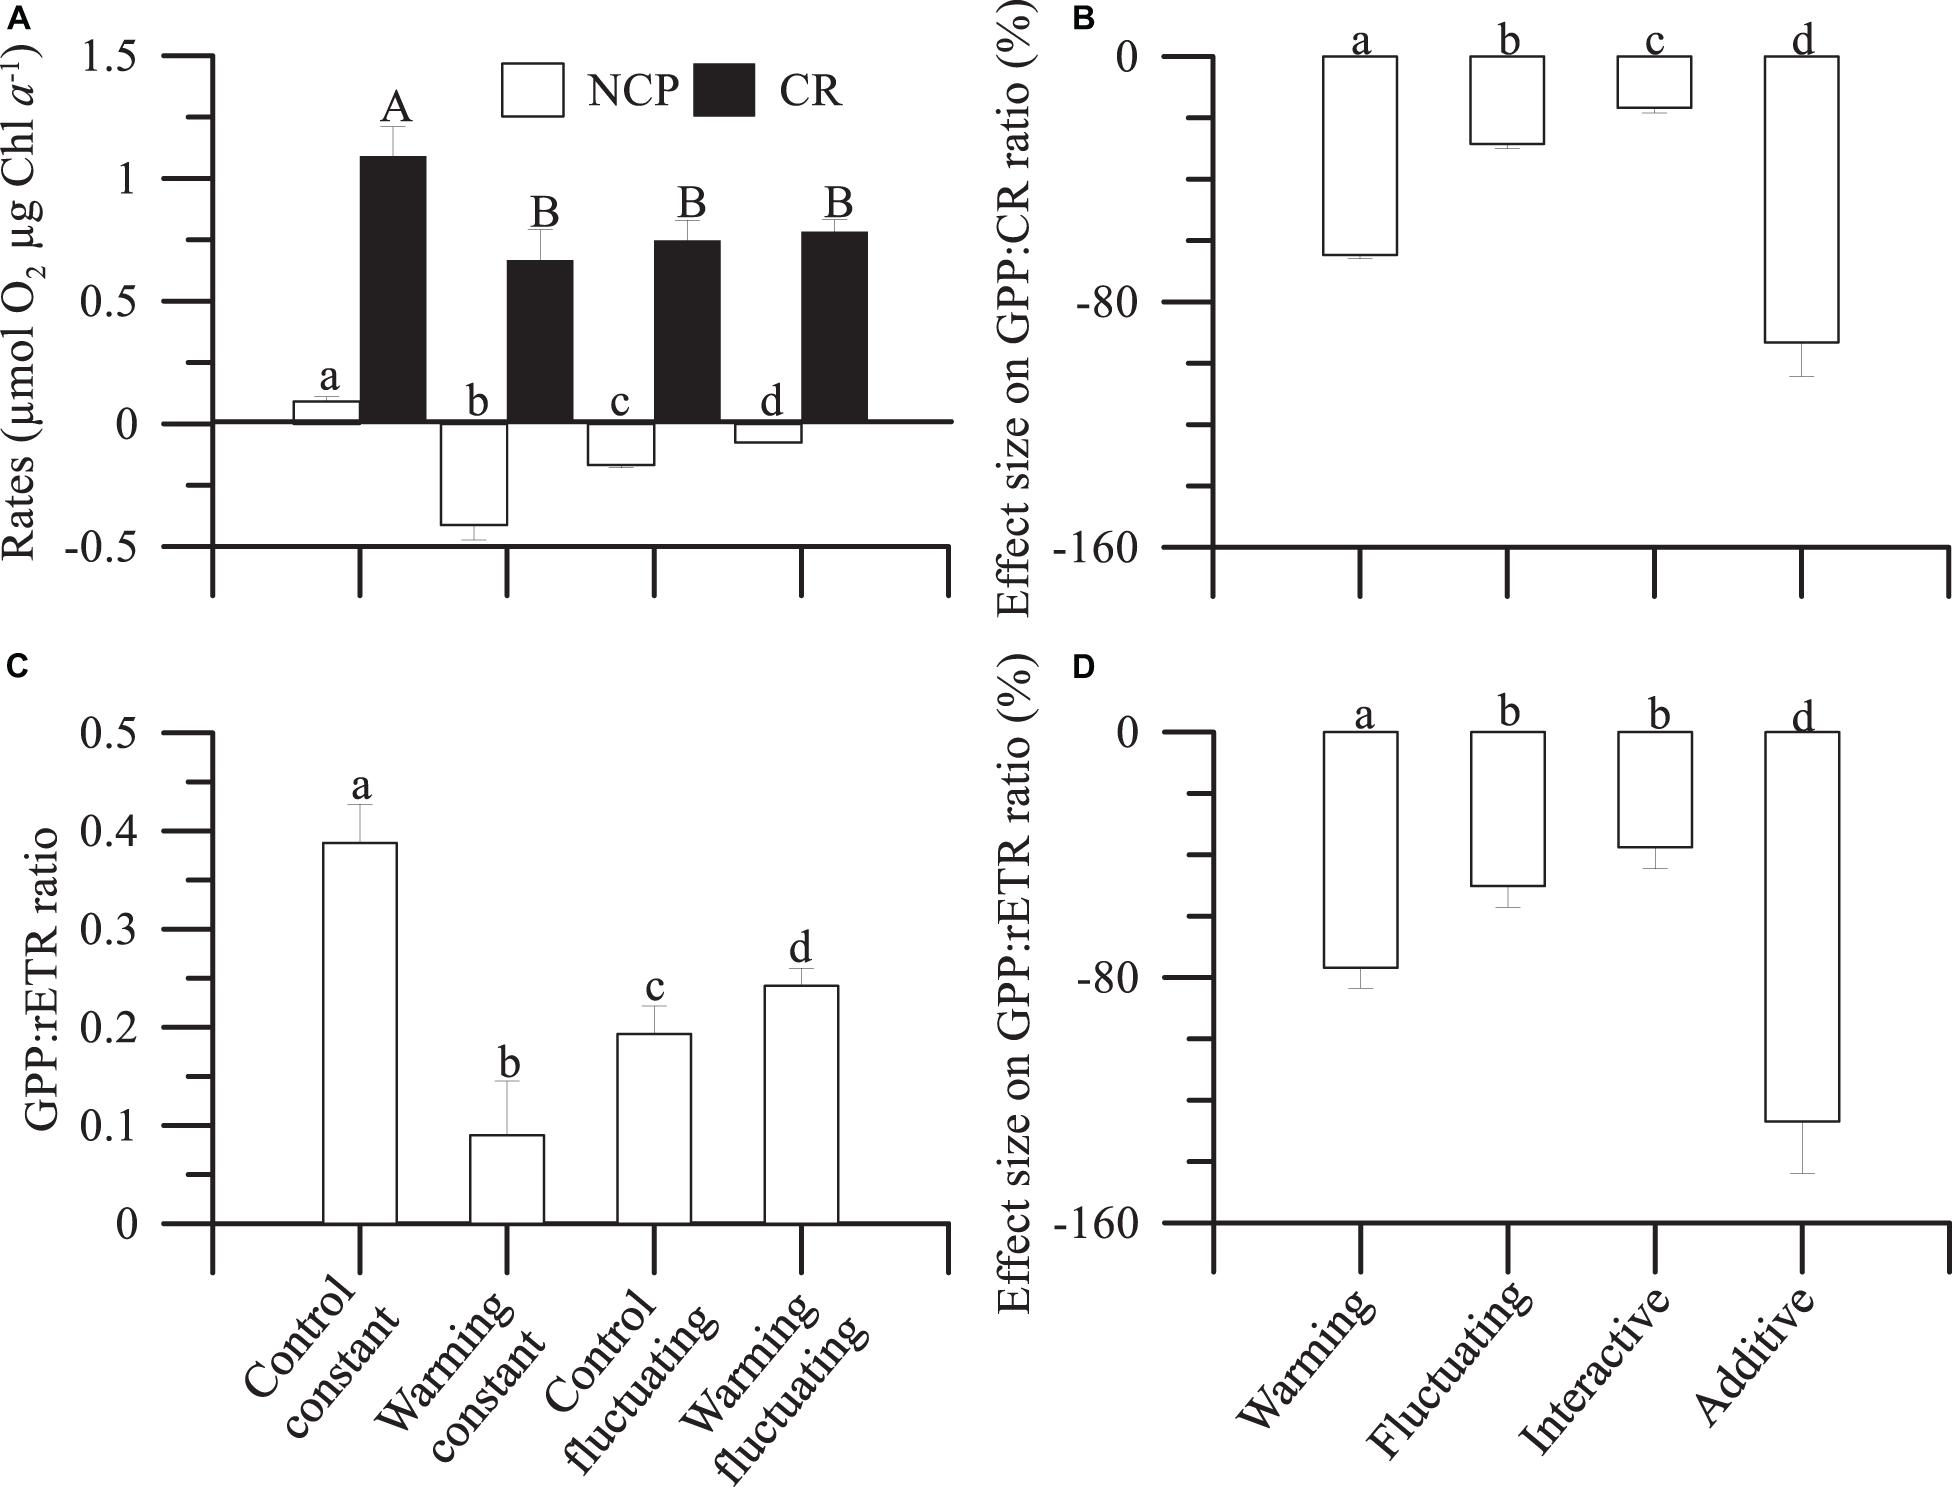
Figure 4. Mean (± SD) (A) net community production (NCP) and respiration rates (in mol O2 μg Chl a–1) and (C) gross primary production:relative electron transport (GPP:rETR) ratios, integrated over the entire duration of the experiment, in microbial plankton communities exposed to: two temperature treatments [Control (15°C) and warming (18°C)] and regimes [Constant and Fluctuating (±3°C respect to Present and Future)]. (B,D) Individual (Warmingconstant, and Controlfluctuating), interactive (Warmingfluctuating) and additive effect size on GPP:CR and GPP:rETR ratios. Letters on the top of bars denote significant differences by the Least Significant Differences (LSD) post hoc test.
From NCP and CR rates we calculated GPP (Supplementary Figure 8H). Then, we calculated the GPP:CR ratio (Supplementary Figure 8H), as a proxy of the metabolic balance of the microbial communities, and the GPP:rETR ratio, a proxy of the light energy absorbed via the photochemical pathway that is converted to community production (Figure 4C). We observed that under controlfluctuating and warmingfluctuating and warmingconstant treatments a decreased GPP:rETR ratio (up to 80%) matched the accentuated heterotrophy (NCP < 0) reported above (Figure 4A and Supplementary Figure 8H).
Finally, we quantified the individual and interactive effect size of fluctuating temperature and warming on GPP:CR and GPP:rETR ratios (Figures 4B,D). As a single driver, warming had a 40% higher negative effect (calculated as the difference between both drivers) than exerted by fluctuating temperature on GPP:rETR ratio (Figure 4D); however, the interaction of fluctuating temperature with warming had a strong antagonistic effect on both GPP:CR (Figure 4B) and GPP:rETR (Figure 4D) ratios, that is, attenuated the negative individual effect of warming.
Discussion
This study demonstrates that the magnitude of the negative effect of warming on net community productivity is lower than expected when fluctuating instead of constant temperatures are considered. Because the experimental design simulated mean temperature increases recorded in the northern Baltic Sea over the last three decades (Supplementary Figure 5), and natural temperature fluctuations that often occur in coastal waters (Kaplan et al., 2003), our results mimic the impacts on aquatic microbial food webs under future environmental conditions.
As expected according to predictions by metabolic theory of ecology (Brown et al., 2004), warming (both constant and fluctuating) exerted a stimulatory effect on cumulative Chl a-specific nutrient uptakes. This stimulatory effect on nutrient uptakes coincided with reductions in phytoplankton biomass under warming, temperature fluctuation and their interaction. Specifically, warmingconstant caused a 3–4-fold higher decrease in biomass stock than exerted by controlfluctuating and warmingfluctuating, denoting that these two temperature change treatments decreased phytoplankton biomass differently. These reductions in biomass contrast with the idea that increased temperatures may trigger strong increases in phytoplankton biomass once the community is acclimated to higher and fluctuating temperatures under non-limiting nutrient conditions (Rasconi et al., 2017). In addition to the opposed impact that both drivers had on phytoplankton biomass and nutrient uptakes, we found that the magnitude of its individual and interactive effect was lower on nutrient uptakes than on phytoplankton biomass. We hypothesize that this accentuated effect on biomass could be consequence of a potential top-down control by microzooplankton. Although we did not quantify such trophic interaction, potential grazer species identified (i.e., ciliates, dinoflagellates and flagellates), which accounted for 50–60% of the total biomass, can behave as mixotrophs (Jones et al., 2009; Unrein et al., 2010; Johnson, 2015), and even exhibit a predominant heterotrophic nutrition mode under warming (Wilken et al., 2013). Moreover, maximal growth rates of herbivorous protists exceed those of phototrophic ones at temperatures > 15°C (Rose and Caron, 2007). As our experimental conditions imposed temperatures between 3 and 6°C higher than controlconstant (i.e., 15°C), increased grazing pressure may have caused the decrease in phytoplankton biomass, particularly under warmingconstant. Jensen’s inequality may help explain why herbivorous pressure could have been lower in temporally fluctuating relative to constant warming environments, as inferred from the smaller decrease in biomass observed (Jensen, 1906; Denny, 2017). Fluctuating temperatures exposed organisms to 21°C during short-term periods (i.e., warm phase) in the warmingfluctuating treatment. This thermal environment could exceed the optimal response threshold of grazers, generating more “extreme” conditions and buffering any performance advantage obtained when they experienced warmer temperatures alone (Vasseur et al., 2014; Fey and Vasseur, 2016).
The shifts registered in the dominant size-structure of the phytoplankton community toward < 5 μm species can be driven by better acclimation of small species to warmer and more varying temperature environments (Bergmann, 1848; Morán et al., 2010). A reduced cell size represents a competitive advantage, i.e., a larger area of exchange with the environment and shorter distance of diffusion between cytoplasm and its surroundings (Czarnoleski et al., 2013). Nevertheless, we can discard that this shift toward communities with smaller cell size was due to a higher ability for nutrient uptake compared to larger cells (Marañón, 2015) because our nutrient conditions were constant and not limiting. Although size structure varied among treatments, phytoplankton community evolved toward a Cyanobacterial dominance. These variations in community composition were concomitant with a decreased phytoplankton genera richness, particularly in both warming treatments compared to controlconstant, and mostly due to loss of diversity within dinoflagellates, and a lower extent in green algae. These findings are consistent with those reported in a long-term experiment in a freshwater ecosystem (Rasconi et al., 2017), suggesting that the same response pattern may apply to marine ecosystems. A progressive loss of phytoplankton diversity under warming conditions has been linked with a dominance of Cyanobacterial species, both in marine and freshwater ecosystems, because they behave as fast-growing r-strategists compared to other phytoplankton groups (Paerl and Paul, 2012). Our results extend such predictions because Cyanobacteria can prevail regardless whether species richness was affected, and temperature conditions (in situ or warming) and regime (constant or fluctuating) changed.
Our results show that warming and/or fluctuating temperatures reduced GPP:rETR and NCP. These reductions prompted a shift in the metabolic balance of the microbial community toward a C-source (i.e., NCP < 0). This negative effect on GPP:CR is consistent with previous results but in experimental freshwater microbial food webs (Yvon-Durocher et al., 2010, 2017). However, and as far as we know, this is the first empirical evidence showing a shift toward a C-source in marine microbial food webs. Three plausible explanations to the decreased NCP rates could be: (i) lower rETR rates found as the succession progressed. These reductions in photochemical performance indicates an increased oxidative stress (Nepper-Davidsen et al., 2019), but also an increased chloroplastidial over-excitation of the photosynthetic apparatus because light absorption exceeds the photochemistry capacity (Derks et al., 2015). This finding would support the decline registered in conversion efficiency of the absorbed energy via photochemical pathway into community production (i.e., GPP:rETR ratio); (ii) Reductions registered in species richness. In agreement with our results, it has been recently reported that as temperature rises, more species are required to maintain ecosystem functioning i.e., primary production and CO2 uptake from the atmosphere (Bestion et al., 2020; Lewington-Pearce et al., 2020); and (iii) phytoplankton communities with declined (or low) species richness have lower probability of containing highly productive species that contribute significantly to maintain ecosystem function (Cermeño et al., 2016).
Contrarily to the view that changes in GPP:CR ratios toward heterotrophy are mediated by differential increases in CR due to a higher thermal dependence than GPP (López-Urrutia et al., 2006), we found no stimulatory effects of any driver tested on CR. Considering that flagellates (which contributed supposed 25–30% of the total microbial biomass in our study) play a key role governing bacterial abundance (Sanders et al., 1992), and that a recent work in the study area suggests that these flagellates are potentially mixotrophic, with heterotrophic nutrition dominating over autotrophic one (Paczkowska et al., 2019), we suggest that an increased predation on bacteria could explain the absence of CR stimulation under warming and/or fluctuating temperatures. We based our reasoning in the fact that bacteria are main contributors to the CR in plankton communities if it is compared with phytoplankton (i.e., between 56% Robinson and Williams, 2005 and 70–92% Giering et al., 2014). Nevertheless, we cannot discard, similarly that mentioned above, that the lower productivity of the community under these scenarios could have influenced CR rates, hence the reductions reported.
Despite the consistent inhibitory effect of warmingconstant, we found that fluctuating temperatures ameliorated such negative impacts regardless of the different biological organization considered. Because under fluctuating conditions plankton communities also experienced short-term cooling periods that mimicked mean temperatures in surface waters of the Baltic Sea during summer time (15°C), we can argue that such “benign” conditions would suppose a positive influence that partially attenuated the harmful effects of mean warmingconstant (i.e., 18°C), and even extreme warming experienced during the warm phase of fluctuating conditions (i.e., 21°C).
In contrast to the patterns described above, the C:N elemental ratio of phytoplankton communities, which impacts energy transfer through the microbial food web and the efficiency of the biological pump to export organic C to deep waters, was not affected by any of the drivers considered. This supports recent results with coastal phytoplankton communities that showed that neither temperature nor their variation has effect upon C:N (Kling et al., 2020), possibly because nutrient supply rather than temperature is the key driver in the variability of phytoplankton stoichiometry (Galbraith and Martiny, 2015; Marañón et al., 2018).
Additional drivers beyond those tested here may affect the ecosystem’s functioning. For instance, larger grazers, such as mesozooplankton, which were excluded in our study, can be less susceptible to thermal stress than phototrophs (Liu et al., 2019). In addition, nutrient availability, which was fixed in our mesocosms, may alter the net impact of future scenarios because nutrient limitation has been shown to reduce the thermal dependence of phytoplankton metabolic rates (O’Connor et al., 2009; Marañón et al., 2018), cause a lower thermal resilience in phytoplankton populations (Thomas et al., 2017), and even inhibit adaptation to high temperatures over evolutionary time scales (Aranguren-Gassis et al., 2019).
Implications
Overall, our results highlight the potential for a major antagonistic effect of environmental warming and temperature fluctuations on marine communities and ecosystem functioning. Consequently, specific richness losses, declines in the conversion efficiency of the light energy absorbed into community production, or decreases in C-uptake by microbial communities as a result of warming could be up to 40% less severe when temperature fluctuations are taken into account. Thus, we stress the need to consider short-term variability, both natural and anthropogenic, to acquire a more realistic and comprehensive view of climate change impacts on marine ecosystems.
Data Availability Statement
The original contributions presented in the study are included in the article/Supplementary Material, further inquiries can be directed to the corresponding author/s.
Author Contributions
MJC and EM conceived the idea and acquired the funding. MJC, CF-G, EM, AA-N, HL, and MA-G designed and performed the research, and analyzed the samples, results discussion, comments, and approval of the final version of the manuscript. MJC contributed to the formal analysis and manuscript drafting and editing.
Funding
This study was supported by a Transnational Access granted to MJC through AQUACOSM project, by European Union’s Horizon 2020 Research and Innovation Programme through project “Tropical and South Atlantic climate-based marine ecosystem predictions for sustainable management” (TRIATLAS, grant agreement no. 731065), and by Ministerio de Ciencia, Innovación y Universidades (MICINN) through project “Responses of marine phytoplankton to environmental variability across levels of biological organization” (POLARIS, grant number PGC2018-094553-B-I00) to EM. MJC was supported by Juan de la Cierva-Formación (FJCI2017-32318) and Incorporación (ICJ2019-040850-I) postdoctoral contracts from MICINN, MA-G by a postdoctoral contract from Xunta de Galicia (Tipo B) and by the Retención de Talento program from Universidade de Vigo, and CF-G by a predoctoral contract from Xunta de Galicia (ED481-2017/342).
Conflict of Interest
The authors declare that the research was conducted in the absence of any commercial or financial relationships that could be construed as a potential conflict of interest.
Acknowledgments
We are deeply grateful to Annie Cox for her advice and help during the experiment, and for measuring nutrient and DOC samples.
Supplementary Material
The Supplementary Material for this article can be found online at: https://www.frontiersin.org/articles/10.3389/fmars.2021.656282/full#supplementary-material
References
Andersson, A., Haecky, P., and Hagström, A. (1994). Effect of temperature and light on the growth of micro- nano- and pico-plankton: impact on algal succession. Mar. Biol. 120, 511–520. doi: 10.1007/bf00350071
Aranguren-Gassis, M., Kremer, C. T., Klausmeier, C. A., and Litchman, E. (2019). Nitrogen limitation inhibits marine diatom adaptation to high temperatures. Ecol. Lett. 22, 1860–1869. doi: 10.1111/ele.13378
Bates, A. E., Helmuth, B., Burrows, M. T., Duncan, M. I., Garrabou, J., Guy-Haim, T., et al. (2018). Biologists ignore ocean weather at their peril. Nature 560, 29–30. doi: 10.2307/j.ctvh1dhfr.8
Bergmann, C. (1848). Über die Verhältnisse der Wärmeökonomie der Thiere zu Ihrer Grösse. Göttingen: Vandenhoeck und Ruprecht.
Bestion, E., Barton, A. D., García, F. C., Warfield, R., and Yvon-Durocher, G. (2020). Abrupt declines in marine phytoplankton production driven by warming and biodiversity loss in a microcosm experiment. Ecol. Lett. 23, 453–466.
Biermann, A., Lewandowska, A. M., Engel, A., and Riebesell, U. (2015). Organic matter partitioning and stoichiometry in response to rising water temperature and copepod grazing. Mar. Ecol. Progr. Ser. 522, 49–65. doi: 10.3354/meps11148
Brown, J. P., Gillooly, F., Allen, A. P., Savage, V. M., and West, G. B. (2004). Toward a metabolic theory of ecology. Ecology 85, 1771–1789. doi: 10.1890/03-9000
Cermeño, P., Chouciño, P., Fernández-Castro, B., Figueiras, F. G., Marañón, E., Marrasé, C., et al. (2016). Marine primary productivity is driven by a selection effect. Front. Mar. Sci. 3:173. doi: 10.3389/fmars.2016.00173
Chavez, F. P., Messié, M., and Pennington, J. T. (2011). Marine primary production in relation to climate variability and change. Annu. Rev. Mar. Sci. 3, 227–260. doi: 10.1146/annurev.marine.010908.163917
Czarnoleski, M., Cooper, B. S., Kierat, J., and Angilletta, M. J. Jr. (2013). Flies developed small bodies and small cells in warm and in thermally fluctuating environments. J. Exper. Biol. 216, 2896–2901. doi: 10.1242/jeb.083535
Denny, M. (2017). The fallacy of the average: on the ubiquity, utility and continuing novelty of Jensen’s inequality. J. Exper. Biol. 220, 139–146. doi: 10.1242/jeb.140368
Derks, A., Schaven, K., and Bruce, D. (2015). Diverse mechanisms for photoprotection in photosynthesis. Dynamic regulation of photosystem II excitation in response to rapid environmental change. Biochim. Biophys. Acta Bioenergect. 1847, 468–485. doi: 10.1016/j.bbabio.2015.02.008
Fey, S. B., and Vasseur, D. A. (2016). Thermal variability alters the impact of climate warming on consumer–resource systems. Ecology 97, 1690–1699. doi: 10.1890/15-1838.1
Galbraith, E. D., and Martiny, A. C. (2015). A simple-nutrient-dependence mechanism for predicting the stoichiometry of marine ecosystems. Proc. Natl. Acad. Sci. U.S.A. 112, 8199–8204. doi: 10.1073/pnas.1423917112
Garzke, J., Connor, S. J., Sommer, U., and O’Connor, M. I. (2019). Trophic interactions modify the temperature dependence of community biomass and ecosystem function. PLoS Biol. 17:e2006806. doi: 10.1371/journal.pbio.2006806
Genty, B. E., Briantais, J. M., and Baker, N. R. (1989). The relationship between the quantum yield of photosynthetic electron transport and quenching of chlorophyll fluorescence. Biochim. Biophys. Acta 990, 87–92. doi: 10.1016/s0304-4165(89)80016-9
Gerhard, M., Koussoroplis, A. M., Hillebrand, H., and Striebel, M. (2019). Phytoplankton community responses to temperature fluctuations under different nutrient concentrations and stoichiometry. Ecology 100:e02834.
Giering, S. L. C., Sanders, R., Lampitt, R. S., Anderson, T. R., Tamburini, C., Boutrif, M., et al. (2014). Reconciliation of the carbon budget in the ocean’s twilight zone. Nature 507, 480–483. doi: 10.1038/nature13123
Grasshoff, K., Ehrhardt, M., and Kremling, K. (2009). Methods in Seawater Analysis, 3nd Edn, Weinheim: Verlag Chemic.
Hobday, A. J., Alexander, L. V., Perkins, S. E., Smale, D. A., Straub, S. C., Oliver, E. C. J., et al. (2016). A hierarchical approach to defining marine heatwaves. Progr. Oceanogr. 141, 227–238. doi: 10.1016/j.pocean.2015.12.014
IPCC (2019). “Global warming of 1.5°C. An IPCC special report on the impacts of global warming of 1.5°C above pre-industrial levels and related global greenhouse gas emission pathways,” in The Context of Strengthening the Global Response to the Threat of Climate Change, Sustainable Development, and Efforts to Eradicate Povert, eds V. Masson-Delmotte, P. Zhai, H.-O. Pörtner, D. Roberts, J. Skea, P. R. Shukla, et al. (Geneva: IPCC), 630.
Jensen, J. L. W. V. (1906). Sur les fonctions convexes et les inégalités entre les valeurs moyennes. Acta Math. 30, 175–193. doi: 10.1007/bf02418571
Johnson, M. D. (2015). Inducible mixotrophy in the dinoflagellate Prorocentrum minimum. J. Euk. Microbiol. 62, 431–443. doi: 10.1111/jeu.12198
Jones, H. L. J., Leadbeater, B. S. C., and Green, J. C. (2009). Mixotrophy in marine species of Chrysochromulina (Prymnesiophyceae): ingestion and digestion of a small green flagellate. J. Mar. Biol. Assoc. U.K. 73, 283–296. doi: 10.1017/s0025315400032859
Kaplan, D. M., Largier, J. L., Navarrete, S., Guiñez, R., and Castilla, J. C. (2003). Large diurnal temperature fluctuationsin the nearshore water column. Estuar. Coast. S. Sci. 57, 385–398. doi: 10.1016/s0272-7714(02)00363-3
Kling, J. D., Lee, M. D., Fu, F., Phan, M. D., Wang, X., Qu, P., et al. (2020). Transient exposure to novel high temperatures reshapes coastal phytoplankton communities. ISME J. 14, 413–424. doi: 10.1038/s41396-019-0525-6
Kremer, C. T., Fey, S. B., Arellano, A. A., and Vasseur, D. A. (2018). Gradual plasticity alters population dynamics in variable environments: thermal acclimation in the green alga Chlamydomonas reinhartdii. Proc. R. Soc. Lond. B Biol. Sci. 285:20171942. doi: 10.1098/rspb.2017.1942
Kroeker, K. J., Bell, L. E., Donham, E. M., Hoshijima, U., Lummis, S., Toy, J. A., et al. (2020). Ecological change in dynamic environments: accounting for temporal environmental variability in studies of ocean change biology. Glob. Chang. Biol. 26, 54–67. doi: 10.1111/gcb.14868
Lewington-Pearce, L., Parker, B., Narwani, A., Nielsen, J. M., and Kratina, P. (2020). Diversity and temperature indirectly reduce CO2 concentration in experimental freshwater communities. Oecologia 192, 515–527. doi: 10.1007/s00442-020-04593-0
Liu, K., Chen, B., Zhang, S., Sato, M., Shi, Z., and Liu, H. (2019). Marine phytoplankton in subtropical coastal waters showing lower thermal sensitivity than microzooplankton. Limnol. Oceanogr. 64, 1103–1119. doi: 10.1002/lno.11101
López-Urrutia, A., San Martín, E., Harris, R. P., and Irigoien, X. (2006). Scaling the metabolic balance of the oceans. Proc. Natl. Acad. Sci. U.S.A. 103, 8739–8744. doi: 10.1073/pnas.0601137103
Marañón, E. (2015). Cell size as a key determinant of phytoplankton metabolism and community structure. Annu. Rev. Mar. Sci. 7, 241–264. doi: 10.1146/annurev-marine-010814-015955
Marañón, E., Lorenzo, M. P., Cermeño, P., and Mouriño-Carballido, B. (2018). Nutrient limitation suppresses the temperature dependence of phytoplankton metabolic rates. ISME J. 12, 1836–1845. doi: 10.1038/s41396-018-0105-1
Morán, X. A. G., López-Urrutia, A., Calvo-Díaz, A., and Li, W. K. W. (2010). Increasing importance of small phytoplankton in a warmer ocean. Glob. Chang. Biol. 16, 1137–1144. doi: 10.1111/j.1365-2486.2009.01960.x
Nepper-Davidsen, J., Andersen, D. V., and Pedersen, M. F. (2019). Exposure to simulated heatwave scenarios causes long-term reductions in performance Saccharina latissima. Mar. Ecol. Progr. Ser. 630, 25–39. doi: 10.3354/meps13133
Olenina, I., Hajdu, S., Edler, L., Andersson, A., Wasmund, N., Busch, S., et al. (2006). Biovolumes and Size-Classes of Phytoplankton in the Baltic Sea. Helsinki: Baltic Marine Environment Protection Commission.
O’Connor, M. I., Piehler, M. F., Dina, M. L., and Bruno, J. F. (2009). Warming and resource availability shift food web structure and metabolism. PLoS Biol. 7:1000178. doi: 10.1371/journal.pbio.1000178
Paczkowska, J., Rowe, O. F., Figueroa, D., and Andersson, A. (2019). Drivers of phytoplankton production and community structure in nutrient-poor estuaries receiving terrestrial organic inflow. Mar. Environ. Res. 151:104778. doi: 10.1016/j.marenvres.2019.104778
Paerl, H. W., and Paul, V. J. (2012). Climate change: links to global expansion of harmful cyanobacteria. Water Res. 46, 1349–1363. doi: 10.1016/j.watres.2011.08.002
Peter, K. H., and Sommer, U. (2013). Phytoplankton cell size reduction in response to warming mediated by nutrient limitation. PLoS One 8:e71528. doi: 10.1371/journal.pone.0071528
Pielou, E. C. (1966). The measurement of diversity in different types of biological collections. J. Theor. Biol. 13, 131–144. doi: 10.1016/0022-5193(66)90013-0
Rasconi, S., Winter, K., and Kainz, M. J. (2017). Temperature increase and fluctuation induce phytoplankton biodiversity loss – Evidence from a multi-seasonal mesocosm experiment. Ecol. Evol. 7, 2936–2946. doi: 10.1002/ece3.2889
Rayner, T. S., Parker, D. E., Horton, E. B., Folland, C. K., Alexander, L. V., Rowell, D. P., et al. (2003). Global analyses of sea surface temperature, sea ice, and night marine air temperature since the late nineteenth century. J. Geophys. Res. Atmos. 108:4407.
Righetti, D., Vogt, M., Gruber, N., Psomas, A., and Zimmermann, N. E. (2019). Global pattern of phytoplankton diversity driven by temperature and environmental variability. Sci. Adv. 5:eaau6253. doi: 10.1126/sciadv.aau6253
Robinson, C., and Williams, P. J. L. B. (2005). “Respiration and its measurement in surface marine waters,” in Respiration in Aquatic Ecosystems, eds P. A. Del Giorgio and P. J. L. B. Williams (Oxford: Oxford University Press), 147–180. doi: 10.1093/acprof:oso/9780198527084.003.0009
Rose, J. M., and Caron, D. A. (2007). Does low temperature constrain the growth rates of heterotrophic protists?. Evidence and implications for algal blooms in cold waters. Limnol. Oceanogr. 52, 886–895. doi: 10.4319/lo.2007.52.2.0886
Sanders, R. W., Caron, D. A., and Berninger, U.-G. (1992). Relationships between bacteria and heterotrophic nanoplankton in marine and fresh waters: an inter-ecosystem comparison. Mar. Ecol. Progr. Ser. 86, 1–14. doi: 10.3354/meps086001
Schaum, C. E., Buckling, A., Smirnoff, N., Studholme, D. J., and Yvon-Durocher, G. (2018a). Environmental fluctuations accelerate molecular evolution of thermal tolerance in a marine diatom. Nat. Commun. 9:1719.
Schaum, C. E., Student Research Team, Ffrench-Constant, R., Lowe, C., Ólafsson, J. S., Padfield, D., et al. (2018b). Temperature-driven selection on metabolic traits increases the strength of an algal–grazer interaction in naturally warmed streams. Glob. Chang. Biol. 24, 1793–1803. doi: 10.1111/gcb.14033
Smale, D. A., Wernberg, T., Oliver, E. C. J., Thomsen, M., Harvey, B. P., Straub, S. C., et al. (2019). Marine heatwaves threaten global biodiversity and the provision of ecosystem services. Nat. Clim. Chang. 9, 306–312. doi: 10.1038/s41558-019-0412-1
Steffen, W., Richarson, K., Rockström, J., Cornell, S. E., Fetzer, I., Bennett, E. M., et al. (2015). Planetary boundaries: guiding human development on a changing planet. Science 347:1259855. doi: 10.1126/science.1259855
Suggett, D. J., Oxborough, K., Baker, N. R., MacIntyre, H. L., Kana, T. M., and Geider, R. J. (2003). Fast repetition rate and pulse amplitude modulation chlorophyll a fluorescence measurements for assessment of photosynthetic electron transport in marine phytoplankton. Eur. J. Phycol. 38, 371–384. doi: 10.1080/09670260310001612655
Thomas, M. K., Aranguren-Gassis, M., Kremer, C. T., Gould, M. R., Anderson, K., Klausmeier, C. A., et al. (2017). Temperature–nutrient interactions exacerbate sensitivity to warming in phytoplankton. Glob. Chang. Biol. 23, 3269–3280. doi: 10.1111/gcb.13641
Ullah, H., Nagelkerken, I., Goldenberg, S. U., and Fordham, D. A. (2018). Climate change could drive marine food web collapse through altered trophic flows and cyanobacterial proliferation. PLoS Biol. 16:e2003446. doi: 10.1371/journal.pbio.2003446
Unrein, F., Gasol, J. M., and Massana, R. (2010). Dinobryon faculiferum (Chrysophyta) in coastal Mediterranean seawater: presence and grazing impact on bacteria. J. Plankton Res. 32, 559–564. doi: 10.1093/plankt/fbp150
Utermöhl, H. (1958). Zur Vervollkommnung der quantitativen Phytoplankton-Methodik. Int. Ver. Theor. Angew. Limnol. 9, 1–38. doi: 10.1080/05384680.1958.11904091
Vasseur, D. A., DeLong, J. P., Gilbert, B., Greig, H. S., Harley, C. D. G., McCann, K. S., et al. (2014). Increased temperature variation posesa greater risk to species than climate warming. Proc. R. Soc. Lond. B: Biol. Sci. 281:20132612. doi: 10.1098/rspb.2013.2612
Verity, P. G., Robertson, C. Y., Tronzo, C. R., Andrews, M. G., Nelson, J. R., and Sieracki, M. E. (1992). Relationships between cell volume and the carbon and nitrogen content of marine photosynthetic nanoplankton. Limnol. Oceanogr. 37, 1434–1446. doi: 10.4319/lo.1992.37.7.1434
Wang, X., Fu, F., Qu, P., Kling, J. D., Jiang, H., Gao, Y., et al. (2019). How will the key marine calcifier Emiliania huxleyi respond to a warmer and more thermally variable ocean? Biogeosciences 16, 4393–4409. doi: 10.5194/bg-16-4393-2019
Wilken, S., Huisman, J., Naus-Wiezer, S., and Van Donk, E. (2013). Mixotrophic organisms become more heterotrophic with rising temperature. Ecol. Lett. 16, 225–233. doi: 10.1111/ele.12033
Yvon-Durocher, G., Allen, A. P., Cellamare, M., Dossena, M., Dossena, M., Gaston, K. J., et al. (2015). Five years of experimental warming increases the biodiversity and productivity of phytoplankton. PLoS Biol. 13:e1002324. doi: 10.1371/journal.pbio.1002324
Yvon-Durocher, G., Hulatt, C., Woodward, G., and Trimmer, M. (2017). Long-term warming amplifies shifts in the carbon cycle of experimental ponds. Nat. Clim. Chang. 7, 209–213. doi: 10.1038/nclimate3229
Keywords: coastal ecosystems, diversity, interacting effects, global-change drivers, metabolic balance, net community productivity, photophysiology, specie’s richness
Citation: Cabrerizo MJ, Marañón E, Fernández-González C, Alonso-Núñez A, Larsson H and Aranguren-Gassis M (2021) Temperature Fluctuation Attenuates the Effects of Warming in Estuarine Microbial Plankton Communities. Front. Mar. Sci. 8:656282. doi: 10.3389/fmars.2021.656282
Received: 20 January 2021; Accepted: 18 March 2021;
Published: 09 April 2021.
Edited by:
Hongbin Liu, Hong Kong University of Science and Technology, Hong KongReviewed by:
Chih-hao Hsieh, National Taiwan University, TaiwanDolors Vaque, Consejo Superior de Investigaciones Científicas (CSIC), Spain
Copyright © 2021 Cabrerizo, Marañón, Fernández-González, Alonso-Núñez, Larsson and Aranguren-Gassis. This is an open-access article distributed under the terms of the Creative Commons Attribution License (CC BY). The use, distribution or reproduction in other forums is permitted, provided the original author(s) and the copyright owner(s) are credited and that the original publication in this journal is cited, in accordance with accepted academic practice. No use, distribution or reproduction is permitted which does not comply with these terms.
*Correspondence: Marco J. Cabrerizo, marcojc@uvigo.es orcid.org/0000-0001-5576-6095