Exploring Vitamin B1 Cycling and Its Connections to the Microbial Community in the North Atlantic Ocean
 Christopher P. Suffridge1*
  Luis M. Bolaños1
  Kristin Bergauer2,3
  Alexandra Z. Worden2,3
  Jeff Morré4
  Michael J. Behrenfeld5
  Stephen J. Giovannoni1
- 1Department of Microbiology, Oregon State University, Corvallis, OR, United States
- 2Ocean Ecosystems Biology Unit, GEOMAR Helmholtz Centre for Ocean Research, Kiel, Germany
- 3Monterey Bay Aquarium Research Institute, Moss Landing, CA, United States
- 4Department of Chemistry, Oregon State University, Corvallis, OR, United States
- 5Department of Botany and Plant Pathology, Oregon State University, Corvallis, OR, United States
Vitamin B1 (thiamin) is an essential coenzyme for all cells. Recent findings from experimental cell biology and genome surveys have shown that thiamin cycling by plankton is far more complex than was previously understood. Many plankton cells cannot produce thiamin (are auxotrophic) and obligately require an exogenous source of thiamin or one or more of 5 different thiamin-related compounds (TRCs). Despite this emerging evidence for the evolution among plankton of complex interactions related to thiamin, the influence of TRCs on plankton community structure and productivity are not understood. We report measurements of three dissolved TRCs 4-amino-5-aminomethyl-2-methylpyrimidine (AmMP), 5-(2-hydroxyethyl)-4-methyl-1,3-thiazole-2-carboxylic acid (cHET), and 4-methyl-5-thiazoleethanol (HET) that have never before been assayed in seawater. Here we characterize them alongside other TRCs that were measured previously [thiamin and 4-amino-5-hydroxymethyl-2-methylpyrimidine (HMP)], in depth profiles from a latitudinal transect in the north Atlantic in March 2018. TRC concentrations ranged from femptomolar to picomolar. Surface depletion relative to a maximum near the bottom of the euphotic zone and low concentrations at deeper depths were consistent features. Our observations suggest that when bacterial abundance and production are low, TRC concentrations approach a steady state where TRC production and consumption terms are balanced. Standing stocks of TRCs also appear to be positively correlated with bacterial production. However, near the period of peak biomass in the accumulation phase of a bloom we observed an inverse relationship between TRCs and bacterial production, coincident with an increased abundance of Flavobacteria that comparative genomics indicates could be vitamin B1 auxotrophs. While these observations suggest that the dissolved pool of TRCs is often at steady state, with TRC production and consumption balanced, our data suggests that bloom induced shifts in microbial community structure and activity may cause a decoupling between TRC production and consumption, leading to increased abundances of some populations of bacteria that are putatively vitamin B1 auxotrophs.
Introduction
Vitamin B1, also known as thiamin, is an essential coenzyme required for carbon metabolism across all domains of life (Monteverde et al., 2017). Availability of vitamin B1 has the potential to control marine microbial activity, interactions, and community structure. In marine systems there are over 30 vitamin B1 dependent enzymes found in microbial genomes (Schowen, 1998; Sañudo-Wilhelmy et al., 2014). These enzymes are mainly used for carbohydrate and branched chain amino acid metabolism and include pyruvate dehydrogenase, transketolase, and oxoglutarate dehydrogenase, which catalyze key steps in the TCA and Calvin-Benson cycles (Rapala-Kozik, 2011). This coenzyme functions by stabilizing the acyl carbanion in rearrangement reactions (Jurgenson et al., 2009). Vitamin B1 has a heterocyclic structure consisting of a pyrimidine and a thiazole ring (Begley et al., 1999; Chatterjee et al., 2006; Jurgenson et al., 2009). These rings are biosynthesized by separate metabolic pathways and then ligated together to form thiamin, vitamin B1 (Jurgenson et al., 2009). The pathways for this biosynthetic process are different between bacteria (Begley et al., 1999), archaea (Maupin-Furlow, 2018), and eukaryotes (Chatterjee et al., 2006). Vitamin B1 biosynthesis is regulated by riboswitches, which are believed to be ancient regulatory structures that make B1 biosynthesis responsive to intracellular concentrations of multiple forms of vitamin B1, its precursors, and degradation products (Winkler and Breaker, 2005; Croft et al., 2007; McRose et al., 2014; Atilho et al., 2019). Cell membrane transport proteins for vitamin B1 are common in marine microbes, indicating that some members of the microbial community can assimilate exogenous vitamin B1 and its related compounds from the dissolved pool (Gómez-Consarnau et al., 2016; Donovan et al., 2018).
Despite universal metabolic requirement for vitamin B1 amongst marine microorganisms, many organisms lack the complete vitamin B1 biosynthesis pathway and are therefore vitamin B1 auxotrophs. Vitamin B1 auxotrophy in phytoplankton was identified through early cultivation efforts (Hunter and Provasoli, 1964; Provasoli and Carlucci, 1974). Carlucci et al. further confirmed these findings using a bioassay method to determine vitamin B1 concentrations both dissolved in seawater and inside phytoplankton cells (Carlucci, 1970; Carlucci and Bowes, 1972). Genome sequencing has been particularly effective for identifying vitamin B1 auxotrophy in marine systems. It has been estimated from genomes and cell culture collections that around 20% of bacterioplankton and 30–50% of phytoplankton obligately require exogenous sources of vitamin B1 (Tang et al., 2010; Sañudo-Wilhelmy et al., 2014).
Recent studies enabled by next generation sequencing and cell culture approaches have demonstrated that vitamin B1 auxotrophy is even more widespread and complex than suggested by initial reports. It now appears that many organisms have evolved gaps in canonical vitamin B1 biosynthesis pathways and therefore require one or more thiamin precursors or degradation products, hereafter called Thiamin Related Compounds (TRCs). The most abundant heterotroph in the ocean, SAR11, lacks the enzymes to synthesize thiamin's pyrimidine moiety, 4-amino-5-hydroxymethyl-2-methylpyrimidine (HMP), and must acquire HMP from the dissolved pool in surrounding seawater to complete thiamin biosynthesis (Carini et al., 2014). Similar auxotrophy has been observed in some haptophyte and stramenopile algae, where it was observed that organisms had a preference for HMP and its salvage-related analog 4-amino-5-aminomethyl-2-methylpyrimidine (AmMP) over intact thiamin (McRose et al., 2014; Gutowska et al., 2017). Auxotrophy for both the thiazole and pyrimidine moieties has been observed in marine picoeukaryotes. Genomic surveys indicate that these organisms obligately require exogenous sources of both HMP and 4-methyl-5-thiazoleethanol (HET), while they maintain the biosynthetic machinery to ligate these two scavenged moieties to meet their metabolic thiamin demand (McRose et al., 2014; Paerl et al., 2015; Gutowska et al., 2017). Interestingly, cell culture experiments indicate that these picoeukaryotes require HMP but cannot utilize HET. Instead, they can only utilize the recently identified separate thiamin precursor, 5-(2-hydroxyethyl)-4-methyl-1,3-thiazole- 2-carboxylic acid (cHET) (Paerl et al., 2016, 2018a). Metagenomic surveys of marine environments have used patterns in pathway gaps to identify several prevalent variants of vitamin B1 auxotrophy, leading to the conclusion that most bacterioplankton in nature are reliant on one or more vitamin B1 precursors or degradation products (Gómez-Consarnau et al., 2018; Paerl et al., 2018b).
The recent findings reviewed above indicate that vitamin B1 biosynthetic pathways are a locus of substantial evolutionary variation tied to interactions between plankton cells involving TRC intermediates. Explanations for this variability range from cells saving on the costs of making compounds that are available from the environment, to more complex interpretations involving trafficking of compounds as a basis for complex co-evolutionary processes (e.g., competition and mutualism).
The initial source of all TRCs in the oceanic dissolved phase is from microbial metabolic activity, which in some cases is followed by extracellular abiotic breakdown (Jurgenson et al., 2009). While there is substantial evidence of many types of vitamin B1 auxotrophy that likely lead to removal of TRCs from the dissolved pool, little is known about the rates or specific mechanisms associated with uptake and abiotic degradation (Gold et al., 1966; Carlucci et al., 1969). Likewise, the rates and mechanisms of TRC synthesis and release from the cellular phase into the dissolved phase are unclear. Genomic evidence indicates that some organisms, including members of the Cyanobacteria, are capable of de novo thiamin synthesis (Sañudo-Wilhelmy et al., 2014). However, it is unclear what the major sources of TRCs are in the marine system. Adding to this complexity is the fact that dissolved concentrations of all TRCs (thiamin, HMP, AmMP, HET, and cHET) have not been simultaneously measured in the ocean. Distributions of thiamin and, to a lesser extent, HMP have been infrequently reported (Sañudo-Wilhelmy et al., 2012; Heal et al., 2014; Suffridge et al., 2017, 2018). What has become clear is that measuring these compounds alone is not sufficient to fully understand thiamin cycling and its relationship to the microbial community.
Here we report the most comprehensive measurement of dissolved TRC concentrations yet undertaken. Five TRCs inferred to be important to B1 related interactions in plankton were simultaneously measured in vertical profiles along a latitudinal transect in the north Atlantic. Samples were collected during the accumulation phase of the north Atlantic spring bloom in March 2018 as part of the North Atlantic Aerosols and Maine Ecosystems Project (NAAMES) (Behrenfeld et al., 2019). A full suite of physical, chemical, and biological oceanographic data, including molecular community diversity data, accompanied the TRC concentration measurements. We set out to measure spatial patterns in dissolved TRC concentrations to improve understanding of the role of TRCs in structuring plankton communities. Because vitamin B1 is required by many enzymes in central metabolism, we hypothesized that increased light and mixed layer shoaling during the bloom accumulation phase would result in enhanced microbial demand for vitamin B1 and, thus, a depletion of dissolved TRCs. Furthermore, we hypothesized that growth rates and metabolic activity would be lower during pre-bloom conditions, resulting in near steady-state dissolved TRC concentrations reflecting more tightly balanced growth and loss rates within microbial communities.
Methods
Sample Collection
Samples were collected as part of the North Atlantic Aerosol and Marine Ecosystem Study (NAAMES) aboard the R/V Atlantis in March and April 2018 (Behrenfeld et al., 2019). Samples were collected from five stations along a roughly meridional transect in the northwest Atlantic from 39 to 44°N (Figure 1). All sampling occurred in daylight hours between sunrise and solar noon. A CTD-rosette water sampler with 24 10L Niskin bottles (Seabird 911+; standard conductivity, temperature, and pressure sensors) was used to collect samples.
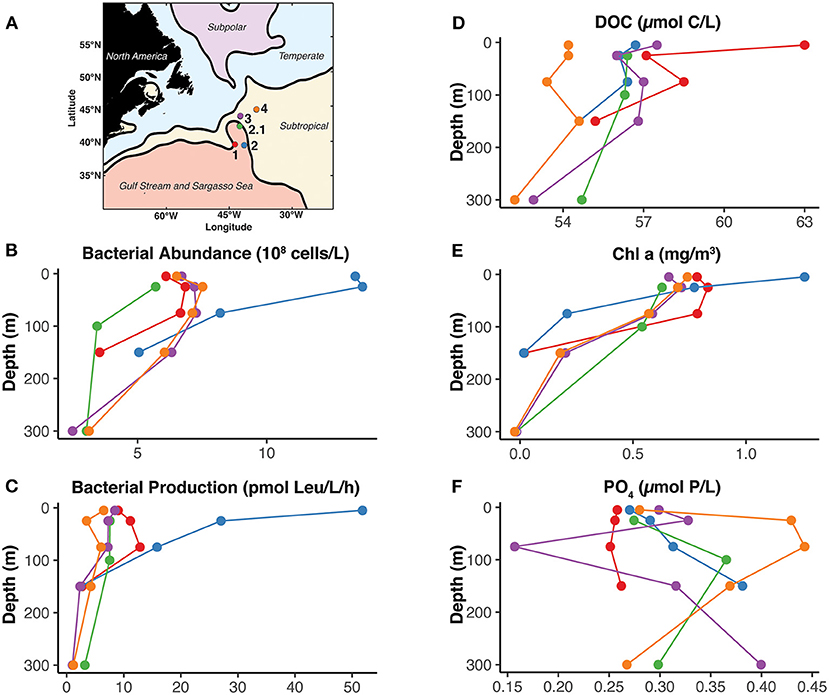
Figure 1. Geographic, chemical, and biological context of the NAAMES4 expedition. (A) The locations of the five stations are shown within the oceanographic regions of the North Atlantic based on mean dynamic topography as defined by Della Penna and Gaube (2019). (B–F) Depth profiles of core biological and chemical parameters from each station. Only depths where TRCs were also collected are shown. The color of the profile corresponds to the color of the station in (A). The full presentation, explanation, and analysis of these data can be found in Baetge et al. (2020).
Environmental data from the NAAMES project are publicly available SeaBASS Ocean Biology DAAC (http://seabass.gsfc.nasa.gov, doi: 10.5067/SeaBASS/NAAMES/DATA001). Chl a and Phosphate samples were collected and processed as described by Mojica et al. (2020). Bacterial abundance, bacterial productivity (leucine incorporation), and dissolved organic carbon (DOC) were collected and processed as described by Baetge et al. (2020). Physical oceanography measurements including mean dynamic topography were analyzed by Della Penna and Gaube (2019).
Thiamin Related Compounds
Dissolved TRC samples were collected as described previously (Suffridge et al., 2017). Briefly, cells and particles were removed from seawater collected from the sampling rosette via gentle peristaltic filtration (30 ml/min) across a 0.22 μm Sterivex filter (PES membrane, Millipore, Burlington, MA, USA). One liter of filtrate was collected in acid-washed, methanol-rinsed amber HDPE bottles (Nalgene). Samples were immediately frozen at −20°C and were shipped frozen to Oregon State University for analysis. Samples were protected from light throughout the process. Only one sample per depth was collected due to limitations on the water budget.
TRCs were extracted from seawater as previously described (Suffridge et al., 2017). Samples were thawed and acidified to pH 6.5 using 1M HCl. TRCs were extracted from the seawater matrix using a solid phase extraction with Bondesil C18 resin (Agilent). Samples were passed over 8 ml of resin at the rate of 1 ml min−1. It was determined that all TRCs were retained on the resin. The resin was then rinsed with LCMS grade water to remove salts, and TRCs were eluted from the column using 12 ml of LCMS grade methanol. The methanol-TRC mixture was evaporated to 250 μl using a blow-down nitrogen drier (Glass Col) providing a six order of magnitude concentration factor between the environmental sample concentration and the concentration analyzed on the LCMS. Samples were then stored at −80°C until LCMS analysis.
A liquid chromatography mass spectrometry (LCMS) method was developed to simultaneously measure TRC concentrations. Analysis was conducted using an Applied Biosystems 4000 Q-Trap triple quadrupole mass spectrometer with an ESI interface coupled to a Shimatzu LC-20AD liquid chromatograph. Applied Biosystems Analyst and ABSciex Multiquant software were used for instrument operation and sample quantification. A Poroshell 120 PFP, 3 × 150 mm 2.7 μm HPLC column (Agilent) with a Poroshell 120 PFP, 2 × 5 mm, 2.7 μm guard column (Agilent) was used for chromatographic separations. The column temperature was isocratic at 40°C. HPLC mobile phases were MS grade water (Fisher) with 0.1% formic acid and MS grade acetonitrile (Fisher) with 0.1% formic acid. A 15-min binary gradient was used with a flow rate of 200 μl min−1 and an initial concentration of 3% acetonitrile ramping to 100% acetonitrile in 7 min and column re-equilibration at 3% acetonitrile for 6 min. A third HPLC pump with a flow rate of 100 μl min−1 acetonitrile (0.1% formic acid) was connected to a mixing tee post column to increase the ionization efficiency as most TRCs elute from the column in the aqueous phase of the gradient. The ESI source used a spray voltage of 5,200 V and a source temperature of 450°C. Curtain gas pressure was set at 30 PSI. The mass spectrometer was run in positive ion mode. Compound specific information including MRM parameters, column retention times, and limits of detection are presented in Table 1. The sample injection volume was 20 μl, and samples were analyzed in triplicate. Samples were indiscriminately randomized prior to analysis. To compensate for matrix effects, 13C-labeled thiamin was used as an internal standard. LCMS analysis was conducted at the Oregon State University Mass Spectrometry Core Facility.
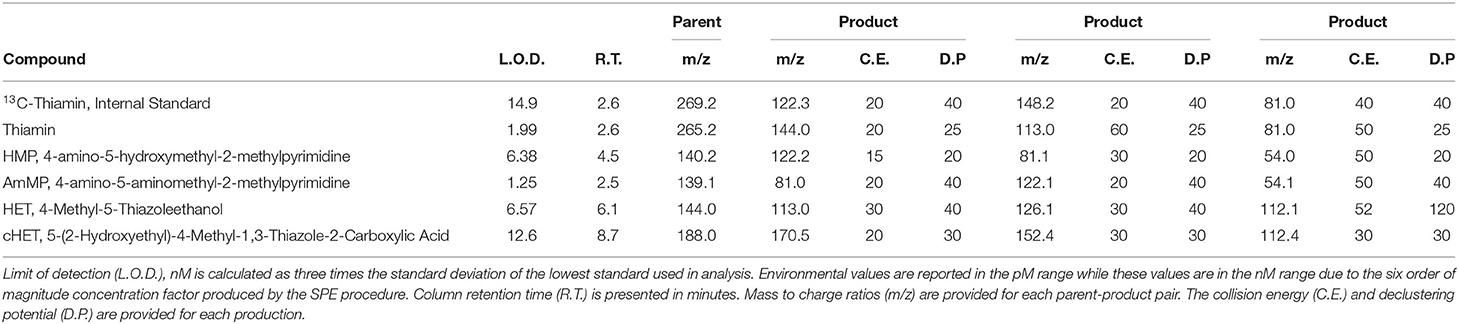
Table 1. Compound specific LCMS parameters.
Data analysis was conducted in the R software environment (R Core Team, 2015). The corrplot package was used for analyzing Spearman's correlations between TRCs and core parameters (Supplementary Figure 1). Data visualization was conducted using the ggplot package (Wickham, 2009) and the and the resulting figures were edited in Adobe Illustrator (Adobe) for aesthetics.
DNA Extraction and Amplicon Sequencing
Microbial biomass was collected on a 0.22 μm pore-size Sterivex filter (PES membrane, Millipore, Burlington, MA, USA) using an eight-channel peristaltic pump (flow-rate 30 ml/min). Filtrate was used for TRC analysis as described above. One milliliter of sucrose lysis buffer was added to the filters and they were stored at −80°C. Nucleic acids were extracted following the phenol:chloroform protocol described in Giovannoni et al. (1996) and Morris et al. (2005). DNA concentration was measured with Quant-iT assays (Invitrogen, Carlsbad, CA) in a Qubit flouromoter (Invitrogen).
Amplification of the V1-V2 region of the 16S rRNA gene was performed using the 27F (5′-AGAGTTTGATCNTGGCTCAG-3) and 338 RPL (5′-GCWGCCWCCCGTAGGWGT-3′) primers attached to their respective Illumina overhang adapters (Vergin et al., 2013; Illumina Inc.). Polymerase Chain Reactions (PCR) conditions and library construction were done following the NAAMES amplicon protocol as described by Bolaños et al. (2020b). Sequencing using the Illumina MiSeq platform (reagent kit v.2; 2X250 Paired-End; Illumina Inc.) was conducted at the Center for Genome Research and Biocomputing at Oregon State University as described previously (Bolaños et al., 2020a,b).
16S rRNA Gene Amplicon Analyses
Primers were trimmed from de-multiplexed fastq files using the CutAdapt software (Martin et al., 2011) removing a fixed number of bases (-u parameter). Trimmed fastq files were quality filtered, dereplicated and merged with dada2 R package, version 1.2 (Callahan et al., 2016). An Amplicon Sequence Variant (ASV) table was constructed as in Bolaños et al. (2020b). Taxonomic assignment of the ASVs was determined using a two-step approach (Bolaños et al., 2020b). First, with the assignTaxonomy command using the silva_nr_v123 dataset in dada2 package. Second, plastid, cyanobacteria, SAR11, and SAR202 ASVs were extracted and phylogenetically placed in curated reference trees (Sudek et al., 2015; Choi et al., 2017; Landry et al., 2017) using Phyloassigner version 089 (Vergin et al., 2013). A phyloseq object containing the station profile samples were constructed. Negative controls were taken from the Sucrose Lysis (SLB) and TE buffers. Only one SLB control sample (N4SLB_neg) generated amplicon results. We analyzed the prevalence of potential contamination ASVs with the decontam package (Davis et al., 2018) and determined that 18 ASVs originated from the negative control, therefore these were removed from the analysis. Bray-curtis dissimilarities were used to generate a constrained ordination (CAP) using Vegan (Oksanen et al., 2007) and Phyloseq (Mcmurdie and Holmes, 2013) packages.
The differential abundance analysis was performed with DESEq2 (Love et al., 2014). Briefly, we categorized samples at each station as low or high for each of the B1 congeners (Figure 5). Outliers were excluded using the non-parametric Numeric Outlier Test. The coefficient used to determine the distribution limits was 3 times the inner quartile range [lower limit = Q1 – (3* IQR), higher limit = Q3 + (3* IQR)]. The average concentration (without outliers) of each compound of all samples was used as threshold to determine whether these were low-concentration (below the average) or high-concentration (above the average). Each TRC was considered as an independent variable. TRC values from all the stations and depths were used to estimate the distribution. For the differential abundance analysis only samples above 75 m (spanning the euphotic zone) were tested. Only ASVs with an alpha (padj) cutoff < 0.01 were selected. Scripts used for these analyses can be found at https://github.com/lbolanos32/NAAMES_2020. Scripts and tables used to generate Figures 4, 5 can be found in Supplementary Table 1 and at https://github.com/lbolanos32/NAAMES_2020/tree/master/VitaminB1.
SAG Analysis
Protein-coding sequences from 31 single amplified genomes (SAGs) of the class of Flavobacteria were obtained from the IMG database (https://img.jgi.doe.gov; Supplementary Tables 2, 3) and were used in protein sequence searches.
Publicly available Flavobacteria SAGs (Supplementary Table 2), obtained from the IMG database, were surveyed for TRC-related biosynthesis and transporter proteins using representative profile-HMMs from the PFAM (v. 28) database. Additionally, HMM profiles built by Paerl et al. (2018a) and deposited in the TEED database (http://www.teed.uni-stuttgart.de) were included in the analysis. Sequence analysis against the tailored TRC-database was performed using HMMER and per-domain output. Hits scoring above trusted cutoffs for profiles were kept, and the highest-scoring, non-overlapping HMMs were assigned to each protein sequence. HMMER predicted domains were compared to gene annotations retrieved from IMG, and congruent assignments were kept (Supplementary Table 4). CheckM was used to estimate the level of genome completeness and contamination of the Flavobacteria SAGs. Two sets of universal marker genes, either specific to Bacteria or Bacteroidetes, were applied.
In addition to ASVs obtained during NAAMES4 cruise (Bolaños et al., 2020a), full-length 16S rRNA gene sequences were extracted from 31 Flavobacteria SAGs (Supplementary Table 2). In addition, 16S rRNA gene sequences were retrieved from the SILVA database (v.138), the North Sea dataset (Alonso et al., 2007) and the coastal North Carolina dataset (D'ambrosio et al., 2014) for multiple sequence alignments using MUSCLE (Edgar, 2004). Near full-length 16S rRNA sequences were trimmed to ~323 bp using Geneious Prime v. 2020.0.5 (https://www.geneious.com). Phylogenetic trees were inferred with the MAFFT software tool using the Neighbor-Joining algorithm. The Jukes-Cantor model was applied to calculate evolutionary distances and the bootstrap values were calculated based on 1,000 replicates.
Results
Oceanographic Distributions of Dissolved Thiamin Related Compounds (TRC)
Concentrations of the five thiamin related compounds (TRCs) [i.e., thiamin (B1), HMP, AmMP, HET, and cHET] were measured in the dissolved phase at five stations during the March 2018 NASA NAAMES4 expedition (Figure 1). All TRCs were detected at each station in the northwestern Atlantic (Table 2). Across all stations and depths dissolved concentrations ranged between femptomolar and picomolar levels [7.35–353 pM B1, 0.09–3.45 pM HMP, 1.76–113.5 pM AmMP, 0.03–30.8 pM HET, and 3.76–145 pM cHET] (Table 2, Figure 2). We observed substantial variability between stations in TRC vertical distributions (Figure 3) and concentration ranges (Figure 2). This is likely a result of the variable physical, chemical, and biological characteristics of each station (Figure 1) (Behrenfeld et al., 2019; Della Penna and Gaube, 2019). This is evident in the substantial range in mixed layer depths across the five stations, ranging from 5.9 m at station 2.1 to 214 m at station 3 (Fox et al., 2020).
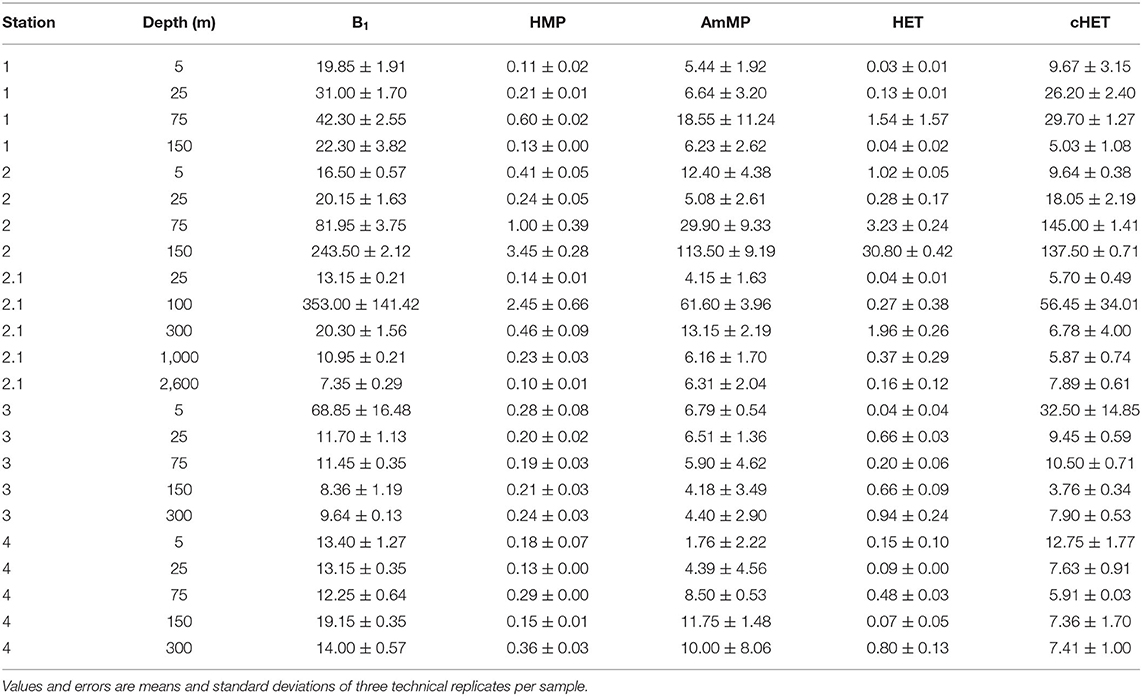
Table 2. Concentrations of dissolved TRCs in picomolar at all stations and depths.
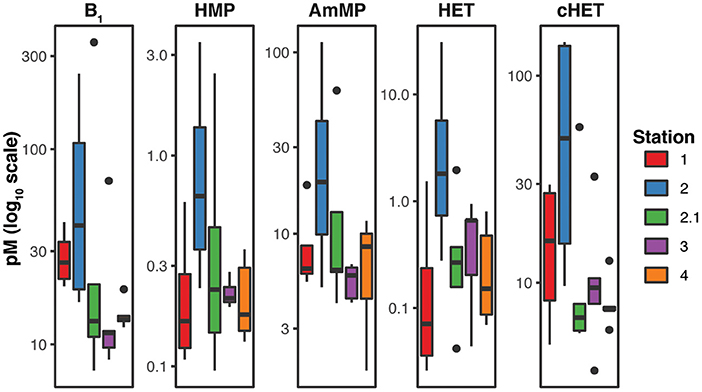
Figure 2. Boxplots of dissolved Thiamin Related Compound (TRC) concentrations at each station show substantial differences in concentration ranges between stations. Picomolar concentrations of each TRC are plotted on a log10 scale. The highest TRC concentrations were observed at station 2.
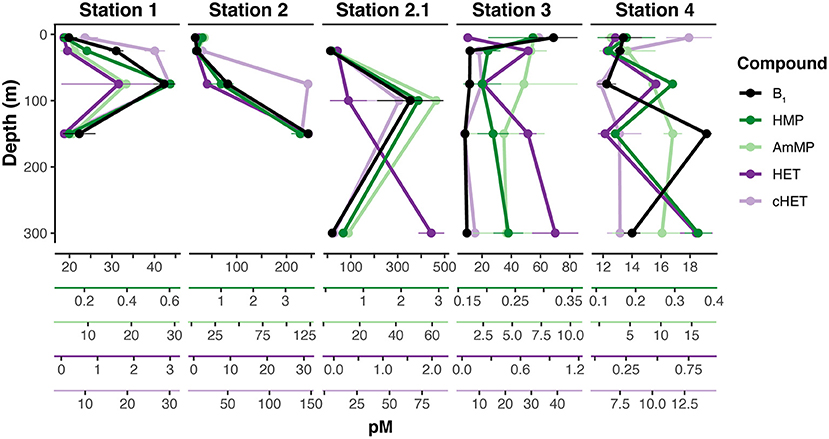
Figure 3. Dissolved Thiamin Related Compound (TRC) depth distributions. Vertical distributions are over-plotted using separate axis to highlight the similarities in TRC distribution trends. Thiamin (B1) is plotted in black, the pyrimidine TRCs (HMP and AmMP) are plotted in shades of green, and the thiazole TRCs (HET and cHET) are plotted in shades of purple. Axis color relates to the color of the depth profile. Points and error bars are means and standard deviations of technical replicates (n = 3).
Vertical distributions of the TRCs were frequently defined by a depletion in the near-surface and deep samples (>150 m) relative to an enrichment at mid-depths (~100 m; Figure 3). For example, all TRCs at station 1 have similar vertical distributions, with low levels near the surface increasing to maximum concentration at 75 m (Figure 3). Median TRC concentrations at station 1 were 26.65 pM for B1, 0.17 pM for HMP, 6.44 pM for AmMP, 0.08 pM for HET, and 17.93 pM for cHET (Figure 2). Bacterial production, bacterial abundance, and chlorophyll a (Chl a) maxima were also at 75 m and profiles of these properties were positively correlated with TRC profiles (Figure 1, Supplementary Figure 1). The mixed layer depth at this station was 80 m, which is concurrent with the TRC and bacterial production max, suggesting that at this station increased metabolic rates cause the rate of TRC accumulation in the dissolved pool to be greater than the rate of mixing near the bottom of the mixed layer.
The highest TRC concentrations observed were at station 2 (the mixed layer depth was 65 m), with median values of 51.05 pM for B1, 0.71 pM for HMP, 21.15 pM for AmMP, 2.12 pM for HET, and 77.78 pM for cHET (Figure 2). At this station, all TRC profiles exhibited similar vertical profiles that remained constant within the mixed layer and then increased from the bottom of the mixed layer to 150 m (Figure 3). In contrast to station 1, strong negative correlations were observed at station 2 between TRC concentrations and bacterial production, bacterial abundance, DOC, and Chl a, all of which were at their highest values for the cruise (Figure 1, Supplementary Figure 1). Furthermore, all TRCs at station 2 were positively correlated with phosphate.
Similar trends in TRC distribution were observed at station 2.1, although the magnitude was substantially lower, with median TRC concentrations of 13.15 pM for B1, 0.23 pM for HMP, 6.30 pM for AmMP, 0.27 for HET, and 6.78 pM for cHET (Figure 2). The depth resolution in the upper 300 m at station 2.1 was less than at station 2, with only three depths sampled (Figure 3). TRC concentrations in two deep samples collected at 1,000 and 2,600 m were similar or lower than the lowest TRC concentrations in the upper 300 m at station 2.1 (Table 2). All TRCs were positively correlated, with minima at 25 and 300 m relative to their maximum concentration at 100 m (Figure 3, Supplementary Figure 1). HET shared 2 m minima with the other TRCs, but had a maximum at 300 m instead of 100 m. The mixed layer depth at this station was 6 m and all TRC samples were collected below that depth. In the upper 300 m, TRC concentrations were strongly positively correlated with phosphate concentrations. All TRCs were weakly negatively correlated with bacterial production, bacterial abundance, Chl a, and DOC.
In contrast to all other stations, a surface enrichment of all TRCs (except HET) was observed at station 3 (Figure 3). Below the observed surface maxima, all TRC concentrations remained low and relatively constant. Median TRC concentrations at station 3 were 11.45 pM for B1, 0.21 pM for HMP, 5.89 pM for AmMP, 0.66 pM for HET, and 9.45 pM for cHET (Figure 2). HET was positively correlated with phosphate and negatively correlated with the other TRCs and biological and chemical parameters (Supplementary Figure 1). HMP was positively correlated with phosphate, weakly negatively correlated with bacterial abundance and Chl a. The other TRCs were negatively correlated with phosphate and positively correlated with bacterial abundance, bacterial production, Chl a, and DOC. The mixed layer depth at station 3 was determined to be 214 m, which is the deepest observed in our sampling.
Station 4 was the only station at which vertical distributions of TRCs were not correlated. Three different patterns in TRC distributions can are seen in Figure 3. The distributions of HET and HMP are strongly positively correlated, exhibiting depletion at 0–25 m relative to maxima at 75 m, minima at 150 m and maxima at 300 m (Figure 3, Supplementary Figure 1). B1 and AmMP are positively correlated and depleted at 0–75 m relative to 150 m and below (Figure 3). cHet is enriched at the surface relative to 75 m (Figure 3). The median TRC concentrations were 13.4 pM for B1, 0.18 pM for HMP, 8.50 pM for AmMP, 0.15 pM for HET, and 7.41 pM for cHET (Figure 2). TRCs except cHET were negatively correlated with bacterial production, bacterial abundance, Chl a, DOC (except B1 which is positively correlated), and phosphate. In contrast, cHET was positively correlated with all core parameters except phosphate, where it was negatively correlated (Figure 1). The mixed layer depth at this station was 128 m, therefore most differences in observed distribution patterns occurred in the mixed layer.
Relationship Between TRCs and Microbial Community Composition
The relationships between TRCs, environmental parameters, and microbial community composition were examined using canonical analysis of principal coordinates (CAP; Figure 4). We generated high-throughput amplicon profiles from the particulate matter collected on the filters used to produce the dissolved TRC samples. Community composition was analyzed to the ASV level to generate highly resolved profiles of bacterioplankton and phytoplankton (cyanobacteria and eukaryotic plastids) (Bolaños et al., 2020a,b). ASV profiles exhibited two main patterns in the constrained ordination. First, clusters of samples corresponding to each station follow a dissimilarity gradient through the first component, which explains most of the variance (39.8%). This organization suggests a difference in community composition of the stations by longitude. Samples from stations 1, 2.1, and 3 grouped together (western group), while stations 2 and 4 (eastern group) are distinct and form individual clusters (Figure 1). The differentiation of stations-clusters along the second axis could be explained by their latitude, as northern stations have a more positive position along the axis than southern stations. Second, community composition in samples above 75 m (spanning the euphotic zone) grouped tightly at all stations except station 2, where the highest observed TRC concentrations and biological parameters were observed (Figures 1, 3). Communities below 75 meters are different from those in the euphotic zone. The community shift at 75 m is mainly explained by the phytoplankton ASVs (eukaryotic plastids and cyanobacteria). Community composition at southern stations was correlated with higher bacterial production, abundance, and fluorescence. Higher phosphate concentrations were associated with the eastern mesopelagic samples, and higher DOC concentrations distinguished the euphotic western samples. TRCs were the variables contributing the least to explain community differences in the linear model. However, TRC concentrations displayed specific associations with elements of community structure, as represented by differences in the arrow directions. This observation suggests that the distinct subsets of organisms within the microbial communities might be responsible for, or responsive to, dissolved TRC concentrations (Figure 4).
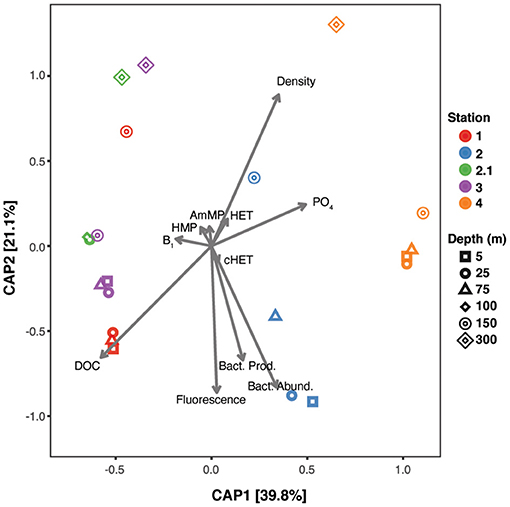
Figure 4. Canonical Analysis of Principle Coordinates (CAP) of 16S rRNA ASV profiles constrained by physical and chemical environmental parameters, including TRC measurements. Ordination was constructed with the Bray–Curtis distances among samples. Shape of the points represent the depth origin of the samples and colors distinguish the station where these were collected. The axis represents the first and second constrained component and the percentages correspond to the fraction of the variance explained under the linear combination of the selected environmental parameters. Arrows show the variance direction of each environmental parameter.
Potential Connections Between TRC Distributions and Microbial Community Composition Through the Water Column
To further investigate the general influence of TRC concentration on microbial community composition throughout the water column, we first categorized the samples that were below the overall mean for each TRC as being “low” and above the mean as “high” (Figure 5). To define these bins the mean (excluding outliers) of each TRC's concentration in all samples across all stations was used as a threshold (22.27 pM B1, 0.28 pM HMP, 10.89 pM AmMP, 0.47 pM HET, and 11.48 pM cHET). At some stations, different congeners had the same covarying high-to-low pattern (Supplementary Figure 1). We tested geometric mean normalized ASVs abundance changes between both conditions at each station for every possible pattern of categorized TRC combinations. The largest number of ASV differences between low and high bins were observed for B1 at stations 1 and 2 (Figure 5, Supplementary Table 1). We did not detect any enrichment in ASV comparisons related to changes in the other TRC concentrations at these stations. Fewer ASVs presented differences in their abundances at station 3 and 4. In station 3, seven ASVs were differentially abundant: three responded to B1, cHET, and HMP covariation while four to HET. At station 4, five ASVs show a differential abundance to HET and AmMP covariation (Supplementary Table 1). Fewer biological signal responses (as ASVs differential abundance) at stations 3 and 4 could be explained by TRC concentrations displaying less variability at these stations through the water column (Figure 2).
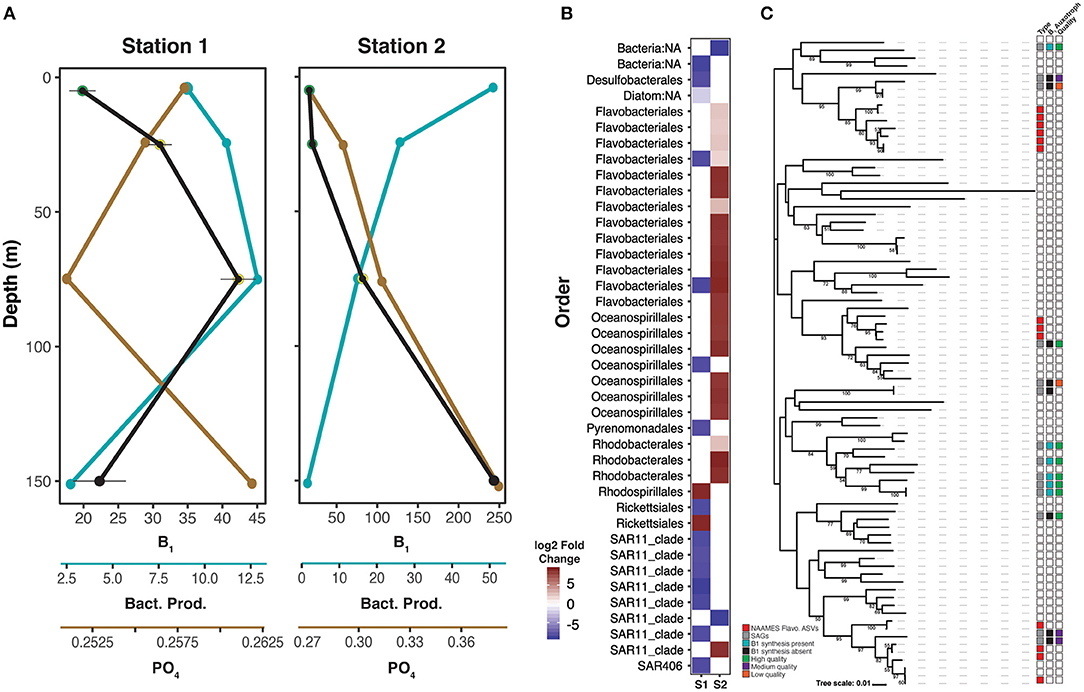
Figure 5. Contrasting oceanographic and microbial dynamics at stations 1 and 2. (A) Depth profiles of dissolved B1 (pM, Black), bacterial production (pmole Leu/L/hr, teal), and phosphate (μM, brown) at stations 1 and 2. (B) Heat map of differentially abundant ASVs at depths with high B1 concentration (yellow halos A) vs. low B1 concentration (green halos A). Red represents positive log2 fold changes, indicating high ASV abundance at depths with low B1 relative to high B1. Blue represents negative log2 fold changes, indicating high ASV abundance at depths with high B1 relative to low B1. ASVs with a differential abundance (log2 fold change larger than 2 and smaller than −2) between high and low concentration B1 samples at stations 1 and 2 are plotted. Only samples above 75 meters were considered for this analysis. Taxonomic assignment of the plotted ASVs are shown in the y axis. Full taxonomic information can be found in Supplementary Table 1. (C) Phylogenetic relationships of 16S rRNA gene sequences from NAAMES4 Flavobacteria ASVs abundant at 5–25 m at station 2 (red squares, type column), publicly available Flavobacteria single cell amplified genomes (SAGs; gray squares, type column), and Bacteroidetes ASVs (white squares, type column) retrieved from coastal North Sea (Alonso et al., 2007), and coastal North Carolina bacterioplankton (D'ambrosio et al., 2014). Publicly available Flavobacteria SAGs (Supplementary Tables 2–4) were queried for evidence of B1 synthesis capacity. Genomes where B1 synthesis capacity was found are labeled with teal squares in the B1 auxotroph column, while black squares indicate putative B1 auxotrophy (Supplementary Table 4). SAG genome quality is indicated in the quality column, with high quality (>90% completeness, <5% contamination) in green, medium quality (>65% completeness, <10% contamination) in purple, and low quality (<65% completeness, contamination <10%) in orange (Supplementary Table 3). All node labels, methods used for analysis, and detailed results are provided in Supplementary Figure 2, Supplementary Tables 2–4.
The relationship of vitamin B1 concentrations with ASVs at stations 1 and 2 contrasted with observations at Stations 3 and 4 (Figure 5). Stations 1 and 2 have a similar B1 vertical distributions between 0 and 75 m, but concentrations at station 2 are roughly double those at station 1 (Figures 2, 3). However, relationships between TRC distributions and both biological (bacterial production, abundance, and Chl a) and chemical (phosphate) parameters are opposite for these two stations (Figure 5). At station 1, we found 17 ASVs displaying differential abundance between low and high samples. Fifteen of these, including an abundant diatom and six SAR11 ASVs were enriched in high B1 samples (25 and 75 m) compared to the low 5 m sample. At station 2, we found 25 ASVs displaying a differential abundance between low and high samples. In contrast to station 1, the section of low B1 concentration (5 and 25 m) was enriched (compared to the 75 m community) mostly by copiotrophic ASVs belonging to Flavobacteriales (13 ASVs), Oceanospirillales (6 ASVs) and Rhodobacterales (3 ASVs).
B1 Auxotrophic and Prototrophic Types of Differentially Abundant ASV Lineages
Given the predominance of Flavobacteria and other copiotrophs in the surface B1 depleted water at station 2 (Figure 5), we further investigated their potential B1 auxotropy status to determine if they had a requirement for TRCs. To this end we searched available databases and identified 31 SAGs (Supplementary Table 2) of the class Flavobacteria and surveyed key enzymes involved in the de novo pathway to synthesize vitamin B1 (dxs, thiH, thiD, thiC, thiE, (thiN, TPK1, THI80), thiG, and thiL; Supplementary Table 4). A total of 6 high-quality SAGs (genome completion >90%) were putative B1 prototrophs, encoding all key enzymes for de novo B1 synthesis (thiC, thiE, and thiG). One SAG (Flavobacterium sp. SG815) lacked thiC and thiG, but possessed thiE and thiD which may indicate dual B1 auxotrophy and a reliance on exogenous sources of pyrimidine and thiazole precursors. Further evidence of B1 auxotrophy in Flavobacteria was revealed by surveying two high-quality SAGs (SAT105, SCGC AAA160-P02), lacking all core B1-biosynthesis genes. Depending on the marker gene set, genome completeness estimates of the selected SAGs varied between 34–72% (Bacteria) and 21–72% (Bacteroidetes), respectively, depending on the marker gene set (Figure 5, Supplementary Table 3). The remaining medium and low-quality SAGs, with an estimated genome completeness of 23–35%, did not encode core B1- biosynthesis genes, however remain inconclusive with respect to their B1 demands due to their incomplete nature (Figure 5, Supplementary Table 3).
We next searched for connections between the SAG genomes analyzed for pathway completeness and prominent ASVs in our community profiles (Figure 5). Specifically, to address whether Flavobacteria recovered at station 2 are more related to B1 auxotrophs or prototrophs, we constructed a reference tree of recovered NAAMES ASVs and 16S rRNA gene sequences obtained from Flavobacteria SAGs, the North Sea dataset (Alonso et al., 2007), and the coastal North Carolina dataset (D'ambrosio et al., 2014). ASVs from station 2 affiliated with uncultured marine clades NS2(b), NS4 (as defined by Alonso et al., 2007), and “Uncultured Atlantic Ocean Flavobacteria” (Figure 5, Supplementary Figure 2). Reference SAGs that clustered together with these marine clades either encoded thiL (AAA536-G18, AG-487_A19) or did not contain any of the B1 core synthesis enzymes (JGI 02_I17, AG-485_N06). Notably, 16S rRNA gene sequences of putative B1 prototrophic SAGs clustered together with NS3b and NS5 marine clades of Flavobacteria (Figure 5). It is important to note that only one SAG that lacked core B1 synthesis enzymes is rated as high quality, with the rest rated as medium and low quality (Figure 5). Therefore, while these finding suggest that SAGs clustering with NAAMES amplicons lack B1 synthesis capacity, these results are not conclusive. Despite these limitations these findings provide a plausible hypothesis for the depletion of B1 by abundant Flavobacteria in the near surface at station 2.
Discussion
The dynamic and variable oceanographic conditions encountered across the NAAMES4 transect provided a unique opportunity to study how TRC availability influences microbial interactions and thus community structure. The north Atlantic spring bloom is the largest annually reoccurring phytoplankton bloom on earth. The NAAMES4 expedition was planned to study the accumulation phase of Disturbance Recovery Hypothesis (DRH) for spring bloom formation (Behrenfeld et al., 2019). In the DRH, the accumulation phase is described as the period between the end of convective winter mixing and the bloom climax, when phytoplankton growth accelerates (division rates outpace loss rates) and mixed layer shoaling and increased sunlight cause phytoplankton populations to increase (Behrenfeld and Boss, 2014, 2018). During the period of biomass accumulation when we made observations, mean depth-integrated phytoplankton division rates and net primary production for the surface mixed layer were 0.46 ± 0.26 d−1 and 920 ± 405 mg C m−2d−1, respectively (Fox et al., 2020). The NAAMES project used a latitudinal transect to capture different periods of the phytoplankton annual cycle during a single cruise due to the delay of seasonal change with increasing latitude (Figure 1) (Behrenfeld et al., 2019). Thus, this cruise covered a wide area of the subtropical north Atlantic Ocean capturing biological and physical variability during the accumulation phase bloom progression (Behrenfeld et al., 2019).
Vitamin B1 and related TRCs provide a seemingly excellent example of compounds that are trafficked among microorganisms and have the potential to be underlying causes of correlations that are used to build plankton network models. B1 is universally required for catabolic and anabolic carbon metabolism, yet the majority of phytoplankton and bacterioplankton are unable to synthesize this coenzyme de novo, and require an exogenous source of one or more TRCs to grow (Jurgenson et al., 2009; Sañudo-Wilhelmy et al., 2014; Gómez-Consarnau et al., 2018; Paerl et al., 2018b). Variation in TRC requirements among taxa, which in many cases can be estimated with reasonable accuracy from genomic data, has the potential to shape the structures of microbial communities.
Oceanographic Distributions of Dissolved Thiamin Related Compounds (TRC)
Oceanographic distributions of dissolved AmMP, cHET, and HET have never before been reported, and the full suite of TRCs has never before been directly and simultaneously measured in the ocean. Here we observed that concentrations in these compounds ranged from femptomolar to picomolar, with values of 7.35–353 pM for B1, 0.09–3.45 pM for HMP, 1.76–113.5 pM for AmMP, 0.03–30.8 pM for HET, and 3.76–145 pM for cHET (Table 2). For our thiamin (B1) observations, we found an inter quartile range (IQR) concentrations of 12.0–26.7 pM and a median concentration of 16.5 pM (Table 2). These values are consistent with previous observations. Specifically, of the ca. 300 discrete dissolved B1 measurements reported for the ocean, the IQR is 17.4–81.1 pM with a median of 33.9 pM (Carlucci, 1970; Carlucci and Bowes, 1972; Okbamichael and Sañudo-Wilhelmy, 2005; Koch et al., 2012, 2013; Sañudo-Wilhelmy et al., 2012, 2014; Carini et al., 2014; Heal et al., 2014; Monteverde et al., 2015; Suffridge et al., 2017, 2018). The concentration ranges that we observed for HMP, IQR 0.16–0.39 pM, are lower than the previously observed concentrations of HMP (IQR 1.53–7.02 pM). However, only about 60 discrete measurements have been reported for dissolved HMP in the ocean and all of them come from oligotrophic regions (Carini et al., 2014; Suffridge et al., 2017, 2018). Our maximum observed HMP concentration (3.4 pM) approaches the median of 2.8 pM for previously reported concentrations (Carini et al., 2014; Suffridge et al., 2017, 2018). The current study provides the first TRC samples collected during the accumulation phase of the north Atlantic spring bloom (Behrenfeld et al., 2019). We hypothesize that the low observed HMP concentrations are a result of increased microbial demand for this valuable and broadly required TRC during a period of intense microbial activity.
The depth distributions of TRCs shared similar patterns between stations despite substantial differences in concentration ranges (Figures 2, 3). The profiles were generally depleted near the surface relative to a maximum at 100 m (Figure 3). We observed this trend at all stations except station 3 and station 4-cHET, where a surface enrichment was observed (Figure 3). Stations 3 and 4 were the northernmost stations and the only stations located in the subtropical oceanographic region (Della Penna and Gaube, 2019) (Figure 1). The observed mid-depth maximum was often coincident with subsurface Chl a maxima (Figure 1). TRC concentrations generally decreased below the ~100 m maxima and no increases in TRC concentration were observed below 300 m in the two deep samples taken at station 2.1 (1,000 and 2,600 m; Table 2). The general trend of surface depletion relative to a maximum near the bottom of the euphotic zone and low concentrations at deeper depths is similar to previously reported trends in other oceanographic regions for B1 and HMP, suggesting a potential global distribution pattern for TRCs (Sañudo-Wilhelmy et al., 2012; Carini et al., 2014; Suffridge et al., 2017, 2018).
Relationship Between TRCs and Environmental Parameters
Despite the similarity in TRC distribution patterns across the transect, the relationships between TRC distributions and bacterial abundance, bacterial production, Chl a, DOC, and phosphate distributions were not universal across all stations (Supplementary Figure 1). For example, stations 1 and 2 share similar TRC patterns (Figure 3), but at station 1 bacterial abundance, bacterial production, and Chl a are positively correlated with TRCs while at station 2 these same parameters are negatively correlated with TRCs (Figure 5, Supplementary Figure 1). Similarly, TRCs and phosphate are negatively correlated at station 1, but are positively correlated at station 2. The magnitude of both TRCs and these core parameters were substantially greater at station 2 than station 1 (Figure 1), suggesting that greater biological activity causes different relationships between TRCs and core parameters. Varying relationships between TRCs and the biological and chemical parameters were observed at all stations that were either similar to station 1 (e.g., stations 2.1, 3, and 4-cHET) or station 2 (e.g., station 3-HET and 3-HMP, station 4 all but cHET) (Supplementary Figure 1).
The observations above indicate that, on the scale of the transect, TRC concentrations are decoupled from our measured core biological and chemical parameters. However, relationships between TRC distributions and core biological and chemical parameters are robust at the local scale of each individual station. In other words, while TRC distribution patterns remained similar, their relationship with biological and chemical parameters varied between stations (Figures 1, 3, 5). These observations led us to hypothesize that differences in the microbial community composition between stations are responsible for the TRC distributions patterns and their relationships with biological and chemical parameters.
Relationship Between TRCs and Microbial Community Composition
Canonical analysis of principal coordinates (CAP) indicated that the microbial ASV profiles of relatively abundant taxa found at each station are distinct between stations near the surface (5–75 m) and have some overlaps below the euphotic zone (Figure 4). We investigated the relationship between 16S rRNA ASV (including bacterioplankton, cyanobacteria, and eukaryotic plastids) based microbial community diversity (Bolaños et al., 2020a), TRC concentrations, and environmental parameters. These data were all collected in parallel on the NAAMES4 expedition to determine if differences in TRC concentrations created differences in the microbial community. Our analysis showed that microbial communities from the upper 100 m cluster closely by station. The individual station clusters ordinated into two larger groups along the first component (stations 1, 2.1, 3 vs. stations 2,4). This clustering matched the correlative relationships between TRCs and biological and chemical parameters described above (Figure 4). These observations support the interpretation that variation in the composition of the planktonic microbial communities is contributing to the observed correlations between TRC concentrations, macronutrient concentrations, and the biological status of blooms.
Having found evidence for a link between community composition and TRC concentrations, we asked whether there was evidence in genome data that could support linking B1 metabolic strategies to TRC concentrations. We identified ASVs that were differentially abundant in samples with high and low B1 concentrations (i.e., ASV's representing taxa that could explain the relationships observed in the CAP analysis). TRC concentrations were binned into “high” and “low” groups relative to the mean TRC concentration at each station. A fully factorial analysis was conducted analyzing all combinations of TRCs and ASVs. Only B1 at stations 1 and 2 display differences in the abundance of specific ASVs (Figure 5). The CAP analysis also indicated a strong differentiation between microbial communities at these two stations. The combined results from these two analyses thus suggest that B1 concentrations is an important contributor to the observed differences (Figure 4).
Stations 1 and 2 Have Contrasting Relationships Between TRCs and the Microbial Community
At station 1, oligotrophs, including SAR11, were more abundant at 25 m and 75 m (where B1 concentrations were elevated) than at 5 m (where B1 concentrations were low) (Figure 5). Conversely, at station 2, copiotrophic Flavobacteria were more abundant between the surface and 25 m (where B1 concentrations were low) than at deeper depths (Figure 5). It is worth noting that the lowest B1 concentrations at station 2 are roughly equivalent to the highest B1 concentrations at station 1, and the highest B1 concentrations at station 2 are about 5 times the highest B1 at station 1 (Figure 5). At station 1 the concentration gradient of B1 did not appear to be related to a complex restructuring of the microbial community, since only a few ASVs responded to changes in B1 concentration (Figure 5). In contrast, the number of responding ASVs in the first 25 m of station 2, their taxonomic affiliation, and the high concentrations of B1 at 75 m and below, showed how TRC availability might modify communities (Figure 5).
Station 1 and 2 are located in similar physical settings, which allowed us to search for relationships between TRC concentrations and microbial community structure. Both stations are located at nearly the same latitude and in the same oceanographic region (Figure 1) (Behrenfeld et al., 2019). Mixed layer depths were similar at station 1 and 2 (80 and 65 m, respectively), yet despite this similar physical setting our multivariant analysis and differential ASV community diversity analysis indicated potentially contrasting TRC acquisition strategies at these two sites (Figures 4, 5).
Station 1 was moderately oligotrophic, with magnitudes of TRCs, biological, and chemical parameters lower than station 2. At station 1 relationships between TRCs and other measurements was inverse to those at station 2. Specifically, TRC distributions were positively correlated with indicators of growth and biomass and were negatively correlated to phosphate (Figure 5), with depth integrated (0–150 m) phosphate being the lowest observed across the transect (Figure 1). The tight coupling between TRC concentrations and biological activity at station 1, in conjunction with bacterial production values 5-fold below those at station 2, suggests that rates of microbial TRC production and consumption are linked to microbial metabolic rates in oligotrophic environments.
The conditions encountered at station 2 were consistent with the accumulation phase of the Disturbance Recovery Hypothesis; the highest observed TRC concentrations, bacterial production, Chl a, and bacterial abundance were present (Behrenfeld et al., 2019). At this station, TRCs had nutrient-like distributions and were negatively correlated with biomass (Figure 5). Moreover, phosphate and TRC concentrations were low at the surface and increased with depth, whereas other biological parameters were maximal near surface and decreased with depth. The accumulation phase of the spring bloom is characterized by a period of enhanced growth, as we observed (Behrenfeld and Boss, 2014, 2018). Concomitant with maximum bacterial production, we observed lower concentrations of phosphate and TRCs in the upper 25 m and an abundance of ASVs corresponding to copiotrophic and fast growing bacterial lineages (Figure 5) (Kirchman, 2002; Pinhassi et al., 2004). Among these responding bacteria, Flavobacteria were the most represented taxa. This observation may suggest that uptake of B1 by Flavobacteria influenced the vertical structure of B1 concentrations observed within the mixed layer at this station.
Subsequent comparative genomic analyses revealed that the Flavobacteria ASVs that were highly abundant at 5 m and 25 m at station 2 are potentially B1 auxotrophs, supporting our above hypothesis (Figure 5). Previous genome surveys have indicated that some Flavobacteria taxa are B1 auxotrophs, and in some cases may utilize proteorhodopsin derived energy to acquire vitamin B1 from the dissolved pool (Sañudo-Wilhelmy et al., 2014; Gómez-Consarnau et al., 2016, 2018). Unfortunately, B1 auxotrophy is paraphyletic, meaning that ASV data must be paired with genomic data to accurately determine vitamin B1 auxotrophy. In order to determine the putative B1 synthesis/auxotrophy status of the differentially abundant NAAMES flavobacteria ASVs at station 2, we conducted a phylogenetic reconstruction using these ASVs, publicly available SAGs, and flavobacteria ASV sequences from the literature (Alonso et al., 2007; D'ambrosio et al., 2014). The resulting tree indicated that the NAAMES ASVs clustered into three distinct clades, and each of these clades included at least one closely related SAG for genome comparison (Figure 5). The phylogenetic placement of the NAAMES flavobacteria ASVs is consistent with previous research that has indicated that there is a high degree of niche specialization amongst these organisms (Diez-Vives et al., 2019). The SAGs were then queried for B1 synthesis capacity. It was determined that the SAGs that cluster closest with the NAAMES ASVs lacked evidence of B1 synthesis capacity, while evidence for B1 synthesis capacity was found in those that were more phylogenetically distant (Figure 5). These results suggest that the NAAMES ASVs are putative vitamin B1 auxotrophs, capable of depleting dissolved vitamin B1 from the depths where they were abundant at station 2. However, it is important to note that the SAGs where B1 synthesis was not found are generally of lower quality (completeness and contamination) than those where evidence for B1 synthesis was found (Figure 5). While there are substantial limitations to this analysis (e.g., absence of evidence is not evidence of absence), our data suggests that vitamin B1 uptake by auxotrophic flavobacteria is responsible for the depletion of B1 at 5–25 m relative to 75 m at station 2.
TRC Cycling Mediates Microbial Interactions: A Hypothetical Framework
While it is clear from cell biology and comparative genomics that TRCs are essential to the growth of many planktonic taxa, there is no clear framework for understanding how TRC cycling impacts community structure in the ocean. The data presented in this study is the most complete analysis of oceanographic TRC distribution, and its relationship with the microbial community to date. Although we consider this new information about of TRC cycling to be the beginning of the exploration of an important and complex process, based on this data we propose a hypothetical framework that could explain observations from this study. It is known that under non-bloom conditions when net plankton community production is low (as indicated by lower bacterial production, bacterial abundance, and Chl a), microbial community structure is relatively stable and diversity is relatively high (Fuhrman et al., 2006, 2015; Tai and Palenik, 2009; Teeling et al., 2012; Chow et al., 2013; Cram et al., 2015; Needham and Fuhrman, 2016). We hypothesize that under these conditions, TRC concentrations approach a steady state where production and consumption terms are balanced, and the standing stock of TRCs is positively correlated with bacterial productivity as seen at station 1 (Figure 5). In contrast, community stability is disrupted during a bloom, with the microbial community shifting toward dominance by a single group or consortia of species resulting in elevated microbial biomass and metabolic activity (Teeling et al., 2012; Behrenfeld and Boss, 2018; Bolaños et al., 2020b; Kramer and Graff, 2020; Yang et al., 2020). We hypothesize that during bloom conditions, such as those observed at station 2, TRC production and consumption terms become unbalanced and, depending on the TRC auxotrophy status of the blooming organisms, TRC demand could outpace production, and result in TRC drawdown (Figure 5). Conversely, TRC production could outpace demand leading to accumulation. It is also likely that as community succession occurs during a bloom (e.g., Teeling et al., 2012; Bolaños et al., 2020b) and one dominant species is replaced by another, relative rates of TRC production and consumption could flip. Therefore, we hypothesize that TRC production outpaced demand prior to our occupation and sampling of station 2, resulting in a surplus of dissolved TRC as indicated by increasing TRC concentrations with depth at station 2 (Figure 5). Subsequently, TRC auxotrophic Flavobacteria bloomed at 5 and 25 m resulting in TRC demand outpacing production, and ultimately TRC depletion at these depths (Figure 5). Future time series research will be required to validate these assumption-based hypotheses, but we believe the above hypothesis are consistent with the single timepoint observations from stations 1 and 2.
These environmental observations showing differential relationships between microbial groups and TRC availability support findings from cell culture studies and metagenomic surveys that demonstrate a mixture of TRC auxotrophy types are abundant in marine systems (Carini et al., 2014; McRose et al., 2014; Paerl et al., 2016, 2018a,b; Gutowska et al., 2017). Marine microbial community composition depends on multiple temporally dynamic variables, making it risky to use temporally discrete sampling to dissect the impact of multiple variables. However, the relationships we report support a plausible framework of hypotheses about the TRC impacts on communities.
Data Availability Statement
The complete TRC dataset is presented in Table 2. Other datasets presented in this study can be found in online repositories. The names of the repository/repositories and accession number(s) can be found below: SeaWiFS Bio-optical Archive and Storage System (SeaBASS, seabass.gsfc.nasa.gov/investigator/Giovannoni,%20Stephen) as associated files, NCBI BioProject - PRJNA627189 (accession numbers SRR11596939 to SRR11596981).
Author Contributions
Project was planned by CS, SG, MB, AW, and LB. Samples were collected by LB and MB. Sample analysis was conducted by CS, LB, and JM. Data analysis was conducted by CS, LB, JM, and KB. The manuscript was written by CS and edited by LB, KB, AW, JM, MB, and SG. All authors contributed to the article and approved the submitted version.
Funding
This work was funded by the National Science Foundation Dimensions Collaborative Research grant: Unraveling thiamin cycling complexity and impacts on microbial networks to SG (DEB-1639033) and AW (DEB-1638928). Support for ship operations, sample collection, and core parameter analysis was provided by the NASA NAAMES Program grant to SG (NNX15AE70G) and to MB (NNX15AE30G). Mass spectrometry instrumentation was supported by NIH grant 1S10RR022589-01.
Conflict of Interest
The authors declare that the research was conducted in the absence of any commercial or financial relationships that could be construed as a potential conflict of interest.
Acknowledgments
We thank Elizabeth Brennan, Stephen Noell, Sarah Wolf, and Veronika Kivenson for their helpful comments during the writing and editing of this manuscript. We thank Mark Dasenko and Oregon State University CGRB for amplicon library preparation and sequencing. We thank the Captain and Crew R/V Atlantis for their assistance in sample collection. We thank the NAAMES community for their support.
Supplementary Material
The Supplementary Material for this article can be found online at: https://www.frontiersin.org/articles/10.3389/fmars.2020.606342/full#supplementary-material
Supplementary Figure 1. Spearman's correlations between TRC concentrations and core biological, chemical, and physical parameters at each station. Spearman's correlation matrices were calculated for these parameters at depths where TRC samples were collected. The strength and magnitude of the correlation (Spearman's rho) is depicted using color. Statistical significance was not assessed due to the low sample number. Parameters were ordered using hierarchical clustering.
Supplementary Figure 2. Phylogenetic context of NAAMES flavobacteria suggest B1 auxotrophy. This is the fully annotated version of Figure 5. Phylogenetic relationships of 16S rRNA gene sequences retrieved from NAAMES4 expedition abundant at 5-25 m at station 2 labeled in red, and reference sequences from the coastal North Sea (Alonso et al., 2007) and coastal North Carolina (D'ambrosio et al., 2014) labeled in black. Single amplified genomes are highlighted in green. Single amplified genomes encoding for thiC (putative vitamin B1 auxotrophs) are denoted with a star (Supplementary Table 3). The phylogenetic tree was calculated using MAFFT software tool, Method Neighbor-Joining, Jukes-Cantor Model, Bootstrap resampling 100. Full-length sequences were trimmed to NAAMES ASVs (330 bp).
Supplementary Table 1. Significant differentially abundant ASVs in low and high TRC concentrations at each station. ASVs underlying statistics of figure HEAT are presented accompanied by the complete taxonomic assignment. A threshold of P adjusted <0.01 was set to determine a Log2foldchange > |2| as a significant change.
Supplementary Table 2. Publicly available Flavobacteria single amplified genomes obtained from the IMG database that were surveyed for TRC-related biosynthesis and transporter proteins.
Supplementary Table 3. Flavobacteria SAG Genome completeness.
Supplementary Table 4. Key enzymes for the de novo pathway to synthesize vitamin B1 determined to be present in Flavobacteria SAGs by HMMER analysis.
References
Alonso, C., Warnecke, F., Amann, R., and Pernthaler, J. (2007). High local and global diversity of Flavobacteria in marine plankton. Environ. Microbiol. 9, 1253–1266. doi: 10.1111/j.1462-2920.2007.01244.x
Atilho, R. M., Arachchilage, G. M., Greenlee, E. B., Knecht, K. M., and Breaker, R. R. (2019). A bacterial riboswitch class for the thiamin precursor HMP-PP employs a terminator-embedded aptamer. Elife 8:e45210. doi: 10.7554/eLife.45210.020
Baetge, N., Graff, J. R., Behrenfeld, M. J., and Carlson, C. A. (2020). Net community production, dissolved organic carbon accumulation, and vertical export in the Western North Atlantic. Front. Marine Sci. 7:227. doi: 10.3389/fmars.2020.00227
Begley, T. P., Downs, D. M., Ealick, S. E., Mclafferty, F. W., van Loon, A., Taylor, S., et al. (1999). Thiamin biosynthesis in prokaryotes. Arch. Microbiol. 171, 293–300. doi: 10.1007/s002030050713
Behrenfeld, M. J., and Boss, E. S. (2014). Resurrecting the ecological underpinnings of ocean plankton blooms. Ann. Rev. Mar. Sci. 6, 167–194. doi: 10.1146/annurev-marine-052913-021325
Behrenfeld, M. J., and Boss, E. S. (2018). Student's tutorial on bloom hypotheses in the context of phytoplankton annual cycles. Glob. Chang. Biol. 24, 55–77. doi: 10.1111/gcb.13858
Behrenfeld, M. J., Moore, R. H., Hostetler, C. A., Graff, J., Gaube, P., Russell, L. M., et al. (2019). The North Atlantic aerosol and marine ecosystem study (NAAMES): science motive and mission overview. Front. Marine Sci. 6:122. doi: 10.3389/fmars.2019.00122
Bolaños, L. M., Choi, C. J., Worden, A. Z., Beate, N., Carlson, C. A., and Giovannoni, S. J. (2020a). Seasonality of the microbial community composition in the North Atlantic. Front. Marine Sci. (under review).
Bolaños, L. M., Karp-Boss, L., Choi, C. J., Worden, A. Z., Graff, J. R., Haentjens, N., et al. (2020b). Small phytoplankton dominate western North Atlantic biomass. ISME J. 14, 1663–1674. doi: 10.1038/s41396-020-0636-0
Callahan, B. J., Mcmurdie, P. J., Rosen, M. J., Han, A. W., Johnson, A. J., and Holmes, S. P. (2016). DADA2: high-resolution sample inference from Illumina amplicon data. Nat. Methods 13, 581–583. doi: 10.1038/nmeth.3869
Carini, P., Campbel, E. O., Morre, J., Sanudo-Wilhelmy, S. A., Thrash, J. C., Bennett, S. E., et al. (2014). Discovery of a SAR11 growth requirement for thiamin's pyrimidine precursor and its distribution in the Sargasso Sea. ISME J. 8, 1727–1738. doi: 10.1038/ismej.2014.61
Carlucci, A. F. (1970). The ecology of the plankton off La Jolla, California, in the period April through September, 1967. Part 2. Vitamin B, thiamine, and biotin. Bull. Scripps Instn Oceanogr. Tech. Ser. 17, 23–32.
Carlucci, A. F., and Bowes, P. M. (1972). Determination of Vitamin-B12, Thiamine, and biotin in lake-tahoe waters using modified marine bioassay techniques. Limnol. Oceanogr. 17, 774–777. doi: 10.4319/lo.1972.17.5.0774
Carlucci, A. F., Silbernagel, S. B., and Mcnally, P. M. (1969). Influence of temperature and solar radiation on persistence of vitamin B12, thiamine, and biotin in seawater. J. Phycol. 5, 302–305. doi: 10.1111/j.1529-8817.1969.tb02618.x
Chatterjee, A., Jurgenson, C. T., Schroeder, F. C., Ealick, S. E., and Begley, T. P. (2006). Thiamin biosynthesis in eukaryotes: characterization of the enzyme-bound product of thiazole synthase from Saccharomyces c erevisiae and its implications in Thiazole biosynthesis. J. Am. Chem. Soc. 128, 7158–7159. doi: 10.1021/ja061413o
Choi, C. J., Bachy, C., Jaeger, G. S., Poirier, C., Sudek, L., Sarma, V., et al. (2017). Newly discovered deep-branching marine plastid lineages are numerically rare but globally distributed. Curr. Biol. 27, R15–R16. doi: 10.1016/j.cub.2016.11.032
Chow, C. E. T., Sachdeva, R., Cram, J. A., Steele, J. A., Needham, D. M., Patel, A., et al. (2013). Temporal variability and coherence of euphotic zone bacterial communities over a decade in the Southern California Bight. ISME J. 7, 2259–2273. doi: 10.1038/ismej.2013.122
Cram, J. A., Chow, C. E., Sachdeva, R., Needham, D. M., Parada, A. E., Steele, J. A., et al. (2015). Seasonal and interannual variability of the marine bacterioplankton community throughout the water column over ten years. ISME J. 9, 563–580. doi: 10.1038/ismej.2014.153
Croft, M. T., Moulin, M., Webb, M. E., and Smith, A. G. (2007). Thiamine biosynthesis in algae is regulated by riboswitches. Proc. Natl. Acad. Sci. U.S.A. 104, 20770–20775. doi: 10.1073/pnas.0705786105
D'ambrosio, L., Ziervogel, K., Macgregor, B., Teske, A., and Arnosti, C. (2014). Composition and enzymatic function of particle-associated and free-living bacteria: a coastal/offshore comparison. ISME J. 8, 2167–2179. doi: 10.1038/ismej.2014.67
Davis, N. M., Proctor, D. M., Holmes, S. P., Relman, D. A., and Callahan, B. J. (2018). Simple statistical identification and removal of contaminant sequences in marker-gene and metagenomics data. Microbiome 6:226. doi: 10.1186/s40168-018-0605-2
Della Penna, A., and Gaube, P. (2019). Overview of (Sub)mesoscale ocean dynamics for the NAAMES field program. Front. Marine Sci. 6:384. doi: 10.3389/fmars.2019.00384
Diez-Vives, C., Nielsen, S., Sanchez, P., Palenzuela, O., Ferrera, I., Sebastian, M., et al. (2019). Delineation of ecologically distinct units of marine Bacteroidetes in the Northwestern Mediterranean Sea. Mol. Ecol. 28, 2846–2859. doi: 10.1111/mec.15068
Donovan, P. D., Holland, L. M., Lombardi, L., Coughlan, A. Y., Higgins, D. G., Wolfe, K. H., et al. (2018). TPP riboswitch-dependent regulation of an ancient thiamin transporter in Candida. PLoS Genet. 14:e1007429. doi: 10.1371/journal.pgen.1007429
Edgar, R. C. (2004). MUSCLE: a multiple sequence alignment method with reduced time and space complexity. BMC Bioinformatics 5:113. doi: 10.1186/1471-2105-5-113
Fox, J., Behrenfeld, M. J., Haëntjens, N., Chase, A., Kramer, S. J., Boss, E., et al. (2020). Phytoplankton growth and productivity in the Western North Atlantic: observations of regional variability from the NAAMES field campaigns. Front. Marine Sci. 7:24. doi: 10.3389/fmars.2020.00024
Fuhrman, J. A., Cram, J. A., and Needham, D. M. (2015). Marine microbial community dynamics and their ecological interpretation. Nat. Rev. Microbiol. 13, 133–146. doi: 10.1038/nrmicro3417
Fuhrman, J. A., Hewson, I., Schwalbach, M. S., Steele, J. A., Brown, M. V., and Naeem, S. (2006). Annually reoccurring bacterial communities are predictable from ocean conditions. Proc. Natl. Acad. Sci. U.S.A. 103, 13104–13109. doi: 10.1073/pnas.0602399103
Giovannoni, S. J., Rappé, M. S., Vergin, K. L., and Adair, N. L. (1996). 16S rRNA genes reveal stratified open ocean bacterioplankton populations related to the green non-sulfur bacteria. Proc. Natl. Acad. Sci. U.S.A. 93, 7979–7984. doi: 10.1073/pnas.93.15.7979
Gold, K., Roels, O. A., and Bank, H. (1966). Temperature dependent destruction of thiamine in seawater. Limnol. Oceanogr. 11, 410–413. doi: 10.4319/lo.1966.11.3.0410
Gómez-Consarnau, L., Gonzalez, J. M., Riedel, T., Jaenicke, S., Wagner-Dobler, I., Sañudo-Wilhelmy, S. A., et al. (2016). Proteorhodopsin light-enhanced growth linked to vitamin-B acquisition in marine Flavobacteria. ISME J. 10, 1102–1112. doi: 10.1038/ismej.2015.196
Gómez-Consarnau, L., Sachdeva, R., Gifford, S. M., Cutter, L. S., Fuhrman, J. A., Sañudo-Wilhelmy, S. A., et al. (2018). Mosaic patterns of B-vitamin synthesis and utilization in a natural marine microbial community. Environ. Microbiol. 20, 2809–2823. doi: 10.1111/1462-2920.14133
Gutowska, M. A., Shome, B., Sudek, S., McRose, D. L., Hamilton, M., Giovannoni, S. J., et al. (2017). Globally Important haptophyte algae use exogenous pyrimidine compounds more efficiently than Thiamin. MBio 8, e01459–e01417. doi: 10.1128/mBio.01459-17
Heal, K. R., Carlson, L. T., Devol, A. H., Armbrust, E., Moffett, J. W., Stahl, D. A., et al. (2014). Determination of four forms of vitamin B12 and other B vitamins in seawater by liquid chromatography/tandem mass spectrometry. Rapid Commun. Mass Spectrometry 28, 2398–2404. doi: 10.1002/rcm.7040
Hunter, S., and Provasoli, L. (1964). Nutrition of algae. Annu. Rev. Plant Physiol. 15, 37–56. doi: 10.1146/annurev.pp.15.060164.000345
Jurgenson, C. T., Begley, T. P., and Ealick, S. E. (2009). The structural and biochemical foundations of thiamin biosynthesis. Annu. Rev. Biochem. 78, 569–603. doi: 10.1146/annurev.biochem.78.072407.102340
Kirchman, D. L. (2002). The ecology of cytophaga-flavobacteria in aquatic environments. FEMS Microbiol. Ecol. 39, 91–100. doi: 10.1016/S0168-6496(01)00206-9
Koch, F., Hatten-Lehmann, T. K., Goleski, J. A., Sanudo-Wilhelmy, S. A., Fisher, N. S., and Gobler, C. J. (2012). Vitamin B1 and B12 uptake and cycling by plankton communities in coastal ecosystems. Front. Microbiol. 3:363. doi: 10.3389/fmicb.2012.00363
Koch, F., Sañudo-Wilhelmy, S. A., Fisher, N. S., and Gobler, C. J. (2013). Effect of vitamins B1 and B12 on bloom dynamics of the harmful brown tide alga. Limnol. Oceanogr. 58, 1761–1774. doi: 10.4319/lo.2013.58.5.1761
Kramer, S. J., and Graff, J. R. (2020). Phytoplankton community composition determined from co-variability among phytoplankton pigments from the NAAMES field campaign. Front. Marine Sci. 7:215. doi: 10.3389/fmars.2020.00215
Landry, Z., Swan, B. K., Herndl, G. J., Stepanauskas, R., and Giovannoni, S. J. (2017). SAR202 genomes from the dark ocean predict pathways for the oxidation of recalcitrant dissolved organic matter. MBio 8:e00413-17. doi: 10.1128/mBio.00413-17
Love, M. I., Huber, W., and Anders, S. (2014). Moderated estimation of fold change and dispersion for RNA-seq data with DESeq2. Genome Biol. 15:550. doi: 10.1186/s13059-014-0550-8
Martin, P., Lampitt, R. S., Jane Perry, M., Sanders, R., Lee, C., and D'asaro, E. (2011). Export and mesopelagic particle flux during a North Atlantic spring diatom bloom. Deep Sea Res. Part I Oceanogr. Res. Pap. 58, 338–349. doi: 10.1016/j.dsr.2011.01.006
Maupin-Furlow, J. A. (2018). Vitamin B1 (Thiamine) Metabolism and Regulation in Archaea. B Group Vitamins-Current Uses and Perspectives, 9–31. doi: 10.5772/intechopen.77170
Mcmurdie, P. J., and Holmes, S. (2013). phyloseq: an R package for reproducible interactive analysis and graphics of microbiome census data. PLoS ONE 8:e61217. doi: 10.1371/journal.pone.0061217
McRose, D., Guo, J., Monier, A., Sudek, S., Wilken, S., Yan, S., et al. (2014). Alternatives to vitamin B1 uptake revealed with discovery of riboswitches in multiple marine eukaryotic lineages. ISME J. 8, 2517–2529. doi: 10.1038/ismej.2014.146
Mojica, K. D. A., Carlson, C. A., and Behrenfeld, M. J. (2020). Regulation of low and high nucleic acid fluorescent heterotrophic prokaryote subpopulations and links to viral-induced mortality within natural prokaryote-virus communities. Microb. Ecol. 79, 213–230. doi: 10.1007/s00248-019-01393-9
Monteverde, D. R., Gómez-Consarnau, L., Cutter, L., Chong, L., Berelson, W., and Sañudo-Wilhelmy, S. A. (2015). Vitamin B1 in marine sediments: pore water concentration gradient drives benthic flux with potential biological implications. Front. Microbiol. 6:434. doi: 10.3389/fmicb.2015.00434
Monteverde, D. R., Gómez-Consarnau, L., Suffridge, C., and Sañudo-Wilhelmy, S. A. (2017). Life's utilization of B vitamins on early earth. Geobiology 15, 3–18. doi: 10.1111/gbi.12202
Morris, R. M., Vergin, K. L., Cho, J.-C., Rappé, M. S., Carlson, C. A., and Giovannoni, S. J. (2005). Temporal and spatial response of bacterioplankton lineages to annual convective overturn at the Bermuda Atlantic time-series study site. Limnol. Oceanogr. 50, 1687–1696. doi: 10.4319/lo.2005.50.5.1687
Needham, D. M., and Fuhrman, J. A. (2016). Pronounced daily succession of phytoplankton, archaea and bacteria following a spring bloom. Nat. Microbiol. 1:16005. doi: 10.1038/nmicrobiol.2016.5
Okbamichael, M., and Sañudo-Wilhelmy, S. A. (2005). Direct determination of vitamin B-1 in seawater by solid-phase extraction and high-performance liquid chromatography quantification. Limnol. Oceanogr. Methods 3, 241–246. doi: 10.4319/lom.2005.3.241
Oksanen, J., Kindt, R., Legendre, P., O'hara, B., Stevens, M. H. H., Oksanen, M. J., et al. (2007). The vegan package. Commun. Ecol. Package 10, 631–637. Available online at: https://CRAN.R-project.org/package=vegan
Paerl, R. W., Bertrand, E. M., Allen, A. E., Palenik, B., and Azam, F. (2015). Vitamin B1 ecophysiology of marine picoeukaryotic algae: strain-specific differences and a new role for bacteria in vitamin cycling. Limnol. Oceanogr. 60, 215–228. doi: 10.1002/lno.10009
Paerl, R. W., Bertrand, E. M., Rowland, E., Schatt, P., Mehiri, M., Niehaus, T. D., et al. (2018a). Carboxythiazole is a key microbial nutrient currency and critical component of thiamin biosynthesis. Sci. Rep. 8:5940. doi: 10.1038/s41598-018-27042-8
Paerl, R. W., Bouget, F.-Y., Lozano, J.-C., Vergé, V., Schatt, P., Allen, E. E., et al. (2016). Use of plankton-derived vitamin B1 precursors, especially thiazole-related precursor, by key marine picoeukaryotic phytoplankton. ISME J. 11, 753–765. doi: 10.1038/ismej.2016.145
Paerl, R. W., Sundh, J., Tan, D., Svenningsen, S. L., Hylander, S., Pinhassi, J., et al. (2018b). Prevalent reliance of bacterioplankton on exogenous vitamin B1 and precursor availability. Proc. Natl. Acad. Sci. U.S.A. 115, E10447–E10456. doi: 10.1073/pnas.1806425115
Pinhassi, J., Sala, M. M., Havskum, H., Peters, F., Guadayol, O., Malits, A., et al. (2004). Changes in bacterioplankton composition under different phytoplankton regimens. Appl. Environ. Microbiol. 70, 6753–6766. doi: 10.1128/AEM.70.11.6753-6766.2004
Provasoli, L., and Carlucci, A. F. (1974). Vitamins and growth regulators. Food Agric.Organ. U. A. 10, 741–787.
R Core Team. (2015). R: A Language and Environment for Statistical Computing. Vienna: R Foundation for Statistical Computing.
Rapala-Kozik, M. (2011). “Vitamin B1 (thiamine): a cofactor for enzymes involved in the main metabolic pathways and an environmental stress protectant,” in Advances in Botanical Research, eds F. Rébeillé and R. Douce (London: Elsevier), 37–91. doi: 10.1016/B978-0-12-386479-6.00004-4
Sañudo-Wilhelmy, S. A., Cutter, L. S., Durazo, R., Smail, E. A., Gómez-Consarnau, L., Webb, E. A., et al. (2012). Multiple B-vitamin depletion in large areas of the coastal ocean. Proc. Natl. Acad. Sci. U.S.A. 109, 14041–14045. doi: 10.1073/pnas.1208755109
Sañudo-Wilhelmy, S. A., Gómez-Consarnau, L., Suffridge, C., and Webb, E. A. (2014). The Role of B vitamins in marine biogeochemistry. Ann. Rev. Mar. Sci. 6, 339–367. doi: 10.1146/annurev-marine-120710-100912
Schowen, R. (1998). “Thiamin-dependent enzymes,” in Comprehensive biological catalysis, ed. S. M. (San Diego: Academic Press), 212–266.
Sudek, S., Everroad, R. C., Gehman, A. L. M., Smith, J. M., Poirier, C. L., Chavez, F. P., et al. (2015). Cyanobacterial distributions along a physico-chemical gradient in the Northeastern Pacific Ocean. Environ. Microbiol. 17, 3692–3707. doi: 10.1111/1462-2920.12742
Suffridge, C., Cutter, L., and Sanudo-Wilhelmy, S. (2017). A new analytical method for direct measurement of particulate and dissolved B-vitamins and their congeners in seawater. Front. Marine Sci. 4:11. doi: 10.3389/fmars.2017.00011
Suffridge, C. P., Gómez-Consarnau, L., Monteverde, D. R., Cutter, L., Arístegui, J., Alvarez-Salgado, X. A., et al. (2018). B vitamins and their congeners as potential drivers of microbial community composition in an oligotrophic marine ecosystem. J. Geophys. Res. Biogeosci. 123, 2890–2907. doi: 10.1029/2018JG004554
Tai, V., and Palenik, B. (2009). Temporal variation of Synechococcus clades at a coastal Pacific Ocean monitoring site. Isme J. 3, 903–915. doi: 10.1038/ismej.2009.35
Tang, Y. Z., Koch, F., and Gobler, C. J. (2010). Most Harmful algal bloom species are vitamin B1 and B12 auxotrophs. Proc. Natl. Acad. Sci. U.S.A. 107, 20756–20761. doi: 10.1073/pnas.1009566107
Teeling, H., Fuchs, B. M., Becher, D., Klockow, C., Gardebrecht, A., Bennke, C. M., et al. (2012). Substrate-controlled succession of marine bacterioplankton populations induced by a phytoplankton bloom. Science 336, 608–611. doi: 10.1126/science.1218344
Vergin, K. L., Beszteri, B., Monier, A., Thrash, J. C., Temperton, B., Treusch, A. H., et al. (2013). High-resolution SAR11 ecotype dynamics at the Bermuda Atlantic Time-series Study site by phylogenetic placement of pyrosequences. ISME J. 7, 1322–1332. doi: 10.1038/ismej.2013.32
Wickham, H. (2009). Ggplot2: Elegant Graphics for Data Analysis. Dordrecht, New York, NY: Springer. doi: 10.1007/978-0-387-98141-3
Winkler, W. C., and Breaker, R. R. (2005). Regulation of bacterial gene expression by riboswitches. Annu. Rev. Microbiol. 59, 487–517. doi: 10.1146/annurev.micro.59.030804.121336
Keywords: thiamin, B-vitamin, bacterioplankton, phytoplankton, microbial interaction
Citation: Suffridge CP, Bolaños LM, Bergauer K, Worden AZ, Morré J, Behrenfeld MJ and Giovannoni SJ (2020) Exploring Vitamin B1 Cycling and Its Connections to the Microbial Community in the North Atlantic Ocean. Front. Mar. Sci. 7:606342. doi: 10.3389/fmars.2020.606342
Received: 14 September 2020; Accepted: 25 November 2020;
Published: 22 December 2020.
Edited by:
Tilmann Harder, University of Bremen, GermanyReviewed by:
Ryan Paerl, North Carolina State University, United StatesFlorian Koch, Alfred Wegener Institute Helmholtz Centre for Polar and Marine Research (AWI), Germany
Copyright © 2020 Suffridge, Bolaños, Bergauer, Worden, Morré, Behrenfeld and Giovannoni. This is an open-access article distributed under the terms of the Creative Commons Attribution License (CC BY). The use, distribution or reproduction in other forums is permitted, provided the original author(s) and the copyright owner(s) are credited and that the original publication in this journal is cited, in accordance with accepted academic practice. No use, distribution or reproduction is permitted which does not comply with these terms.
*Correspondence: Christopher P. Suffridge, suffridc@oregonstate.edu