Marvelous Marine Microgels: On the Distribution and Impact of Gel-Like Particles in the Oceanic Water-Column
 Anja Engel
 Sonja Endres
 Luisa Galgani
 Markus Schartau
- 1GEOMAR Helmholtz Centre for Ocean Research Kiel, Kiel, Germany
- 2WTSH Business Development and Technology Transfer Corporation of Schleswig-Holstein, Kiel, Germany
- 3Center for Colloid and Surface Science, Sesto Fiorentino, Italy
- 4Department of Biotechnology, Chemistry and Pharmacy, University of Siena, Siena, Italy
Three-dimensional hydrogels of organic polymers have been suggested to affect a variety of processes in the ocean, including element cycling, microbial ecology, food-web dynamics, and air-sea exchange. However, their abundance and distribution in the ocean are hardly known, strongly limiting an assessment of their global significance. As a consequence, marine gels are often disregarded in biogeochemical or ecosystem models. Here, we demonstrate the widespread abundance of microgels in the ocean, from the surface to the deep sea. We exhibit size spectra of two major classes of marine gels, transparent exopolymer particles (TEP) and Coomassie stainable particles (CSP) for three different ocean regimes: (a) Polar Seas, (b) Eastern Boundary Upwelling Systems, and (c) the oligotrophic open ocean. We show the variations of TEP and CSP over the water-column, and compare them to dissolved organic carbon (DOC). We also discuss how the observed distributional patterns inform about productivity and particle dynamics of these distinct oceanic regimes. Finally, we exploit current research topics, where consideration of microgels may give new insight into the role of organic matter for marine biogeochemical processes.
Introduction
Natural organic gels have gained considerable attention in marine and atmospheric research over the past decades due to their widespread occurrence in the environment and their involvement in biological, chemical, and physical processes. Gels are a fraction of exopolymeric substances (EPS), representing dissolved or particulate polymeric organic substances outside the cell. Marine EPSs typically have a high content of gelling agents, such as mucopolysaccharides and they occur over a large range of sizes in various chemical and structural forms (Verdugo et al., 2004). The large and continuous size spectrum of marine gels is the result of dynamic formation and disintegration processes that yet are not fully understood. A useful concept to describe the structure and properties of gels comes from gelation theory (Chin et al., 1998; Verdugo et al., 2004; Verdugo, 2012; Orellana and Leck, 2015). Here, marine gels are defined as three-dimensional networks of organic polymers with seawater as solvent entrapped in the network pores. Nanogels assemble from individual polymers and are held together by ionic forces, such as divalent cation (Ca2+, Mg2+) bridging and hydrogen bondings, or by hydrophobic interactions. According to this theory, gel growth is achieved through annealing of small nanogels that can create larger sized gels (~5 μm) (Chin et al., 1998). More stable and larger sized polymer gels result from collisions of two annealing nanogels. In the reverse, processes like fragmentation and dispersions are responsible for gel size reduction.
Gel particles in seawater have been determined through staining with dyes specific for the organic compounds they contain. Alcian Blue, a cationic copper-phthalocyanine dye that reacts with the carboxyl (COO–) and sulfate half ester () functional groups of acid mucopolysaccharides and glycosaminoglycans (Parker and Diboll, 1966; Decho, 1990) and the fluorescein labeled lectin Concanavalin A (ConA) have been used to determine polysaccharide-containing gels, referred to as transparent exopolymer particles (TEP) (Alldredge et al., 1993; Engel et al., 2017). Another dye is Coomassie Brilliant Blue, a disulfonated triphenylmethane dye that binds to proteins and longer peptides (Chial and Splittgerber, 1993). It is used for identifying protein-containing Coomassie stainable particles (CSP) (Long and Azam, 1996). After staining, TEP and CSP can be quantified by spectrophotometric measurements of the total amount of stain absorbed (Passow and Alldredge, 1995; Cisternas-Novoa et al., 2014) or by sizing and counting of individual particles using microscopy (e.g., Engel, 2009). Today, most published information on gels in the marine environment is available for TEP and CSP.
The origin of the polysaccharides contributing to TEP formation is biological production, mainly primary production by plankton in the sunlit surface ocean. Phytoplankton derived hetero-polysaccharides contain neutral sugars like glucose, galactose, arabinose, mannose and xylose, amino sugars like glucosamine and galactosamine, and acidic sugars such as galacturonic and glucuronic acid (Biersmith and Benner, 1998; Borchard and Engel, 2012). Uronic acids are likely involved in the formation process of gel particles as they allow for polymer bridging via divalent cations. Mechanisms involved in the release of polysaccharides from the cell to the extracellular space include exudation, as well as viral lysis of cells and cell breakage, e.g., through sloppy-feeding and bacterial degradation. The “carbon-overflow” hypothesis (Wood and Van Valen, 1990; Engel et al., 2004) predicts that excess photosynthesates are released from the autotrophic (?) cell under conditions of growth limitation by nutrients. As the molecular weight of polysaccharides released from phytoplankton cells is too high for passive, concentration-dependent diffusion through the cell membrane, their release is more likely associated with active exudation processes, including exocytosis and/or transport by specific membrane-bound transport proteins embedded in the plasma membrane (Engel et al., 2004; Borchard and Engel, 2012). Indeed, TEP concentration during phytoplankton blooms typically increases as soon as algal growth has approached nutrient depletion (Logan et al., 1995; Mari and Kiørboe, 1996; Engel et al., 2002; Passow, 2002).
The concentration of dissolved polysaccharides in seawater approximately ranges from 2.6 to 25.8 μM and dominates the upper waters above oxygen minima (Pakulski and Benner, 1994). Supposing homogenous distribution in seawater, the individual polymer chains would likely be too disparate to assemble spontaneously. Accumulation at sites such as boundary layers, air bubbles or the outer cell surface may increase the probability of contact and enable gel formation. For dispersed polymers in seawater, diffusion and shear are the main kinetic processes supporting contact, subsequent adhesion and coagulation (Logan et al., 1995). Modeling studies have shown how observed TEP concentrations can be well-explained by considering nutrient limited phytoplankton growth as a prerequisite for an excessive release of exopolysaccharides and by applying coagulation theory where dissolved exopolysaccharides are treated as polymeric precursors for the formation of TEP (Engel et al., 2004; Schartau et al., 2007; Joassin et al., 2011). Because TEP form from exopolysaccharides, their element content displays a selective enrichment of carbon relative to other major elements like nitrogen and compared to the Redfield ratio of plankton (Redfield, 1958; Mari, 1999; Engel and Passow, 2001). This can be particularly relevant for how measurements of particulate organic carbon (POC) and of particulate organic nitrogen (PON) are interpreted for e.g., model validation and data-model comparisons.
Compared to TEP, information about CSP in marine environments is scarce. Long and Azam (1996) suggested that CSP and TEP are separate particles with CSP exceeding TEP abundance by a factor of up to three. Since CSP contain valuable proteins, it is likely that their polymeric precursors are not actively exuded by the cell but rather originate from cell lysis and breakage by (sloppy) zooplankton grazing. Likewise, the different biochemical composition and carbon to nitrogen ratio of TEP and CSP should differ. TEP and CSP thus have different biochemical and consequently physicochemical properties and satisfy different resource needs of heterotrophic consumers, potentially resulting in different biological degradation patterns. We therefore expect that the environmental control and hence the spatial and temporal patterns of TEP and CSP abundance in the ocean are distinguishable. Indeed, previous studies corroborated distinct properties and dynamics for TEP and CSP. By visual inspection, Cisternas-Novoa et al. (2015) noted different shapes, sizes of TEP and CSP from seawater microcosms, marine algal cultures, and freshwater. Moreover, depth distribution of TEP and CSP was found to diverge in samples from the Sargasso Sea, and Arctic Ocean (Cisternas-Novoa et al., 2015; Busch et al., 2017).
As their organic components originate from microbial production, primarily photosynthesis, marine gels represent a substrate for marine microorganisms to attach and grow upon (Bar-Zeev et al., 2012; Verdugo, 2012). Marine gels therefore often represent hotspots of microbial metabolic activity. Due to a high stickiness, they accelerate particle coagulation and therewith potentially enhance the export of carbon to the deep sea (Engel et al., 2002). Moreover, hydrogel networks accumulate at the air-sea interface, from where they may be emitted to the atmosphere and enter the atmospheric aerosols pool or become nuclei for cloud condensation, depending on their size (Wurl and Holmes, 2008; Cunliffe and Murrell, 2009; Orellana and Leck, 2015).
Despite the presumed importance of microgels, the current knowledge of the quantitative distribution of TEP and CSP in the ocean is still low, severely limiting an assessment of the global significance of marine gels. The size of marine gel particles is an important trait and variations in particle size spectra are particularly useful, as they can inform about formation and loss processes. Thus, changes in the size spectra of biogenic gel particles may be indicative of a variety of ecological and physical processes in the ocean. Here, size spectra of TEP and CSP are depicted and discussed, comparing three different ocean regimes: (a) Polar Seas, (b) Eastern Boundary Upwelling Systems, and (c) the oligotrophic open ocean. We show the vertical distribution of TEP and CSP, and in comparison to dissolved organic carbon (DOC), from the surface to the deep sea. We discuss how these observed distributional patterns relate to the productivity and particle dynamics of these distinct oceanic regimes.
Materials and Methods
Sampling Sites
Samples were collected during six cruises to different oceanic regimes, representing 1. open ocean sites: with 1.1 the tropical Indian Ocean and 1.2 the subtropical South West Pacific (SWP), 2. Polar Seas: with 2.1 the Arctic Ocean and 2.2 the Southern Ocean, and 3. Eastern Boundary Upwelling Systems (EBUS): with 3.1 the Eastern Tropical North Atlantic (ETNA), and 3.2 the Eastern Tropical South Pacific (ETSP) (Figure 1). During all cruises the depth of the water column at the sampling stations exceeded 1000 m, allowing for attributing data to the epipelagic (0–200 m), mesopelagic (200–1000 m), and bathypelagic ocean (>1000 m). More information about the timing and sampling location is given in Table 1. All samples were collected at discrete depths in the water column using Niskin bottles attached to a CTD rosette and processed onboard immediately after sampling. Information on the depth distribution of microgels during ARK29 (Arctic Ocean) and on their bacterial colonization can also be found in Busch et al. (2017).
Table 1. Cruise and sampling information for gel particles.
Figure 1. Global map showing the sampling stations at the six different sampling sites.
Analysis of Microgels
Two classes of microgels, i.e., the transparent exopolymer particles (TEP) and the Coomassie stainable particles (CSP), were analyzed by microscopy and semi-automated image analysis following the protocol by Engel (2009). For each sample, 10–250 mL of seawater were filtered onto 0.4 μm Nuclepore membrane filters (Whatman). The volume of samples was selected based on microscopic inspection of the filter directly on board of the research vessel and assuring that the filters contain neither too little nor too high amounts of particles. In particular, a too high particle load should be avoided to allow for later identification of individual particles using automated image analysis. TEP were stained with 1 mL Alcian Blue solution, CSP with 1 mL Coomassie Brilliant Blue G (CBBG) working solution. Filters were mounted onto Cytoclear© slides and stored at −20°C until microscopic analysis in the home laboratory. Abundance, area and size-frequency distribution of TEP and CSP in the size range 1–760 μm were determined after Engel (2009) using a light microscope (Zeiss Axio Scope A.1) connected to a camera (AxioCAM Mrc). Filters were screened at 200× magnification. About 30 pictures were taken randomly from each filter in two perpendicular cross-sections (15 pictures each; resolution 1040 × 1040 pixel, 8-bit color depth). The image analysis software WCIF ImageJ (Version 1.44, Public Domain, developed at the US National Institutes of Health, courtesy of Wayne Rasband, National Institute of Mental Health, Bethesda, MD, United States) was used to semi-automatically analyze particle number and area. Blank filters for TEP and CSP yielded total microgel area values of up to 0.01 cm2 L–1; we therefore define 0.01 cm2 L–1 as the detection limit of microgels in this study.
The carbon content of TEP (TEP-C) was estimated after Mari (1999) using the size-dependent relationship:
with ni being the number of TEP in the size class i and ri being the mean equivalent spherical radius of the size class. The constant a = 0.25 * 10–6 (μg C) and the fractal dimension of aggregates D = 2.55 were proposed by Mari (1999). To relate to organic carbon concentration in seawater, concentrations of TEP-C are given as μmol L–1, depth-integrated data as mmol m–2.
Continuous size spectra (particle concentration size densities) of CSP and TEP were derived from discrete microscopic counts of particles that were sorted into 19 size intervals between 0.625 and 640 μm equivalent spherical diameter (ESD). Kernel density estimates (KDEs) were computed, based on Gaussian kernels of logarithmic particle size, for resampled subsets of every microscopic sample, mainly to achieve robust size density estimates together with confidence limits. For every subsample the total particle concentration was divided by a factor of three, which implies a maximum precision of 3 particles mL–1. The consideration of only one third of all particles in a subsample reduces computing time for the derivation of KDEs considerably. We note that the so derived size spectra of subsamples were again multiplied by this factor and the integral over all sizes is, in the end, similar to the original total particle concentration. Log-transformed values of ESD were randomly assigned to all subsampled particles, assuming a uniform probability distribution on logarithmic scale, according to the size interval of the particles. Ultimately, mean continuous particle size spectra were calculated from a series of KDEs for specified depth ranges (z ≤ 200 m, 200 m < z ≤ 1000 m, and z > 1000 m) for the different sampling regions. The number of samples (=number of KDEs) of every depth range for every region is listed in Table 1. We determined respective 95% confidence regions as ±1.96 × standard errors of the corresponding mean particle spectrum (mean of subsample KDEs).
Microgel abundance in the ocean has previously been quantified for specific regions using the microscopical approach, as in this study, or colorimetric methods (Passow and Alldredge, 1995; Cisternas-Novoa et al., 2014). TEP-C data have been derived from both methods and compare generally well, although TEP-C concentrations derived from the colorimetric method seem to be generally higher than those from microscopy (Engel and Passow, 2001). We accounted for this offset, when estimating TEP-C concentration from published colorimetric TEP concentration by using the empirical relationship of Engel and Passow (2001):
Here [TEP-C]SFD is the TEP-C concentration [μmol L–1] corrected for the offset between the methods and [TEP]color is the TEP concentration [μg Xeq. L–1] determined by the colorimetric method. Comparing derived TEP-C concentrations is meaningful where data on TEP concentration or abundance are available. However, for some regions included in this study, such as the open Indian Ocean or the SWP, no previous observations on microgels can be found in the literature. Moreover, data on microgel abundance below the surface ocean are largely lacking. Thus, many of our data can only be compared to previous studies on a wider scale, referring to ocean basins or trophic systems rather than to exactly the same sampling region.
Dissolved Organic Carbon (DOC)
Samples for the determination of DOC concentration (20 mL) were collected in combusted glass ampoules after filtration through combusted GF/F filters (8 h, 500°C) or through GHP membrane filters (Pall) after rinsing with 20 mL of MilliQ water and sample. Samples were acidified with 80 μL of 85% phosphoric acid or 20 μL of 30% hydrochloric acid, flame sealed and stored at 4°C in the dark until analysis. DOC samples were analyzed by applying the high-temperature catalytic oxidation method (TOC-VCSH, Shimadzu) modified from Sugimura and Suzuki (1988). Every 8–10 days, the instrument was calibrated with standard solutions of 0, 500, 1000, 1500, 2500, and 5000 μg C L–1, prepared from a potassium hydrogen phthalate standard (Merck 109017). Every measurement day, ultrapure (MilliQ) water was used to determine the instrument blank, which was accepted for values <1 μmol C L–1. Organic carbon analysis was furthermore validated on every measurement day with deep seawater reference (DSR) material provided by the Consensus Reference Materials Project of RSMAS (University of Miami) yielding values within the certified range of 42–45 μmol C L–1. DOC concentration was determined in each sample from 5 to 8 injections. The precision was <4% estimated as the standard deviation of replicate measurements divided by the mean.
Data Analysis
Average values are given by their arithmetic mean value and standard deviation unless otherwise stated. Coefficients of variation were calculated as relative standard deviation (%). Depth-integrated values for the water column were based on average concentration and water column depth. Student’s t-tests were applied for comparison of averages. Statistical tests in data analysis have been accepted as significant for p < 0.05. Calculations, statistical tests and illustration were performed with Microsoft Office Excel 2010, Sigma Plot 12.0 (Systat), and Ocean Data View (Schlitzer, 2015).
Results
Total Microgel Abundance and DOC Concentration at the Study Sites
To compare data between different oceanic sites and to identify overarching patterns in the distribution, we calculated the average abundance of marine microgels in terms of total area per volume for the epi-, meso-, and bathypelagic ocean at each sampling site and compared the spatial variability of microgels to that of DOC concentration (Figure 2). DOC distribution is driven by water mass transport and DOC concentration exhibits relatively little variability over time and space, in particular in the deeper water column where the majority of DOC is included in refractory compounds with turn-over times of more than 100 years (Hansell, 2002).
Figure 2. Average concentrations of DOC, TEP, and CSP in the epipelagic, mesopelagic, and bathypelagic ocean of the six study sites. Error bars indicate ± 1 SD. Note log scale for TEP and CSP.
In general, DOC concentration decreased with depth, following previously described patterns. For the epipelagic ocean, observed DOC concentrations ranged from 56 μmol L–1 in the Southern Ocean to 73 μmol L–1 in the SWP. At mesopelagic depths, DOC concentration was more similar between the ocean regimes and ranged from 47 to 53 μmol L–1. Highest DOC concentration at those depths was observed again in the SWP. In the bathypelagic ocean, variability in DOC concentration was further reduced, approaching concentrations between 43 and 49 μmol L–1.
The abundance of both classes of microgel particles exhibited greater spatial variability than observed for DOC concentration. Overall, we observed variation coefficients to range between 0.5 and 35% for DOC, between 28 and 202% for TEP and between 45 and 292% for CSP. Thereby, microgel abundance did not only vary between oceanic sites but also pronounced over depth. The range of abundance was similar for both gel types, with slightly higher values for CSP than for TEP in particular in the epipelagic ocean where highest microgel abundance was observed. Here, TEP varied from 0.08 cm2 L–1 in the SWP to 2.59 cm2 L–1 in the ETNA, and CSP from 0.03 cm2 L–1 in the Indian Ocean to 2.90 cm2 L–1 in the ETSP. Hence, highest microgel abundance was observed in surface waters of EBUS, while lowest abundance was observed at the two open ocean sites; the tropical Indian Ocean and the subtropical SWP. Microgel abundance in mesopelagic waters was significantly lower than in the epipelagial (p = 0.01, n = 12). For both TEP and CSP, lowest abundance in the mesopelagial was observed for the Southern Ocean, while highest values were determined in the ETNA. Thereby, TEP abundance in the mesopelagial was rather uniform between the different oceanic sites, apart from high values observed in the ETNA. TEP abundance at even greater depths of the bathypelagial was similar to the mesopelagial with values ranging from 0.03 to 0.08 cm2 L–1 and highest values observed again at the ETNA site with 0.97 cm2 L–1. For CSP, the regional distribution pattern seen in the mesopelagial also persisted in the bathypelagial, with highest abundance observed at the upwelling sites (ESTP: 0.30 cm2 L–1, and ETNA: 0.92 cm2 L–1), and lowest in the Southern Ocean (0.02 cm2 L–1). No significant relationship was observed between DOC concentration and microgel abundance.
Size Spectra of Microgels
Size spectra for TEP and CSP were calculated for each sample and averaged for the three depth-layers. Abundant particles (>3 mL–1) were determined in the size range 0.7–100 μm for both TEP and CSP, with particle abundance declining with increasing size. Although previously assumed, a single power-law relationship, y = ax–b, seems inappropriate for describing the whole size spectra of both types of microgels. On logarithmic scale, this becomes particularly evident for particle sizes smaller than ∼6 μm, where the spectral slope appears to be smaller than for gel particles of larger size. The estimation of two distinct slopes for every TEP or CSP size spectrum would require an exact separation between these two size ranges, which is beyond the scope of this study. Rather than comparing differences between slope estimates, we hereafter focus on predominant differences in size spectra at the different ocean sites.
The two open ocean sites, tropical Indian Ocean and subtropical SWP respectively, had the lowest microgel abundance in the epipelagial and also revealed similar patterns in their size spectra (Figures 3A,B). A noticeable difference was the absence of gel particles larger than 50 μm in the SWP samples, while few particles of larger size (up to ∼100 μm) were also measured in the Indian Ocean. At the Indian Ocean stations, size spectra of TEP and CSP at depths below 200 m were alike. This was also true for TEP size spectra in the SWP, while CSP in the size range 3–30 μm showed slightly lower values in the bathypelagial compared to the mesopelagial. Similar patterns between these two sites were also observed for the relative contribution of CSP to total microgel abundance ([CSP]/([CSP] + [TEP])). In general, CSP were more abundant than TEP in all size classes < 60 μm, except for the bathypelagial in the size range 2–∼10 μm, where both gel types either contributed equally (Indian Ocean) or TEP dominated (SWP). The contribution of CSP to total gels increased with size up to ∼30 μm and decreased from surface to depth. However, for the group of very small microgels (<2 μm) highest CSP contributions were observed in the bathypelagial at both sites.
Figure 3. (A–F) Average size frequency distributions of TEP and CSP within the epipelagic (red lines), mesopelagic (blue lines), and bathypelagic (black lines) ocean as well as the respective fractions of CSP over size. Gray shadings indicate the ranges of uncertainty. (A) Tropical Indian Ocean, (B) Subtropical South-West Pacific (SWP), (C) Arctic Ocean, (D) Southern Ocean, (E) Eastern Tropical North Atlantic (ETNA), (F) Eastern Tropical South Pacific (ETSP).
A clear separation of size spectra with depth was observed for the two polar ocean sites (Figures 3C,D), with larger microgels being clearly more abundant than at the two tropical/subtropical open ocean sites. While in surface waters of the Arctic Ocean larger gels (>30 μm) were dominated by CSP, larger TEP strongly contributed to the pool of microgels in the Southern Ocean. However, surface waters of both polar sites also exhibited a relative increase of CSP in the mid- size range, i.e., between 3 and 30 μm. In general, more than 50% of all microgels >3 μm in the epipelagial of the Arctic Ocean were CSP. Interestingly, CSP in the size range 2–30 μm were underrepresented in the meso- and bathypelagical of both polar ocean sites.
Similarities in size spectra of microgels were also determined for the two EBUS regions, ETNA and ETSP (Figures 3E,F). Here, abundance of microgels, and in particular of larger microgels, was highest compared to the polar and open ocean sites. Thereby a high abundance of larger gels was not only observed in the epipelagic but throughout the water column. Differences between size spectra of the depth ranges were less pronounced than at the polar and open ocean sites. In the ETSP, CSP dominated the pool of microgels at all sizes. A peculiarity of microgel size spectra in upwelling regions was the increase of the relative CSP fraction with depth seen for all size classes <60 μm in the ETSP and for all size classes <6 μm in the ETNA. This may point to reduced degradation of CSP in the deeper water column or to enhanced sources of CSP at depth. Highest contribution of CSP to the microgel pool was observed in the bathypelagial, followed by the meso- and the epipelagial. At the ETSP, CSP clearly dominated the pool of microgels <50 μm, contributing >80% to total microgels.
Comparing all sites, a clear indication for higher abundance of microgels >20 μm with higher total microgel abundance was evident, suggesting that the size spectra of both particle types render the process of aggregation (Figure 4). We note that the number of particles >20 μm is less than 1% of the total abundance. The abundance of CSP and of TEP were of similar magnitude and their dependencies between particle concentrations with ESD >20 μm and respective total abundance compare well. Variations in total abundance range between 103 and 105 particles mL–1. The logarithm of the abundance of microgels larger than 20 μm, f(ESD > 20μm), can be approximated with a log-linear relationship, fCSP/TEP = a ⋅ [log10(ΣCSP/TEP) – b], where Σ is the total abundance of either CSP or TEP. We combined all respective data of the upper 200 m and minimized root mean square errors of the above described log-linear relationship. Our parameter estimates for TEP (a = 1.0, b = 2.72) turned out to be similar to those for CSP (a = 0.76, b = 2.24). This indicates that the underlying coagulation dynamics (e.g., collision rates and stickiness) of TEP and CSP are likely comparable. In spite of the large variability, we can consolidate a dependency between the number concentrations of particles with ESD >20 μm and total particle abundance. This is possible because of the sufficiently large number of independent datasets available.
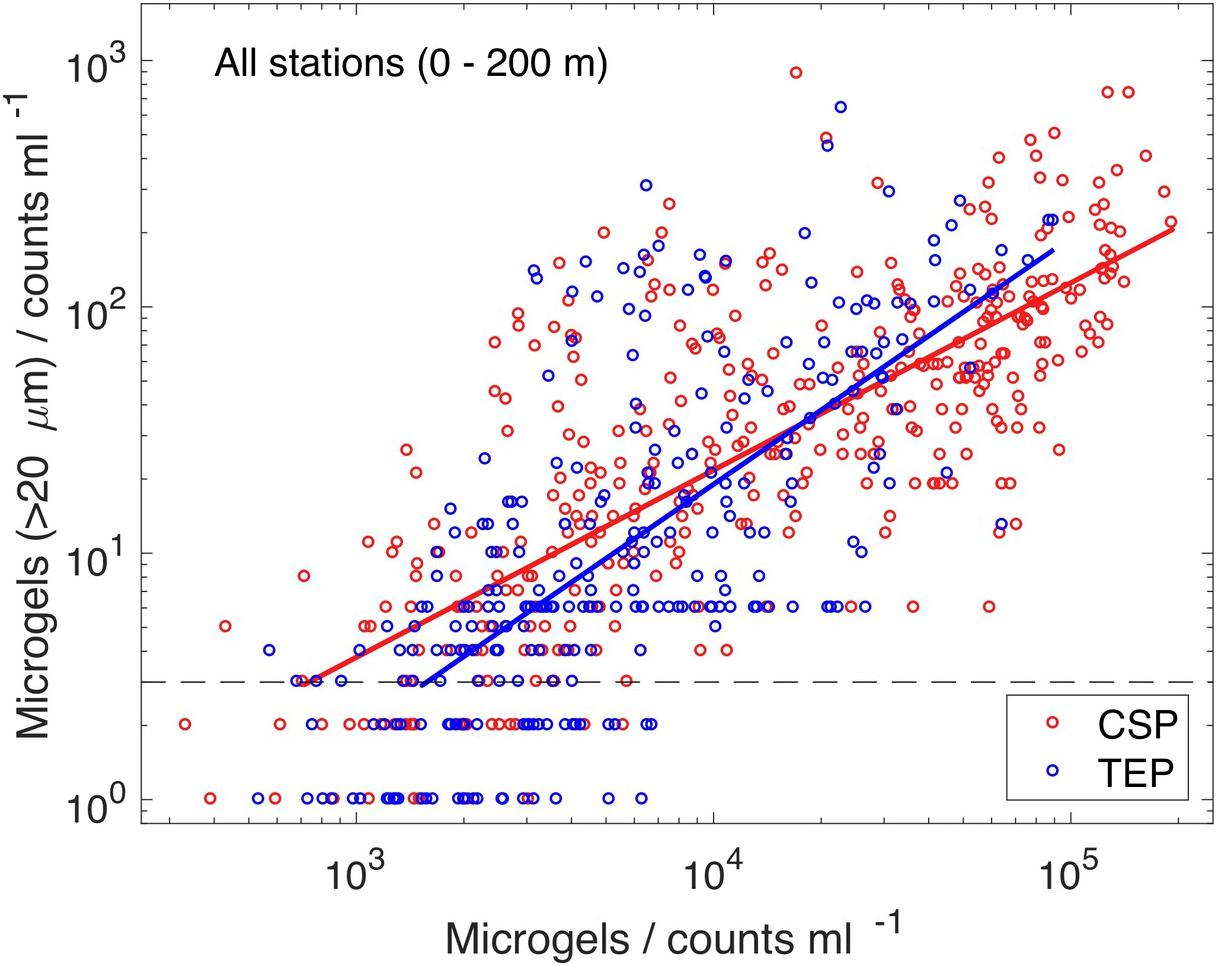
Figure 4. The abundance of microgels with ESD >20 μm increased with the number of total abundance of microgels (Pearson correlation coefficients, ρCSP = 0.76 and ρTEP = 0.71). The lines are best estimates (root mean square minimizations on logarithmic scale), assuming a linear relationship between log-transformed values of microgel abundance with ESD >20 μm and total abundance (Σ): fCSP = 0.76 ⋅ [log10(ΣCSP) – 2.24] (red line), and fTEP = 1.0 ⋅ [log10(ΣTEP) – 2.72] (blue line).
Contribution of TEP-C to the Organic Carbon Pool
Concentration of carbon included in TEP (TEP-C) was assessed from abundance and size of particles (Eq. 1) (Table 2). The amount of TEP-C relative to the pool of DOC ([TEP-C]:[DOC]), which represents the largest fraction of the total organic carbon pool in surface waters and almost the entire pool in the deep sea (Hansell, 2002), varied strongly between the study sites (Figure 5). In the oligotrophic areas of the Indian Ocean and the SWP the depth-integrated pool of TEP-C was largest for the bathypelagial, followed by the mesopelagial and epipelagial. This goes along with the much larger total volume of the deeper ocean compared to the layers above. [TEP-C]:[DOC] was in general less than ∼0.1% throughout the water-column at these sites. In the Arctic and Southern Ocean, a higher amount of TEP-C was observed in the epipelagial, both in terms of total integrated carbon and relative to the DOC pool. At both polar sites, integrated TEP-C values were clearly lower in the meso- than in the epi- and bathypelagial, indicating substantial TEP-C degradation in this layer. Although the depth-integrated amount of TEP-C and the [TEP-C]:[DOC] ratio in the epi- and mesopelagial of the Southern and Arctic Ocean were similar, the bathypelagial of the Southern Ocean showed the least amount of TEP-C of all sites investigated, yielding a total of 0.6 mmol TEP-C m–2 and <0.03% DOC.
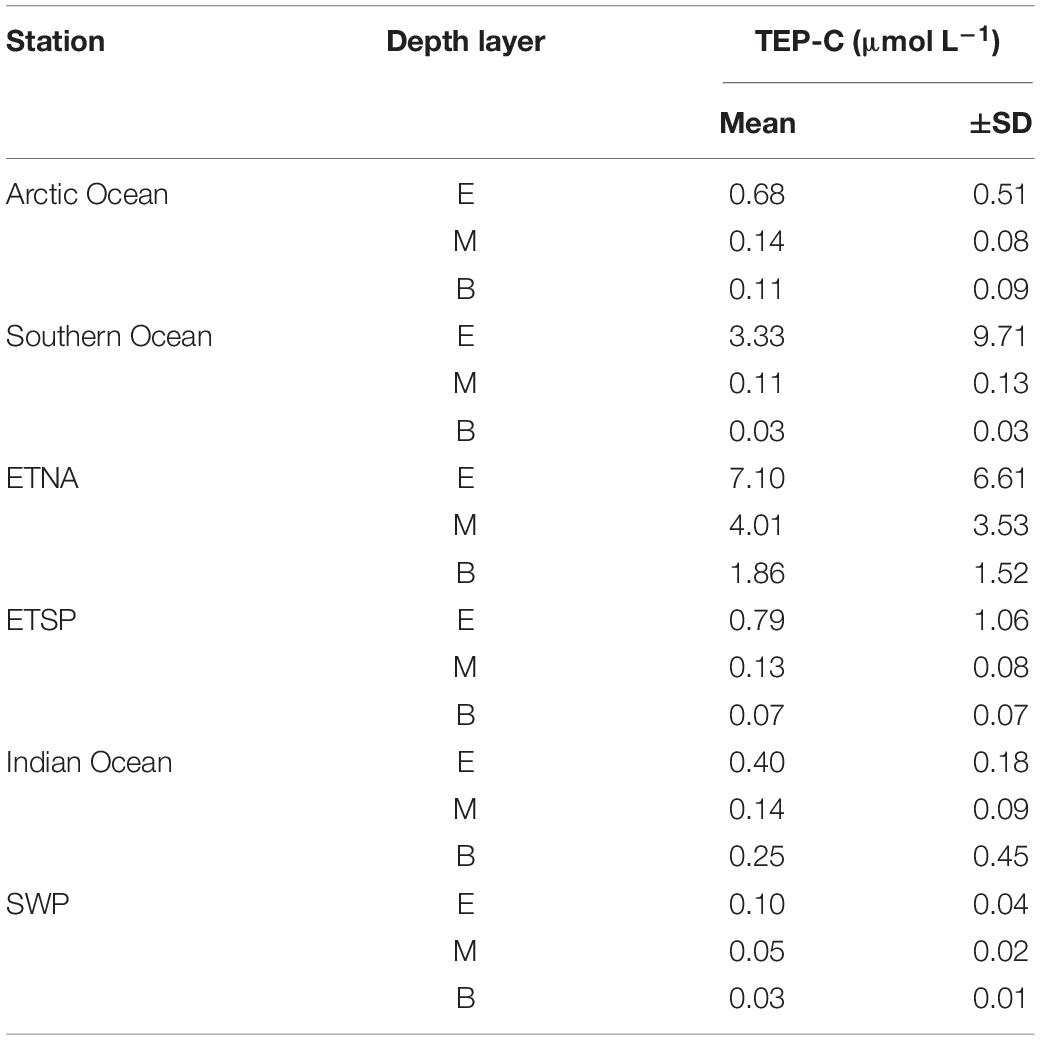
Table 2. Concentrations of carbon contained in TEP (TEP-C) for different stations and depths of the global ocean.
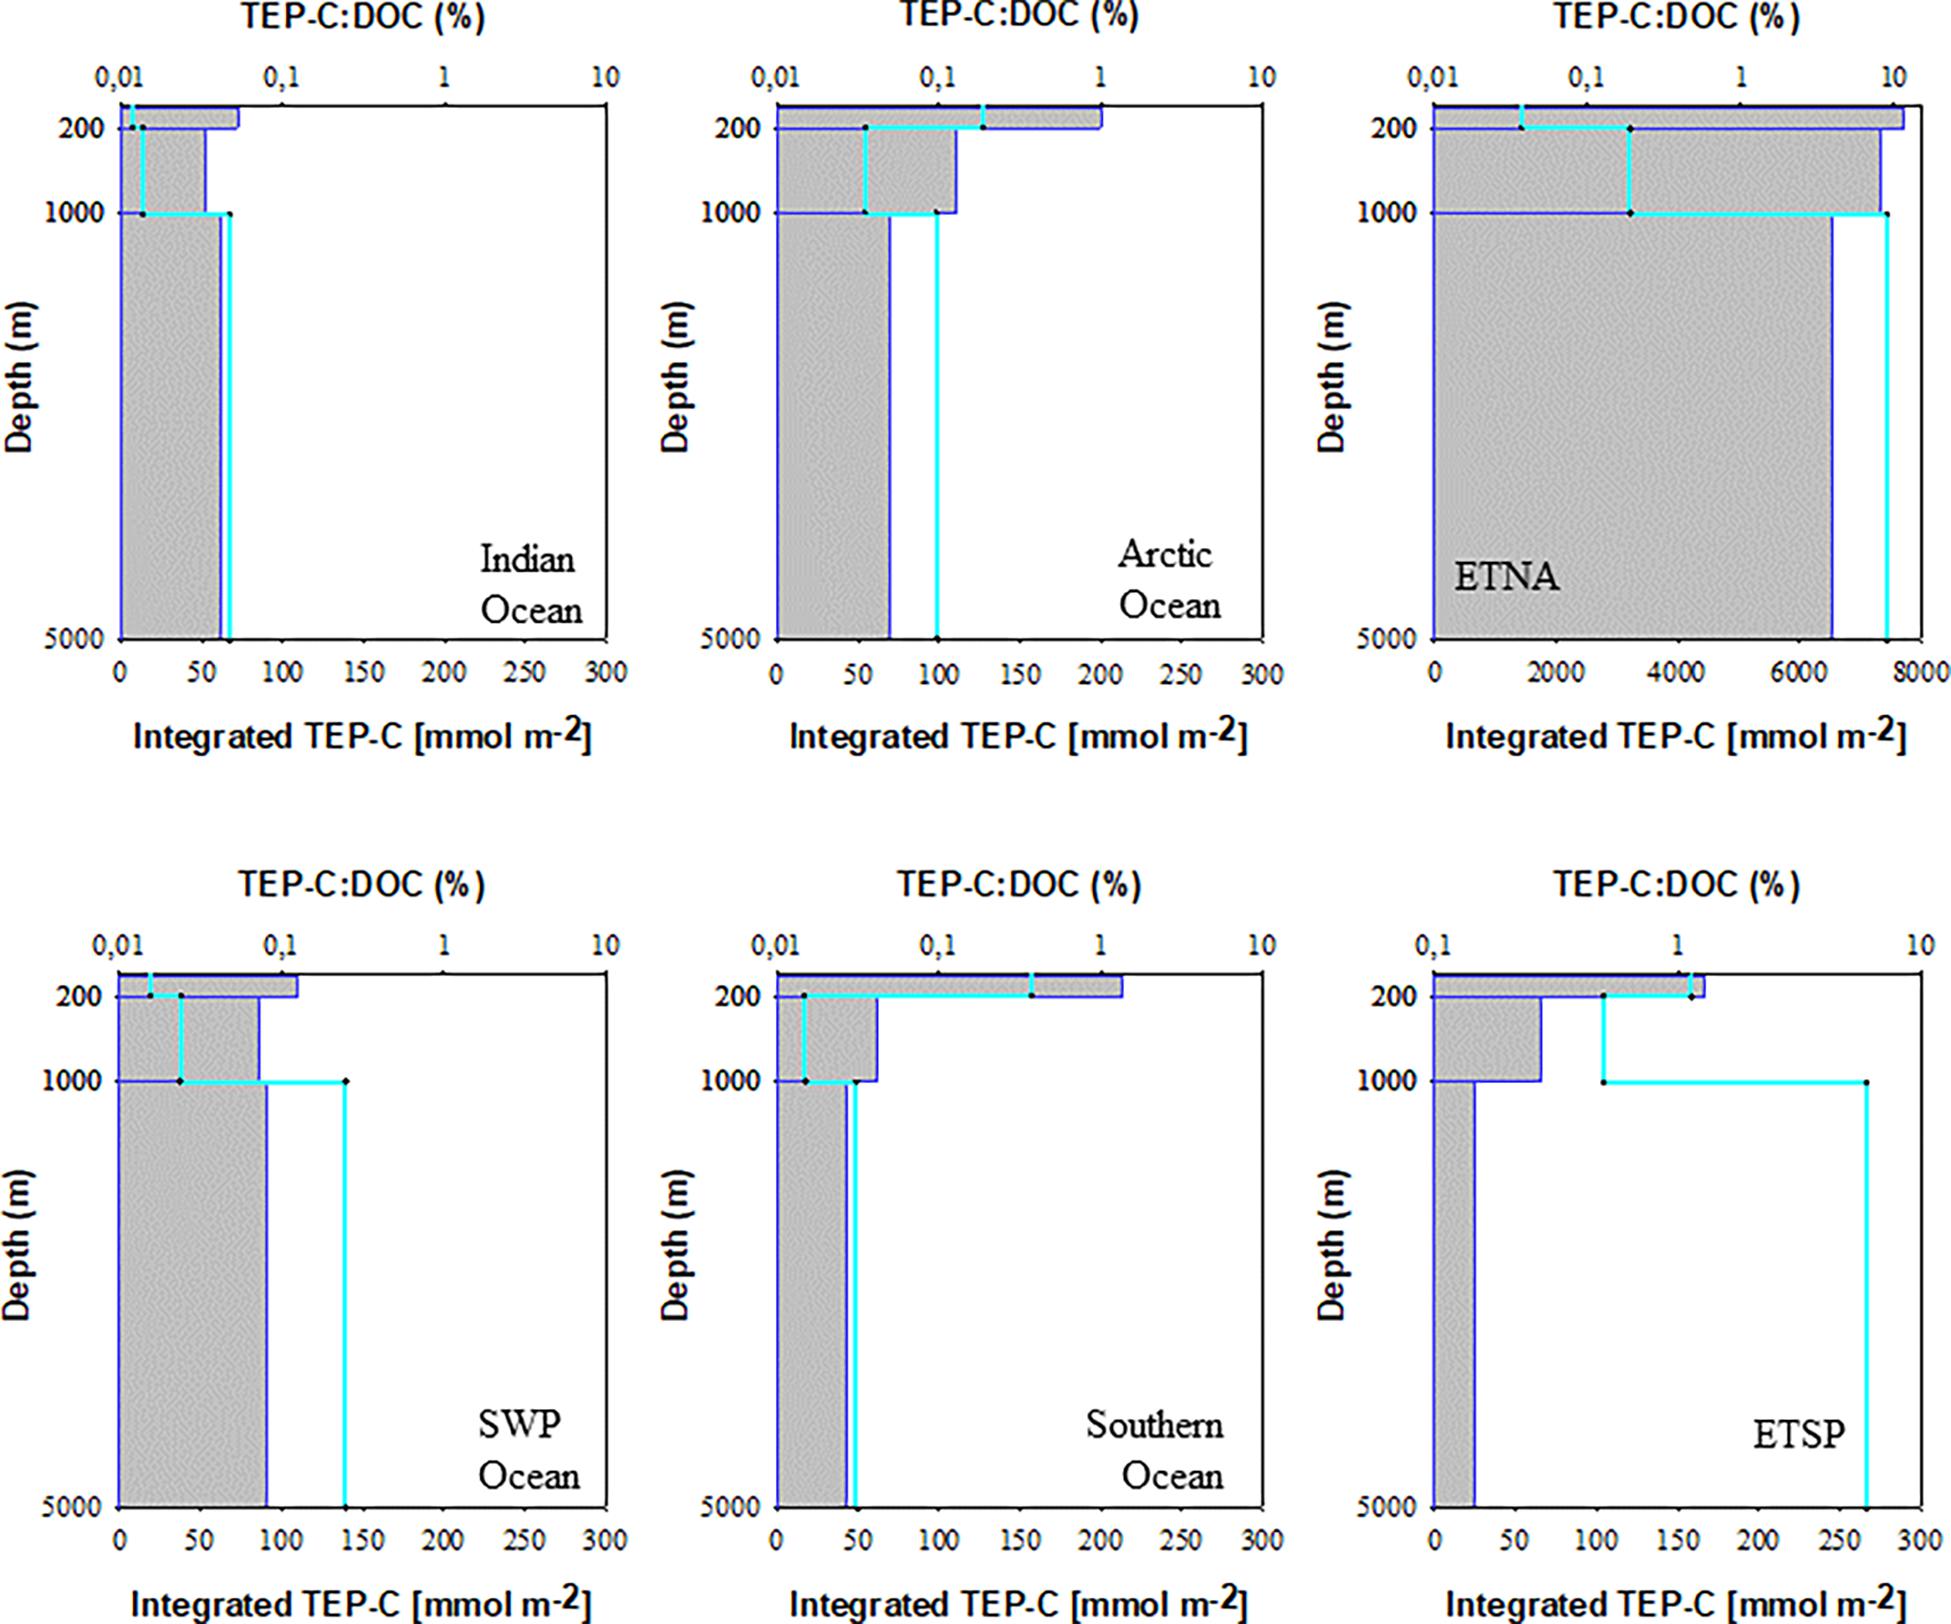
Figure 5. Depth-integrated carbon content of TEP (green line) and TEP-C percentage of DOC (gray bars) for the three studies depth layers of the six study sites.
The highest amounts of total depth-integrated of TEP-C were observed at the two upwelling sites. Interestingly, accumulation of TEP in the bathypelagial leads to a high standing stock of TEP-C, equivalent to >0.1% DOC. In the ETNA the concentration of TEP-C corresponded to ∼10% of DOC concentration in the epipelagial, and to >1% of DOC concentration in the deepest samples. In contrast to the ETSP and to most other sites, the integrated amount of TEP-C continuously increased over depth, suggesting that the export of TEP-C to depth in the ETNA is faster than its degradation.
Discussion
Over the past three decades, organic microgels in the marine environment have gathered attention by scientists from a wide range of disciplines, and with respect to different processes such as element and in particular carbon cycling, microbial ecology, air-sea exchange, transport of pollutants such as oil, toxins and microplastic, as well as seawater desalination. Yet our ability to quantify microgels in the environment, to determine their chemical heterogeneity, as well as their continuous size range is limited by available analytical methods. Extracting three-dimensional, fractal gel particles onto membrane filters, staining, and subsequent measurement of their two dimensional size introduces inevitable inaccuracies. Likewise, estimating their main chemical components by compound-specific stains that may target one but not all components is prone to error. Finally, for quantification of the carbon content of microgels empirical conversion factors are commonly applied that may not be universally applicable and may only be representative for the microgel population sampled at a particular site.
Here, we applied a direct counting and sizing method to quantify microgel distribution in the ocean. In general, we enumerated and sized between 102 and 104 microgels per sample with replicate samples per depth and several stations per sampling site. In spite of methodological limitations, we found consistent characteristics as well as detailed patterns in our analysis of CSP and TEP, even amongst measurements that were collected at distinct ocean sites. Based on the large number of observations and with analytical restrictions kept in mind, we could derive robust size spectra of microgels that reveal discriminable features in abundance and in size structure along vertical gradients and between different oceanic regimes.
Changes and Differences in Marine Microgel Size Spectra
Variations in microgel size spectra are subject to various processes that can act on similar or overlapping size ranges. For the size range smaller than 5 μm, marine microgels are hypothesized to form by spontaneous assembly of free polymer chains of biogenic origin (Chin et al., 1998; Ding et al., 2009), with the surrounding seawater being the major solvent. Although the mechanism of microgel formation can be identical, the process that generates polymeric precursors of protein enriched CSP and of polysaccharide enriched TEP may differ, if only exopolysaccharides and no proteins are actively exuded by phytoplankton. Whether proteins are actively released by phytoplankton remains unclear (Thornton, 2014), but we may assume that there is no benefit for phytoplankton to expend energy on producing extracellular proteins. A primary source of free protein enriched polymers can rather be attributed to compounds of the cytoplasm released via lysis of starved or infected cells, or by the breaking of prey cells as a result of zooplankton grazing (e.g., Møller, 2007; Saba et al., 2011). Differences in the abundance of small sized CSP and TEP in the productive epipelagial can be interpreted accordingly.
The process of generating microgels larger than ≈5 μm can be well-described by the coagulation theory, where the size of gels increases over time as a consequence of continued aggregation (Mari and Burd, 1998). The aggregation rate depends on the total particle concentration, the collision rate, and the stickiness of the particles (McCave, 1984; Burd and Jackson, 2009). The presence of microgels enhances the total number of particle collisions and can thus effectively promote the formation of larger aggregates that involve other particulate organic matter (POM). We note that the microscopic size measurements of the CSP and TEP are two dimensional projections of fractal structures that can already incorporate smaller phytoplankton cells, detritus and bacteria. As TEP and CSP become larger their composition become more heterogeneous (e.g., colonization by bacteria) and their size spectra may eventually coincide with those of typical composite gel-POM aggregates that sink. The number of larger composite aggregates is much lower than of smaller microgels and these particles are hardly captured by the small volumes of our water samples (10–250 mL). Although less abundant, the vertical flux of larger composite gel-POM aggregates and their gradual breakdown (reverse aggregation) likely generate CSP and TEP within the size range <100 μm at depth. Changes in respective size spectra with depth should thus indicate how efficient microgels are exported from the epipelagial, and hydrolyzed and remineralized within the mesopelagial and bathypelagial.
The ingestion of microgels by heterotrophic flagellates and ciliates can introduce variations within specific size ranges. Furthermore, a higher abundance of TEP was shown to incorporate a greater fraction of total bacteria within microgel aggregates (e.g., Mari and Kiørboe, 1996; Mühlenbruch et al., 2018), with implications for the microbial foodweb. Mari and Rassoulzadegan (2004) interpreted the formation and coagulation of microgels and the embedding of bacteria and heterotrophic nanoflagellates in small gel-aggregates as a “trophic elevator” that transfers DOC to higher trophic levels. On the one hand, this mechanism can introduce valuable proteins and carbohydrates as food source for some ciliates whose optimum prey particle size is larger than the size of nanoflagellates and bacteria. Likewise, such trophic elevator has been shown to be active for copepods as well (Ling and Alldredge, 2003). On the other hand, this mechanism can also bypass valuable food as soon as the mixed microgel aggregates become larger than the prey particle size utilizable by some ciliate, e.g., as shown by Mari and Rassoulzadegan (2004) for the ciliate Strombidium sulcatum, whose optimum and maximum prey sizes are approximately 3 and 6 μm, respectively. Interestingly, it is this particular size range in our size spectra of CSP and TEP that vastly deviates from a log-linear relationship according to coagulation theory. However, our spectra between 1 and 6 μm are coarse, which limits making inferences on gel-induced microbial dynamics. In order to resolve changes in microgel size spectra due to variations in the microbial foodweb dynamics in future studies, we suggest deriving KDE size spectra directly from all counted gel particles and their respective individual sizes rather than assigning them to size intervals.
We briefly addressed above the various potential processes that can shape the size spectra of CSP and TEP. Hereafter, we will reconsider some of these aspects in our discussion of the differences between the size spectra at the different ocean regimes.
Global Patterns of Microgel Distribution
Lowest microgel abundance was observed at the two tropical/sub-tropical open ocean sites of the Indian Ocean and SWP. Both sites are characterized by annually low primary productivity and low surface ocean nutrient concentrations, making them representative sites for the oligotrophic open ocean. As autotrophic production is the major source for biopolymers and microgels, low amounts of microgels observed at these sites throughout the water column likely mirror the low productivity of the system. Low average abundance of TEP (<20 μg Xeq. L–1, equivalent to <1 μmol TEP-C L–1) has previously been observed in the epipelagial of the tropical western Pacific Ocean by Yamada et al. (2017), according with our estimates for the tropical/sub-tropical open ocean sites (Table 2). In the epipelagial of the Indian Ocean, relatively higher amounts of TEP were only seen in the small size fraction (<3 μm), whereas CSP clearly exceeded TEP abundance at all sizes. Like in other tropical systems, picoplankton, including picoeukaryotes, Prochlorococcus spp., and in particular Synecchoccus spp., had a relatively high contribution to total autotrophic biomass during the Indian Ocean cruise in 2014, as indicated by pigment composition and their share of total chl a concentration (Booge et al., 2018). In cultures of Synecchococcus spp. a higher production of CSP relative to TEP was observed, with larger microgels also including relatively high amounts of CSP (Cisternas-Novoa et al., 2015). In the absence of larger autotrophs, microgel production may thus be low and driven by picoplankton like Synecchococcus. Comparatively low amounts of microgels in the deeper water column of these two study sites suggest little export of microgels in oligotrophic seas. In fact, with ∼0.03 cm–2 L–1 the bathypelagial of the SWP showed lower amounts of microgels suggesting very low if any input of microgels from overlying waters. This observation is in good accordance with coagulation theory, predicting aggregation rates as a function of total particle abundance (Logan et al., 1995). Hence, aggregation and subsequent sinking of larger particles may be less relevant for microgel loss than heterotrophic degradation in tropical/subtropical systems.
Data from both polar sampling sites showed clear accumulation of microgels in the size range 3–30 μm in the epipelagial compared to the deeper parts of the water column. This accumulation was more pronounced for CSP than for TEP, leading to a relative enrichment of mid-sized CSP in surface waters. Whilst, higher abundance of microgels was observed in the epipelagial of the Southern Ocean, the mesopelagial showed surprisingly similar values for both sites and for both types of microgels. This suggests a substantial loss of microgels in the twilight zone, in particular for protein containing microgels. Microgel degradation is likely driven by microorganisms colonizing the particles and subsiding on their organic content (Grossart et al., 2006; Busch et al., 2017; Zäncker et al., 2019). In polar waters extracellular enzymatic activity has been observed to be higher for proteinaceous material than for sugars, leading to the assumption that polar bacteria degrade proteinaceous organic matter preferentially (Christian and Karl, 1995; Piontek et al., 2014). This view is in accordance with faster decomposition of CSP relative to TEP as suggested previously for the Arctic Ocean by Busch et al. (2017).
High amounts of TEP in surface waters of the Arctic Ocean and specifically inter-annual variability of TEP in the epipelagic Fram Strait have previously been related to the occurrence of the prymnesiophyte Phaeocystis spp., specifically to P. pouchetii (Engel et al., 2017). Phaeocystis spp. is one the main bloom forming phytoplankton species also in the Weddell Sea and was readily abundant during the PS103 cruise (Nöthig, pers. comm.). Phaeocystis spp. produce copious amounts of polysaccharides (Alderkamp et al., 2007). Release of polysaccharides occurs from exponentially growing as well as from senescent cells and can induce TEP formation (Passow and Wassmann, 1994; Reigstad and Wassmann, 2007). Deep export of the typically neutrally buoyant gel particles, however, likely relies on the aggregation with heavier particles, acting as ballast material. Export of organic material, including microgels, that was produced during blooms of Phaeocsystis spp., may thus be restricted to shallow depths. Observations from the Arctic Ocean showed that carbon export attributed to P. pouchettii diminishes quickly over the upper few hundred meters (Reigstad and Wassmann, 2007), supporting relatively high remineralization rates (Le Moigne et al., 2015). Our data for both Polar regions show relatively high concentrations of microgels in the epipelagic zone that decrease rapidly over depth. This is in accordance with previous observations showing high TEP concentrations in the epipelagic Arctic Ocean (range: 5–517 μg Xeq. L–1, equivalent to 0.25–26 μmol TEP-CSFD L–1; Engel et al., 2017) and in the epipelagic Southern Ocean (119 ± 39 μg Xeq. L–1, equivalent to 6.0 ± 2.0 μmol TEP-CSFD L–1, Zamanillo et al., 2019a; <49 μg Xeq. L–1, equivalent to <2.5 μmol TEP-CSFD L–1, Ortega-Retuerta et al., 2009), but relatively low TEP fluxes to depth (Ebersbach et al., 2014). A possible explanation is a high heterotrophic demand for labile organic matter in regions with primary production being temporarily restricted by solar irradiance. Indeed with 0.025 cm2 L–1, the bathypelagial of the Southern Ocean had lowest TEP concentration observed in this study, only little above the detection limit.
In contrast, high concentrations were observed for TEP and CSP in the ETNA upwelling region off Mauretania. High concentration in surface waters of the ETNA upwelling regions have been reported before. Zamanillo et al. (2019b) found the highest TEP concentration along a transect through the Atlantic Ocean in the coastal upwelling associated to the Canary current system (mean: 446 μg Xeq. L–1, equivalent to 22 μmol TEP-CSFD L–1), even exceeding concentration observed in this study (Table 2). In the ETSP upwelling region off Peru, CSP concentrations were one order of magnitude higher than those of TEP. This was a distinctive feature that clearly differs from our findings within the ETNA region. Yet, at both upwelling sites concentrations of microgels in the mesopelagial were higher than at all other sites, and clearly higher also in the bathypelagial of the ETNA. This suggests that highly productive systems, like EBUS, are deep export sites of microgels and therewith of bioavailable organic matter. Export of organic matter in the coastal upwelling system off North West Africa is driven by rapidly sinking particles, ballasted with biogenic minerals, in particular calcium carbonate, and by dust from the nearby Saharan desert (Fischer et al., 2009). Since microgels coagulate easily with other particles like phytoplankton and minerals, export within fast sinking aggregates could explain the observed high TEP concentration in the deep ETNA. Compared with the ETNA, TEP concentrations decreased much more below the epipelagial in the ETSP, suggesting a lower export efficiency of TEP in this system. The phytoplankton community of Peru is dominated by diatoms, dinoflagellates and coccolithophores, in particular during upwelling times. Those species are likely responsible for the observed high TEP concentration in the epipelagial. Yet, the upwelling regions along South West America are also known for their high trophic efficiency, leading to high grazing rates both by zooplankton and small pelagic fish such as anchovy. Thus, heterotrophic consumption in the epipelagial may diminish particle export to depth, resulting also in lower deep export of TEP. Sloppy feeding may also explain the relatively large amounts of CSP observed off Peru; here >80% of all gel particles <60 μm were CSP.
A remarkable feature of both EBUS sites was the relatively higher abundance of small CSP in the deep water column. Only in EBUS, CSP comprised the highest fraction of microgels in the bathypelagial, followed by the meso- and epipelagial. CSP are assumed to contain nutritionally valuable proteinaceous compounds, thus, the productivity signal of the epipelagial in upwelling systems can be traced down to bathypelagic depths. This was also apparent from our estimates of carbon contained in TEP. At both upwelling sites, the bathypelagial showed the highest depth-integrated concentration of TEP-C. Since no estimate for carbon content of CSP is yet available, we could not estimate the amount of carbon contribution of CSP. However, it can be assumed that CSP contribute substantially to organic C and N in upwelling systems, in particular in the ETSP. Here, those particles may even play an important role in organic matter cycling within the oxygen minimum zone (OMZ). Anaerobic microbial processes such as denitrification are often driven by particle associated bacteria, likewise anaerobic ammonium exudation (anammox) depends on organic nitrogen sources (Wright et al., 2012; Löscher et al., 2016). The role of CSP in suboxic zones like in the OMZ off Peru is yet to be exploited.
Connecting Microgels With Current Topics in Marine Research
Potential Sensitivity of Marine Microgels to Ongoing Environmental Change
Marine microgels play a fundamental role in carbon cycling. Around 10% of the annual oceanic primary productivity (45–55 Pg C yr–1) is potentially channeled into TEP (Mari et al., 2017; Thornton, 2018), and likewise, similar values would be expected for CSP. Between 2005 and 2016, 2.6 ± 0.5 Gt C yr–1 of the atmospheric carbon dioxide emitted from human activities was absorbed by the ocean (Le Quéré et al., 2016), inducing higher carbon fixation rates through accelerated phytoplankton growth and release of extracellular substances and marine gels. The biological carbon pump, regarded as the ocean’s ability to store fixed carbon plays an essential role in climate regulation (Jiao et al., 2010) and in fact, the absence of this mechanism would increase the atmospheric CO2 concentration by 50% with respect to present-day values (Le Moigne, 2019). Climate change and related acidification and warming of the surface ocean are supposed to have a variety of consequences for marine carbon and nutrient cycles. Many recent studies highlight strong effects of warming and acidification on microbial metabolic rates and growth dynamics. Acidification and warming will presumably accelerate phytoplankton growth rates, trigger a shift toward pico- and nanophytoplankton (Keller et al., 1999; Sommer and Lengfellner, 2008; Lewandowska and Sommer, 2010; Sommer and Lewandowska, 2011), and increase the rate of extracellular release of organic compounds and the formation of gel particles (e.g., Obernosterer and Herndl, 1995; Engel et al., 2002, 2014; Otero and Vincenzini, 2004; Liu et al., 2010; Borchard and Engel, 2012; Endres et al., 2014). The accumulation of exopolymer substances under elevated CO2 concentrations may reinforce the importance of gel particles in organic matter fluxes, and potentially increase carbon sequestration to depth in the future ocean (Arrigo, 2007; Engel et al., 2014). On the other hand, accelerated microbial degradation activities on gel particles may counteract the export fluxes to the deep sea preserving more organic matter in the surface ocean (Piontek et al., 2010; Endres et al., 2014). These scenarios are likely to happen in a warmer and more acidic future ocean but not necessarily at the same time and place. Instead, besides the effects on marine microbial communities and metabolic activities, the synergy of both warming and acidification may hinder the ability of seawater dispersed DOM to self-assemble into marine microgels: a moderate temperature increase (of about 2°C) is sufficient to slow this process, whereas acidification lowers the temperature threshold at which the reduction in DOM self-assembly is observed (Chen et al., 2015).
Microscopic plastic fragments and fibers, another recently recognized threat to the environment, are widespread in the oceans and have accumulated in the pelagic zone and sedimentary habitats. Due to their stickiness, gel particles may easily attach on such artificial particles (Michels et al., 2018) and the amount of both TEP and CSP increases in their presence (Galgani et al., 2019). Depending on plastic sizes, material, aging and shape, gel particles act as an accelerator for up- or downward transport of organic matter in the water column, modifying plastic particles buoyancy and bioavailability (Galloway et al., 2017) with potential consequences for global carbon sequestration and turnover.
Implications for Air-Sea Exchange
An increase in atmospheric carbon uptake not only affects the amount and flux of gel particles toward depth, but may also promote a vertical flux of gels toward the surface inducing the production of less dense and swollen structures (Mari, 2008). It is well-known that marine microgels accumulate in the sea-surface microlayer, which has been observed globally (Wurl and Holmes, 2008), and regionally (Leck and Bigg, 2005; Orellana et al., 2011; Engel and Galgani, 2016; Galgani et al., 2016; Dreshchinskii and Engel, 2017; Zäncker et al., 2017). Gels accumulate at the surface through bubble scavenging (Robinson et al., 2019). In EBUS, previous work reports an accumulation of CSP in the sea-surface microlayer independently from wind speed, while TEP dependency on wind speed was evident (Engel and Galgani, 2016). The higher response of TEP to wind speed compared to CSP was also observed during wind channel experiments, where higher wind speed shifted the size distribution of polysaccharidic gels toward smaller particles (Sun et al., 2018). Also, higher temperature can favor the presence of gels in the sea-surface microlayer (Yue et al., 2018). When gel particles are found in higher concentration in the sea-surface microlayer with respect to the underlying water, and confer the surface gelatinous slick-like properties, air-sea CO2 exchange may be reduced by 15% (Wurl et al., 2016) due to the increased thickness of the diffusion layer; air-sea gas fluxes are particularly reduced at lower wind speeds (Jähne and Haußecker, 1998). Surface tension forces may compress the compounds at the sea-surface, including marine gels, which later can be ejected as sea-spray aerosols (SSA) through bubble bursting and white caps episodes (Frew and Liss, 2005; de Leeuw et al., 2011). During highly productive periods, a great fraction of SSA with r80 <1 μm (the radius of the particle at a relative humidity of 80%) has an organic composition (O’Dowd et al., 2004; de Leeuw et al., 2011). Many of these particles have a gel-like composition, suggesting that the abundance and size of marine gels in the sea surface may influence the organic fraction of SSA (Russell et al., 2010; Orellana et al., 2011). Aerosols are involved in climate radiative effects both directly, through aerosol optical thickness influencing radiative properties, and indirectly through the cloud-forming capabilities in the smallest size fractions (Andreae and Rosenfeld, 2008).
Marine microgels are thus essential elements in the cycling of carbon not only within the ocean’s interior, but also across the air-sea interface; by mediating the exchange of gases and particles between the ocean and the atmosphere, marine microgels may thus play a significant role in the oceanic control over climate.
Data Availability Statement
All datasets generated for this study are included in the article/supplementary material.
Author Contributions
All authors listed have made a substantial, direct and intellectual contribution to the work, and approved it for publication.
Funding
This work was supported by the Helmholtz Association, by the German Research Foundation through the SFB 754 “Climate – Biogeochemistry Interactions in the Tropical Ocean” sub-project B9, and by the BMBF through SOPRAN II and III (Surface Ocean Processes in the Anthropocene, 03F0611C-TP01 and 03F0662A-TP2.2) and SO255 (03G0255A). This study was also a contribution to the BMBF funded project MicroArc (03F0902A). We thank the Hanse-Wissenschaftskolleg Delmenhorst, Germany, for sponsoring the “Marine Organic Biogeochemistry” workshop in April 2019. The workshop was funded by the Deutsche Forschungsgemeinschaft (DFG, German Research Foundation) – project number: 422798570.
Conflict of Interest
The authors declare that the research was conducted in the absence of any commercial or financial relationships that could be construed as a potential conflict of interest.
Acknowledgments
We thank the captains, chief scientists, and crews of the cruises SO235, SO255, PS103, ARK29, M91, and M107 for help and technical support. We are also grateful to the many people helping with sampling on board or with sample analysis in the lab in particular Anna Anschütz, Kathrin Busch, Vanessa Lampe, Alexandra Loginova, Jon Roa, Ruth Flerus, and several student workers.
References
Alderkamp, A.-C., Buma, A. G. J., and van Rijssel, M. (2007). The carbohydrates of Phaeocystis and their degradation in the microbial food web. Biogeochemistry 83, 99–118. doi: 10.1007/s10533-007-9078-2
Alldredge, A. L., Passow, U., and Logan, B. E. (1993). The abundance and significance of a class of large, transparent organic particles in the ocean. Deep Sea Res. 40, 1131–1140. doi: 10.1016/0967-0637(93)90129-q
Andreae, M. O., and Rosenfeld, D. (2008). Aerosol-cloud-precipitation interactions. Part 1. The nature and sources of cloud-active aerosols. Earth Sci. Rev. 89(Pt 1), 13–41. doi: 10.1016/j.earscirev.2008.03.001
Bar-Zeev, E., Berman-Frank, I., Girshevitz, O., and Berman, T. (2012). Revised paradigm of aquatic biofilm formation facilitated by microgel transparent exopolymer particles. Proc. Natl. Acad. Sci. U.S.A. 109, 9119–9124. doi: 10.1073/pnas.1203708109
Biersmith, A., and Benner, R. (1998). Carbohydrates in phytoplankton and freshly produced dissolved organic matter. Mar. Chem. 63, 131–144. doi: 10.1016/s0304-4203(98)00057-7
Booge, D., Schlundt, C., Bracher, A., Endres, S., Zäncker, B., and Marandino, C. A. (2018). Marine isoprene production and consumption in the mixed layer of the surface ocean – a field study over two oceanic regions. Biogeosciences 15, 649–667. doi: 10.5194/bg-15-649-2018
Borchard, C., and Engel, A. (2012). Organic matter exudation by Emiliania huxleyi under simulated future ocean conditions. Biogeosciences 9, 3405–3423. doi: 10.5194/bg-9-3405-2012
Burd, A. B., and Jackson, G. A. (2009). Particle aggregation. Annu. Rev. Mar. Sci. 1, 65–90. doi: 10.1146/annurev.marine.010908.163904
Busch, K., Endres, S., Iversen, M. H., Michels, J., Nöthig, E.-M., and Engel, A. (2017). Bacterial colonization and vertical distribution of marine gel particles (TEP and CSP) in the arctic fram strait. Front. Mar. Sci. 4:166. doi: 10.3389/fmars.2017.00166
Chen, C.-S., Anaya, J. M., Chen, E. Y. T., Farr, E., and Chin, W.-C. (2015). Ocean warming–acidification synergism undermines dissolved organic matter assembly. PLoS One 10:e0118300. doi: 10.1371/journal.pone.0118300
Chial, H. J., and Splittgerber, A. G. (1993). A comparison of the binding of Coomassie brilliant blue to proteins at low and neutral pH. Anal. Biochem. 213, 362–369. doi: 10.1006/abio.1993.1433
Chin, W.-C., Orellana, M. V., and Verdugo, P. (1998). Spontaneous assembly of marine dissolved organic matter into polymer gels. Nature 391, 568–572. doi: 10.1038/35345
Christian, J. R., and Karl, D. M. (1995). Bacterial ectoenzymes in marine waters: activity ratios and temperature responses in three oceanographic provinces. Limnol. Oceanogr. 40, 1042–1049. doi: 10.4319/lo.1995.40.6.1042
Cisternas-Novoa, C., Lee, C., and Engel, A. (2014). A semi-quantitative spectrophotometric, dye-binding assay for determination of Coomassie blue stainable particles. Methods 12, 604–616. doi: 10.4319/lom.2014.12.604
Cisternas-Novoa, C., Lee, C., and Engel, A. (2015). Transparent exopolymer particles (TEP) and Coomassie stainable particles (CSP): differences between their origin and vertical distributions in the ocean. Mar. Chem. 175, 56–71. doi: 10.1016/j.marchem.2015.03.009
Cunliffe, M., and Murrell, J. C. (2009). The sea urface microlayer is a gelatinous biofilm. ISME J. 3, 1001–1003. doi: 10.1038/ismej.2009.69
de Leeuw, G., Andreas, E. L., Anguelova, M. D., Fairall, C. W., Lewis, E. R., O’Dowd, C., et al. (2011). Production flux of sea spray aerosol. Rev. Geophys. 49:RG2001. doi: 10.1029/2010rg000349
Decho, A. W. (1990). Microbial exopolymer secretions in ocean environments: their role(s) in food webs and marine processes. Oceanogr. Mar. Biolol. Annu. Rev. 28, 73–153.
Ding, Y. X., Hung, C. C., Santschi, P. H., Verdugo, P., and Chin, W. C. (2009). Spontaneous assembly of exopolymers from phytoplankton. Terr. Atmos. Ocean Sci. 20, 741–747.
Dreshchinskii, A., and Engel, A. (2017). Seasonal variations of the sea surface microlayer at the Boknis Eck times series station (Baltic Sea). J. Plankton Res. 39, 943–961. doi: 10.1093/plankt/fbx055
Ebersbach, F., Assmy, P., Martin, P., Schulz, I., Wolzenburg, S., and Nöthig, E.-M. (2014). Particle flux characterisation and sedimentation patterns of protistan plankton during the iron fertilisation experiment LOHAFEX in the Southern Ocean. Deep Sea Res. Part I Oceanogr. Res. Pap. 89, 94–103. doi: 10.1016/j.dsr.2014.04.007
Endres, S., Galgani, L., Riebesell, U., Schulz, K. G., and Engel, A. (2014). Stimulated bacterial growth under elevated pCO2: results from an off-shore mesocosm study. PLoS One 9:e99228. doi: 10.1371/journal.pone.0099228
Engel, A. (2000). The role of transparent exopolymer particles (TEP) in the increase in apparent particle stickiness (alpha) during the decline of a diatom bloom. J. Plankton Res. 22, 485–497. doi: 10.1093/plankt/22.3.485
Engel, A. (2009). “Determination of marine gel particles,” in Practical Guidelines for the Analysis of Seawater, ed. O. Wurl (Boca Raton, FL: CRC Press), doi: 10.1201/9781420073072.ch710.1201/9781420073072.ch7
Engel, A., and Galgani, L. (2016). The organic sea-surface microlayer in the upwelling region off the coast of Peru and potential implications for air–sea exchange processes. Biogeosciences 13, 989–1007. doi: 10.5194/bg-13-989-2016
Engel, A., Goldthwait, S., Passow, U., and Alldredge, A. (2002). Temporal decoupling of carbon and nitrogen dynamics in a mesocosm diatom bloom. Limnol. Oceanogr. 47, 753–761. doi: 10.4319/lo.2002.47.3.0753
Engel, A., and Passow, U. (2001). Carbon and nitrogen content of transparent exopolymer particles (TEP) in relation to their Alcian Blue adsorption. Mar. Ecol. Prog. Ser. 219, 1–10. doi: 10.3354/meps219001
Engel, A., Piontek, J., Grossart, H. P., Riebesell, U., Schulz, K. G., and Sperling, M. (2014). Impact of CO2 enrichment on organic matter dynamics during nutrient induced coastal phytoplankton blooms. J. Plankton Res. 36, 641–657. doi: 10.1093/plankt/fbt125
Engel, A., Piontek, J., Metfies, K., Endres, S., Sprong, P., Peeken, I., et al. (2017). Inter-annual variability of transparent exopolymer particles in the Arctic Ocean reveals high sensitivity to ecosystem changes. Sci. Rep. 7:4129. doi: 10.1038/s41598-017-04106-9
Engel, A., Thoms, S., Riebesell, U., Rochelle-Newall, E., and Zondervan, I. (2004). Polysaccharide aggregation as a potential sink of marine dissolved organic carbon. Nature 428, 929–932. doi: 10.1038/nature02453
Fischer, G., Karakas, G., Blaas, M., Ratmeyer, V., Nowald, N., Schlitzer, R., et al. (2009). Mineral ballast and particle settling rates in the coastal upwelling system off NW Africa and the South Atlantic. Int. J. Earth Sci. 98, 281–298. doi: 10.1007/s00531-007-0234-7
Frew, N. M., and Liss, P. S. (2005). The Role of Organic Films in Air-Sea Gas Exchange. The Sea Surface and Global Change. Cambridge: Cambridge University Press.
Galgani, L., Piontek, J., and Engel, A. (2016). Biopolymers form a gelatinous microlayer at the air-sea interface when Arctic sea ice melts. Sci. Rep. 6:29465. doi: 10.1038/srep29465
Galgani, L., Tsapakis, M., Pitta, P., Tsiola, A., Tzempelikou, E., Kalantzi, I., et al. (2019). Microplastics increase the marine production of particulate forms of organic matter. Environ. Res. Lett. 14:124085. doi: 10.1088/1748-9326/ab59ca
Galloway, T. S., Cole, M., and Lewis, C. (2017). Interactions of microplastic debris throughout the marine ecosystem. Nat. Ecol. Amp Evol. 1:0116. doi: 10.1038/s41559-017-0116
Grossart, H.-P., Czub, G., and Simon, M. (2006). Algae–bacteria interactions and their effects on aggregation and organic matter flux in the sea. Environ. Microbiol. 8, 1074–1084. doi: 10.1111/j.1462-2920.2006.00999.x
Hansell, D. A. (2002). “Chapter 15 – DOC in the global ocean carbon cycle,” in Biogeochemistry of Marine Dissolved Organic Matter, eds D. A. Hansell and C. A. Carlson (San Diego, CA: Academic Press), 685–715. doi: 10.1016/B978-012323841-2/50017-8
Jiao, N., Herndl, G. J., Hansell, D. A., Benner, R., Kattner, G., Wilhelm, S. W., et al. (2010). Microbial production of recalcitrant dissolved organic matter: long-term carbon storage in the global ocean. Nat. Rev. Microbiol. 8, 593–599. doi: 10.1038/nrmicro2386
Joassin, P., Delille, B., Soetaert, K., Harlay, J., Borges, A. V., Chou, L., et al. (2011). Carbon and nitrogen flows during a bloom of the coccolithophore Emiliania huxleyi: modelling a mesocosm experiment. J. Mar. Syst. 85, 71–85. doi: 10.1016/j.jmarsys.2010.11.007
Keller, A. A., Oviatt, C. A., Walker, H. A., and Hawk, J. D. (1999). Predicted impacts of elevated temperature on the magnitude of the winter-spring phytoplankton bloom in temperate coastal waters: a mesocosm study. Limnol. Oceanogr. 44, 344–356. doi: 10.4319/lo.1999.44.2.0344
Le Moigne, F. A. C. (2019). Pathways of organic carbon downward transport by the oceanic biological carbon pump. Front. Mar. Sci. 6:634. doi: 10.3389/fmars.2019.00634
Le Moigne, F. A. C., Poulton, A. J., Henson, S. A., Daniels, C. J., Fragoso, G. M., Mitchell, E., et al. (2015). Carbon export efficiency and phytoplankton community composition in the Atlantic sector of the Arctic Ocean. JGR Oceans 120, 3896–3912. doi: 10.1002/2015jc010700
Le Quéré, C., Andrew, R. M., Canadell, J. G., Sitch, S., Korsbakken, J. I., Peters, G. P., et al. (2016). Global carbon budget 2016. Earth Syst. Sci. Data 8, 605–649. doi: 10.5194/essd-8-605-2016
Leck, C., and Bigg, E. K. (2005). Biogenic particles in the surface microlayer and overlaying atmosphere in the central Arctic Ocean during summer. Tellus 57B, 305–316. doi: 10.1111/j.1600-0889.2005.00148.x
Lewandowska, A., and Sommer, U. (2010). Climate change and the spring bloom: a mesocosm study on the influence of light and temperature on phytoplankton and mesozooplankton. Mar. Ecol. Prog. Ser. 405, 101–111. doi: 10.3354/meps08520
Ling, S. C., and Alldredge, A. L. (2003). Does the marine copepod Calanus pacificus consume transparent exopolymer particles (TEP)? J. Plankton Res. 25, 507–515. doi: 10.1093/plankt/25.5.507
Liu, J., Weinbauer, M. G., Maier, C., Dai, M., and Gattuso, J. P. (2010). Effect of ocean acidification on microbial diversity and on microbe-driven biogeochemistry and ecosystem functioning. Aquat. Microb. Ecol. 61, 291–305. doi: 10.3354/ame01446
Logan, B. E., Passow, U., Alldredge, A. L., Grossartt, H.-P., and Simont, M. (1995). Rapid formation and sedimentation of large aggregates is predictable from coagulation rates (half-lives) of transparent exopolymer particles (TEP). Deep Sea Res. Part II Top. Stud. Oceanogr. 42, 203–214. doi: 10.1016/0967-0645(95)00012-F
Long, R. A., and Azam, F. (1996). Abundant protein-containing particles in the sea. Aquat. Microb. Ecol. 10, 213–221. doi: 10.3354/ame010213
Löscher, C., Bange, H. W., Schmitz, R. A., Callbeck, C. M., Engel, A., Hauss, H., et al. (2016). Water column biogeochemistry of oxygen minimum zones in the eastern tropical North Atlantic and eastern tropical South Pacific Oceans. Biogeosciences 13, 3585–3606. doi: 10.5194/bg-13-3585-2016
Mari, X. (1999). Carbon content and C:N ratio of transparent exopolymeric particles (TEP) produced by bubbling exudates of diatoms. Mar. Ecol. Prog. Ser. 183, 59–71. doi: 10.3354/meps183059
Mari, X. (2008). Does ocean acidification induce an upward flux of marine aggregates? Biogeosciences 5, 1023–1031. doi: 10.5194/bg-5-1023-2008
Mari, X., and Burd, A. (1998). Seasonal size spectra of transparent exopolymeric particles (TEP) in a coastal sea and comparison with those predicted using coagulation theory. Mar. Ecol. Prog. Ser. 163, 63–76. doi: 10.3354/meps163063
Mari, X., and Kiørboe, T. (1996). Abundance, size distribution and bacterial colonization of transparent exopolymeric particles (TEP) during spring in the Kattegat. J. Plankton Res. 18, 969–986. doi: 10.1093/plankt/18.6.969
Mari, X., Passow, U., Migon, C., Burd, A. B., and Legendre, L. (2017). Transparent exopolymer particles: effects on carbon cycling in the ocean. Prog. Oceanogr. 151, 13–37. doi: 10.1016/j.pocean.2016.11.002
Mari, X., and Rassoulzadegan, F. (2004). Role of TEP in the microbial food web structure. I. Grazing behavior of a bacterivorous pelagic ciliate. Mar. Ecol. Prog. Ser. 279, 13–22. doi: 10.3354/meps279013
McCave, I. N. (1984). Size spectra and aggregation of suspended particles in the deep ocean. Deep Sea Res. Part A Oceanogr. Res. Pap. 31, 329–352. doi: 10.1016/0198-0149(84)90088-8
Michels, J., Stippkugel, A., Lenz, M., Wirtz, K., and Engel, A. (2018). Rapid aggregation of biofilm-covered microplastics with marine biogenic particles. Proc. Biol. Sci. 285:20181203. doi: 10.1098/rspb.2018.1203
Møller, E. F. (2007). Production of dissolved organic carbon by sloppy feeding in the copepods Acartia tonsa, Centropages typicus, and Temora longicornis. Limnol. Oceanogr. 52, 79–84. doi: 10.4319/lo.2007.52.1.0079
Mühlenbruch, M., Grossart, H.-P., Eigemann, F., and Voss, M. (2018). Mini-review: phytoplankton-derived polysaccharides in the marine environment and their interactions with heterotrophic bacteria. Environ. Microbiol. 20, 2671–2685. doi: 10.1111/1462-2920.14302
Obernosterer, I., and Herndl, G. J. (1995). Phytoplankton extracellular release and bacterial growth: dependence on the inorganic N:P ratio. Mar. Ecol. Prog. Ser. 116, 247–257. doi: 10.3354/meps116247
O’Dowd, C. D., Facchini, M. C., Cavalli, F., Ceburnis, D., Mircea, M., Decesari, S., et al. (2004). Biogenically driven organic contribution to marine aerosol. Nature 431, 676–680. doi: 10.1038/nature02959
Orellana, M. V., and Leck, C. (2015). “Chapter 9 – Marine microgels,” in Biogeochemistry of Marine Dissolved Organic Matter, 2nd Edn, eds D. A. Hansell and C. A. Carlson (Boston, MA: Academic Press), 451–480. doi: 10.1016/B978-0-12-405940-5.00009-1
Orellana, M. V., Matrai, P. A., Leck, C., Rauschenberg, C. D., Lee, A. M., and Coz, E. (2011). Marine microgels as a source of cloud condensation nuclei in the high Arctic. Proc. Natl. Acad. Sci. U.S.A. 108, 13612–13617. doi: 10.1073/pnas.1102457108
Ortega-Retuerta, E., Reche, I., Pulido-Villena, E., Agustí, S., and Duarte, C. M. (2009). Uncoupled distributions of transparent exopolymer particles (TEP) and dissolved carbohydrates in the Southern Ocean. Mar. Chem. 115, 59–65. doi: 10.1016/j.marchem.2009.06.004
Otero, A., and Vincenzini, M. (2004). Nostoc (Cyanophyceae) goes nude: extracellular polysaccharides serve as a sink for reducing power under unbalanced C/N metabolism. J. Phycol. 40, 74–81. doi: 10.1111/j.0022-3646.2003.03-067.x
Pakulski, J. D., and Benner, R. (1994). Abundance and distribution of carbohydrates in the ocean. Limnol. Oceanogr. 39, 930–940. doi: 10.4319/lo.1994.39.4.0930
Parker, B. C., and Diboll, A. G. (1966). Alcian stains for histochemical localization of acid and sulfated polysaccharides in algae. Phycologia 6, 37–46. doi: 10.2216/i0031-8884-6-1-37.1
Passow, U. (2002). Transparent exopolymer particles (TEP) in aquatic environments. Prog. Oceanogr. 55, 287–333. doi: 10.1016/s0079-6611(02)00138-6
Passow, U., and Alldredge, A. L. (1995). Aggregation of a diatom bloom in a mesocosm: the role of transparent exopolymer particles (TEP). Deep Sea Res. Part II Top. Stud. Oceanogr. 42, 99–109. doi: 10.1016/0967-0645(95)00006-c
Passow, U., and Wassmann, P. (1994). On the trophic fate of Phaeocystis pouchetii (Hariot): IV. The formation of marine snow by P. pouchetii. Mar. Ecol. Prog. Ser. 104, 153–161. doi: 10.3354/meps104153
Piontek, J., Lunau, M., Händel, N., Borchard, C., Wurst, M., and Engel, A. (2010). Acidification increases microbial polysaccharide degradation in the ocean. Biogeosciences 7, 1615–1624. doi: 10.5194/bg-7-1615-2010
Piontek, J., Sperling, M., Nöthig, E.-M., and Engel, A. (2014). Regulation of bacterioplankton activity in Fram Strait (Arctic Ocean) during early summer: the role of organic matter supply and temperature. J. Mar. Syst. 132, 83–94. doi: 10.1016/j.jmarsys.2014.01.003
Redfield, A. C. (1958). The biological control of chemical factors in the environment. Am. Sci. 46, 230A–221A.
Reigstad, M., and Wassmann, P. (2007). Does Phaeocystis spp. contribute significantly to vertical export of organic carbon? Biogeochemistry 83, 217–234. doi: 10.1007/s10533-007-9093-3
Robinson, T.-B., Giebel, H.-A., and Wurl, O. (2019). Riding the plumes: characterizing bubble scavenging conditions for the enrichment of the sea-surface microlayer by transparent exopolymer particles. Atmosphere 10:454. doi: 10.3390/atmos10080454
Russell, L. M., Hawkins, L. N., Frossard, A. A., Quinn, P. K., and Bates, T. S. (2010). Carbohydrate-like composition of submicron atmospheric particles and their production from ocean bubble bursting. Proc. Natl. Acad. Sci. U.S.A. 107, 6652–6657. doi: 10.1073/pnas.0908905107
Saba, G. K., Steinberg, D. K., and Bronk, D. A. (2011). The relative importance of sloppy feeding, excretion, and fecal pellet leaching in the release of dissolved carbon and nitrogen by Acartia tonsa copepods. J. Exp. Mar. Biol. Ecol. 404, 47–56. doi: 10.1016/j.jembe.2011.04.013
Schartau, M., Engel, A., Schröter, J., Thoms, S., Völker, C., and Wolf-Gladrow, D. (2007). Modelling carbon overconsumption and the formation of extracellular particulate organic carbon. Biogeosciences 4, 433–454. doi: 10.5194/bg-4-433-2007
Schlitzer, R. (2015). Ocean Data View. Available online at: http://odv.awi.de (accessed January 30, 2020)Google Scholar
Sommer, U., and Lengfellner, K. (2008). Climate change and the timing, magnitude, and composition of the phytoplankton spring bloom. Glob. Chang. Biol. 14, 1199–1208. doi: 10.1111/j.1365-2486.2008.01571.x
Sommer, U., and Lewandowska, A. (2011). Climate change and the phytoplankton spring bloom: warming and overwintering zooplankton have similar effects on phytoplankton. Glob. Chang. Biol. 17, 154–162. doi: 10.1111/j.1365-2486.2010.02182.x
Sugimura, Y., and Suzuki, Y. (1988). A high-temperature catalytic oxidation method for the determination of non-volatile dissolved organic carbon in seawater by direct injection of a liquid sample. Mar. Chem. 24, 105–131. doi: 10.1016/0304-4203(88)90043-6
Sun, C. C., Sperling, M., and Engel, A. (2018). Effect of wind speed on the size distribution of gel particles in the sea surface microlayer: insights from a wind–wave channel experiment. Biogeosciences 15, 3577–3589. doi: 10.5194/bg-15-3577-2018
Thornton, D. C. O. (2014). Dissolved organic matter (DOM) release by phytoplankton in the contemporary and future ocean. Eur. J. Phycol. 49, 20–46. doi: 10.1080/09670262.2013.875596
Thornton, D. C. O. (2018). Coomassie stainable particles (CSP): protein containing exopolymer particles in the Ocean. Front. Mar. Sci. 5:206. doi: 10.3389/fmars.2018.00206
Verdugo, P. (2012). Marine microgels. Annu. Rev. Mar. Sci. 4, 375–400. doi: 10.1146/annurev-marine-120709-142759
Verdugo, P., Alldredge, A. L., Azam, F., Kirchman, D. L., Passow, U., and Santschi, P. H. (2004). The oceanic gel phase: a bridge in the DOM–POM continuum. Mar. Chem. 92, 67–85. doi: 10.1016/j.marchem.2004.06.017
Wood, A. M., and Van Valen, L. M. (1990). Paradox Lost? On the release of energy-rich compounds by phytoplankton. Mar. Microb. Food Webs 4, 103–116.
Wright, J. J., Konwar, K. M., and Hallam, S. J. (2012). Microbial ecology of expanding oxygen minimum zones. Nat. Rev. Microbiol. 10, 381–394. doi: 10.1038/nrmicro2778
Wurl, O., and Holmes, M. (2008). The gelatinous nature of the sea-surface microlayer. Mar. Chem. 110, 89–97. doi: 10.1016/j.marchem.2008.02.009
Wurl, O., Stolle, C., Van Thuoc, C., The Thu, P., and Mari, X. (2016). Biofilm-like properties of the sea surface and predicted effects on air–sea CO2 exchange. Prog. Oceanogr. 144, 15–24. doi: 10.1016/j.pocean.2016.03.002
Yamada, Y., Yokokawa, T., Uchimiya, M., Nishino, S., Fukuda, H., Ogawa, H. et al. (2017). Transparent exopolymer particles (TEP) in the deep ocean: full-depth distribution patterns and contribution to the organic carbon pool. Mar. Ecol. Prog. Ser. 583:81–93. doi: 10.3354/meps12339
Yue, W.-Z., Sun, C.-C., Shi, P., Engel, A., Wang, Y.-S., and He, W.-H. (2018). Effect of temperature on the accumulation of marine biogenic gels in the surface microlayer near the outlet of nuclear power plants and adjacent areas in the Daya Bay, China. PLoS One 13:e0198735. doi: 10.1371/journal.pone.0198735
Zamanillo, M., Ortega-Retuerta, E., Nunes, S., Estrada, M., Sala, M. M., Royer, S. J., et al. (2019a). Distribution of transparent exopolymer particles (TEP) in distinct regions of the Southern Ocean. Sci. Total Environ. 691, 736–748. doi: 10.1016/j.scitotenv.2019.06.524
Zamanillo, M., Ortega-Retuerta, E., Nunes, S., Rodríguez-Ros, P., Dall’Osto, M., Estrada, M., et al. (2019b). Main drivers of transparent exopolymer particle distribution across the surface Atlantic Ocean. Biogeosciences 16, 733–749. doi: 10.5194/bg-16-733-2019
Zäncker, B., Bracher, A., Röttgers, R., and Engel, A. (2017). Variations of the organic matter composition in the sea surface microlayer: a comparison between open ocean, coastal, and upwelling sites off the peruvian coast. Front. Microbiol. 8:2369. doi: 10.3389/fmicb.2017.02369
Keywords: transparent exopolymer particles (TEP), coomassie stainable particles (CSP), DOC (dissolved organic carbon), particle size spectra, water column
Citation: Engel A, Endres S, Galgani L and Schartau M (2020) Marvelous Marine Microgels: On the Distribution and Impact of Gel-Like Particles in the Oceanic Water-Column. Front. Mar. Sci. 7:405. doi: 10.3389/fmars.2020.00405
Received: 11 January 2020; Accepted: 11 May 2020;
Published: 05 June 2020.
Edited by:
Stuart Wakeham, University of Georgia, United StatesReviewed by:
Roberta L. Hansman, IAEA International Atomic Energy Agency, MonacoEva Ortega-Retuerta, UMR 7621 Laboratoire d’Océanographie Microbienne (LOMIC), France
Copyright © 2020 Engel, Endres, Galgani and Schartau. This is an open-access article distributed under the terms of the Creative Commons Attribution License (CC BY). The use, distribution or reproduction in other forums is permitted, provided the original author(s) and the copyright owner(s) are credited and that the original publication in this journal is cited, in accordance with accepted academic practice. No use, distribution or reproduction is permitted which does not comply with these terms.
*Correspondence: Anja Engel, aengel@geomar.de