Linking Spatial and Temporal Dynamic of Bacterioplankton Communities With Ecological Strategies Across a Coastal Frontal Area
 Clarisse Lemonnier1,2*
  Morgan Perennou2
  Damien Eveillard3
  Antonio Fernandez-Guerra4,5,6
  Aude Leynaert2
  Louis Marié7
  Hilary G. Morrison8 Laurent Memery2
  Christine Paillard2
  Lois Maignien1,8*
- 1Univ Brest (UBO), CNRS, IFREMER, Laboratoire de Microbiologie des Environnements Extrêmes, Plouzané, France
- 2Univ Brest (UBO), CNRS, IRD, Ifremer, Laboratoire des Sciences de l’Environnement Marin, Plouzané, France
- 3Univ Nantes, CNRS, Centrale Nantes, IMTA, Laboratoire des Sciences Numériques de Nantes, Nantes, France
- 4Microbial Genomics and Bioinformatics Research Group, Max Planck Institute for Marine Microbiology, Bremen, Germany
- 5Lundbeck Foundation GeoGenetics Centre, GLOBE Institute, University of Copenhagen, Copenhagen, Denmark
- 6Center for Marine Environmental Sciences, University of Bremen, Bremen, Germany
- 7Univ Brest, CNRS, IRD, Ifremer, Laboratoire d’Océanographie Physique et Spatiale, Plouzané, France
- 8Marine Biological Laboratory, Josephine Bay Paul Center for Comparative Molecular Biology and Evolution, Woods Hole, MA, United States
Ocean frontal systems are widespread hydrological features defining the transition zone between distinct water masses. They are generally of high biological importance as they are often associated with locally enhanced primary production by phytoplankton. However, the composition of bacterial communities in the frontal zone remains poorly understood. In this study, we investigate how a coastal tidal front in Brittany (France) structures the free-living bacterioplankton communities in a spatio-temporal survey across four cruises, five stations and three depths. We used 16S rRNA gene surveys to compare bacterial community structures across 134 seawater samples and defined groups of co-varying taxa (modules) exhibiting coherent ecological patterns across space and time. We found that bacterial communities composition was strongly associated with the biogeochemical characteristics of the different water masses and that the front act as an ecological boundary for free-living bacteria. Seasonal variations in primary producers and their distribution in the water column appeared as the most salient parameters controlling heterotrophic bacteria which dominated the free-living community. Different dynamics of modules observed in this environment were strongly consistent with a partitioning of heterotrophic bacterioplankton in oligotroph and copiotroph ecological strategies. Oligotroph taxa, dominated by SAR11 Clade members, were relatively more abundant in low phytoplankton, high inorganic nutrients water masses, while copiotrophs and particularly opportunist taxa such as Tenacibaculum sp. or Pseudoalteromonas sp. reached their highest abundances during the more productive period. Overall, this study shows a remarkable coupling between bacterioplankton communities dynamics, trophic strategies, and seasonal cycles in a complex coastal environment.
Introduction
Bacteria dominate the marine environment in abundance, diversity and activity where they support critical roles in the functioning of marine ecosystems and oceanic biogeochemical cycles (Cotner and Biddanda, 2002; Falkowski et al., 2008; Madsen, 2011). In the coastal environment, they are closely associated with other planktonic organisms (e.g., viruses, phytoplankton and zooplankton) during the recycling of organic matter and inorganic nutrients through the so-called microbial loop (Azam and Malfatti, 2007; Pomeroy et al., 2007). They form complex and highly dynamic assemblage (Giovannoni and Vergin, 2012), with bacterioplankton diversity variations in space and time linked to changes in functional diversity (Galand et al., 2018). Therefore, understanding how the bacterioplankton composition varies in the environment remains one of the central question to elucidate so that we can better understand coastal ecosystem functioning (Fuhrman et al., 2015).
Phytoplankton development represents a major source of organic matter for heterotrophic bacteria in the water column. During their growth and upon bloom termination, algae release a complex bulk of dissolved organic matter that is almost only available for bacteria (Fenchel and Jørgensen, 1977; Azam, 1998). This organic matter processing requires diverse heterotrophic bacterioplankton among which one could find members of Bacteriodetes (Flavobacteriacae), Roseobacter group, Gammaproteobacteria, and Verrucomicrobia (Buchan et al., 2014). These taxa contribute to the complexity of the marine ecosystem via different adaptive strategies, owing to the unequal access to their respective resource (Stocker, 2012; Luo and Moran, 2014). For instance, heterotrophs are generally distinguished as either oligotrophs or copiotrophs that compete at low and high nutrient concentrations respectively (Koch, 2001; Giovannoni et al., 2014). They also present different degrees of ecological specialization, with generalist bacteria able to assimilate a broad variety of substrates, while specialists will compete for a narrow range of nutrients (Mou et al., 2008). Analysis of these ecological traits offer a simplified view of complex microbial communities and has gained interest for better understanding the dynamics of natural microbial communities and to gain insight into their role in the ecosystem (Raes et al., 2011; Krause et al., 2014; Haggerty and Dinsdale, 2017).
Marine fronts are common mesoscale features in the ocean and are located at the transition between water masses of different physicochemical characteristics that actively shape the distribution of microbial organisms (phytoplankton, zooplankton, and bacteria). Driven by currents and mixing, local nutrient input in the vicinity of the front generally enhances primary and secondary production, making the frontal zone an area of high biological importance (Olson and Backus, 1985) and of critical influence on the microbial processing of organic matter (Heinänen et al., 1995; Baltar et al., 2015). However, the bacterial communities’ composition involved in such dynamic systems remains to be investigated (Baltar et al., 2016).
The Ushant Front in the Iroise Sea (Brittany, France) is considered as a model for coastal tidal front (Le Fèvre, 1986). Its position and characteristics are highly dynamic and influenced by atmospheric forcing and tidal currents which are strong in this area (Le Boyer et al., 2009). It occurs from May to October and leads to contrasting physicochemical environments with higher phytoplankton biomass at the frontal area (Le Fèvre et al., 1983). West of the front, stratification results in warmer oligotrophic surface waters and colder nutrient-rich deeper waters separated by a marked thermocline. East of the front, associated with highly variable conditions, permanently mixed coastal waters are characterized by an unlimited quantity of inorganic nutrients but with highly fluctuating conditions. These contrasting water masses structure the distribution of primary producers with the dominance of small phytoplankton and dinoflagellates in surface stratified waters and diatoms in mixed waters (Videau, 1987; Grepma, 1988; Birrien et al., 1991).
In this study, we investigated how such contrasting physicochemical and biological parameters will drive free-living bacterioplankon community structure. We then tested the hypothesis that the contrasted distribution of primary producers will select for bacteria with different adaptative strategies. To do so, using a network analysis we defined groups of co-varying bacterial OTUs that present the same dynamic across the samples, postulating that they may share the same ecological niches.
Materials and Methods
Study Site and Sampling Design
For this study, we completed four east-west transects of about 60 km across the Iroise sea in September 2014 (the 9th, 10th, and 11th), March 2015 (the 10th, 11th, and 12th), July 2015 (the 1st, 2nd, and 3rd) and September 2015 (the 8th, 9th, and 10th) aboard the R/V Albert Lucas. Station positions remained identical across cruises and were designed to span the front (Figure 1A). Station 5 (48°25 N, 5°30 W) is the most offshore station and is characterized by a strong stratification in summer. Station 4 (48°25 N, 5°20 W) and Station 3 (48°20 N, 5°10 W) are closer the front. Station 2 (48°15 N, 5°00 W) is present in the mixed area and Station 1 (48°16 N, 4°45 W) is the most coastal station, near the outflow of the Bay of Brest. At each station, we obtained CTD profiles to assess the physical characteristics of the water column and establish the depth designed to capture the important biological and chemical features of the water column at the surface, bottom and Deep Chlorophyll Maximum (DCM).
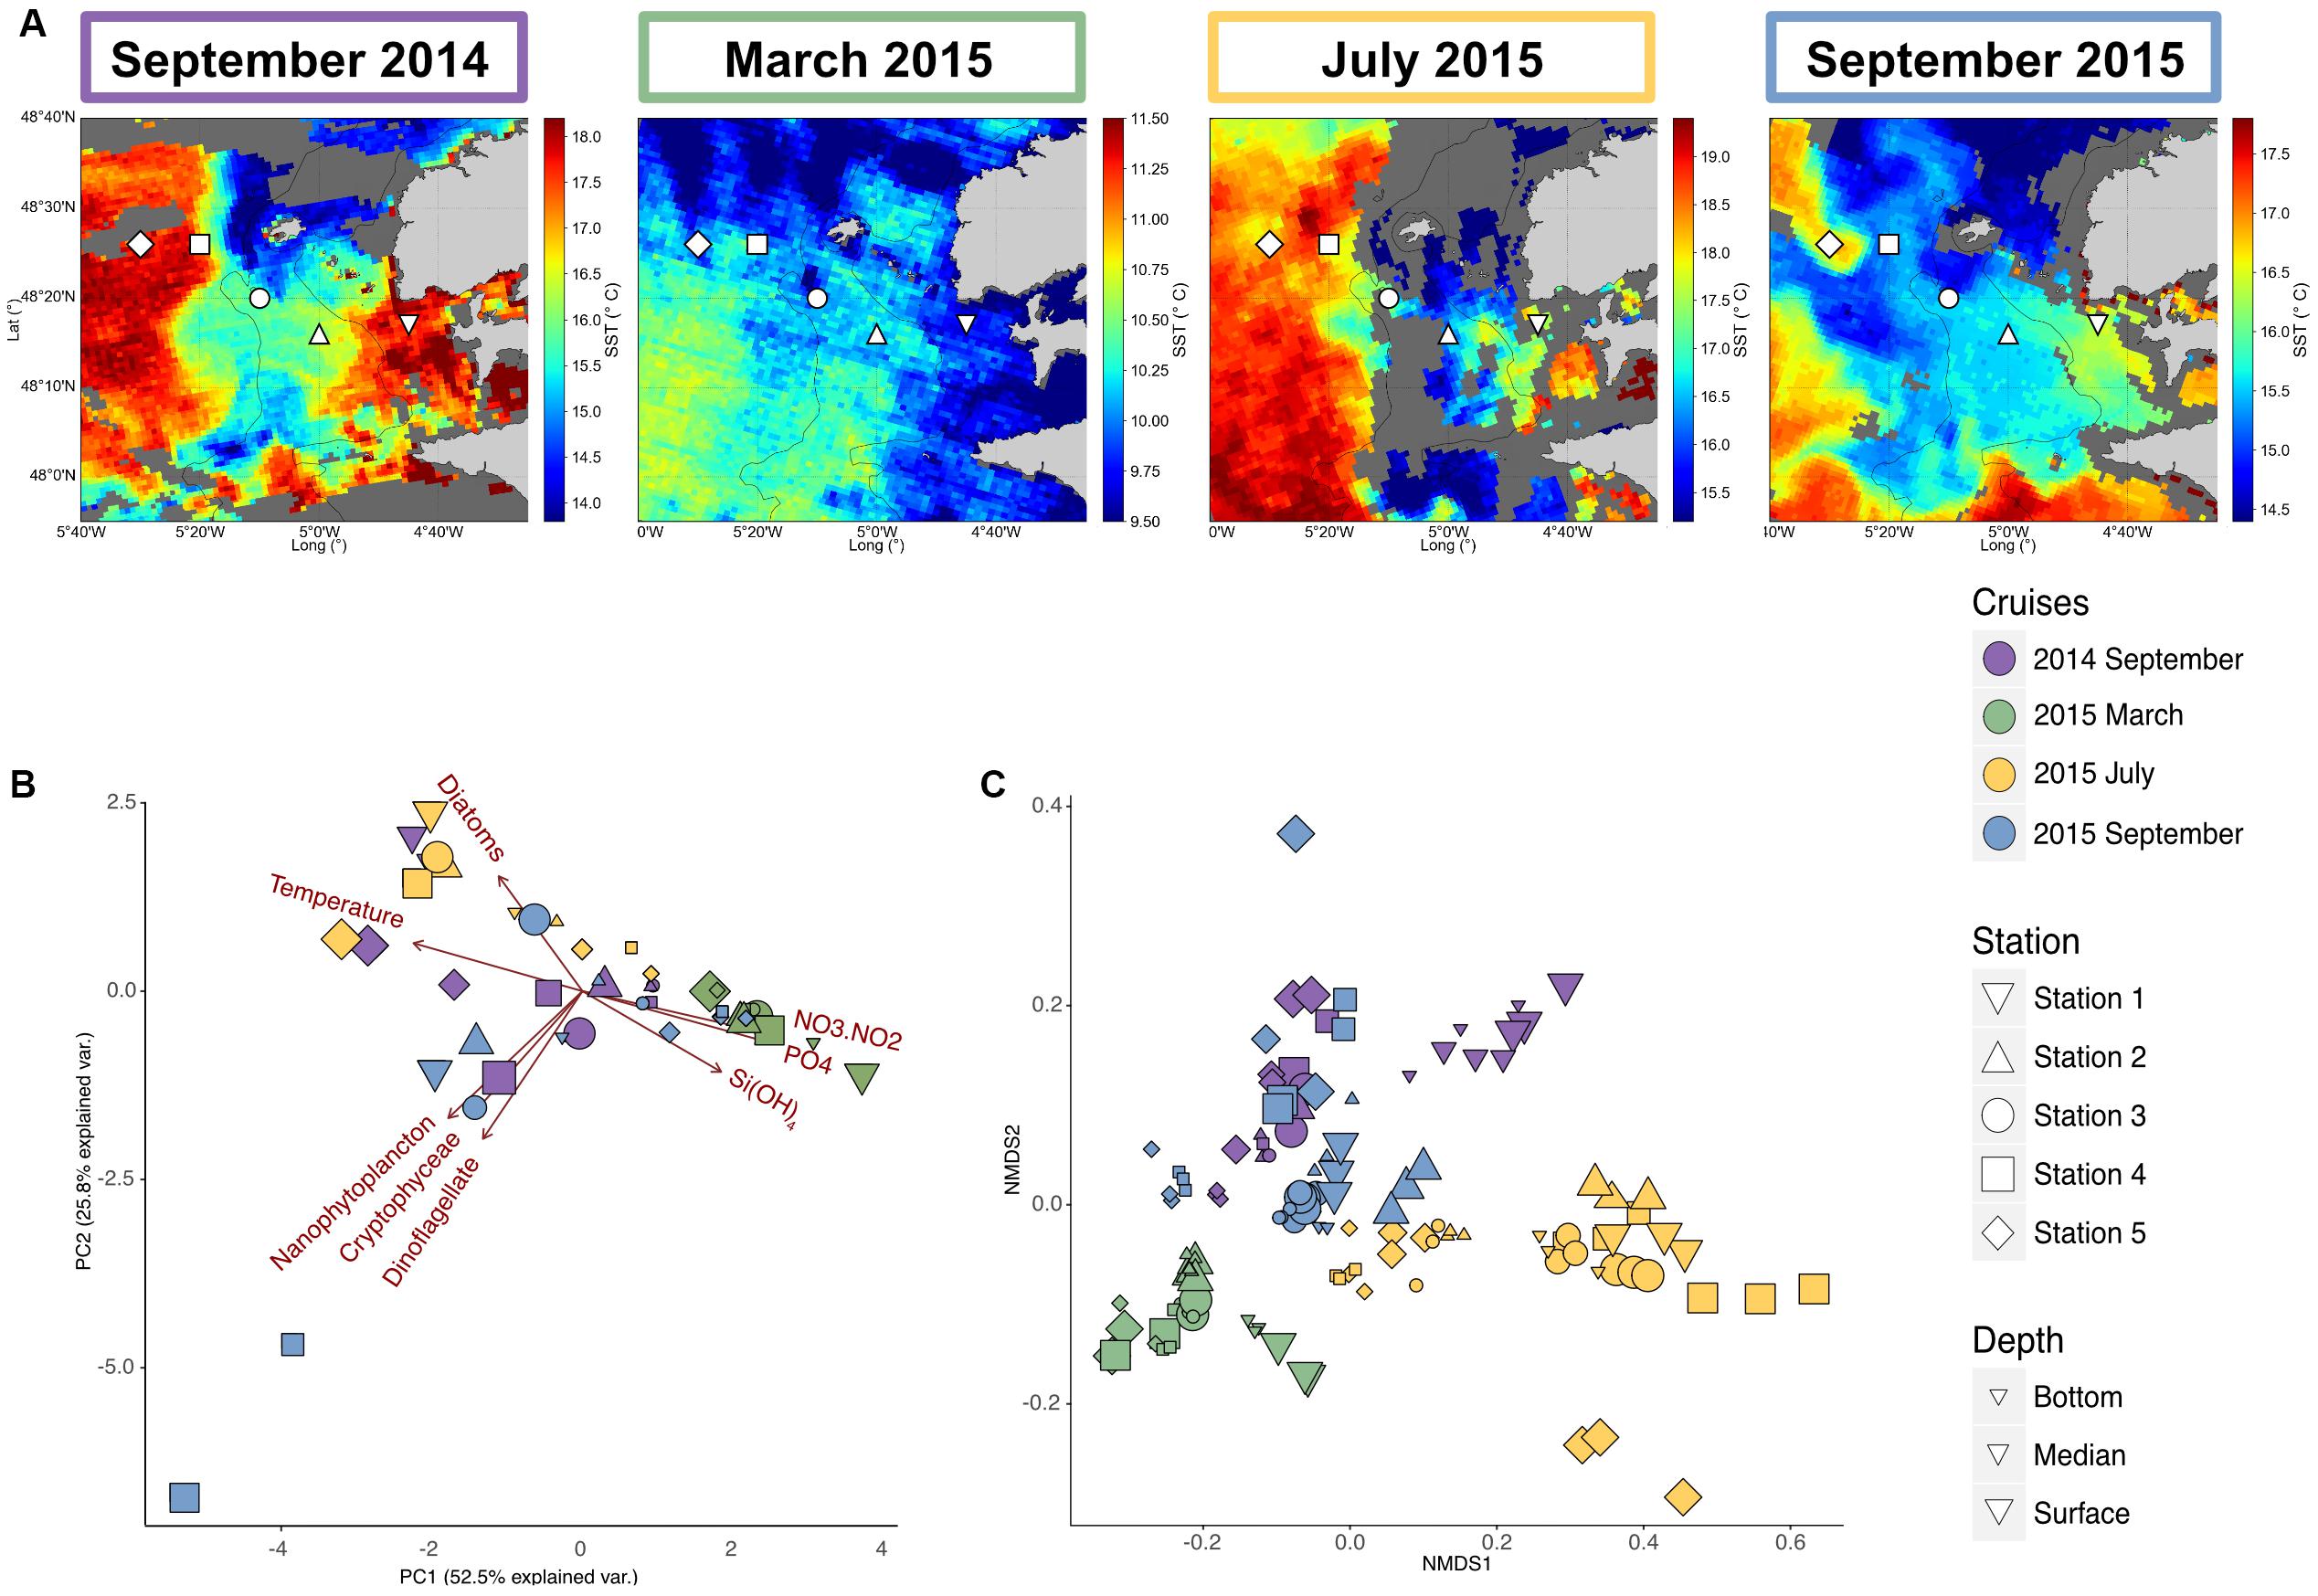
Figure 1. Environmental and bacterial communities characteristics of the Iroise Sea for the different cruises. (A) Map of the Satellite Sea Surface Temperatures (SST) in the Iroise Sea for each cruise (September 2014 the 8th, March 2015 the 6th, July 2015 the 2nd and September 2015 the 8th), highlighting in the summer cruises the presence of the Ushant front that separates offshore warm stratified waters and coastal cooler mixed waters. The shape corresponds to the different stations sampled, with at each time 2 or 3 depths. Surface waters are highly dynamic and some eddies are conspicuous during September 2015, bringing cold water into surface stratified waters. Thus SST map are not enough to define the frontal area and vertical profiles are needed to characterize the different water masses (Supplementary Data Sheet S1). (B) Principal Component Analysis of the environmental characteristics for the different samples (n = 49) based on temperature, inorganic nutrients [Si(OH)4, NO3 + NO2, PO4] concentrations and microscopic count of the different phytoplanktonic groups (Diatom, Nanophytoplankton, Cryptohyceae, and Dinoflagellate). (C) NMDS of the bacterial diversity based on Bray-Curtis dissimilarities among the different cruises, stations and depth (stress = 0.091). For bacterial diversity, biological triplicates were done for each station and depth, explaining the higher number of samples (n = 135).
Nutrients, Phytoplankton Counts, and Pigment Analyses
Seawater was sampled at each depth for nutrients, biogenic silica (BSi), chlorophyll a (Chl a), particulate organic carbon and nitrogen (POC/PON) concentrations, and microscopic phytoplankton cell counts and identification. Dissolved inorganic phosphate (DIP) and silicate (DSi) concentrations were determined from seawater filtered on Nucleopore membrane filters (47 mm) and dissolved inorganic nitrogen (DIN) on Whatman GF/F filters (25 mm). Filters for DIN and DIP were then frozen, whereas filters for DSi were kept at 4°C in the dark. Concentrations were later determined in the laboratory by colorimetric methods using segmented flow analysis (Auto-analyzer AA3HR Seal-Analytical) (Aminot and Kérouel, 2007). BSi was determined from particulate matter collected by filtration of 1 L of seawater through 0.6 μm polycarbonate membrane filter. The analysis was performed using the alkaline digestion method (Ragueneau and Tréguer, 1994). Total Chl a and phaeopigments (Pheo) were determined in particulate organic matter collected on 25 mm Whatman GF/F filters. The filters were frozen (−20°C) and analyzed later by a fluorometric acidification procedure in 90% acetone extracts (Holm-Hansen et al., 1965). Particulate material for POC/PON measurements was recovered on pre-combusted (450°C, 4 h) Whatman GF/F filters. Samples were then analyzed by combustion method (Strickland and Parsons, 1972), using a CHN elemental analyzer (Thermo Fischer Flash EA 1112). Phytoplankton samples were fixed with Lugol’s solution and cell counts were carried out using the Lund et al. (1958) method (Lund et al., 1958).
Bacterioplankton Community Sampling
Seawater for bacterial diversity analysis was collected at different depths using Niskin bottles and directly poured in 5 L sterile carboys previously rinsed three times with the sample. For each depth, three biological replicates samplings were done, consisting of three different Niskin deployments, except Station 4 in September 2014. Filtrations started in the on-shore laboratory 3–4 h after sampling. Water samples were size-fractionated using three in-line filters of different porosity: 10 μm, 3 μm (PC membrane filters, Millipore® and 0.22 μm (Sterivex® filters, with PES membrane). In this study, we focused only on the 0.22–3 μm free-living fraction. All filters were frozen in liquid nitrogen before storage at −80°C. In total, 2 to –5 liters of seawater were filtered each time, depending on filter saturation.
DNA Extraction and Sequencing
Half-filters were directly placed in Matrix B® tubes (filled with 0.1 mm silicate beads, MP Biomedicals) with lysis buffer (Tris pH 7.0, EDTA pH 8.0 and NaCl), SDS 10% and Sarkosyl 10% and subjected to physical lysis for 5 min on a vortex plate. The liquid fraction was then collected in order to perform a phenol-chloroform extraction using PCI (Phenol, Cholorophorm Isoamyl alcohol with a ratio of 25:24:1) and a precipitation step with isopropanol and 5 M sodium acetate. DNA was resuspended in 100 μL of sterile water.
Bacterial diversity was assessed by targeting the v4-v5 hypervariable regions of 16S rDNA with the primers 518F (CCAGCAGCYGCGGTAAN)/926R (CCGTCAATTCNTTTRA GT–CCGTCAATTTCTTTGAGT – CCGTCTATTCCTTTGA NT) (Nelson et al., 2014). PCR products were purified using Ampure XP® kit and DNA quantity was measured using Picogreen® staining and a plate fluorescence reader (TECAN® infinite M200 Pro). Each sample was diluted to the same concentration and pooled before sequencing on an Illumina MiSeq sequencer at the Marine Biological Laboratory (Woods Hole MA, United States).
Bioinformatics Analysis
We obtained 22,523,398 raw reads, with a range from 31,583 to 2,001,687 reads per sample. Reads were merged and quality-filtered according to recommendations in Minoche et al. (2011) using the Illumina-utils scripts (Eren et al., 2013). Those steps removed 17% of all the sequences. We used the Swarm algorithm (Mahé et al., 2014) to cluster the 18,876,655 remaining sequences into 1,611,447 operational taxonomic unit OTUs. Chimera detection was done using vsearch de novo (Rognes et al., 2016) resulting in 281,825 filtered OTUs. Taxonomic annotation for each OTU was done with the SILVA database v123 (Quast et al., 2012) using the mothur classify.seqs command (Schloss et al., 2009). 19,516 OTUs (1,247,339 sequences) were affiliated with non-bacterial taxa (e.g., archaea, chloroplasts, mitochondria, eukaryota) and removed from the dataset. As a result, we obtained 262,308 OTUs for 134 samples, with a large number of singletons (205,292 OTUs), that were kept along the statistical analysis.
Statistical Analysis
Libraries were normalized for read number using DESeq package in R (Anders and Huber, 2010). A visualization of the bacterial community structure similarity was assessed with an NMDS based on Bray-Curtis dissimilarities using vegan R package (Oksanen et al., 2007). Influence of depth, station and sampling time on bacterial communities was investigated using a permutational multivariate analysis of variance (PERMANOVA) based on Bray-Curtis dissimilarities and 999 permutations. We used Principal Composant Analysis (PCA) ordination to characterize water samples environmental parameters. Finally, we examined the presence of biomarker OTUs (i.e., OTUs with a significant higher relative abundance in a given condition) of the different stations within each cruise using the LEfSe software (Segata et al., 2011).
Network Analysis
Network analysis was done based on a truncated matrix only containing the most abundant OTUs with more than 50 sequences in at least three samples. The filtered matrix contained 681 OTUs that accounted for 79% of all the sequences. This filtering step was necessary to avoid false positive correlations in the network analysis. Our module detection analysis followed part of the pipeline of Chafee et al. (2018). First, the application of SPIEC-EASI computes pairwise co-variance based correlation between OTUs in order to address the sparsity and composition issues inherent to microbial abundance data (Kurtz et al., 2015). The possible interaction was then inferred using the glasso probabilistic inference model with a lambda.min.ratio of 0.01. Based on this model, only the significant covariance values were extracted and transformed into a correlation matrix using the cov2cor() function.
We then delineated network modules as groups of highly interconnected OTUs that presented very close variations in relative abundances across the studied samples. Those modules were defined using the Louvain algorithm (Blondel et al., 2008). We used Gephi (Bastian et al., 2009) and Force Atlas 2 layout algorithm to generate a vizualization of the main correlations (>0.3). Module eigengenes (ME, the first principal component, considered a representative of the OTUs distribution of a given module) were calculated based on the relative abundance matrix using WGCNA function moduleEigengenes() (Langfelder and Horvath, 2008). Those ME were used to calculate Pearson correlations between the different modules and the environmental variables, using the WGCNA commands moduleTraitCor(), moduleTraitPvalue().
We used the methods proposed by Newton et al. to infer the trophic strategy of OTUs within each modules (Newton and Shade, 2016). In that study, they differentiated opportunist taxa with high abundance variability in space and time, and marathoners with low abundance variability. They distinguished these using the Coefficient of Variation (CV) of OTU dynamic combined with their abundance and prevalence in the samples. Based on their method, we defined high CV opportunist OTUs (or HCV) as OTUs above 5% upper boundary of the linear modeling 95% confidence interval in a CV plot against OTU occurrence. Conversely, we defined low CV marathoners OTUs (or LCV) as OTUs below the 5% lower boundary of the linear modeling. In our analysis, OTU occurrence was defined by a relative abundance >0.05%.
All the scripts used for this analysis are available at: https://loimai.github.io/BBobs/.
Results
Environmental Settings
This study was carried out between September 2014 and September 2015 in the Iroise Sea, off Brittany (Northeast Atlantic), in the vicinity of the Ushant island. The Ushant front position and characteristics were estimated using Satellite Surface Temperature (SST) maps (Figure 1) and CTD data collected at the dates of sampling (Supplementary Data Sheet S1). The March 2015 sampling took place before the onset of the Ushant front and presented a homogeneous temperature around 10°C across all the stations. High nutrient concentrations at all stations [Si(OH)4: 1.82–4.38 μM, nitrates: 5.88–12.13 μM, Supplementary Data Sheet S2], low surface Chl a (<1 μg.L–1 except for Station 1, Supplementary Data Sheet S3) and overall low phytoplankton cells counts observed during this cruise (Supplementary Data Sheet S2) indicated that sampling occurred prior to the development of the phytoplankton spring blooms. In summer (September 2014, July 2015 and September 2015), SST maps showed a sharp transition between coastal and offshore temperatures confirming the presence of a frontal system. The different observed stratification regimes (Supplementary Data Sheet S1) coincided with distinct physicochemical patterns and phytoplanktonic patterns across seasons (Figure 1B and Supplementary Data Sheet S2). In late summer (September samples), offshore deep waters shared close characteristics with winter waters (March sample, Temperature: 11.7–12.3°C), with few phytoplankton cells, similar concentration of Si(OH)4 (1.61–3 μM) and nitrates (3.99–6.41 μM). Conversely, surface waters presented high temperatures (14.7–18.2°C), a nutrient depletion [Si(OH)4: 0.02–1.65 μM, N02 + N03: 0.00–0.09 μM] and high phytoplankton cell counts. In early summer (July), inorganic nutrient concentrations were overall lower than in September, probably consumed by the spring bloom coinciding with the onset of the front around May–June. A significant bloom occurred at stations 2 and 3, on the 27th of June, 5 days before the sampling period as seen in the satellite surface Chl a observations (Supplementary Data Sheet S3B).
Bacterial Community Dynamics in the Iroise Sea
In the Iroise Sea, free-living bacterial community structure presented clear time and spatial patterns as shown in the NMDS ordination plot (Figure 1C, for each cruise separately see Supplementary Data Sheet S4). Firstly, community structure displayed strong seasonality, with sample primarily grouping by sampling cruises. We also observed similar communities in stratified waters of September 2014 and 2015 samples (Figure 1C), suggesting that these seasonal pattern were recurring.
Besides, we also observed an important spatial influence, as within each sampling cruise, communities were markedly different between stations. In winter samples, communities were highly similar throughout the water column [Depth was non-significant, Permanova Pr(>f) = 0.225], but presented a coastal to offshore gradient [Station was significant, Permanova Pr(>f) = 0.001, Supplementary Data Sheet S4] that followed a gradient of salinity, temperature and inorganic nutrient (Supplementary Data Sheet S2). Conversely, in September, when the front was the strongest, free-living bacterial communities were much more heterogeneous with clear patterns associated to the set-up of the front: stratification resulted in highly diverging communities with depth [Depth Pr(>f) = 0.004], while this pattern was not seen for the mixed and coastal samples [Depth was not significant, Pr(> f) = 0.222 and 0.434, Supplementary Data Sheet S4]. In July, the patterns were mostly associated with depth for all the stations, except station 1 (Supplementary Data Sheet S4).
Overall, bacterial communities structure followed the different water masses, mirroring environmental physicochemical variations represented in the PCA plot of environmental variables (Figure 1B): deep water communities in the summer crews remained more similar to winter communities (Figure 1C). In contrast, surface bacterial communities in stratified regimes and in most of the stations in July departed from this typical winter structure. In addition, for these summer cruises, the DCM samples either cluster with surface or deep samples. This could be explained by the difficulty to sample the DCM precisely, as its depth can vary between the CTD measurements and the biological sampling.
Using the LefSe algorithm (Segata et al., 2011), we found that some stations displayed specific biomarker OTUs within each sampling time (Supplementary Data Sheet S5). Biomarkers such as OTU1 (Amylibacter) and OTU4 (Planktomarina) were found at the most near-shore station (Station 1) in September 2014 and March 2015 and other biomarkers were found in surface stratified waters in early summer (OTU29 NS4 marine group) and late summer (OTU10 Synechococcus) cruises, but no biomarker was identified for the mixed and frontal stations except in July 2015 at Station 2 with OTU35 (Aliivibrio) and OTU74 (Pseudoalteromonas).
Description of Modules
We further investigated groups of co-varying OTUs that could potentially share the same ecological niches in this partitioned marine environment via a co-occurrence network analysis. In the inferred network, we were able to identify 14 sub-networks (Figures 2A,B) defining groups of OTUs (termed modules) with similar distribution patterns across the entire study. Two modules (5 and 4) were dominant in our dataset and respectively accounted for 32.7 and 20.9% of all sequences. Eight modules represented between 1.6 and 14.2%, and four were rarer with less than 1% abundance. The OTU taxonomy in each module is summarized in Supplementary Data Sheet S6 and Figure 4 presents the distribution of the dominant families among each module.
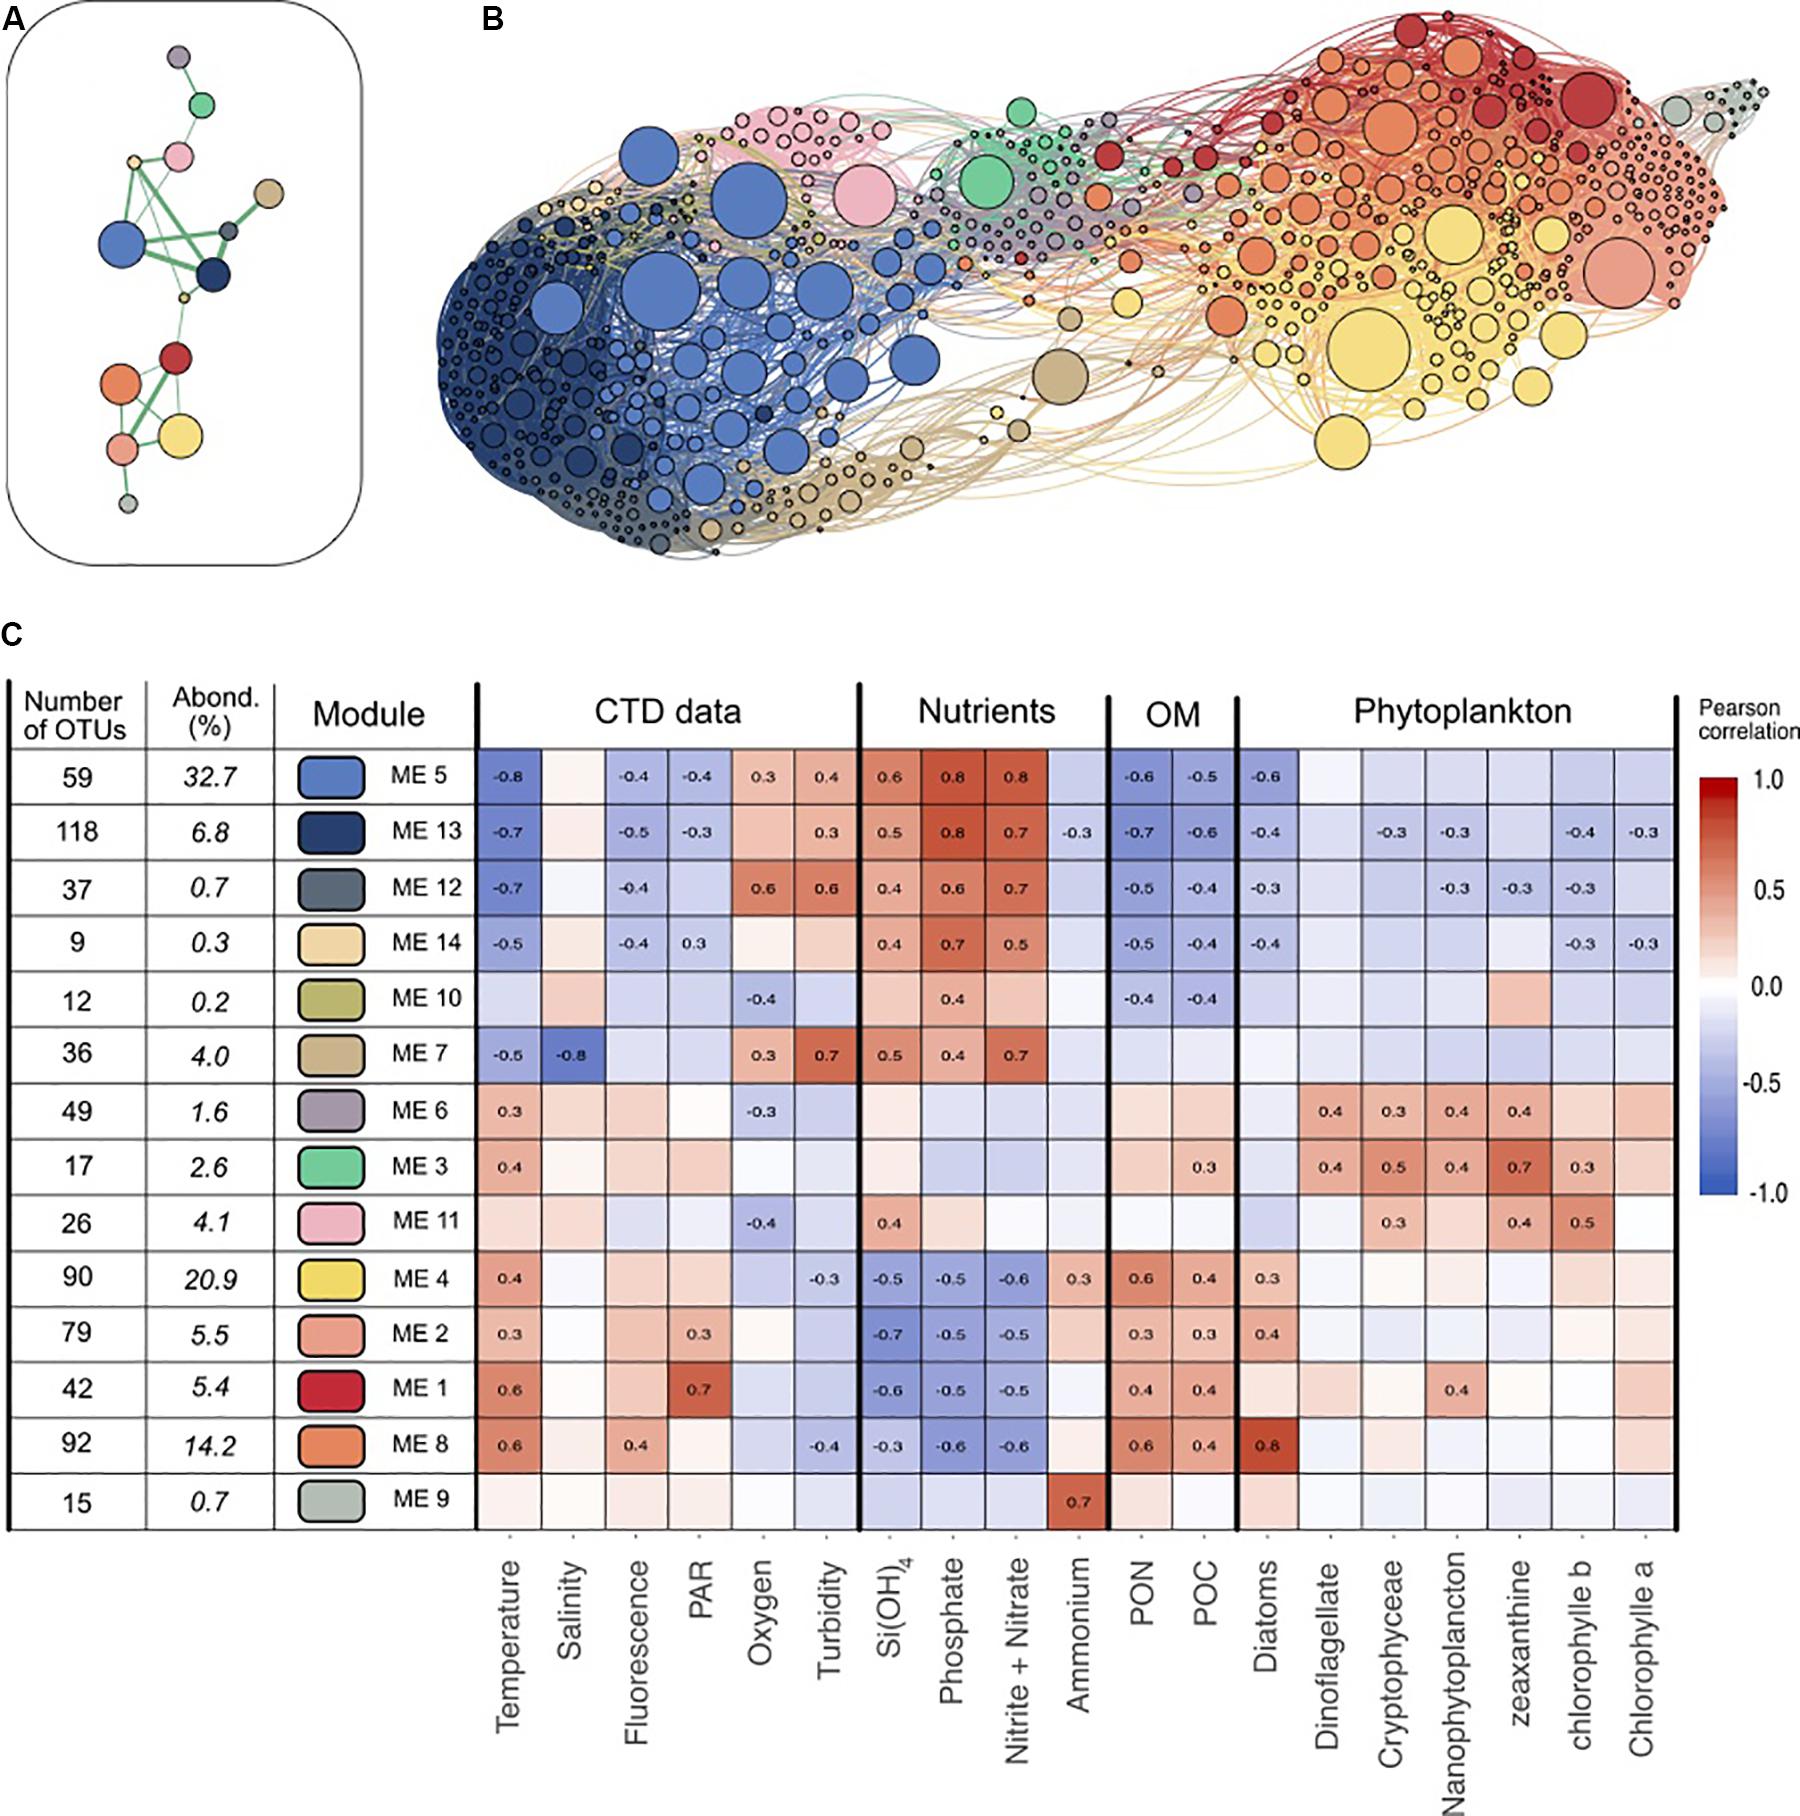
Figure 2. Visualization of the different modules and their main characteristics. (A) Representation of the main connectivity between the different modules detected with the Louvain algorithm. Each node represent a module, each edge represents the median of the positive correlations between two modules. Only the strongest connections are shown. (B) Network visualization of the dataset. Each node represents an OTU, while each edge represent a positive correlation (>0.3) obtained from the covariance matrix calculated with SPIEC-EASI. The node size depends on the abundance of one OTU (in number of sequences) in the entire dataset. The edge size depends on the value of the correlation. Nodes colors represent the OTU affiliation to the different Louvain communities. Network was represented using Gephi and Force Atlas layout algorithm. (C) Presentation of the 14 modules detected. Pearson correlations between each module eigengene and the different environmental data are presented in the heatmap. OM, Organic Matter; PAR, Photosynthetically Available Radiation; PON, Particulate Organic Nitrogen; POC, Particulate Organic Carbon. Only the significant correlations (p > 10–4) are shown. The number of OTUs in each module and the relative abundance of each module (in % of all the reads) are detailed.
Since its eigengene could characterize each module, we investigated to which extent module distribution could be correlated (i.e., Pearson correlation) with environmental parameters (Figure 2C). Correlation patterns partitioned modules into three significant sub-networks. The first one mostly comprises modules 5 and 13 representing 32.7 and 6.8% of the dataset respectively that correlated positively to inorganic nutrient concentrations and negatively to temperature and Particulate Organic Matter (POC, PON) values. Their relative abundance in the different samples showed that they were dominant in oligotrophic waters: together they ranged from 39% at Station 1 to 72% at Station 5 of the late winter communities, and 54–59% of the deep stratified waters in September (Figure 3). SAR11 Surface 1 (46.7% of the module sequences), ZD0405 marine group (12%) and SAR86 Clade (6.4%) dominate the main module (module 5). Module 13 showed a different diversity as being dominated by members of Marinimicrobia (15.8%), SAR11 Deep 1 (12%), SAR11 Surface 1 (8.9%), and Salinisphaeraceae (7.9%).
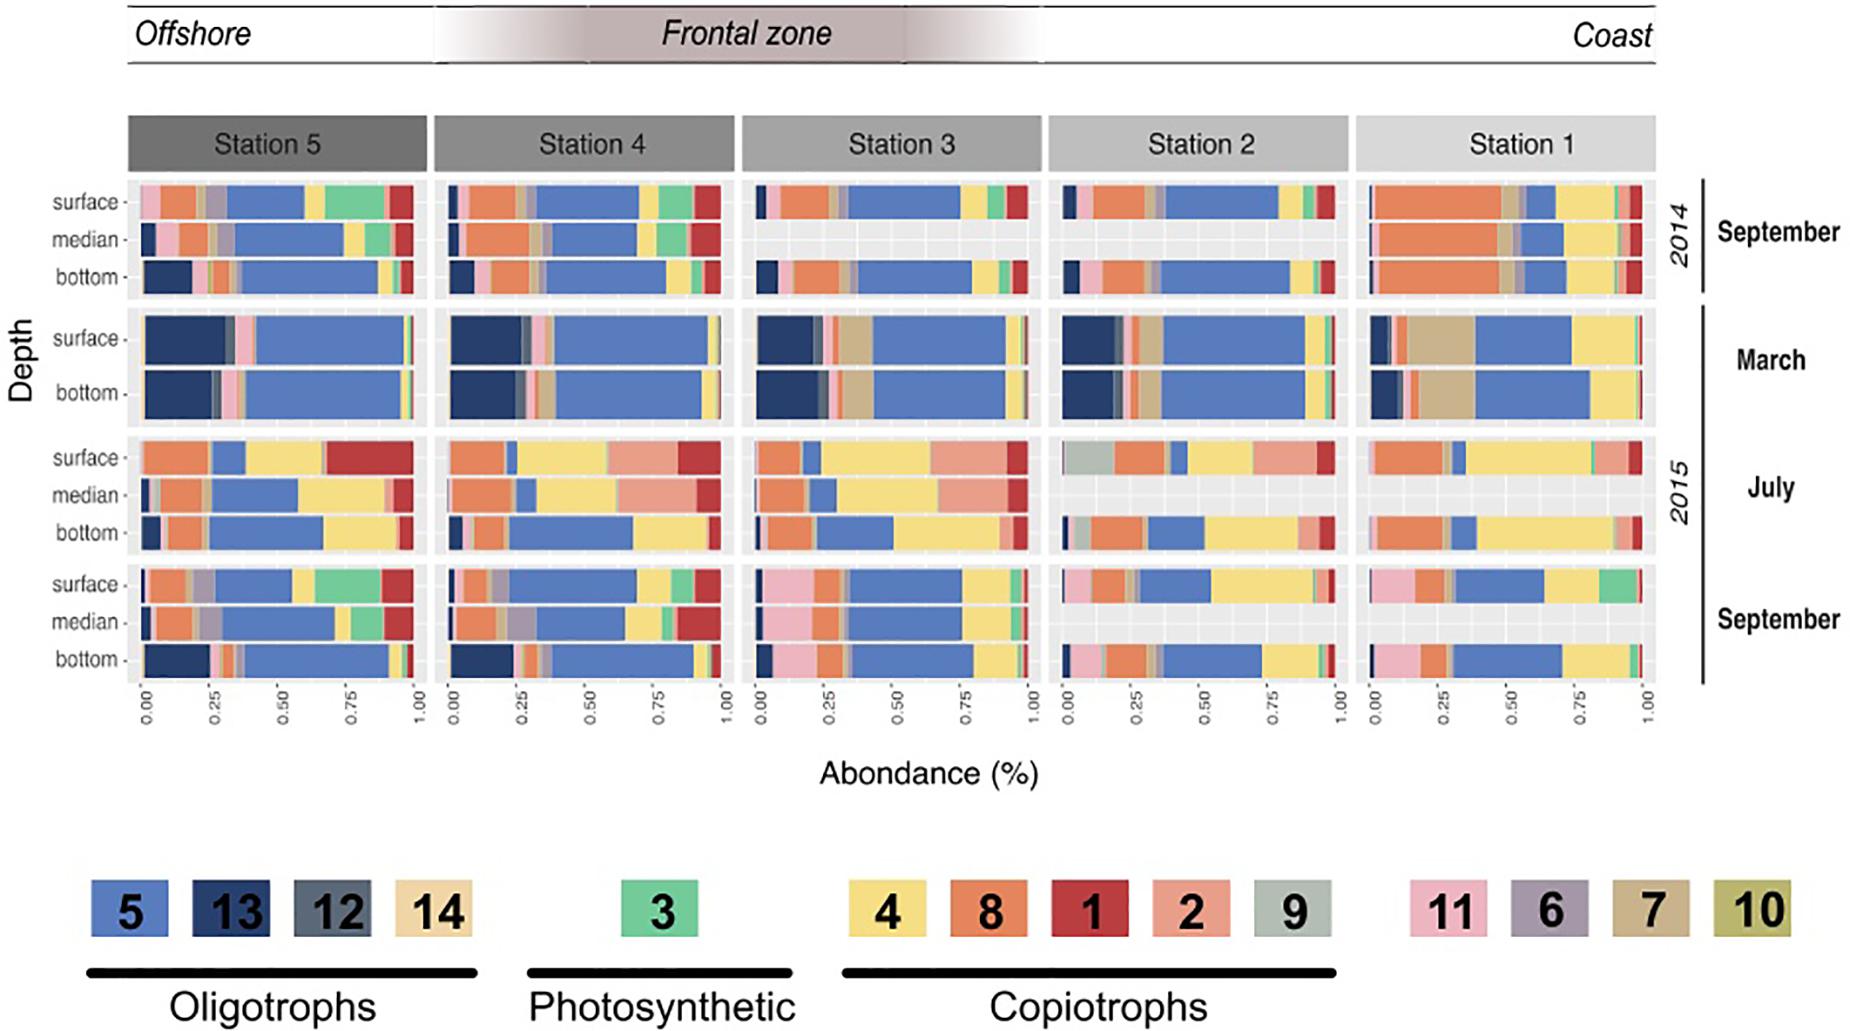
Figure 3. Module dynamics across the different campaigns, stations, and depths. Relative abundance of the different modules in each campaign, station and depth. The value shown resulted of the mean of the triplicates done for each sampling. The legend includes the different hypotheses of the modules’ trophic strategies based on their correlations to the environmental parameters, their taxonomy and their dynamic. Oligotrophic modules are likely to present heterotrophic bacteria adapted to low organic matter levels, while copiotrophic bacteria are likely more competitive under higher organic matter levels. Finally the photosynthetic module is almost only composed of Cyanobacteria.
Modules 4, 8, 2, and 1 contributed to the second sub-network, representing 20.9, 14.2, 5.5, and 5.4% of the dataset respectively. They presented clear inverse correlations compared with modules of the first group: they correlated positively with temperature, POM and Diatoms but negatively with inorganic nutrient concentrations. In relative abundance, they dominated the samples of July and in the surface and coastal stations. Their taxonomy was distinct from the first group; i.e., together they gathered the majority of Flavobacteriaceae (70%) and Rhodobacteraceae (88%). Also, module 9 was enhanced in July 2015 but was almost exclusively present in Station 2 and strongly correlated with ammonium (0.72, p < 0001). Its taxonomy was also particular as dominated by Vibrionaceae (58%) and Pseudoalteromonadaceae (30%).
The third sub-network (modules 6 and 3) was less abundant and presented different correlations with environmental parameters. They, respectively, account for 1.6 and 2.6% of the dataset, were correlated with specific phytoplankton groups (dinoflagellates, nanophytoplankton) and were dominant in the surface and DCM of stratified waters in September where they made up to 34% of the community. Among them, module 3 was constituted almost exclusively of Cyanobacteria (94%) affiliated with the Synechococcus genus.
To examine whether the modules gather OTUs that exhibited different ecological behavior (i.e., marathoners or opportunist), we computed the coefficient of variation (CV) for all OTU used in the network analysis and plotted this metric against OTU occurrence as proposed in Newton and Shade (2016). We then examined their module membership (Supplementary Data Sheet S7 and Figure 4B): modules showed a clear gradient ranging from relatively low CV (LCV) OTUs (modules 4, 11, 14, 5, and 13) to high CV (HCV) OTUs (modules 9, 10, 7, and 2).
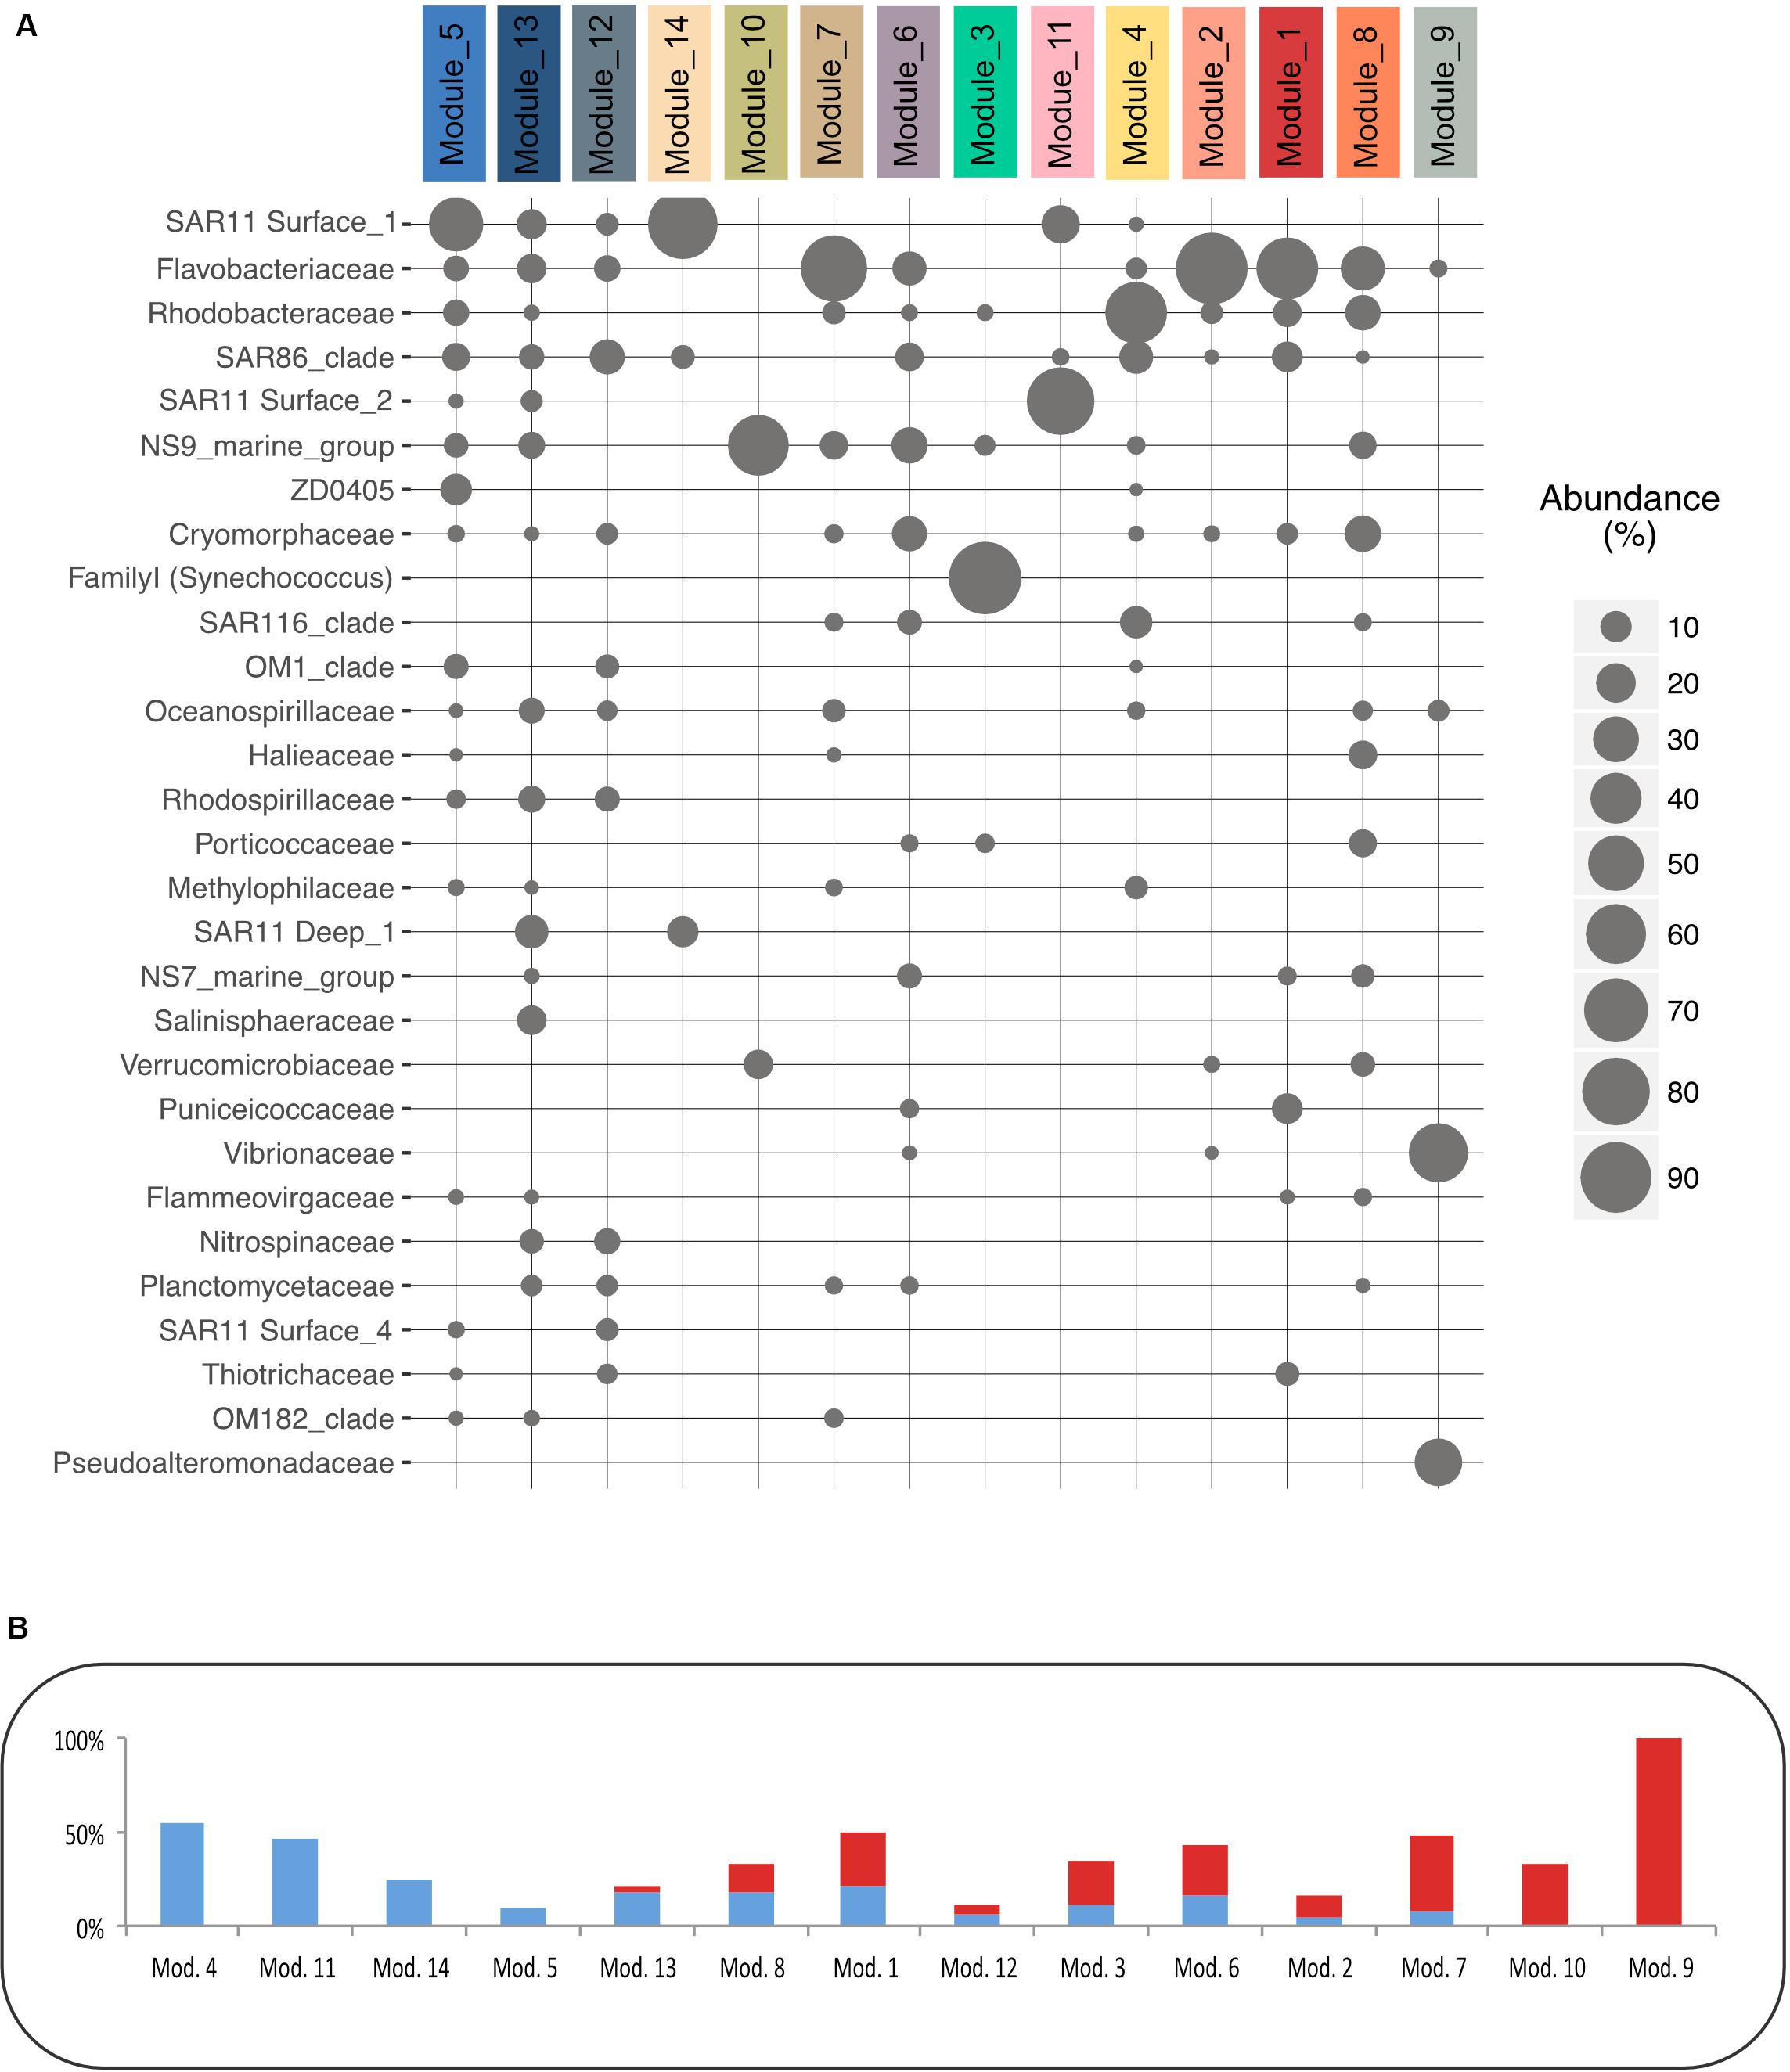
Figure 4. Modules’ taxonomy and Coefficient of Variation of their OTUs. (A) Relative abundance of the 30 main families in each module. (B) Proportion of OTUs (in% of all the OTUs in a module) that present a High Coefficient of Variation (HCV) in red, or a Low Coefficient of Variation (LCV) in blue defined based on Newton method (Newton and Shade, 2016).
Discussion
The Spatial and Temporal Dynamics of Bacterial Communities Associated With a Coastal Tidal Front
In this study, we investigated the spatiotemporal variations of free-living bacterial community composition over 1 year across contrasting coastal water masses characterized by a seasonal tidal front structure. For each cruise (season) we observed a spatial influence on bacterioplankton community composition. However, in the studied area, winter communities were comparatively much more homogeneous with only an influence from coast to the offshore. At this time of the year, the river debit were at the highest and this is known to influence free-living bacterial communities in coastal area (Tréguer et al., 2014; Pizzetti et al., 2016). In summer, bacterial communities diverged according to the station and depth, highlighting the importance of the onset of a tidal front and open ocean stratification for bacterioplankton community structure. This was mainly due to the sharp divergence of summer surface samples, as deep summer samples remained closer to winter ones (Figure 1C). The existence of two contrasting types of bacterioplankton dynamics (winter and deep vs. summer surfaces) reflects similar patterns in sample ordination based on biogeochemical parameters and can be associated to phytoplankton development, temperature increase or lowering in inorganic nutrient concentrations, which are key parameters influencing bacterial communities dynamic in marine coastal environment (Giovannoni and Vergin, 2012; Fuhrman et al., 2015).
These observations of a frontal zone as a sharp ecological transition for bacterioplankton among different water masses are consistent with reports in stratified waters (Ghiglione et al., 2008; Cram et al., 2015) and from other frontal areas (Baltar et al., 2016) confirming their role as ecological boundaries in the oceans (Raes et al., 2018). Interestingly, the frontal area itself around station 3–4 did not exhibit a specific bacterial composition (Figures 2C, 4), but could rather result from mixing between adjacent communities, as already suggested for the phytoplankton and zooplankton (Sournia, 1994) and in another marine boundaries such as a shelf break (Zorz et al., 2019). We could not identify any biomarker OTUs associated with frontal stations. Hence, bacterioplankton communities associated with enhanced productivity at the Ushant front (Videau, 1987) could result from an increase in resident plankton density (Franks, 1992) rather than the emergence of distinct communities.
In addition, we observed a remarkable seasonal recurrence between the two September cruises, within each station and depth. This pattern was comparatively more accentuated toward the open ocean (stations 4 and 5) than near shore (stations 1–3). This temporal dynamic is coherent with previous reports of seasonal patterns in single stations as shown in the North Sea (Chafee et al., 2018) or the English Channel (Gilbert et al., 2012) time series. Our results suggest that despite a substantial heterogeneity in our system, such seasonal recurrence patterns also extend to stations along geographical and bathyal gradients.
Distinct Bacterioplankton Trophic Strategies Associated With Tidal Front Temporal and Spatial Dynamics
Using network analysis on samples exhibiting strong temporal and spatial variations, we could define modules of ecologically coherent OTUs. As suggested elsewhere, such modules can be considered as OTUs potentially sharing the same environmental niches with coherent ecological strategies (Eiler et al., 2012). In association with previously characterized dominant taxa in each module, we aim at identifying higher order bacterioplankton community organization and revealing ecological drivers of community dynamics in the frontal zone.
Our study gives evidence of module partitioning into two major heterotrophs-dominated sub-networks, exhibiting distinct inverse covariance patterns (Figures 2A,B). Their correlations with environmental variables also clearly separated conditions between water masses with active primary producers (low nutrients and high POM values) that were present in summer surface samples, and conditions with overall low development of phytoplankton typical of winter and deep samples. Development and decay of phytoplankton lead to the release of dissolved organic matter, which is almost only available for heterotrophic bacteria (Azam and Malfatti, 2007). Thus, these two different conditions likely selected for copiotrophic or oligotrophic heterotrophic free-living bacteria adapted to different concentrations of organic matter in the environment (Giovannoni et al., 2014). The taxonomic affiliation was highly coherent with these observations. Modules 5 and 13 are dominated by SAR11 clades, which typically thrive in basal concentrations of organic matter (Morris et al., 2002) or members of taxa typical of the sub-euphotic zones such as Marinimicrobia, or SAR11 Deep 1 (Agogué et al., 2011). Conversely, modules 4, 8, 2, 1, and 9 were dominated by members of the Rhodobacteraceae and Flavobacteriaceae, typically associated with phytoplankton-derived organic matter (Teeling et al., 2012; Buchan et al., 2014). Thus, the availability of phytoplankton-derived organic matter will drive heterotroph dynamics.
The last sub-network with module 3, dominated by Synechococcus, highlights the contribution of phototrophic bacteria. These cyanobacteria became strongly dominant in the surface of well stratified-waters in late summer, which is already known to favor these small phytoplanktonic cells (Taylor and Joint, 1990; Cadier et al., 2017).
Interestingly, known chemoautotrophs involved in the nitrification such as Nitrospinaea did not form a separate module and were included in the oligotrophic module 13. Nitrification in the water column is typically found in the sub-euphotic zone as nitrite-oxidizing bacteria could be light-sensitive (Lomas and Lipschultz, 2006) and can be outcompeted by phytoplankton for the uptake of nitrite (Smith et al., 2014; Wan et al., 2018). This fact could explain why they exhibit a dynamic similar to oligotrophic bacteria.
Differential Bacterioplankton Responses to Organic Matter Availability
Using the OTU coefficients of variation to distinguish rather marathoners or opportunist taxa, we examined whether heterotrophic bacteria had different responses to organic matter availability in summer samples. Their dynamic and composition was highly coherent with a partitioning of the microbial loop between different taxa (Bryson et al., 2017). For instance, several modules presented a majority of HCV OTUs (Figure 4B): Tenacibaculum sp. (a Flavobacteriaceae dominating Module 2) was highly abundant reaching up to 20.7% of the sequences in the 2015 July surface waters shortly after significant phytoplankton bloom. One single Tenacibaculum OTU dominated the surface of four stations over a 40 km distance just a few days after a phytoplankton bloom. This dynamic of Tenacibaculum genus is coherent with previous observations of a recurrent population increase after seasonal phytoplankton blooms in coastal water (Teeling et al., 2016) while being part of the rare biosphere otherwise (Alonso-Sáez et al., 2015). During the same period, module 9, dominated by Vibrionales (Aliivibrio sp.) and Alteromonadales (Pseudoalteromonas sp.) class, was especially abundant at station 2, reaching up to 27% of the sequences (Figure 3). These taxa are known copiotroph bacteria that can sharply increase in abundance in response to high substrate loading (Tada et al., 2012). These results strongly support an opportunist lifestyle of bacteria in modules 2 and 9. When they are dominant, bacteria with such an opportunist strategy have a critical role as they can contribute to a substantial fraction of organic matter recycling (Pedler et al., 2014).
In contrast, module 4 was mostly composed of LCV OTUs with a cosmopolitan distribution across time, depth and geography. The dominant family in module 4, the Rhodobacteraceae, are known as generalist bacteria with a versatile substrate utilization (Moran et al., 2004; Newton et al., 2010). Some of the free-living Rhodobacteraceae grow on low molecular weight organic compounds and numerous studies pointed out that they compete for the same substrate as SAR11 Clade, but are more competitive at higher organic matter concentrations. They can be very successful in coastal waters, an example being a representative of the genus Planktomarina that is dominant in the North Sea (Voget et al., 2015). Other dominant taxa of this module, such as SAR86 Clade, Methylophilaceae or members of SAR116 Clade are widespread in marine environments and are also known to target small organic molecules (Oh et al., 2010; Dupont et al., 2012; Huggett et al., 2012).
Module 8 presented mixed CV values among its OTUs. Many members of this module, such as Flavobacteriaceae (Buchan et al., 2014), Verrucomicrobiacea (Martinez-Garcia et al., 2012), or Cryomorphaceae (Bowman, 2014), can use complex algal-derived substrates and present a typical increase in abundance after phytoplankton blooms (Teeling et al., 2016). We interpret these observations to be a result of the relatively low sampling time resolution that probably fails to resolve rapid OTU variations of other opportunistic bacteria.
Overall, this study allowed us to delineate several groups of bacterioplankton trophic strategies and their variations in response to biogeochemical cycles in a highly dynamic coastal environment. Oligotrophs, typically represented by SAR11 OTUs, were present in all water masses. They outcompete other heterotrophic organisms in low labile organic matter environments such as winter and deep offshore water masses, while copiotrophs communities develop during the high productivity period. Within copiotrophs, several taxa show patterns of adaptation to rapidly changing conditions in their substrate availability: opportunist taxa can rapidly become highly dominant (represented by Tenacibaculum and Alteromonadales) after local events such as phytoplankton bloom, while more generalist taxa such as Rhodobacteraceae exhibit a ubiquitous distribution. It is likely that this dichotomy between oligotroph and copiotroph is an over-simplification in trophic strategies, as suggested by numerous studies (Mayali et al., 2012; Bryson et al., 2017). Heterotrophs could instead follow a gradient from oligotrophy to copiotrophy, and only finer analysis such as growth rate measurements or dissolved organic matter quantification could help to better describe the trophic strategies of heterotrophs (Kirchman, 2016). However, these complex heterotrophic community dynamics observed in this study highlight the central role of free-living bacteria in organic matter cycling. Indeed, previous studies of the Iroise Sea nutrient cycling demonstrated that after the initial depletion of winter nutrients pool, phytoplankton growth strongly relies on nutrients recycled through the microbial loop (L’Helguen et al., 2005), through which they are remineralized several times in a seasonal cycle (Birrien et al., 1991). In this system, bacteria could be directly responsible for up to 25% of urea with the remaining originating from ciliates mainly, which also mostly feed on bacteria (L’Helguen et al., 2005).
Conclusion
Here, using a complex 3D (vertical, horizontal, and temporal) survey of free-living bacterial diversity in correlation with the seasonal dynamics of a coastal tidal front, we have shown that such complex mesoscale features controls the dynamic of free-living bacterial communities. The Ushant tidal front acts as an ecological boundary for those communities. We illustrated the link between different water masses on this dynamic with for instance photosynthetic bacteria enriched in oligotrophic stratified waters in late summer. Using a network analysis, we were able to gain insight on ecologically coherent modules of free-living bacteria driven by the availability of organic matter produced by the phytoplankton. This has major implication for our understanding of the microbial loop in coastal systems. In the future, these observations should be confirmed with measurements and characterization of dissolved organic matter quantity and quality in the water column as well as direct measurement of growth rates in order to more precisely describe bacterial trophic strategies. Moreover, to better understand these systems, future studies should include the characterization of other key members of the planktonic communities such as viruses, ammonium oxidizing archaea, eukaryotic phytoplankton and grazers, as well as particle-attached bacteria that are central for organic matter and biogeochemical cycles.
Data AvaIlability Statement
The datasets generated for this study can be found in the https://www.ebi.ac.uk/ena/data/view/PRJEB32620.
Author Contributions
LMem, LMai, CP, and LMar designed and conceived the study. CL and MP did all the libraries preparation. HM did the sample sequencing. AL conducted the biogeochemical and phytoplankton analysis. CL did the data analysis. LMai, DE, and AF-G contributed to data interpretation. CL and LMai drafted the manuscript. LMem, CP, AL, DE, and AF-G assisted with the writing of the manuscript.
Funding
This work was supported by the “Laboratoire d’Excellence” LabexMER (ANR-10-LABX-19) and co-funded by a grant from the French government under the program “Investissements d’Avenir,” and the Regional Council of Brittany. It was also supported by the University of Western Brittany (UBO).
Conflict of Interest
The authors declare that the research was conducted in the absence of any commercial or financial relationships that could be construed as a potential conflict of interest.
Supplementary Material
The Supplementary Material for this article can be found online at: https://www.frontiersin.org/articles/10.3389/fmars.2020.00376/full#supplementary-material
References
Agogué, H., Lamy, D., Neal, P. R., Sogin, M. L., and Herndl, G. J. (2011). Water mass-specificity of bacterial communities in the North Atlantic revealed by massively parallel sequencing. Mol. Ecol. 20, 258–274. doi: 10.1111/j.1365-294X.2010.04932.x
Alonso-Sáez, L., Díaz-Pérez, L., and Morán, X. A. G. (2015). The hidden seasonality of the rare biosphere in coastal marine bacterioplankton. Environ. Microbiol. 17, 3766–3780. doi: 10.1111/1462-2920.12801
Aminot, A., and Kérouel, R. (2007). Dosage Automatique des Nutriments Dans les Eaux Marines: Méthodes en Flux Continu. Versailles: Editions Quae.
Anders, S., and Huber, W. (2010). Differential expression analysis for sequence count data. Genome Biol. 11:R106. doi: 10.1186/gb-2010-11-10-r106
Azam, F. (1998). Microbial control of oceanic carbon flux: the plot thickens. Science 280, 694–696. doi: 10.1126/science.280.5364.694
Azam, F., and Malfatti, F. (2007). Microbial structuring of marine ecosystems. Nat. Rev. Microbiol. 5, 782–791. doi: 10.1038/nrmicro1747
Baltar, F., Currie, K., Stuck, E., Roosa, S., and Morales, S. E. (2016). Oceanic fronts: transition zones for bacterioplankton community composition: fronts delimit bacterioplankton communities. Environ. Microbiol. Rep. 8, 132–138. doi: 10.1111/1758-2229.12362
Baltar, F., Stuck, E., Morales, S., and Currie, K. (2015). Bacterioplankton carbon cycling along the Subtropical Frontal Zone off New Zealand. Prog. Oceanogr. 135, 168–175. doi: 10.1016/j.pocean.2015.05.019
Bastian, M., Heymann, S., and Jacomy, M. (2009). Gephi: an open source software for exploring and manipulating networks. ICWSM 8, 361–362.
Birrien, J. L., Wafar, M. V. M., Corre, P. L., and Riso, R. (1991). Nutrients and primary production in a shallow stratified ecosystem in the Iroise Sea. J. Plankton Res. 13, 721–742. doi: 10.1093/plankt/13.4.721
Blondel, V. D., Guillaume, J.-L., Lambiotte, R., and Lefebvre, E. (2008). Fast unfolding of communities in large networks. J. Stat. Mech. Theory Exp. 2008:10008. doi: 10.1088/1742-5468/2008/10/P10008
Bowman, J. P. (2014). “The family cryomorphaceae,” in The Prokaryotes, eds E. Rosenberg, E. F. DeLong, S. Lory, E. Stackebrandt, and F. Thompson (Berlin: Springer Berlin Heidelberg), 539–550. doi: 10.1007/978-3-642-38954-2_135
Bryson, S., Li, Z., Chavez, F., Weber, P. K., Pett-Ridge, J., Hettich, R. L., et al. (2017). Phylogenetically conserved resource partitioning in the coastal microbial loop. ISME J. 11, 2781–2792. doi: 10.1038/ismej.2017.128
Buchan, A., LeCleir, G. R., Gulvik, C. A., and González, J. M. (2014). Master recyclers: features and functions of bacteria associated with phytoplankton blooms. Nat. Rev. Microbiol. 12, 686–698. doi: 10.1038/nrmicro3326
Cadier, M., Gorgues, T., Sourisseau, M., Edwards, C. A., Aumont, O., Marié, L., et al. (2017). Assessing spatial and temporal variability of phytoplankton communities’ composition in the Iroise Sea ecosystem (Brittany, France): a 3D modeling approach. Part 1: biophysical control over plankton functional types succession and distribution. J. Mar. Syst. 165, 47–68. doi: 10.1016/j.jmarsys.2016.09.009
Chafee, M., Fernandez-Guerra, A., Buttigieg, P. L., Gerdts, G., Eren, A. M., Teeling, H., et al. (2018). Recurrent patterns of microdiversity in a temperate coastal marine environment. ISME J. 12, 237–252. doi: 10.1038/ismej.2017.165
Cotner, J. B., and Biddanda, B. A. (2002). Small players, large role: microbial influence on biogeochemical processes in pelagic aquatic ecosystems. Ecosystems 5, 105–121. doi: 10.1007/s10021-001-0059-3
Cram, J. A., Chow, C.-E. T., Sachdeva, R., Needham, D. M., Parada, A. E., Steele, J. A., et al. (2015). Seasonal and interannual variability of the marine bacterioplankton community throughout the water column over ten years. ISME J. 9, 563–580. doi: 10.1038/ismej.2014.153
Dupont, C. L., Rusch, D. B., Yooseph, S., Lombardo, M.-J., Alexander Richter, R., Valas, R., et al. (2012). Genomic insights to SAR86, an abundant and uncultivated marine bacterial lineage. ISME J. 6, 1186–1199. doi: 10.1038/ismej.2011.189
Eiler, A., Heinrich, F., and Bertilsson, S. (2012). Coherent dynamics and association networks among lake bacterioplankton taxa. ISME J. 6, 330–342. doi: 10.1038/ismej.2011.113
Eren, A. M., Vineis, J. H., Morrison, H. G., and Sogin, M. L. (2013). A filtering method to generate high quality short reads using Illumina paired-end technology. PLoS One 8:e66643. doi: 10.1371/journal.pone.0066643
Falkowski, P. G., Fenchel, T., and Delong, E. F. (2008). The microbial engines that drive earth’s biogeochemical cycles. Science 320, 1034–1039. doi: 10.1126/science.1153213
Fenchel, T. M., and Jørgensen, B. B. (1977). “Detritus food chains of aquatic ecosystems: the role of bacteria,” in Advances in Microbial Ecology Advances in Microbial Ecology, ed. M. Alexander (Boston, MA: Springer US), 1–58. doi: 10.1007/978-1-4615-8219-9_1
Franks, P. (1992). Sink or swim, accumulation of biomass at fronts. Mar. Ecol. Prog. Ser. 82, 1–12. doi: 10.3354/meps082001
Fuhrman, J. A., Cram, J. A., and Needham, D. M. (2015). Marine microbial community dynamics and their ecological interpretation. Nat. Rev. Microbiol. 13, 133–146. doi: 10.1038/nrmicro3417
Galand, P. E., Pereira, O., Hochart, C., Auguet, J. C., and Debroas, D. (2018). A strong link between marine microbial community composition and function challenges the idea of functional redundancy. ISME J. 12, 2470–2478. doi: 10.1038/s41396-018-0158-1
Ghiglione, J. F., Palacios, C., Marty, J. C., Mével, G., Labrune, C., Conan, P., et al. (2008). Role of environmental factors for the vertical distribution (0–1000 m) of marine bacterial communities in the NW Mediterranean Sea. Biogeosciences 5, 1751–1764. doi: 10.5194/bg-5-1751-2008
Gilbert, J. A., Steele, J. A., Caporaso, J. G., Steinbrück, L., Reeder, J., Temperton, B., et al. (2012). Defining seasonal marine microbial community dynamics. ISME J. 6, 298–308. doi: 10.1038/ismej.2011.107
Giovannoni, S. J., and Vergin, K. L. (2012). Seasonality in ocean microbial communities. Science 335, 671–676. doi: 10.1126/science.1198078
Giovannoni, S. J., Cameron Thrash, J., and Temperton, B. (2014). Implications of streamlining theory for microbial ecology. ISME J. 8, 1553–1565. doi: 10.1038/ismej.2014.60
Grepma (1988). A physical, chemical and biological characterization of the ushant tidal front. Int. Rev. Gesamten Hydrobiol. Hydrogr. 73, 511–536. doi: 10.1002/iroh.19880730503
Haggerty, J. M., and Dinsdale, E. A. (2017). Distinct biogeographical patterns of marine bacterial taxonomy and functional genes. Glob. Ecol. Biogeogr. 26, 177–190. doi: 10.1111/geb.12528
Heinänen, A., Kononen, K., Kuosa, H., Kuparinen, J., and Mäkelä, K. (1995). Bacterioplankton growth associated with physical fronts during a cyanobacterial bloom. Mar. Ecol. Prog. Ser. 116, 233–245. doi: 10.3354/meps116233
Holm-Hansen, O., Lorenzen, C. J., Holmes, R. W., and Strickland, J. D. (1965). Fluorometric determination of chlorophyll. ICES J. Mar. Sci. 30, 3–15. doi: 10.1093/icesjms/30.1.3
Huggett, M. J., Hayakawa, D. H., and Rappé, M. S. (2012). Genome sequence of strain HIMB624, a cultured representative from the OM43 clade of marine Betaproteobacteria. Stand. Genomic Sci. 6:11. doi: 10.4056/sigs.2305090
Kirchman, D. L. (2016). Growth rates of microbes in the oceans. Annu. Rev. Mar. Sci. 8, 285–309. doi: 10.1146/annurev-marine-122414-033938
Krause, S., Le Roux, X., Niklaus, P. A., Van Bodegom, P. M., Lennon, J. T., Bertilsson, S., et al. (2014). Trait-based approaches for understanding microbial biodiversity and ecosystem functioning. Front. Microbiol. 5:251. doi: 10.3389/fmicb.2014.00251
Kurtz, Z. D., Müller, C. L., Miraldi, E. R., Littman, D. R., Blaser, M. J., and Bonneau, R. A. (2015). Sparse and compositionally robust inference of microbial ecological networks. PLoS Comput. Biol. 11:e1004226. doi: 10.1371/journal.pcbi.1004226
Langfelder, P., and Horvath, S. (2008). WGCNA: an R package for weighted correlation network analysis. BMC Bioinformatics 9:559. doi: 10.1186/1471-2105-9-559
Le Boyer, A., Cambon, G., Daniault, N., Herbette, S., Le, C., Marié, L., et al. (2009). Observations of the Ushant tidal front in September 2007. Cont. Shelf Res. 29, 1026–1037. doi: 10.1016/j.csr.2008.12.020
Le Fèvre, J. (1986). Aspect of the biology of frontal systems. Adv. Mar. Biol. 23, 163–299. doi: 10.1016/s0065-2881(08)60109-1
Le Fèvre, J., Le Corre, P., Morin, P., and Birrien, J.-L. (1983). The pelagie eeosystem in frontal zones and other environments off the West eoast of Brittany. Oceanol. Acta 1982, 125–129.
L’Helguen, S., Slawyk, G., and Le Corre, P. (2005). Seasonal patterns of urea regeneration by size-fractionated microheterotrophs in well-mixed temperate coastal waters. J. Plankton Res. 23, 263–270. doi: 10.1093/plankt/fbh174
Lomas, M. W., and Lipschultz, F. (2006). Forming the primary nitrite maximum: Nitrifiers or phytoplankton? Limnol. Oceanogr. 51, 2453–2467. doi: 10.4319/lo.2006.51.5.2453
Lund, J. W. G., Kipling, C., and Le Cren, E. D. (1958). The inverted microscope method of estimating algal numbers and the statistical basis of estimations by counting. Hydrobiologia 11, 143–170. doi: 10.1007/bf00007865
Luo, H., and Moran, M. A. (2014). Evolutionary ecology of the marine roseobacter clade. Microbiol. Mol. Biol. Rev. 78, 573–587. doi: 10.1128/MMBR.00020-14
Madsen, E. L. (2011). Microorganisms and their roles in fundamental biogeochemical cycles. Curr. Opin. Biotechnol. 22, 456–464. doi: 10.1016/j.copbio.2011.01.008
Mahé, F., Rognes, T., Quince, C., de Vargas, C., and Dunthorn, M. (2014). Swarm: robust and fast clustering method for amplicon-based studies. PeerJ 2:e593. doi: 10.7717/peerj.593
Martinez-Garcia, M., Brazel, D. M., Swan, B. K., Arnosti, C., Chain, P. S. G., Reitenga, K. G., et al. (2012). Capturing single cell genomes of active polysaccharide degraders: an unexpected contribution of Verrucomicrobia. PLoS One 7:e35314. doi: 10.1371/journal.pone.0035314
Mayali, X., Weber, P. K., Brodie, E. L., Mabery, S., Hoeprich, P. D., and Pett-Ridge, J. (2012). High-throughput isotopic analysis of RNA microarrays to quantify microbial resource use. ISME J. 6, 1210–1221. doi: 10.1038/ismej.2011.175
Minoche, A. E., Dohm, J. C., and Himmelbauer, H. (2011). Evaluation of genomic high-throughput sequencing data generated on Illumina HiSeq and Genome Analyzer systems. Genome Biol. 12:R112. doi: 10.1186/gb-2011-12-11-r112
Moran, M. A., Buchan, A., González, J. M., Heidelberg, J. F., Whitman, W. B., Kiene, R. P., et al. (2004). Genome sequence of Silicibacter pomeroyi reveals adaptations to the marine environment. Nature 432:910. doi: 10.1038/nature03170
Morris, R. M., Rappé, M. S., Connon, S. A., Vergin, K. L., Siebold, W. A., Carlson, C. A., et al. (2002). SAR11 clade dominates ocean surface bacterioplankton communities. Nature 420:806. doi: 10.1038/nature01240
Mou, X., Sun, S., Edwards, R. A., Hodson, R. E., and Moran, M. A. (2008). Bacterial carbon processing by generalist species in the coastal ocean. Nature 451, 708–711. doi: 10.1038/nature06513
Nelson, M. C., Morrison, H. G., Benjamino, J., Grim, S. L., and Graf, J. (2014). Analysis, optimization and verification of illumina-generated 16S rRNA gene amplicon surveys. PLoS One 9:e94249. doi: 10.1371/journal.pone.0094249
Newton, R. J., and Shade, A. (2016). Lifestyles of rarity: understanding heterotrophic strategies to inform the ecology of the microbial rare biosphere. Aquat. Microb. Ecol. 78, 51–63. doi: 10.3354/ame01801
Newton, R. J., Griffin, L. E., Bowles, K. M., Meile, C., Gifford, S., Givens, C. E., et al. (2010). Genome characteristics of a generalist marine bacterial lineage. ISME J. 4, 784–798. doi: 10.1038/ismej.2009.150
Oh, H.-M., Kwon, K. K., Kang, I., Kang, S. G., Lee, J.-H., Kim, S.-J., et al. (2010). Complete genome sequence of “Candidatus Puniceispirillum marinum” IMCC1322, a representative of the SAR116 clade in the Alphaproteobacteria. J. Bacteriol. 192, 3240–3241. doi: 10.1128/JB.00347-10
Oksanen, J., Kindt, R., Legendre, P., O’Hara, B., Stevens, M. H. H., Oksanen, M. J., et al. (2007). The vegan package. Commun. Ecol. Package 10, 631–637.
Olson, D. B., and Backus, R. H. (1985). The concentrating of organisms at fronts: a cold-water fish and a warm-core Gulf Stream ring. J. Mar. Res. 43, 113–137. doi: 10.1357/002224085788437325
Pedler, B. E., Aluwihare, L. I., and Azam, F. (2014). Single bacterial strain capable of significant contribution to carbon cycling in the surface ocean. Proc. Natl. Acad. Sci. U.S.A. 111, 7202–7207. doi: 10.1073/pnas.1401887111
Pizzetti, I., Lupini, G., Aubry, F. B., Acri, F., Fuchs, B. M., and Fazi, S. (2016). Influence of the Po River runoff on the bacterioplankton community along trophic and salinity gradients in the Northern Adriatic Sea. Mar. Ecol. 37, 1386–1397. doi: 10.1111/maec.12355
Pomeroy, L., Williams, P. leB., Azam, F., and Hobbie, J. (2007). The microbial loop. Oceanography 20, 28–33. doi: 10.5670/oceanog.2007.45
Quast, C., Pruesse, E., Yilmaz, P., Gerken, J., Schweer, T., Yarza, P., et al. (2012). The SILVA ribosomal RNA gene database project: improved data processing and web-based tools. Nucleic Acids Res. 41, D590–D596. doi: 10.1093/nar/gks1219
Raes, E. J., Bodrossy, L., van de Kamp, J., Bissett, A., Ostrowski, M., Brown, M. V., et al. (2018). Oceanographic boundaries constrain microbial diversity gradients in the South Pacific Ocean. Proc. Natl. Acad. Sci. U.S.A. 115, E8266–E8275. doi: 10.1073/pnas.1719335115
Raes, J., Letunic, I., Yamada, T., Jensen, L. J., and Bork, P. (2011). Toward molecular trait-based ecology through integration of biogeochemical, geographical and metagenomic data. Mol. Syst. Biol. 7:473. doi: 10.1038/msb.2011.6
Ragueneau, O., and Tréguer, P. (1994). Determination of biogenic silica in coastal waters: applicability and limits of the alkaline digestion method. Mar. Chem. 45, 43–51. doi: 10.1016/0304-4203(94)90090-6
Rognes, T., Flouri, T., Nichols, B., Quince, C., and Mahé, F. (2016). VSEARCH: a versatile open source tool for metagenomics. PeerJ 4:e2584. doi: 10.7717/peerj.2584
Schloss, P. D., Westcott, S. L., Ryabin, T., Hall, J. R., Hartmann, M., Hollister, E. B., et al. (2009). Introducing mothur: open-source, platform-independent, community-supported software for describing and comparing microbial communities. Appl. Environ. Microbiol. 75, 7537–7541. doi: 10.1128/AEM.01541-09
Segata, N., Izard, J., Waldron, L., Gevers, D., Miropolsky, L., Garrett, W. S., et al. (2011). Metagenomic biomarker discovery and explanation. Genome Biol. 12:R60. doi: 10.1186/gb-2011-12-6-r60
Smith, J. M., Casciotti, K. L., Chavez, F. P., and Francis, C. A. (2014). Differential contributions of archaeal ammonia oxidizer ecotypes to nitrification in coastal surface waters. ISME J. 8, 1704–1714. doi: 10.1038/ismej.2014.11
Sournia, A. (1994). Pelagic biogeography and fronts. Prog. Oceanogr. 34, 109–120. doi: 10.1016/0079-6611(94)90004-3
Stocker, R. (2012). Marine microbes see a sea of gradients. Science 338, 628–633. doi: 10.1126/science.1208929
Strickland, J. D., and Parsons, T. R. (1972). A Practical Handbook of Seawater Analysis. Ottawa: Fisheries Research Board of Canada. 167–167.
Tada, Y., Taniguchi, A., Sato-Takabe, Y., and Hamasaki, K. (2012). Growth and succession patterns of major phylogenetic groups of marine bacteria during a mesocosm diatom bloom. J. Oceanogr. 68, 509–519. doi: 10.1007/s10872-012-0114-z
Taylor, A., and Joint, I. (1990). A steady-state analysis of the “microbial loop” in stratified systems. Mar. Ecol. Prog. Ser. 59, 1–17. doi: 10.3354/meps059001
Teeling, H., Fuchs, B. M., Becher, D., Klockow, C., Gardebrecht, A., Bennke, C. M., et al. (2012). Substrate-controlled succession of marine bacterioplankton populations induced by a phytoplankton bloom. Science 336, 608–611. doi: 10.1126/science.1218344
Teeling, H., Fuchs, B. M., Bennke, C. M., Krüger, K., Chafee, M., Kappelmann, L., et al. (2016). Recurring patterns in bacterioplankton dynamics during coastal spring algae blooms. eLife 5:e11888. doi: 10.7554/eLife.11888
Tréguer, P., Goberville, E., Barrier, N., L’Helguen, S., Morin, P., Bozec, Y., et al. (2014). Large and local-scale influences on physical and chemical characteristics of coastal waters of Western Europe during winter. J. Mar. Syst. 139, 79–90. doi: 10.1016/j.jmarsys.2014.05.019
Videau, C. (1987). Primary production and physiological state of phytoplankton at the Ushant tidal front (west coast of Brittany. France. Mar. Ecol. Prog. Ser. 35, 141–151. doi: 10.3354/meps035141
Voget, S., Wemheuer, B., Brinkhoff, T., Vollmers, J., Dietrich, S., Giebel, H.-A., et al. (2015). Adaptation of an abundant Roseobacter RCA organism to pelagic systems revealed by genomic and transcriptomic analyses. ISME J. 9, 371–384. doi: 10.1038/ismej.2014.134
Wan, X. S., Sheng, H.-X., Dai, M., Zhang, Y., Shi, D., Trull, T. W., et al. (2018). Ambient nitrate switches the ammonium consumption pathway in the euphotic ocean. Nat. Commun. 9:915. doi: 10.1038/s41467-018-03363-0
Keywords: marine front, bacterial communities, dynamic, network, ecological strategies
Citation: Lemonnier C, Perennou M, Eveillard D, Fernandez-Guerra A, Leynaert A, Marié L, Morrison HG, Memery L, Paillard C and Maignien L (2020) Linking Spatial and Temporal Dynamic of Bacterioplankton Communities With Ecological Strategies Across a Coastal Frontal Area. Front. Mar. Sci. 7:376. doi: 10.3389/fmars.2020.00376
Received: 12 November 2019; Accepted: 01 May 2020;
Published: 09 June 2020.
Edited by:
Eva Ortega-Retuerta, UMR7621 Laboratoire d’Océanographie Microbienne (LOMIC), FranceReviewed by:
Daniel P. R. Herlemann, Estonian University of Life Sciences, EstoniaJulie LaRoche, Dalhousie University, Canada
Copyright © 2020 Lemonnier, Perennou, Eveillard, Fernandez-Guerra, Leynaert, Marié, Morrison, Memery, Paillard and Maignien. This is an open-access article distributed under the terms of the Creative Commons Attribution License (CC BY). The use, distribution or reproduction in other forums is permitted, provided the original author(s) and the copyright owner(s) are credited and that the original publication in this journal is cited, in accordance with accepted academic practice. No use, distribution or reproduction is permitted which does not comply with these terms.
*Correspondence: Clarisse Lemonnier, clarisse.lemonnier@univ-brest.fr; Lois Maignien, lois.maignien@univ-brest.fr