Biodiversity and Species Change in the Arctic Ocean: A View Through the Lens of Nares Strait
 Dimitri Kalenitchenko1,2†
  Nathalie Joli1,2†
  Marianne Potvin1,2
  Jean-Éric Tremblay1
  Connie Lovejoy1,2*
- 1Département de Biologie and Québec Océan, Université Laval and Takuvik Joint International Laboratory (UMI 3376), Université Laval (Canada) – CNRS (France), Québec, QC, Canada
- 2Institut de Biologie Intégrative et des Systèmes (IBIS), Université Laval, Québec, QC, Canada
Nares Strait is the northern most outflow gateway of the Arctic Ocean, with a direct connection to the remaining multi-year ice covered central Arctic Ocean. Nares Strait itself flows into the historically highly productive North Water Polynya (Pikialasorsuaq). Satellite data show that Nares Strait ice is retreating earlier in the season. The early season surface chlorophyll signal, which was a characteristic of the North Water, has also moved north into Nares Strait. However, given the vast differences in the hydrography and physical oceanographic structure of the North Water and Nares Strait there is no a priori reason to assume that the species assemblages and overall productivity of this region between Greenland and Canada will be maintained in the face of ongoing sea ice decline. The North Water’s high marine mammal and bird populations are dependent on seasonally persistent diatom dominated phytoplankton productivity, and although there have been several studies on North Water phytoplankton, virtually nothing is known about the communities in Nares Strait. Here we investigated the microbial eukaryotes, including phytoplankton in Nares Strait using high-throughput amplicon sequencing. Samples were collected from Kennedy Channel below the northern ice edge of Nares Strait through the Kane Basin and into the northern limit of the North Water. The physical oceanographic structure and initial community rapidly changed between the faster flowing Kennedy Channel and the comparatively wider shallower Kane Basin. The community changes were evident in both the upper euphotic zone and the deeper aphotic zone. Heterotrophic taxa were found in the deeper waters along with ice algae that would have originated further to the north following release from the ice. Although there was a high proportion of pan-Arctic species throughout, the Nares Strait system showed little in common with the Northern North Water station, suggesting a lack of connectivity. We surmise that a direct displacement of the rich North Water ecosystem is not likely to occur. Overall our study supported the notion that the microbial eukaryotic community, which supports ecosystem function and secondary productivity is shaped by a balance of historic and current processes, which differed by seascape.
Introduction
The Arctic Ocean is being impacted by climate warming and extensive summer ice-retreat in most sectors (Krishfield et al., 2014) including Nares Strait. Nares Strait between Greenland and Ellesmere Island (Canada) is the northernmost outflow gateway of the Arctic Ocean (Münchow and Melling, 2008). The strait connects the Lincoln Sea with Baffin Bay (Figure 1). The Lincoln Sea, at the edge of the Arctic Deep Basins, covers the Northern Ellesmere Shelf with source waters from the Beaufort Sea and Canada Basin, and the North Greenland Shelf with source waters from the Central Arctic. The flow out of Nares Strait with an average of 0.8 ± 0.3 Sv is a major source of Arctic and modified Pacific Water (PW) to the North Atlantic and is equivalent to the inflow from Bering Strait into the Arctic Ocean (Coachman and Aagaard, 1988; Münchow et al., 2006). The southward flow exits Nares Strait through a 25 km wide channel with a 220-m deep sill at Smith Sound (Cape York, Figure 1) where an ice arch typically forms in winter. This ice arch (or ice bridge) is crucial in maintaining the North Water Polynya, also known as Pikialasorsuaq (Jennings et al., 2011), which is a major ecological feature in Northern Baffin Bay. A second more northern ice arch usually forms at the boundary between Nares Strait and the Lincoln Sea, this ice arch regulates ice transport and the open water season within Nares Strait (Moore and McNeil, 2018). The two ice arches breach in summer and the sea ice transported through Nares Strait has a major influence on the surface salinity of the Labrador Sea. Over the last two decades, the date of formation and locations of the ice arches have become variable, which influences the opening date and extent of the North Water Polynya. Over this time period, the earliest open water has been moving north, away from the eastern side of the North Water and into Nares Strait (Preußer et al., 2015). Early season surface chlorophyll, detected via satellite, is also moving away from the North Water into Nares Strait (Marchese et al., 2017).
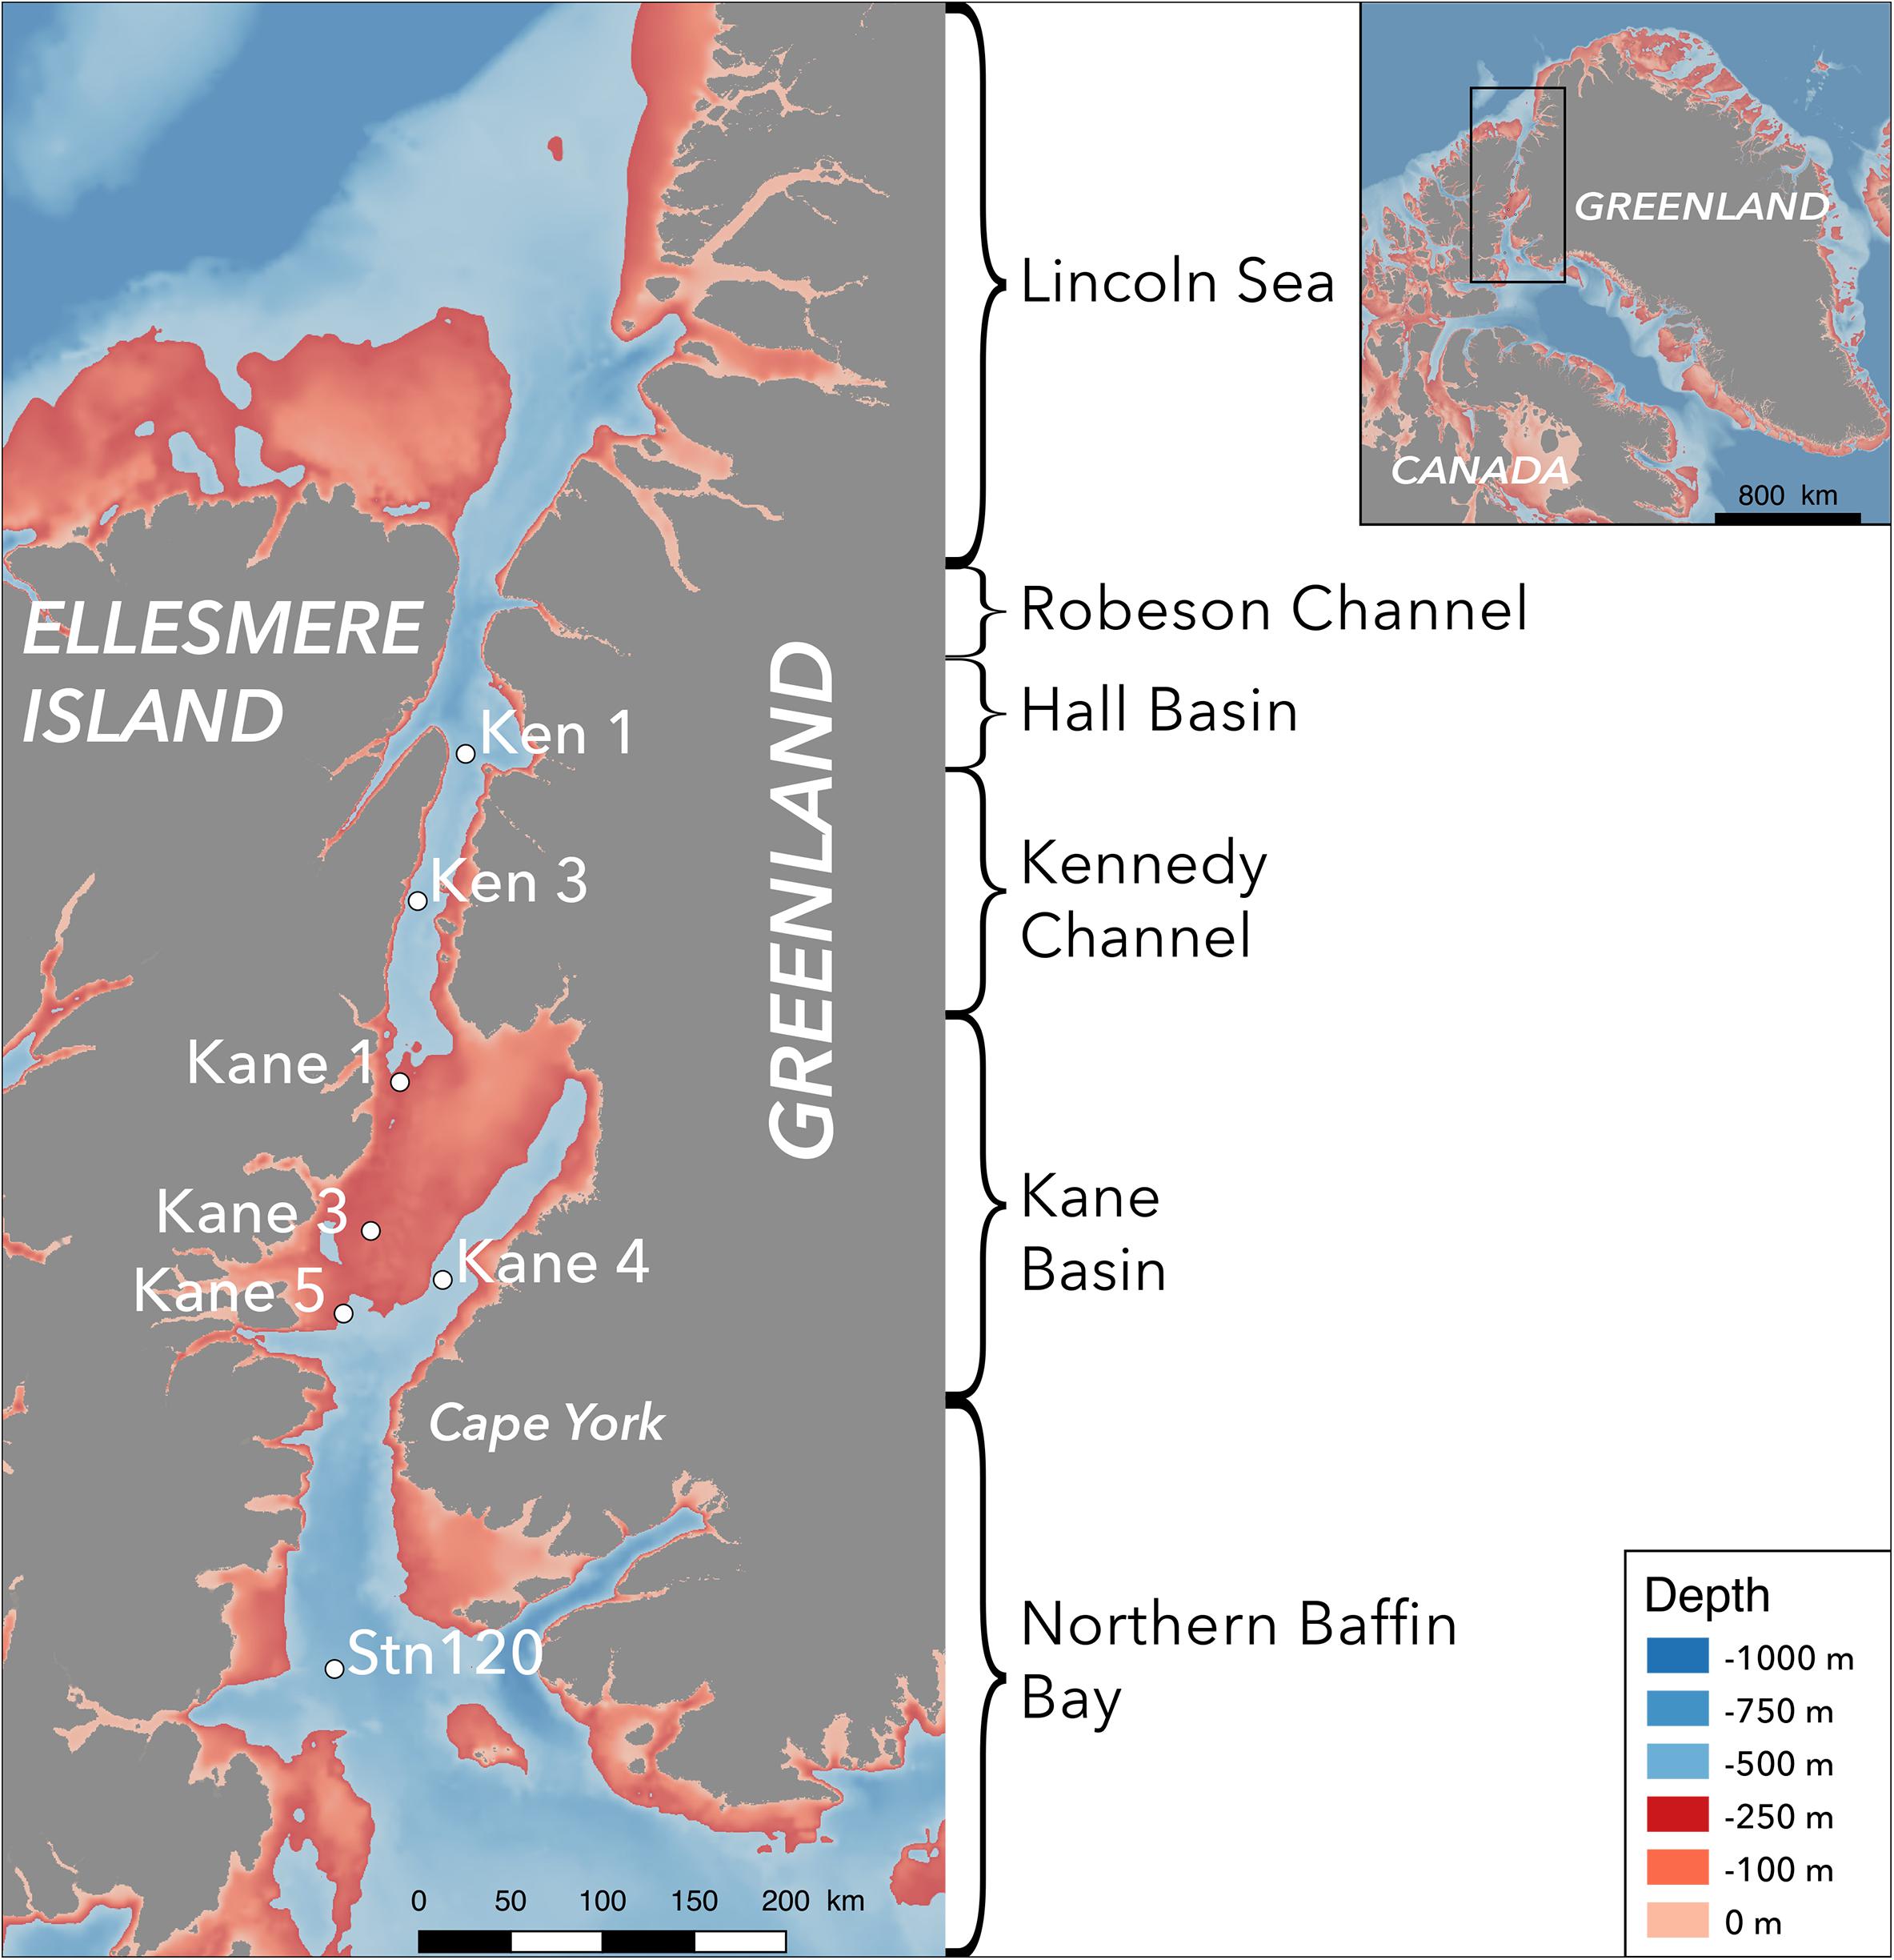
Figure 1. Map of the Nares Strait and top of Baffin Bay, indicating the names of the geographical features and sampling sites. The color scale on the map indicates depth, with shallow depths from 0 and 250 m in reds and deeper waters in blues.
Generally, arctic photosynthetic planktonic productivity is thought to follow retreating ice edges, and as surface nutrients are drawn down chlorophyll concentrations and phytoplankton productivity become non-detectable (Renaut et al., 2018). In contrast, the North Water Polynya has a much longer productive season, supporting large populations of migrant and resident marine mammal and bird populations (Heide-Jørgensen et al., 2013). The massive annual production of the North Water is linked to regional hydrography, which is influenced by cyclonic circulation. Briefly, deep nutrient rich Atlantic Water (AW) flows north along the Greenland side of Baffin Bay. The deep water upwells along the Greenland coast, providing a source of nutrients to the phytoplankton community, with impacts on local stratification and microbial eukaryotic species distribution (Joli et al., 2018). Due to geography and the Coriolis force, the flow is eventually deflected west to join the south flowing Baffin and Labrador Current system along the coast of Canada. The northern limit of the north flowing deep AW in the North Water is variable. The narrowest most southerly point of Nares Strait at Cape York is still sufficiently wide for opposing baroclinic flows (Leblond, 1980; Münchow et al., 2015) and subsurface north flowing AW could penetrate into Kane Basin, but not to the same extent as in the North Water. In contrast to the North Water, Nares Strait is thought to be a flow through system, consisting of deep channels and more shallow basins (Jackson et al., 2014). This leads to the supposition that Nares Strait and the North Water have different water mass histories, which could lead to distinct marine microbial eukaryote communities.
The differences in hydrography between the North Water Polynya and the Nares Strait system are substantial and as surface productivity moves north there is no a priori reason to expect a simple northward displacement of microbial community structure between the two systems. Microbial eukaryotes track their water mass of origin but are subject to differing degrees of selective pressures within their local environment (Monier et al., 2015; Onda et al., 2017). However, little to nothing is known about the species composition of phytoplankton and other microbial eukaryotes within Nares Strait and whether they are similar to species previously reported from the North Water or elsewhere in the Arctic. Given the importance of species for microbial food web function, the biological carbon pump, and benthic pelagic coupling (Mitra et al., 2014; Stasko et al., 2018), there is an urgent need to better understand the species composition of phytoplankton and associated other protist species in this northernmost gateway. To address this, we carried out a survey of microbial eukaryotes in Nares Strait using high-throughput sequencing (HTS) targeting the V4 region of 18S rRNA and the 18S rRNA gene. We sampled the major water masses in the euphotic zone and deeper waters in Kennedy channel and Kane Basin (Figure 1). These communities were then compared with a station at the top of the North Water. We also identified likely characteristic or indicator species from the different water masses and regions.
MATERIALS AND METHODS
Study Site
Nares Strait (Figure 1) includes Robeson Channel, Hall Basin, Kennedy Channel, and Kane Basin (Vincent and Marsden, 2010). Briefly, the Kennedy Channel is delimited on the northern end by Cape Baird (81° 22.2′ N, 64° 25.8′ W) and Cape Morton (81° 12′ N, 62° 48′ W) and on the southern end by Cape Lawrence (80° 25.2′ N, 69° 13.2′ W) and Cape Jackson (80° 9.6′ N, 67° 0′ W). The seabed can be simplified as a smooth slope progressing north to south from 500 to 250 m depth (Figure 1). Kane Basin with an area of 3900 km2 at the southern end of Nares Strait lies between Kennedy Channel in the north and Smith Sound (78° 15′ N, 74° 0′ W) in the south. Kane Basin is the shallowest region of Nares Strait with a depth 250 m over 72% of the basin. At the center of the northern reaches of the North Water, Stn 120 (77° 19.33′ N, 75° 19.37′ W; Figure 1) with a depth of 560 m is influenced by the Northern Baffin Bay currents described above. This study was carried out over 3 days in early August 2014 when the sea ice cover was >90% above Kennedy Channel, but with open waters to the south where all samples were collected. (Canadian Ice Service archive data1).
Field Sampling
Sampling was carried out onboard the Canadian icebreaker CCGS Amundsen starting at the top of Kennedy Channel beginning at 18:00 UTC, 3 August and ending in the northern reaches of the North Water at 19:00 UTC on 6 August in 2014 (Table 1 and Figure 1). Seawater was collected directly from 12-L Niskin-type bottles mounted on a Rosette system equipped with a conductivity, temperature, depth profiler (CTD, Sea-Bird SBE-911, Sea-Bird Electronics Inc.), and sensors for chlorophyll fluorescence (Seapoint Sensors Inc.), dissolved oxygen (Seabird SBE-43), fluorescent colored dissolved organic matter (fCDOM, Wetlabs ECO), and photosynthetically available radiation (PAR, 400–700 nm; QSP-2300 Biospherical Instruments). Salinity is reported using the TEOS-10 Practical Salinity scale (International Oceaographic Congress et al., 2010). The oxygen sensor was calibrated onboard against Winkler titrations (Ardyna et al., 2011). Chlorophyll concentrations from the fluorescence probe were calibrated from extracted Chl a (Ardyna et al., 2011). The fCDOM units are relative from factory calibrations. Nutrients were sampled directly from the Niskin-type bottles, with samples pre-filtered through a glass fiber filter (GF/F, Whatman) into acid cleaned polyethylene tubes and stored in the dark at 4°C. Nitrite + nitrate (referred to as nitrate hereafter), phosphate, and silicate concentrations were measured colorimetrically (Grasshoff et al., 1999) with a Bran and Luebbe AutoAnalyzer III within a few hours of collection on board the ship.
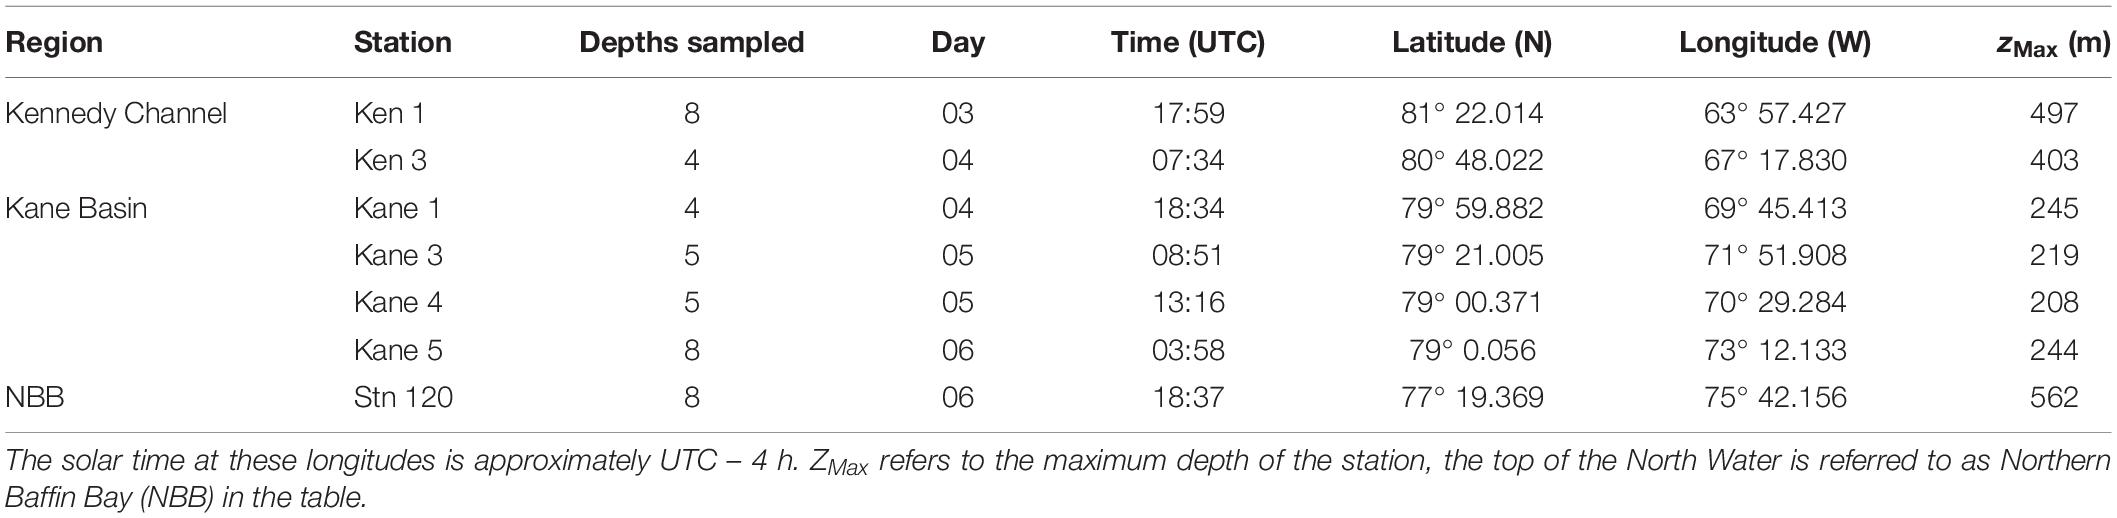
Table 1. Station location, day, and time of sampling in August 2014.
Discreet sample depths were selected during the downward cast based on the temperature–salinity (TS) and Chl a profiles and samples were collected on the upcast. Specifically, for the upper water column (euphotic zone) we targeted: near surface (1 or 2 m), above the Chl a fluorescence maximum (Chl max), the Chl max, and below the Chl max (ca. 50 m). For the deeper waters (aphotic zone), the target depths were: the deep temperature minimum, which is characteristic of PW; and at the temperature maximum, which is characteristic of AWs. When sampling opportunities were limited by ship logistics, the temperature minimum was targeted first, followed by at least one sample below this PW mass from presumed AW with warmer temperatures and greater salinities (Supplementary Table S1).
Samples for phytoplankton and bacterial enumeration were collected for flow cytometric analysis (FCM) directly from the Niskin-type bottles and fixed by adding 90 μL of 25% glutaraldehyde to 1.8 mL of seawater for a final concentration of 1% (v/v). Preserved samples were left for 30 min at 4°C in the dark, flash frozen in liquid nitrogen, and stored at −80°C. For nucleic acids, water for each depth sampled was collected into cleaned (rinsed with 5% HCL, followed by three rinses each of Milli-Q® water and sample water) 7-L polycarbonate (PC) carboys. For each depth, 5–6 L of seawater was first pre-filtered through a 50-μm mesh, and then sequentially filtered through a 47-mm 3 μm pore size polycarbonate filter and a 0.2-μm pore-size SterivexTM filter unit (Millipore). The PC filters were placed in microfuge tubes containing RNAlaterTM (Thermo Fisher Scientific), which was also added to the Sterivex units. After 30 min at room temperature, filters were transferred to −80°C until analysis. All samples were filtered and preserved within 3 h of collection.
Contribution of Pacific Water to Nares Strait
Water masses evident from the TS diagrams (Figure 2) were further characterized by nitrate and phosphate concentrations (Supplementary Table S1). To estimate the PW contribution we assumed a linear relationship between total nitrate and phosphate for the AW and PW (Jones et al., 1998; Kawai et al., 2008).
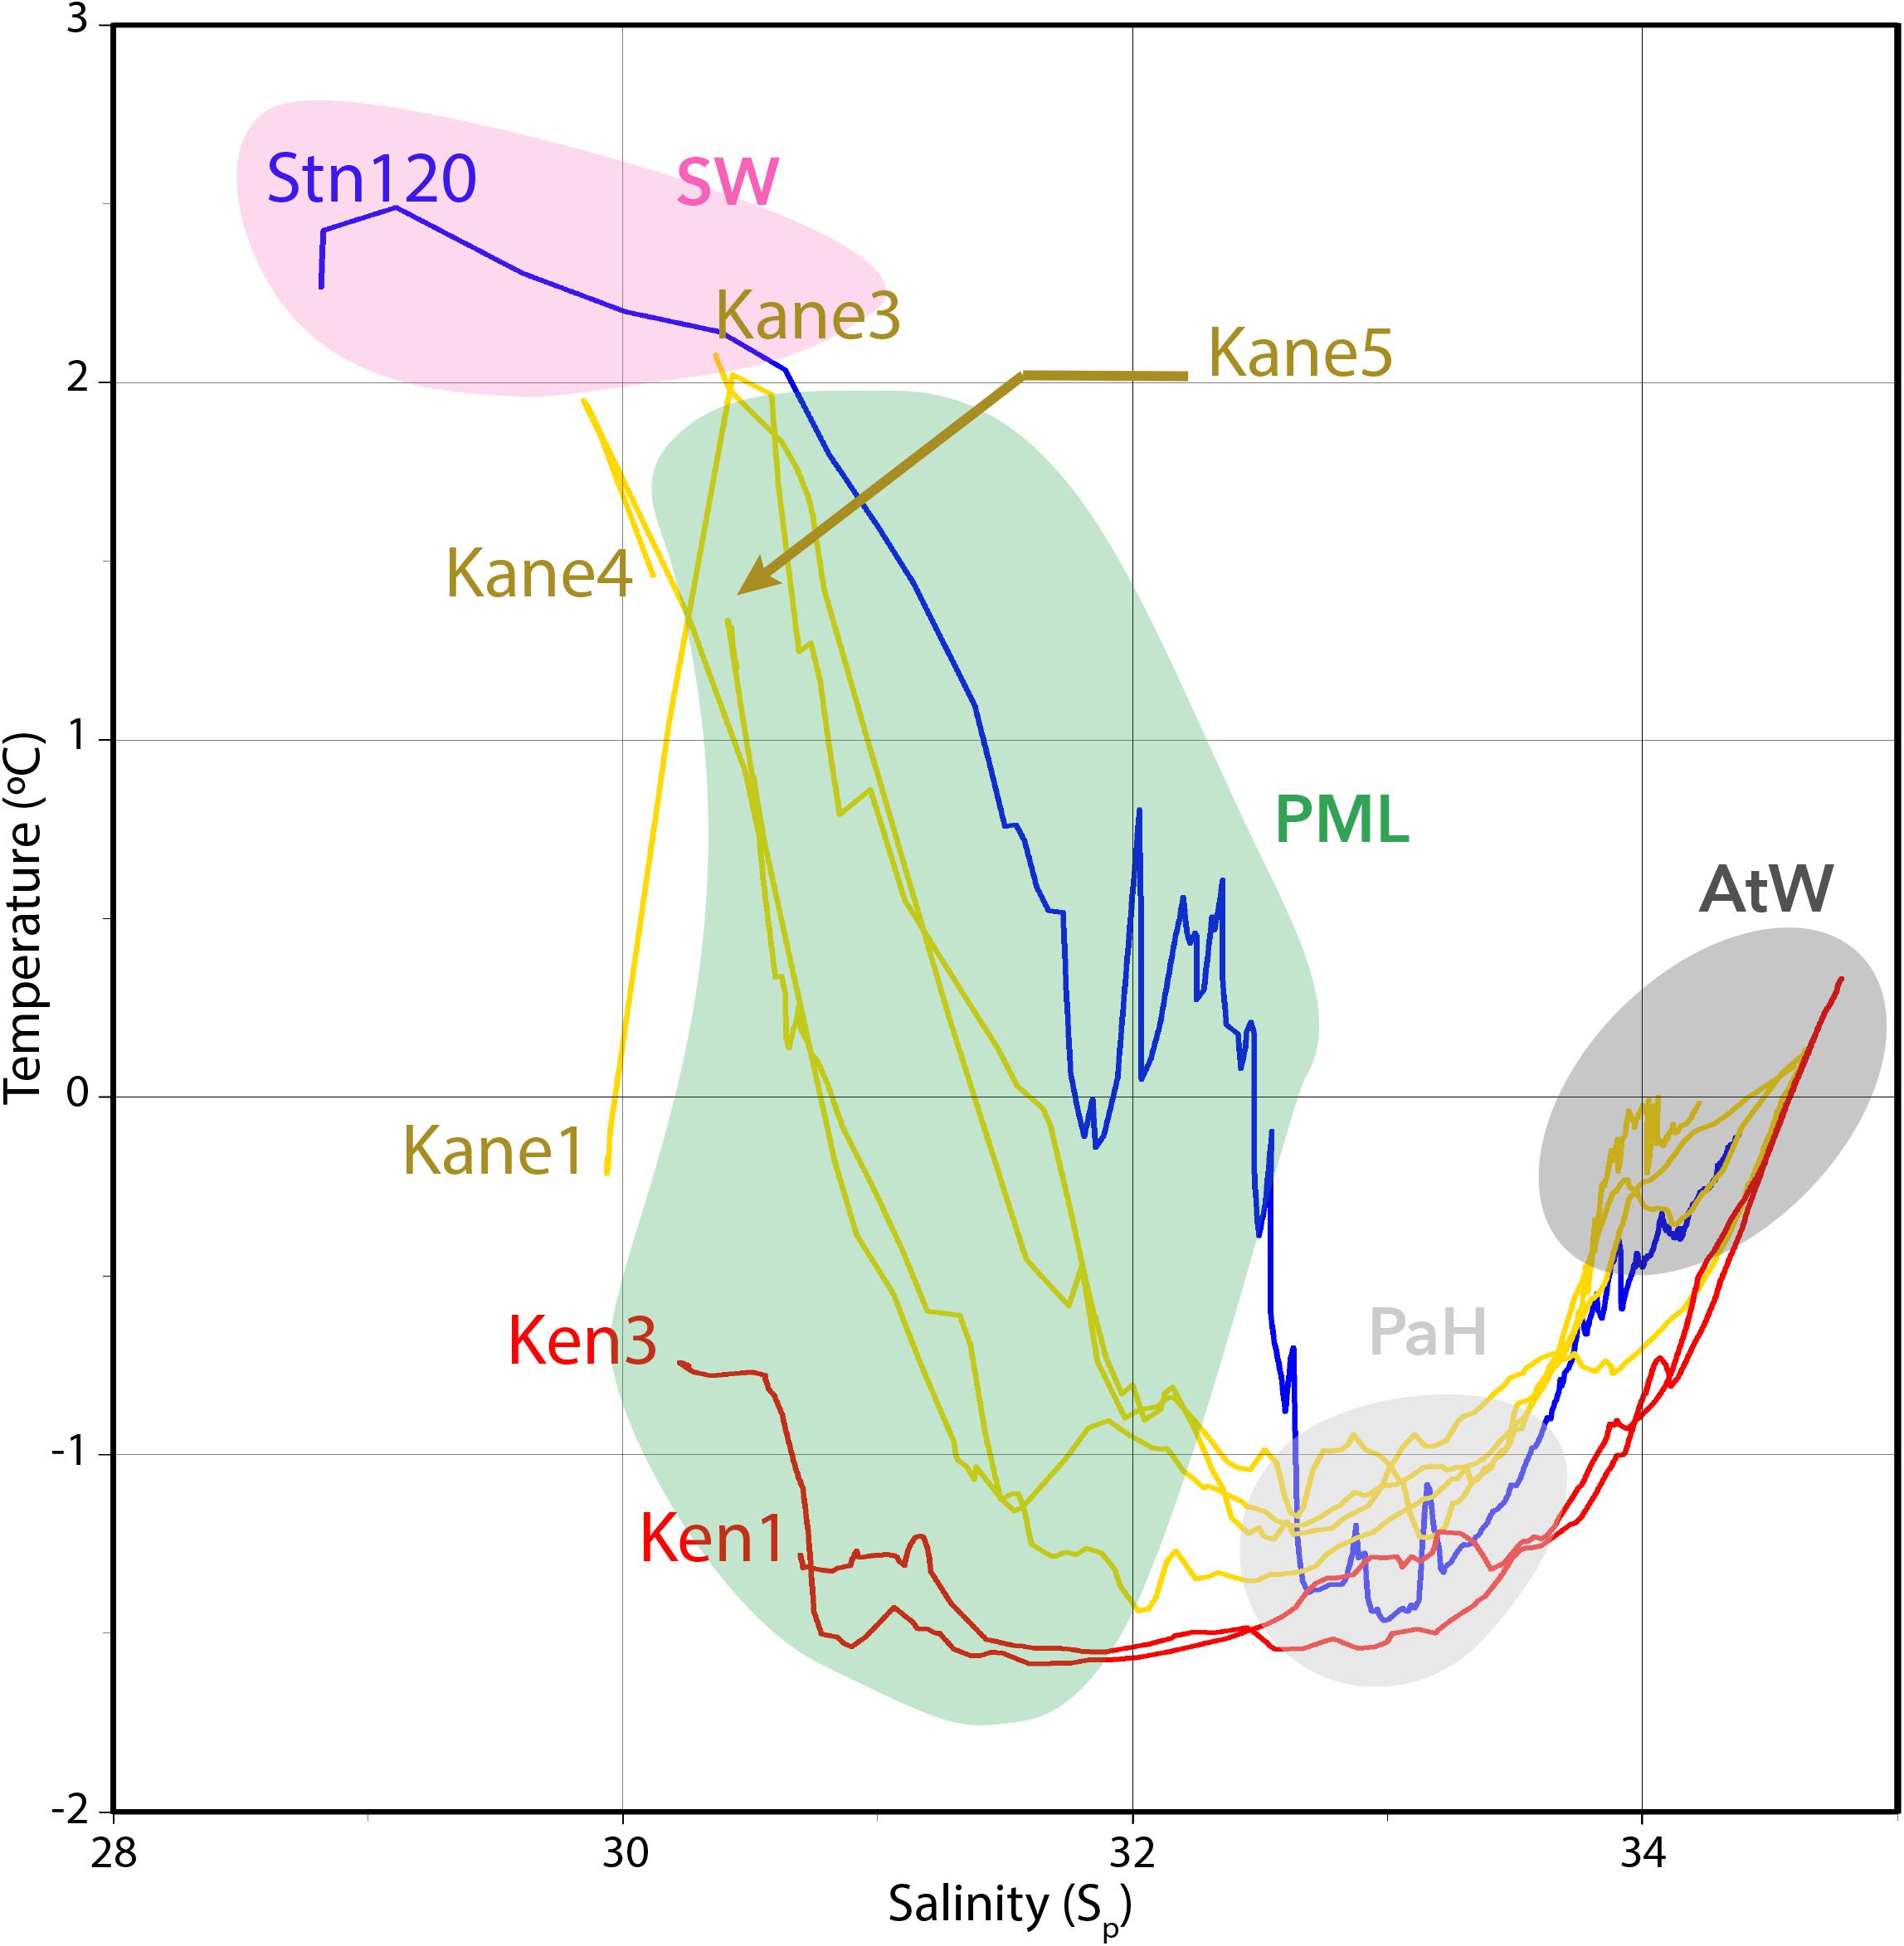
Figure 2. Temperature versus salinity plots of the seven stations. Kennedy Channel stations (Ken) and Kane Basin (Kane) 1 in red; Kane Basin stations 3, 4, and 5 in yellow; and Station 120 in dark blue. The water masses identified in the text are indicated by shading with the polar mixed layer (PML) in green, Pacific Halocline (PaH) in light gray, and deep Atlantic water (AtW) in dark gray. The warmer surface waters (SW) are indicated in pink.
The putative proportion of PW was then used as an additional factor for classifying water masses using the unweighted pair group method with arithmetic mean (UPGMA) based on the Euclidian distance similarity matrix calculated with the R package “vegan” v2.4 (Dixon, 2003). Although this method of estimating Pacific versus AW proportions is most often used for describing deeper water masses, where nutrient ratios are more conserved, we applied this to the upper water column samples as well. Given that water from Pacific influenced regions in the Arctic tends to be higher in fCDOM compared to AW (Granskog et al., 2012; Gonçalves-Araujo et al., 2018; Makarewicz et al., 2018), our estimated PW proportions were compared with fCDOM concentrations.
Laboratory Procedures
The FCM samples were analyzed using a BD AccuriTM C6 flow cytometer (BD Biosciences), equipped with a blue (640 nm) laser. The flow rate was set at 25 mL min–1, and picophytoplankton (1–3 μm) and nanophytoplankton (3–15 μm) were separated based on side scatter and chlorophyll a fluorescence (SSC) at 670 nm. For Bacteria and Archaea enumeration, SYBRTM Green (Roche Diagnostic) was added and cells counted as in Marie et al. (2001). Bacteria and Archaea cannot be distinguished by FCM and are referred as Bacteria for convenience.
Nucleic acids from the large and small fractions were extracted from their respective filters, using the AllPrep Mini Kit (Qiagen), with DNA and RNA recovered from the same filters as described previously (Przytulska et al., 2016; Thaler et al., 2017). Following the added DNAase step, RNA purity was verified by PCR as suggested by the manufacturer. RNA was then converted to cDNA using the Applied BiosystemsTM High Capacity cDNA Reverse Transcription Kit (Thermo Fisher Scientific). The V4 region of 18S rRNA and 18S rRNA gene was amplified using primers E572F (CYG CGG TAA TTC CAG CTC) and E1009R (CRA AGA YGA TYA GAT ACC RT) as in Comeau et al. (2011). Amplicons were tagged for multiplexing with MiSeq specific linking primers and sequenced on an Illumina MiSeq® by the “Plateforme d’Analyses Génomiques” (IBIS, Université Laval, Canada). Raw sequences are available under Bioproject PRJEB24314 in the European Nucleotide Archive (ENA). Reads originating from DNA template and RNA templates will be referred to as rDNA and rRNA, respectively.
Sequence Data Analysis
We first merged the forward and reverse read pairs using BBMerge (v 37.36, Bushnell et al., 2017) followed by quality filtering with a maxEE parameter of 1 in vsearch (Rognes et al., 2016). The sequence pool was reduced by selecting unique sequences to decrease the computational need for the chimera checking and operational taxonomic unit (OTU) clustering in USEARCH (Edgar, 2010). A similarity threshold of 98%, which was used to define OTUs, generated 1909 OTUs. We then selected the most abundant read of each OTU and found the closest known sequence in our arctic centric microbial eukaryote database (Lovejoy et al., 2016) using the Wang method in mothur (v1.39, Schloss et al., 2009). An OTU table was constructed using the number of copies of each unique sequence of different OTUs and samples. The final OTU table was trimmed to remove OTUs belonging to metazoa and resampled down to 1362 sequences, which was equal to the retained reads for sample 120-40m-L-RNA. This particular sample had a high proportion of Ctenophora reads and since our goal was to compare beta diversity and the most common OTUs in the different regions, we felt this was preferable to discarding the sample.
Diversity
The two size fractions were independently used to determine beta diversity in the rDNA and rRNA communities. The Bray–Curtis dissimilarity matrices were calculated using the QIIME python package (Caporaso et al., 2010) and the resulting matrices converted into rooted dendrograms using UPGMA. We then matched samples and clustering patterns from the rRNA reads with the rDNA reads using the R package “phytools” (v0.1.2, Revell, 2011).
For the remaining analyses the large and small fraction results were combined; reads from the same sample that belonged to the same OTU of one size fraction were added to the reads of the other size fraction. Because individual OTUs were mostly found in one or the other fraction, this mathematical operation should not mask or over represent a given OTU.
To explore the gains and losses of abundant OTUs from the northernmost site of Nares Strait through to Stn 120 in the North Water, we categorized OTUs based on their original occurrence at the Kennedy 1 (Ken 1) station. Ken 1 OTUs with occurrences >0.01% were classified based on presence in rRNA and rDNA and by depth (euphotic versus aphotic). Since the goal was not to identify a rare biosphere, for this analysis OTUs with <0.01% of total reads were categorized as “not detected.”
We used the Multinomial Species Classification Method (CLAM) test (Chazdon et al., 2011) function in R to find characteristic or indicator OTUs in the two depth categories of the three regions (Kennedy Channel, Kane Basin, and Stn 120 as the North Water representative). Separation of the samples and OTUs was based on a super-majority specialization threshold of 0.75 and a p-value of 0.01 divided by the number of OTUs to adjust for multiple comparisons. The rarity threshold was set at 24 sequences. The pairwise CLAM test classified each of the OTUs into: generalists, environment 1 specialist, environment 2 specialist, and OTUs too rare to be assigned to the previous three categories. Three comparisons (Kane vs. Kennedy, Kennedy vs. St 120, and Kane vs. St 120) were applied separately to communities categorized as euphotic rDNA, euphotic rRNA, aphotic rDNA, and aphotic rRNA. This method identified taxa that occurred in single to multiple geographic regions. OTUs were considered characteristic of a particular region if found both the rDNA and the rRNA, since reads from only one of the templates have a greater chance of being either sequencing artifacts (rRNA only) or from dead cells (rDNA) (Blazewicz et al., 2013). The regional indicator OTUs accounting for >1% of the reads in either the euphotic or aphotic zones were further identified using BLASTn analysis (Camacho et al., 2009) against the large NCBI non-redundant nucleotide database (Release 223); all resulting e-values were 0.0. Phylogenies of named species were verified by aligning available related longer 18S rRNA genes and RAxML (Stamatakis, 2006).
Results
Oceanographic Properties
Overall, we sampled the four major water masses that flow through Nares Strait (Figure 2), with the contribution of PW based on nutrient ratios generally consistent with the TS classifications (Supplementary Figure S1). The Deeper AW was defined by high salinity (33.95–34.78, median 34.29), a low putative contribution of PW (5–24%, median 13%) with temperatures around 0°C (−0.46 to +0.33°C, median −0.03°C). The Pacific Halocline was defined by salinities from 32.52 to 33.98 (median 33.13), temperatures from −1.38 to −0.54°C (median −1.21°C), and PW from 22 to 64% (median 42%). Above the Pacific Halocline was a broadly defined Polar Mixed Layer (PML; Supplementary Figure S1). Four of the surface samples clustered apart from the PML, with properties consistent ice melt and influenced by solar heating (Supplementary Figure S1). This Surface Water was fresher with salinities of 28.89–30.45 (median 30.13), relatively warm from +1.86 to +2.43°C (median +1.91°C) and estimated PW from 14 to 19%. This distinctive Surface Water was first detected in the lower Kane Basin, and had similar physical properties to Surface Water at Stn 120.
Photosynthetically available radiation was <1% of surface irradiance for all of the sampling depths collected from below the PML (Supplementary Table S1). Oxygen concentrations tended to be under-saturated in the Kennedy Channel photic zone ranging from 89 to 94% and more variable in the upper waters of the Kane Basin. Oxygen was always under-saturated in the deeper samples going as low as 66% in some of the Kane Basin waters (Supplementary Table S1). fCDOM was relatively high in all samples from the Nares Strait PML, with a maximum of 11.1 for Ken1–2 m and a minimum 8.66 at Kane3–2 m. The Surface Water fCDOM from Nares Strait ranged from 8.25 to 8.67, but was lower at Stn 120 with a value of 6.46. The fCDOM values tended to be lower in the Pacific Halocline and AW with median of 7.47 and 5.34, respectively (Supplementary Table S2). Within the two major depth categories (euphotic versus aphotic) in Nares Strait, the percent PW based on nutrient ratios was significantly correlated with fCDOM (Figure 3). The fCDOM values were generally lower in the deeper waters and higher in the upper waters. Stn 120 was exceptional with all depths, including the Surface Water and PML samples falling close to the Nares Strait deeper water regression line (Figure 3).
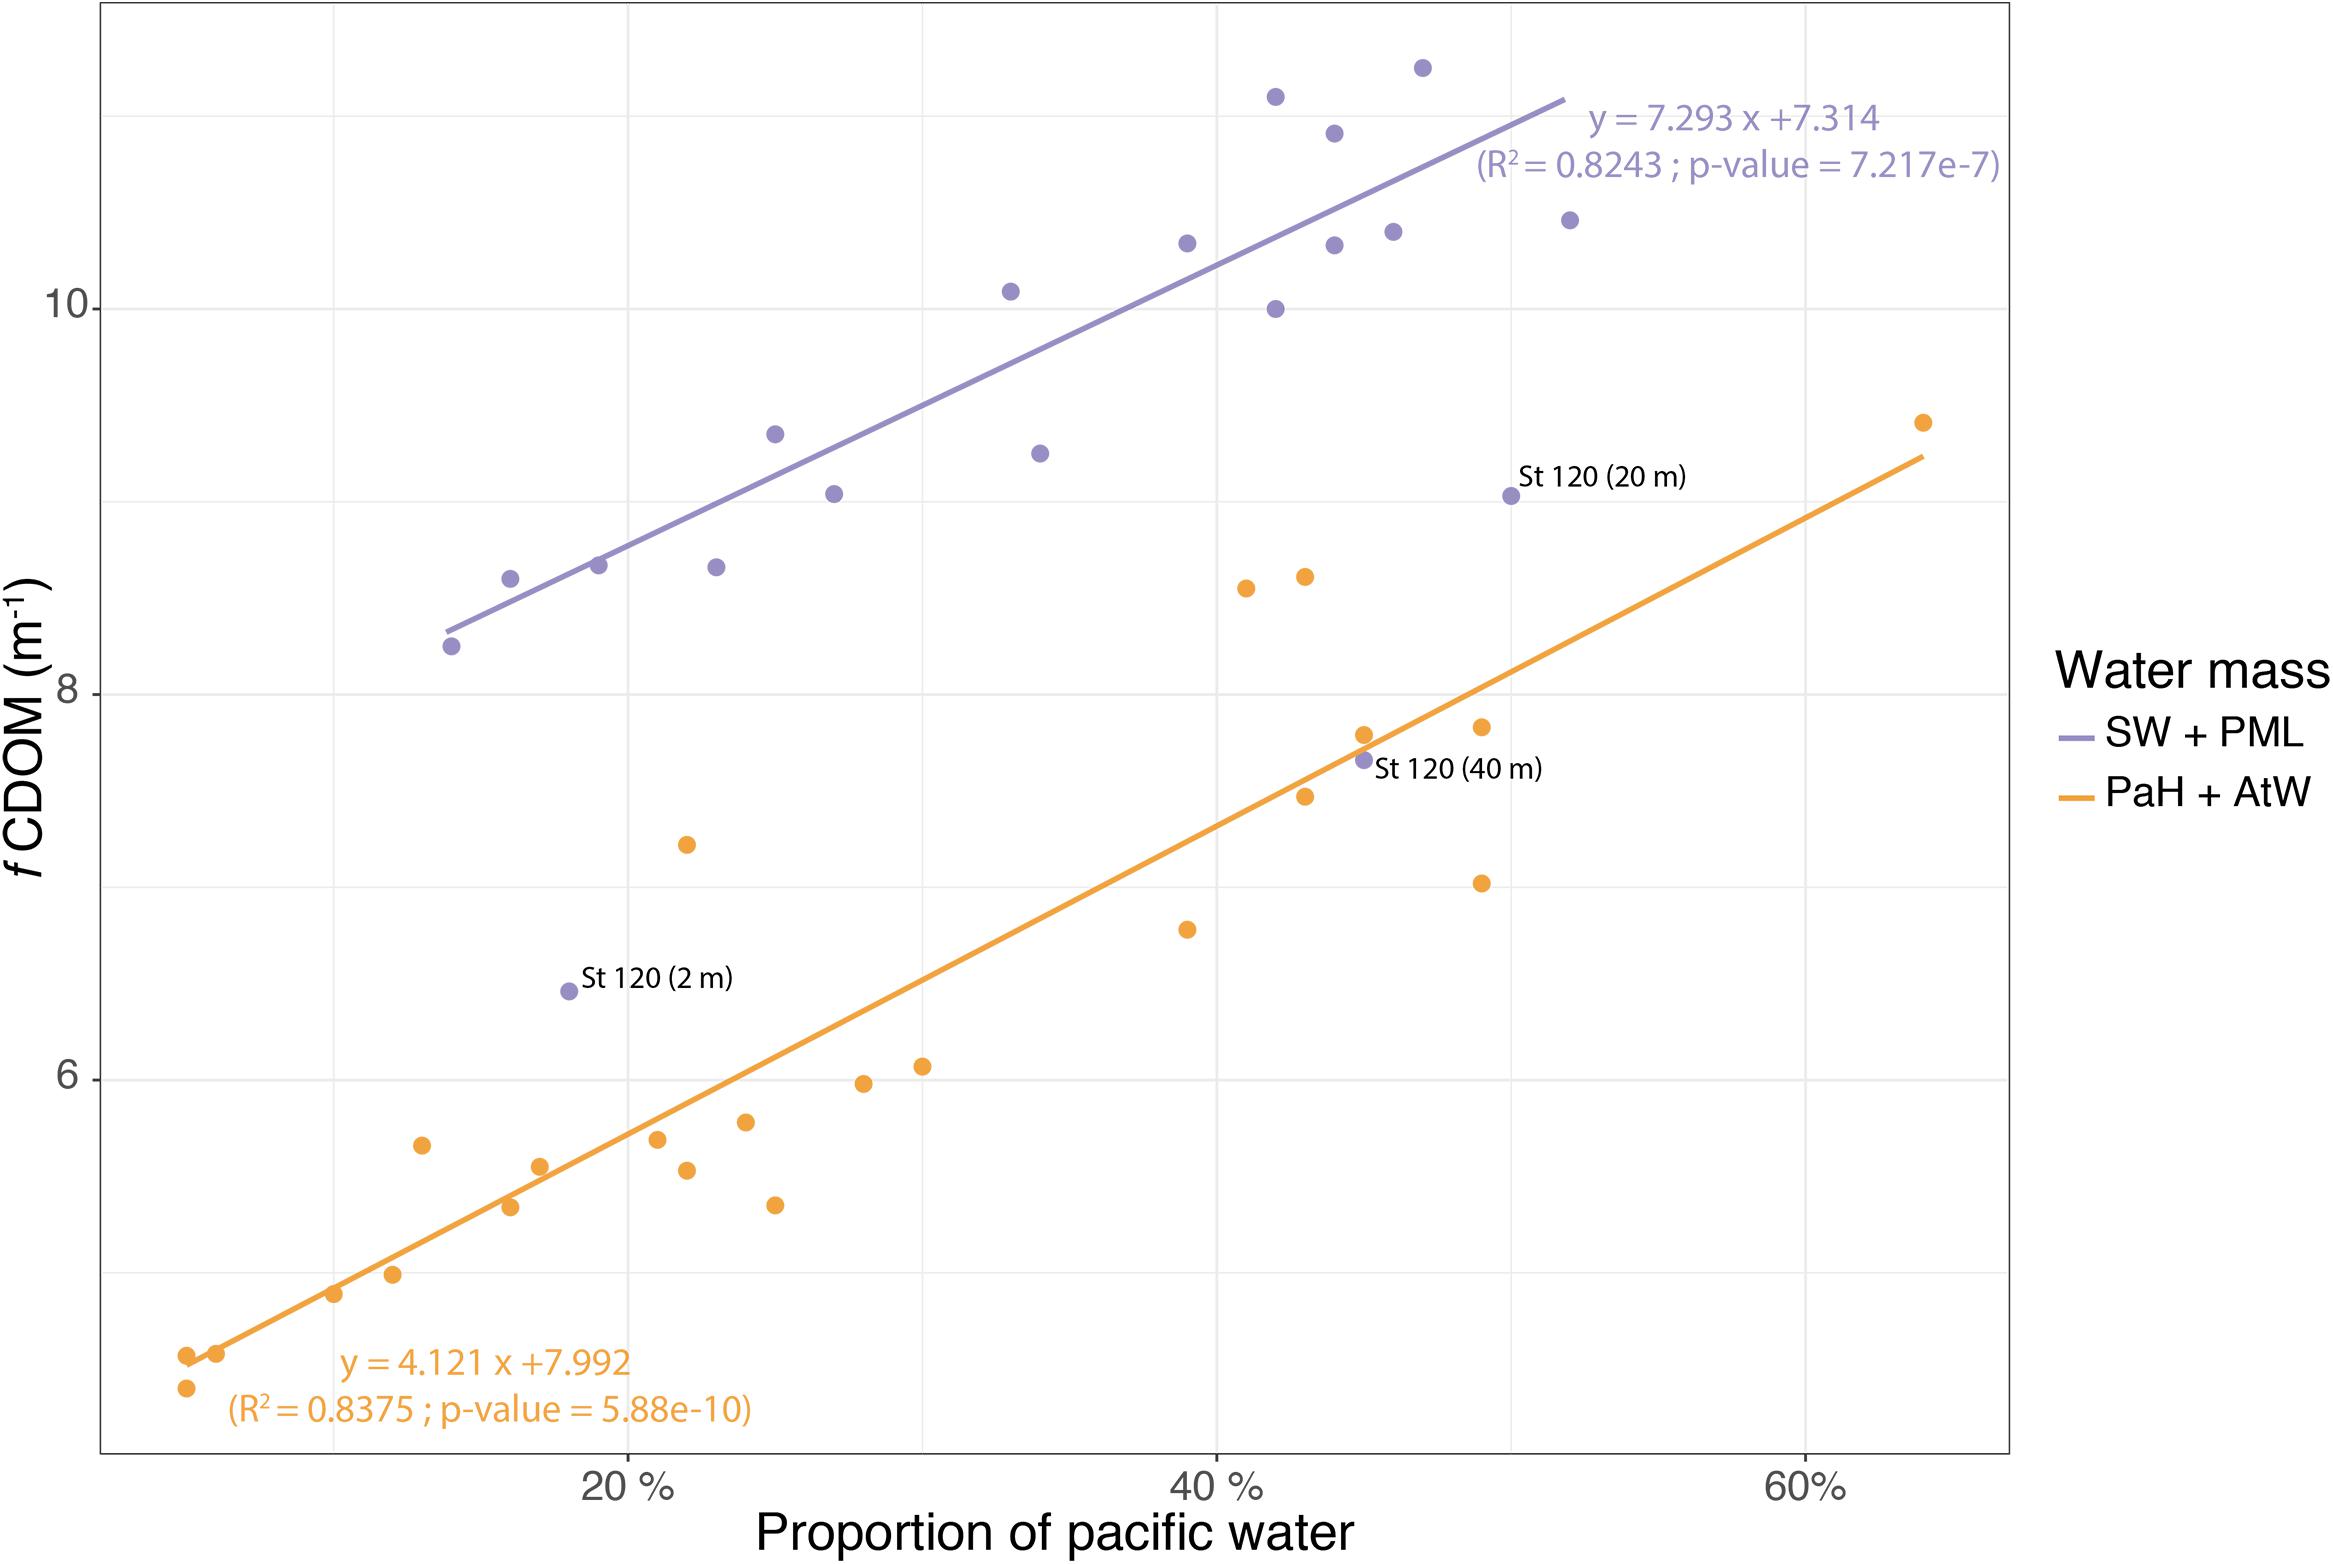
Figure 3. Plot and linear regression of the fCDOM values against the calculated PW contribution in the surface (upper line) and deep layer (lower line) of the Nares Strait samples. The Stn. 120 values are indicated separately as gray dots.
The Kennedy Channel sites (Ken 1 and Ken 3) had relatively low chlorophyll and high nutrient concentrations throughout the water column, including within the euphotic zone. A subsurface chlorophyll maximum (SCM) was not detected at either of these two stations (Supplementary Figure S2). In contrast, there was a pronounced SCM in Kane Basin, with nutrients depleted in the upper waters. SCM Chl a concentrations in Kane 1 and Kane 5 on the western side of Kane Basin were ca. 5 mg m–3 and concentrations from Kane 4 on the eastern side were ca. 1.75 mg m–3 (Supplementary Figure S2). Stn 120 nutrients and Chl a levels were both relatively low throughout the water column (Supplementary Figure S2).
Euphotic zone bacteria concentrations were lowest at the Ken 1 station and with little change through Nares Strait averaging 1.6 ± 0.4 × 10⁵ cells ml–1. By way of comparison, the Stn 120 bacteria concentrations were significantly greater (Wilcoxon test: W = 0, p-value = 0.002) with 4.4 ± 1.3 × 10⁵ cells ml–1. Bacteria concentrations in the deeper waters increased with decreasing latitude, with a significant correlation between the latitude of collection and log transformed bacteria concentration (ANOVA, F = 21.89, p-value = 0.0003). We did not detect any significant latitudinal trends in picophytoplankton or nanophytoplankton concentrations in either euphotic or aphotic water masses (Supplementary Table S2).
Beta Diversity of the Microbial Community
Four libraries per sample were generated consisting of the large and small fractions from RNA and DNA with a total of 15,473,183 reads from the 42 samples (Table 1). Of these 2,249,442 sequences were retained after removing metazoa, chimeras, and poor quality reads. To facilitate the analyses for beta diversity and other metrics, the libraries were rarefied down to 1362 reads per library. The 228,816 remaining sequences were then clustered into 1426 OTUs at a similarity level of 98%. Within Nares Strait, the euphotic zone (upper water) samples and the aphotic zone (deeper) samples were separated using Bray–Curtis clustering (Figure 4). The Stn 120 communities from rRNA and rDNA were also segregated by depth; however, the 71 and 101 m small fraction communities varied by template. The rDNA communities clustered with the Stn 120 deeper samples, while the rRNA communities from the same depths clustered with euphotic zone samples (Figure 4).
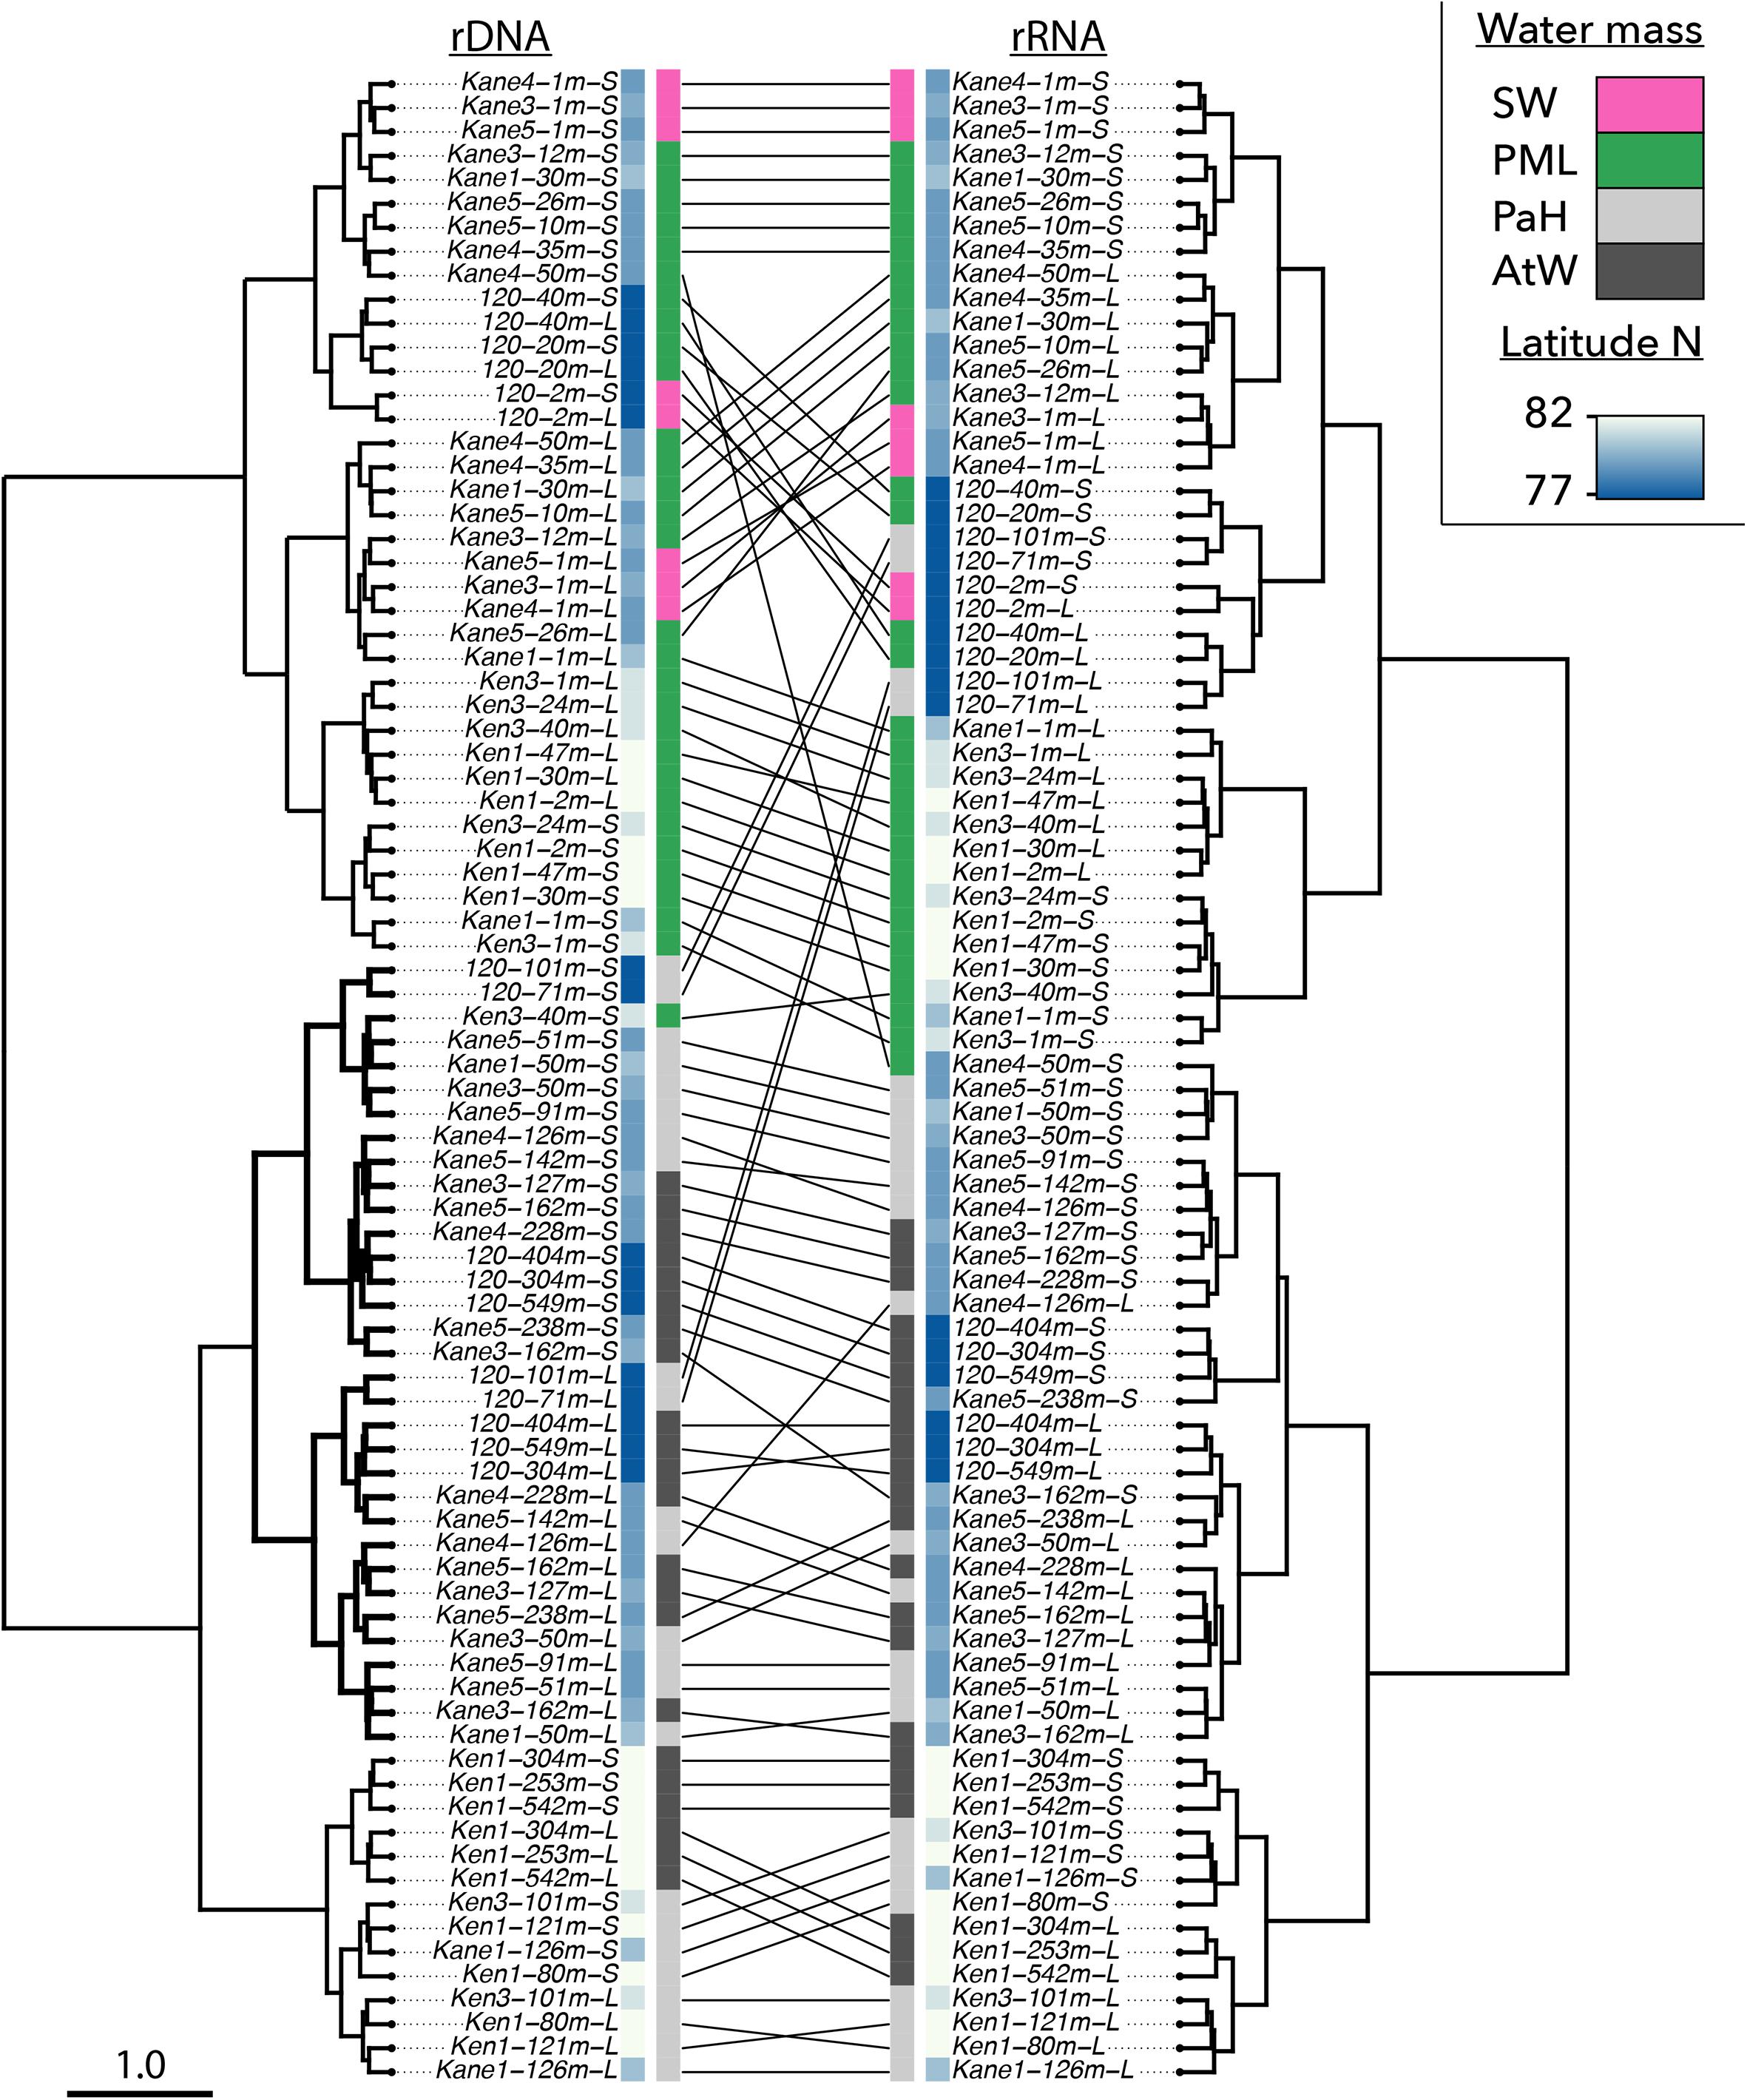
Figure 4. Beta-diversity shown by Bray–Curtis Cluster analyses based on community dissimilarity from the rDNA (left) and rRNA (right) community matrices. In this figure large and small fraction are shown separately. Sample names consist of sampling station, the depth and the fraction (L for large and S for small). Lines between the left and right clusters connect rDNA samples to the corresponding rRNA samples. The inner colored bars indicate the latitude of the samples (in blues), and the water mass classification as given in Figure 2. Here, pink for surface water (SW), green for polar mixed layer (PML) waters, light gray for Pacific Halocline (PaH), and dark gray for deep Atlantic Water (AtW).
Within the broad depth categories, both the rDNA and the rRNA communities predominantly clustered by region (Figure 4). One exception to this geographical pattern was the 1 m depth small size fraction community from of the most northern Kane Basin station (Kane 1–1 m S), which clustered with the upper water column Kennedy Channel communities. The Pacific Halocline and AWs clustered together by region with Kane Basin and Kennedy Channel communities forming separate clusters. The Stn 120 deeper communities tended to group within sub-clusters of the Kane Basin. Finally, the large and small fractions formed sub-clusters within their respective regions and depth categories.
Taxonomic Affiliations
At the level of major groups, diatom reads represented >50% of the rDNA and rRNA euphotic zone reads in Kennedy Channel and the Kane 3 and Kane 5 stations, with ca. 40% in Kane 4 (Figure 5). Phytoplankton, other than diatoms, were mostly chlorophytes and haptophytes. Among the more abundant heterotrophic flagellates were choanoflagellates, Picozoa, and uncultivated marine stramenopiles (MASTs). In contrast, the Stn 120 euphotic zone communities were <10% diatoms, with higher proportions of chrysophytes, which were rare to absent in the Nares Strait stations (Figure 5).
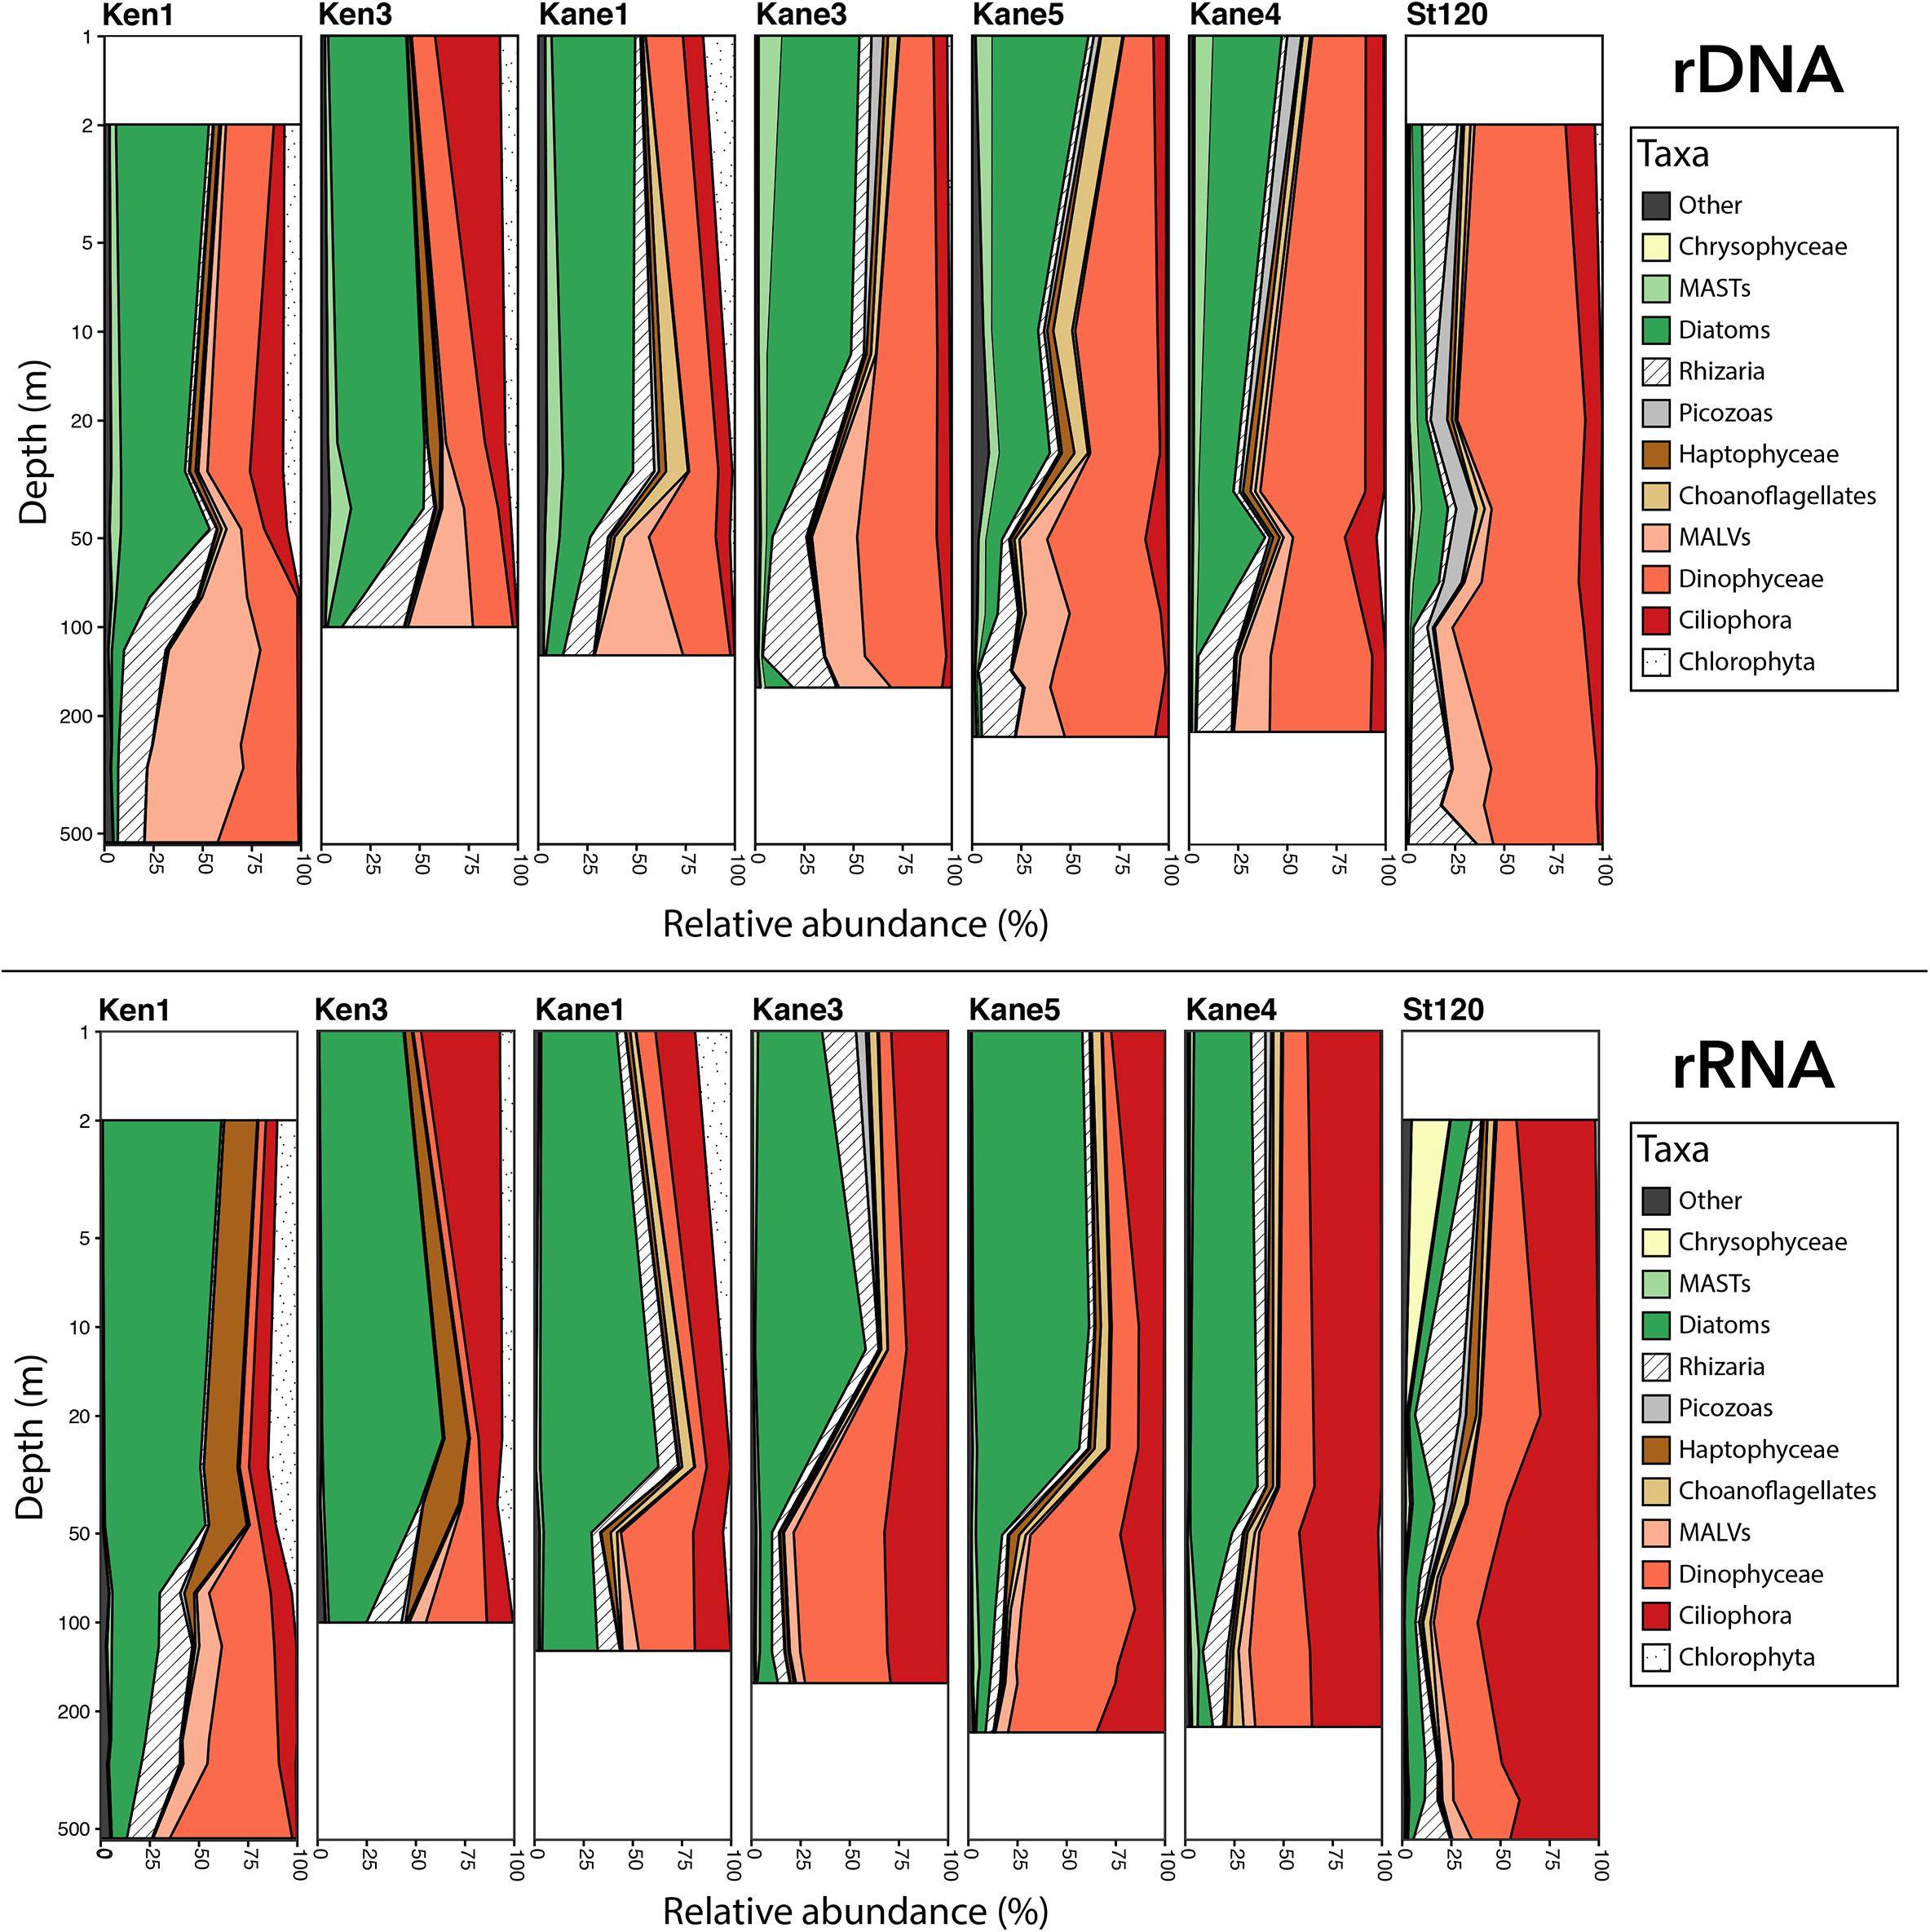
Figure 5. Depth profiles showing the relative proportion of the dominant eukaryote major groups. Upper panel shows rDNA and lower panel shows rRNA. MASTs and MALVs are defined in the text.
Diatom reads were also present in deeper waters especially in Ken 3 and Kane 1, but for the most part the deeper samples were dominated by heterotrophic groups. These included uncultivated presumably parasitic marine alveolates (MALVs), dinoflagellates, and Rhizaria, which together accounted for over 90% of the rDNA reads and ca. 80% of rRNA reads. The Stn 120, deeper communities resembled the deep water from the more northern stations in terms of major groups and were dominated by dinoflagellates in the rDNA and ciliates in the rRNA. In general, dinoflagellates tended to be overrepresented in the rDNA compared to rRNA and ciliates showed the opposite trend, with a higher proportion of reads in the rRNA compared to rDNA.
At the level of OTUs, the majority (60%) of microbial eukaryotes in Ken 1 were found in all of the “downstream” sites, including Stn 120 (Supplementary Figures S3, S4). The “Not detected in Ken1” OTUs at the entrance of Kane basin represented a higher proportion of the community in the rRNA than in the rDNA (W = 1121.5, p-value = 0.03). The only major taxonomic shift based on original abundance and location in Ken 1 was within the “photic rRNA and rDNA” category. The initial high proportion of chlorophyte OTUs in the Ken 1, Ken 3, and Kane 1 were replaced by ciliate OTUs in stations further south (Supplementary Figure S5).
Regional Descriptors
We then investigated the distribution and relative abundance of 52 dominant OTUs that were defined as having >1% of reads in the euphotic zone (Figure 6) or in the deeper aphotic waters (Figure 7). The CLAM test separated out indicator or characteristic OTUs associated with specific regions at the time of sampling. OTU10, OTU21, and OTU12 were the best indicators for the Kennedy Channel euphotic zone (Figure 6). OTU10 corresponded to Chaetoceros aff. neogracilis, OTU21 was a Choreotrich ciliate that matched a Beaufort Sea clone (Supplementary Table S3), and OTU12 was Micromonas polaris. A number of other OTUs were characteristic of rRNA in the Kennedy Channel but also abundant elsewhere in rDNA, these included Phaeocystis pouchetti (OTU8) and a second C. neogracilis (OTU4). The deeper waters of Kennedy Channel were characterized by two uncultivated MALVs; OTU26 and OTU82, both with closest matches to other Arctic MALVs (Supplementary Table S3). In addition we found the sea ice diatom Nitzschia frigida (OTU41 and OTU57) (Figure 7).
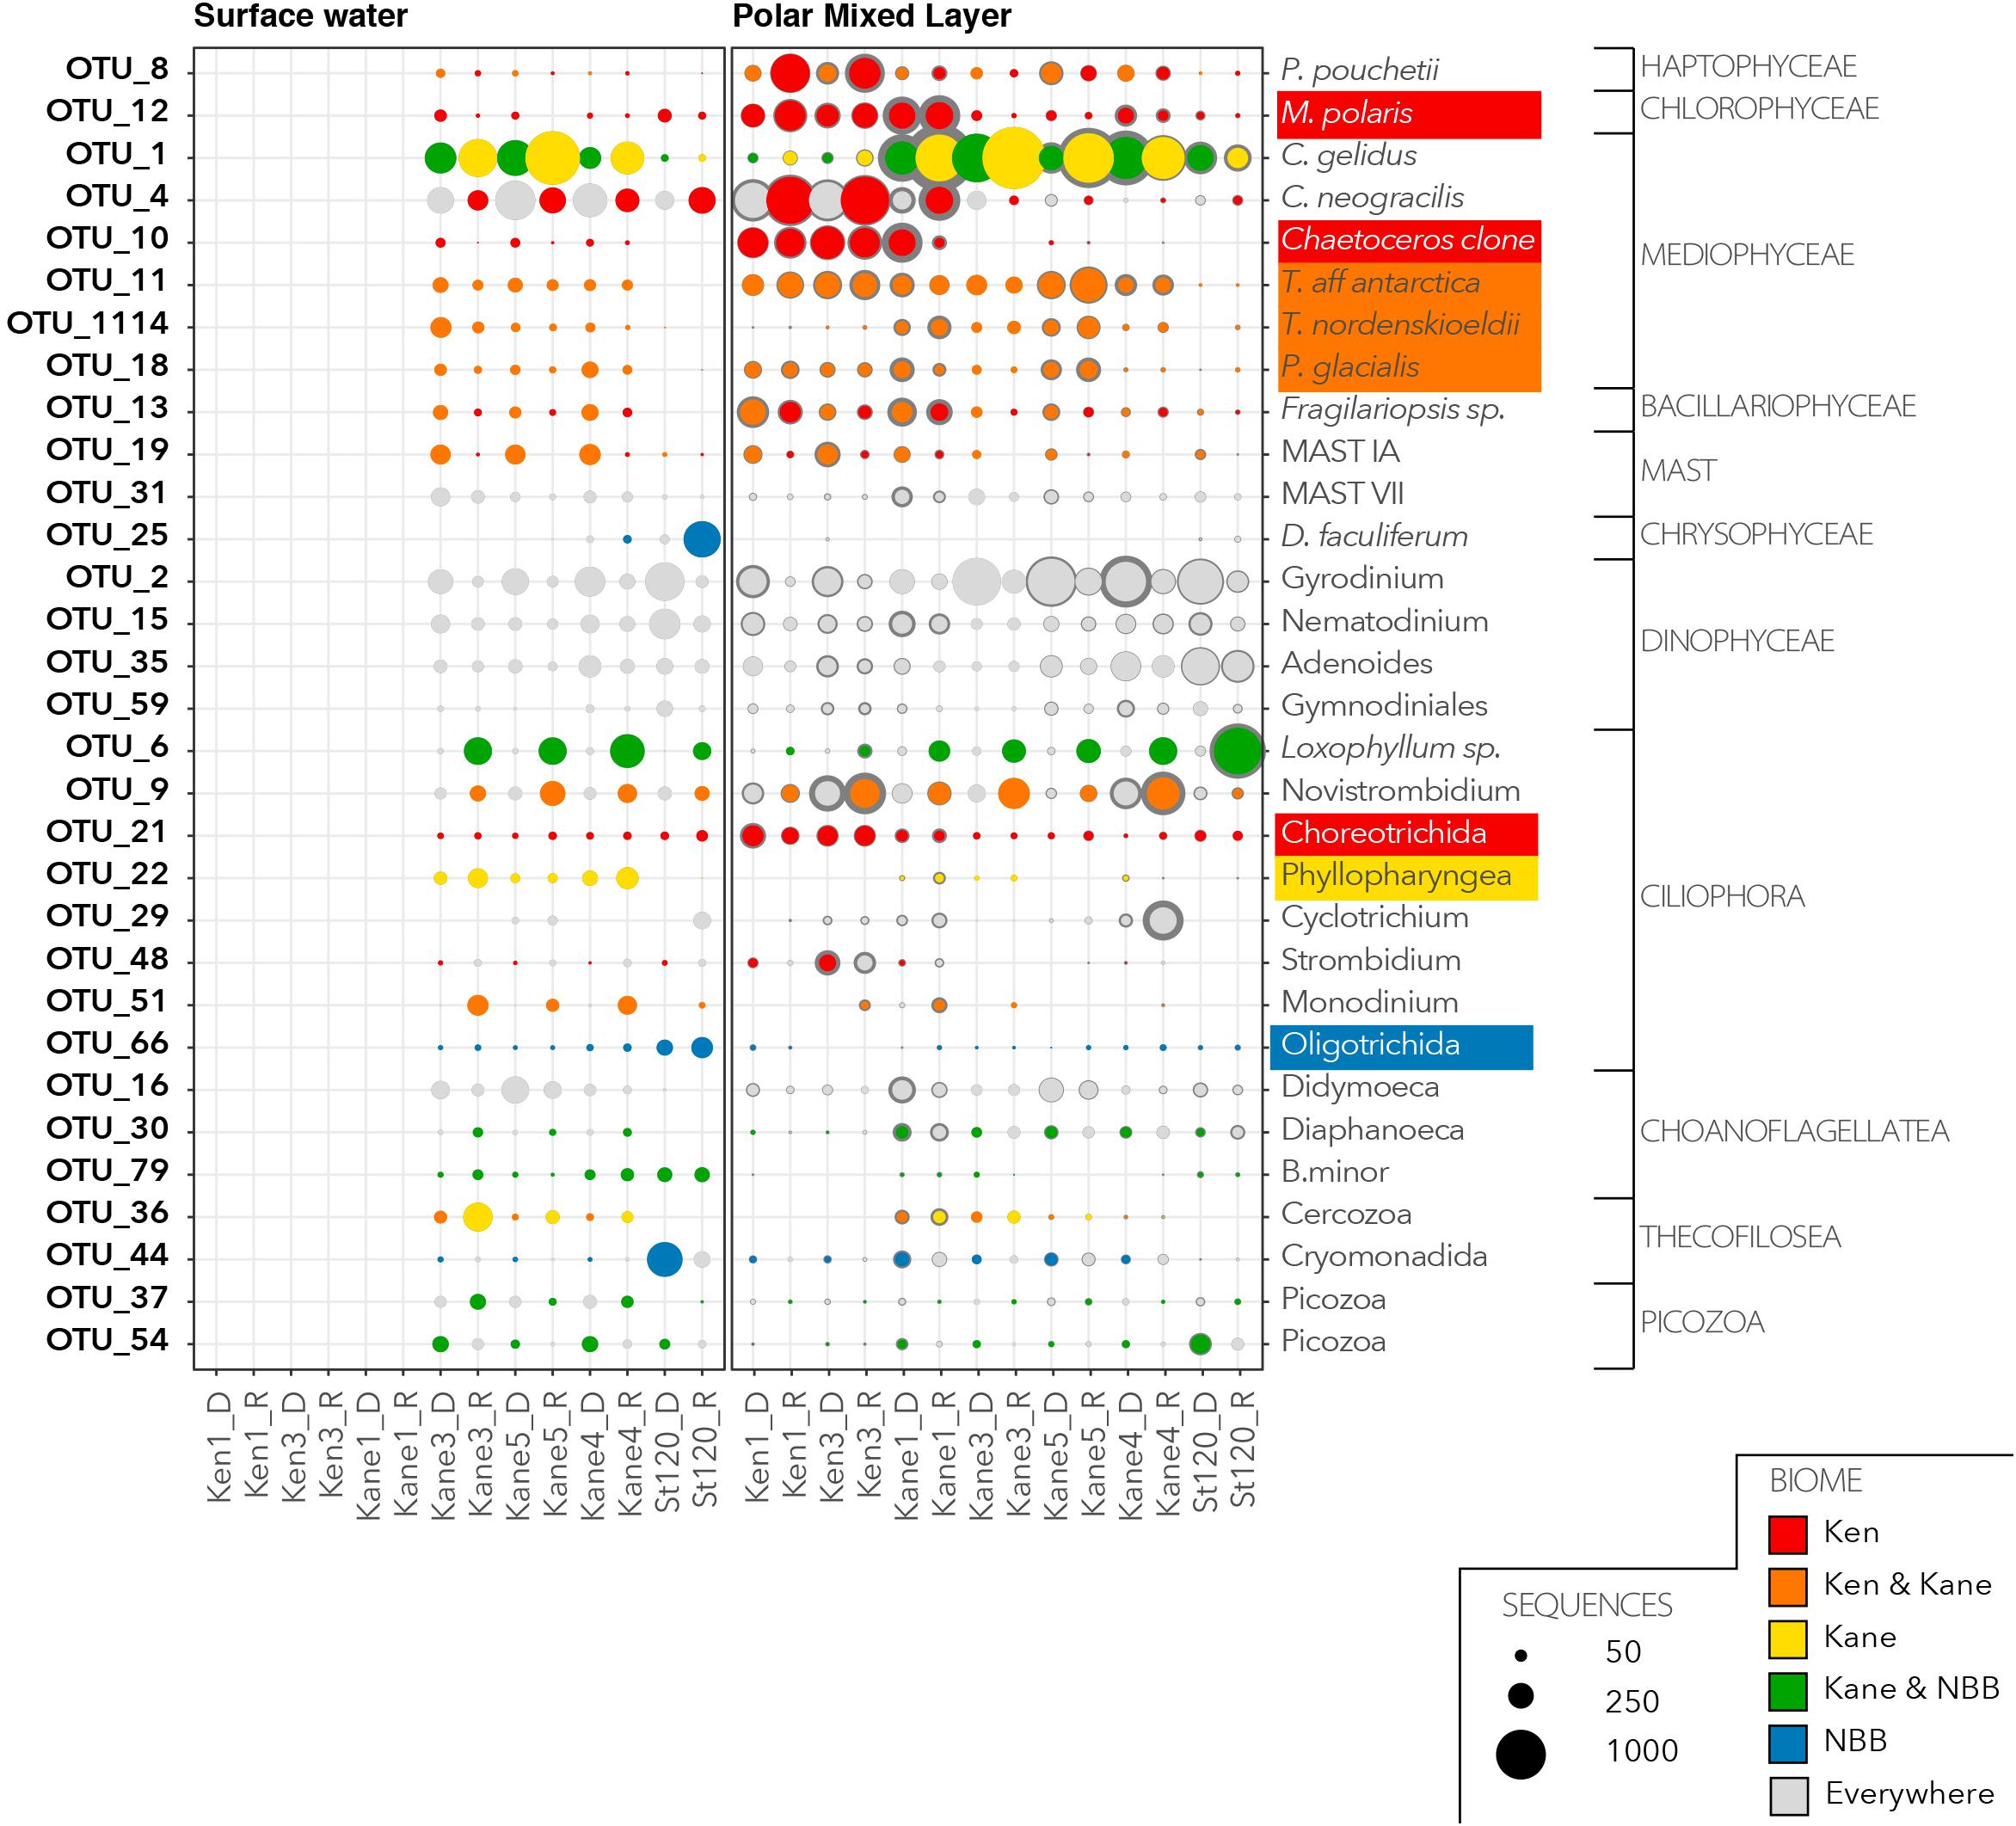
Figure 6. Characteristic OTUs from the euphotic zone communities. Bubble plots of the mean relative abundance of the dominant OTUs in the euphotic zone, separated by water mass categories given in Figure 2. For each dominant OTU the bubble size is the mean (light gray or colored dot) and confidence interval (dark gray exterior circle) for the number of OTU reads from each of the rDNA and rRNA communities. Based on the results of the CLAM test, the bubbles with primary colors indicate specificity to a region (red for Kennedy Channel; yellow for Kane Basin; and blue for Northern Baffin Bay). The bubbles in a secondary color are a mix of the contributing primary colors and show OTUs that are considered characteristic of two regions. If an OTU was characteristic of a region in both rDNA and rRNA they were considered representative of the region and the taxonomic assignment is shaded by the color code for the region.
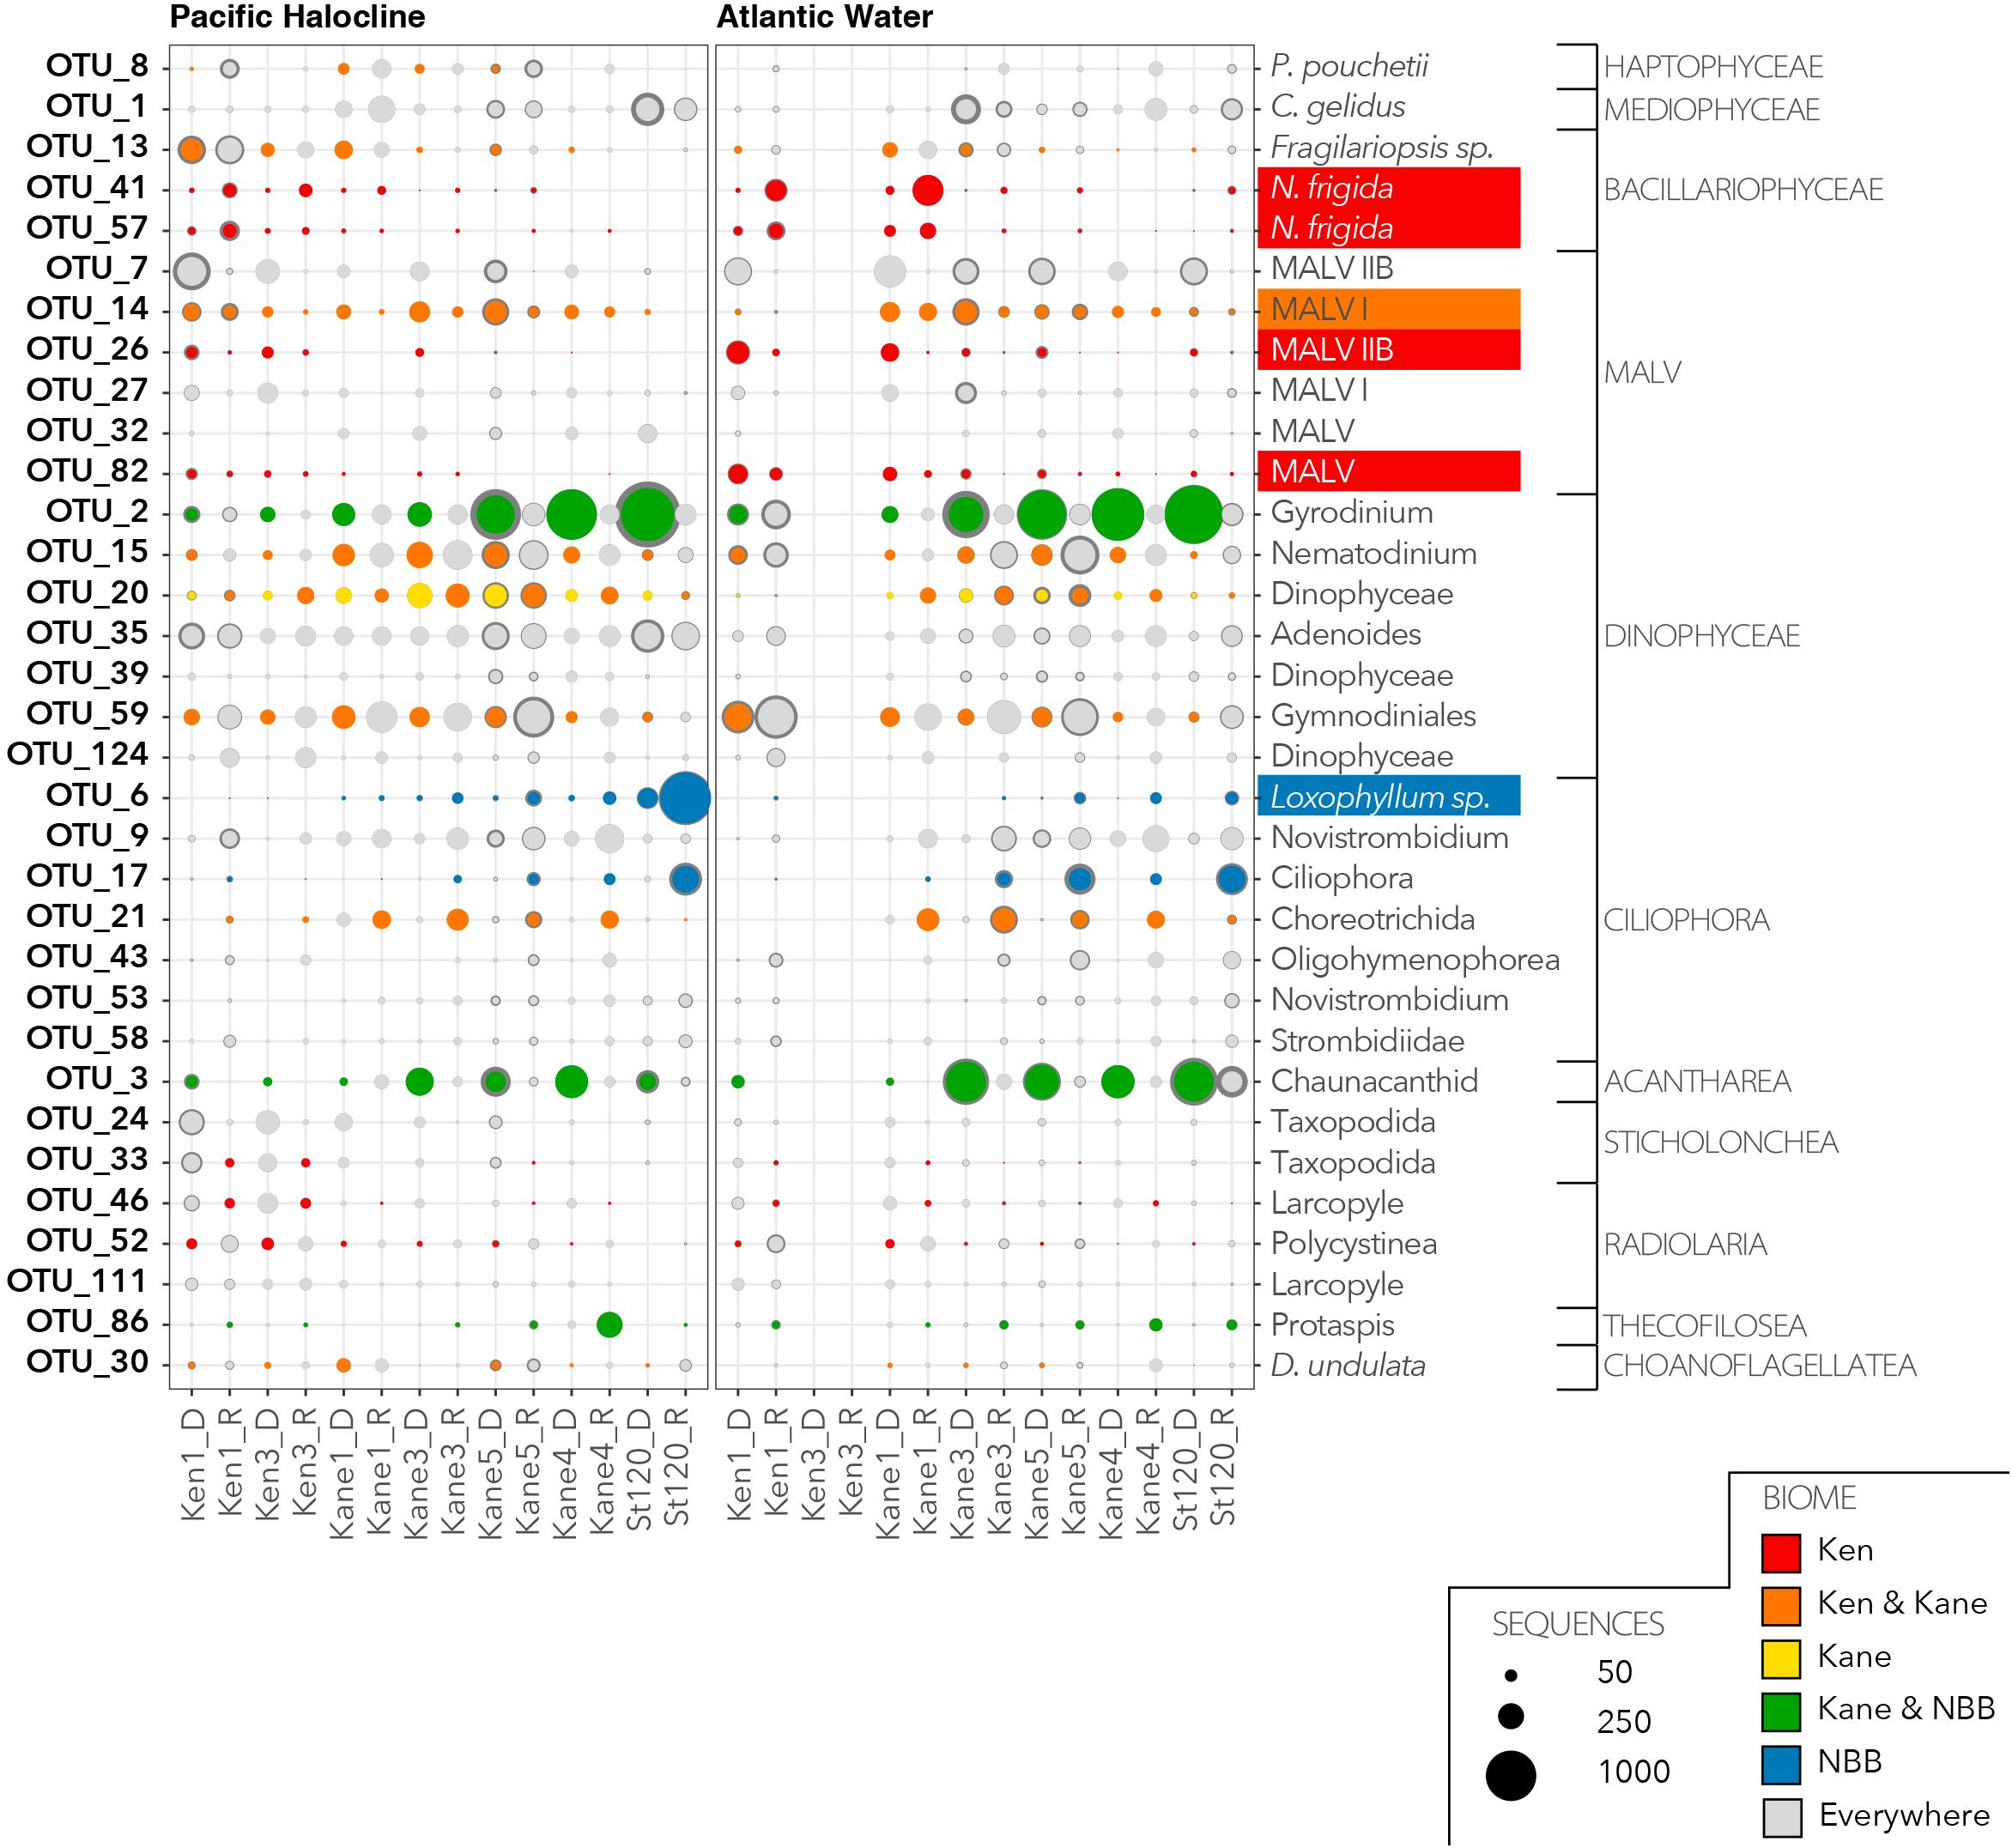
Figure 7. Characteristic OTUs from the aphotic zone communities as for Figure 6 showing the deep water aphotic zone communities.
There was only one narrowly defined Kane Basin euphotic zone regional descriptor: OTU22, which could only be identified as an unclassified Phyllopharyngea ciliate with 99% similar to a sequence from a mesocosm experiment in near Bergen, Norway (Supplementary Table S3). Chaetoceros gelidus (OTU1) was also prominent in the rRNA communities. There were no deep water Kane Basin descriptors. Several OTUs could be considered descriptors of two contiguous regions (Figure 6). For example, OTU11, OTU1114, and OTU18 were associated with both the Kane Basin and the Kennedy Channel within the PML. OTU11 matched Thalassiosira aff. antarctica, OTU1114 was identified as the Arctic–Boreal species Thalassiosira nordenskioedii, and OTU18 was 99% similar to Porosira glacialis a psychrophilic diatom (Svenning et al., 2019) in the Thalassiosiraceae. Another MALV, OTU14 was characteristic of the deeper waters of the two regions with closest match to other deep water sequences (Figure 7 and Supplementary Table S3).
For Stn 20, the otherwise rare OTU25 Dinobryon faculiferum had a high number of reads in the Surface Water rRNA and a Cryomonadida (OTU44) was abundant in the rDNA (Figure 6). The unidentified Oligotrichida OTU66 was found in both rRNA and rDNA in the Surface Water. Several OTUs were characteristic of rRNA in Kane Basin and Stn 120, and also found in the rDNA in all regions. In particular were OTU54, which is an uncultured Picozoa previously detected in the Central Arctic, and OTU79, which was identified as the choanoflagellate Bicosta minor. The ciliate Loxophyllum sp. (OTU6), which was predominantly in the rRNA of Stn20 and Kane Basin, matched an Arctic ciliate clone (Supplementary Table S3).
Discussion
Despite a recent history of being in the dark under multiyear ice, even at Ken 1, the most northern station, there was clear separation between the euphotic and deeper communities. The euphotic zone was dominated by diverse pan-Arctic photosynthetic taxa. The communities in the deeper waters, with the exception of senescent ice algae, were mostly heterotrophic flagellates, parasitic alveolates, and rhizarians. Within the two broad depth categories, Kennedy Channel and Kane Basin microbial eukaryotic communities clustered apart from each other, mostly driven by the presence of additional taxa in Kane Basin compared to the Kennedy Channel.
Pan-Arctic Phytoplankton Species
Recent culturing efforts have resulted in descriptions of a growing list of endemic species in Arctic Seas (Chamnansinp et al., 2013; Simon et al., 2017; Daugbjerg et al., 2018), many of which were recovered in this first 18S rRNA amplicon study in Nares Strait. Most of the other dominant environmental OTUs detected from the top of Kennedy Channel and through Kane Basin have been previously reported from the Arctic (Lovejoy, 2014) including the Central Arctic, consistent with a pan-Arctic circumpolar Arctic Biome. This reservoir of arctic species tended to remain within their original water masses. However, the changes in relative abundance of species and species associations from the rRNA data indicated that the communities were likely responsive to local environmental conditions. Regional indicator species included M. polaris, Chaetoceros neogracilis, C. gelidus, Phaeocystis pouchettii, and several Thalassiosirales.
Micromonas polaris (reported as CCMP2099) is practically ubiquitous across the Arctic (Lovejoy et al., 2007; Balzano et al., 2012), but here was characteristic of the Kennedy Channel. M. polaris maintains viable cells over prolonged periods of darkness and throughout the polar night (Vader et al., 2015; Joli et al., 2017) and has been reported from ice covered Central Arctic Ocean (Bachy et al., 2011), perhaps persisting by way of phagotrophy (McKie-Krisberg, 2014). The higher proportion of M. polaris in Kennedy Channel is consistent with a source population from under the sea-ice. M. polaris is well adapted to cold temperatures and low light levels (Lovejoy et al., 2006; Liefer et al., 2018) and able to begin growth before seasonal sea-ice melt in late winter (Joli et al., 2017). The species tends to persist across the Arctic over summer and can dominate photosynthetic biomass under low light conditions in the SCM (Lovejoy et al., 2007).
The two Chaetoceros species C. neogracilis and C. gelidus are both small celled hyalochaetes (lightly silicified and lacking chloroplasts in setae). Although C. neogracilis has been reported globally, it is thought that the majority of reports outside of Polar and other ice influenced waters are misidentifications (Balzano et al., 2017). C. neogracilis occurs mostly as single cells, sometimes as doublets and the lack of distinguishing features under light microscopy could lead to other small species being misidentified as C. neogracilis. The 18S rRNA sequences currently available point to this species being restricted to ice influenced regions including the Baltic and White Sea (Majaneva et al., 2012). In the Nares Strait system, two closely related C. neogracilis OTUs were common but had distinct distribution patterns (Figure 6). OTU10 was predominant in the Kennedy channel and the Kane 1 sites, whereas OTU4 persisted over the entire region. The ecological separation of the two OTUs highlights the diversity within the current species and a need for further taxonomic revision as suggested by Balzano et al. (2017).
Chaetoceros gelidus showed a very different distribution to C. neogracilis and was particularly common in the rRNA libraries from Kane Basin, but also detected in rDNA from Stn 120 (Figure 6). C. gelidus has recently been described as a separate species from C. socialis, which is widely reported throughout the Arctic (Chamnansinp et al., 2013), and many older records of C. socialis are probably the newer species. A number of 18S rRNA surveys have confirmed that C. gelidus is widely distributed in the Arctic; with reports from the Beaufort Sea (Balzano et al., 2017), the West Greenland Coast (Riisgaard et al., 2015), and the Northern Baffin Bay (Joli et al., 2018). The species thrives under a large range of conditions, for example during a 4 months study of the North Water in 1998, what was likely C. gelidus (reported as C. socialis) was found throughout the summer (Booth et al., 2002). The C. socialis–gelidus complex can form large colonies and, in our study, the same OTU (OTU1) was detected below the euphotic zone, consistent with sedimentation and potentially viable cells moving into the deeper waters of Baffin Bay that could resurface during upwelling events.
Phaeocystis pouchetii, which was found in Kane Basin and Kennedy Channel, has been associated with high biomass (bloom) events, which can have negative impacts other ecosystem properties (Pavlov et al., 2017). P. pouchetii also persists over the polar night (Vader et al., 2015) and is a main component of under ice and spring blooms across the Arctic (Riisgaard et al., 2015). Although P. pouchetii can occur as small single cells, colonies can become large under bloom conditions and contribute to carbon export and an enhanced biological carbon pump (Wollenburg et al., 2018).
Larger chain forming diatoms in the Thalassiosirales are also associated with blooms, including the North Atlantic spring bloom. In our study, T. aff. antarctica and P. glacialis were dominant in the PML in both Kennedy Channel and Kane Basin. T. nordenskioeldii, which has a more pronounced Arctic–Boreal distribution (Luddington et al., 2016), was relatively more common in the Kane Basin.
Arctic Deep Communities
The water that flows into Nares Strait is influenced by the circulation of the Beaufort Gyre and the position of the transpolar drift (Bauch and Cherniavskaia, 2018). In 2014, we were able to discriminate between two deep water masses, based on TS characteristics, which were consistent with Pacific and Atlantic origins. The distinct Pacific layer between the PML and deep AW echo TS profiles from the Canada Basin and Beaufort Gyre. These waters enter Nares Strait from the Western Lincoln Sea flowing over the Northern Ellesmere Shelf (Jackson et al., 2014). The similarity of the microbial eukaryotic communities in the deep Pacific and AW in Kennedy Channel was somewhat surprising, given the strong influence of water masses in the upper 200 m of the Beaufort Sea (Lovejoy and Potvin, 2011; Monier et al., 2015). The long residence time in the Beaufort Gyre and environmental selection for deep water species may have homogenized these communities. However, the species that were recovered suggested some local and more recent influences. Within Nares Strait, we found regional differences, with the Kennedy Channel deep communities differing from Kane Basin deep communities. Notably, major indicator taxa for deep Kennedy Channel samples were two putative parasitic MALVs and the sea ice diatom N. frigida. The most likely source of the diatom in the deeper waters would be sedimentation and lateral (advective) transport of ice algae from upstream of our sampling effort, similar to the massive ice-algae community reported in the deep waters of the Central Arctic (Boetius et al., 2013). No corresponding deep water chlorophyll maximum was detected in our fluorescence profiles, suggesting that the reads originated from cysts or cells with low Chl a fluorescence, as reported for some diatoms (Ellegaard and Ribeiro, 2018). In addition, the near absence of N. frigida in the surface was evidence of a lack of vertical continuity between the surface and deep waters at a given station. Assuming an ice algal sinking rate of 2–20 m per day (Aumack and Juhl, 2015), it could take as few as 3 or as many as 30 days for ice algae released from ice to arrive at the depth of the PW. Following release from the ice, the algae would be displaced by the strong north to south currents in Nares Strait; the upper PML of Nares Strait has a mean flow of 0.15 m s–1, but below 200 m the currents are much slower at <0.05 m s–1 (Münchow et al., 2007; Rabe et al., 2010). This means that the surface layer is moving south three times faster than the deeper waters. The distance between Ken 1 and Kane 1 is 1.68 degrees of latitude (ca. 180 km), and the ice algae possibly traveled from 14 to 41 days prior to reaching Kane Basin. The presence of N. frigida in the rRNA reads below 90 m suggests that the cells were still viable. However, the lack of a deep Chl a fluorescence signal would suggest they were present as ribosomal packed cysts (Blazewicz et al., 2013).
Community Selection
Apart from the North Water Polynya, productivity patterns in the Arctic have most widely been interpreted in terms of seasonality. A typical scenario begins with a deeply mixed water column, then as the water column becomes stratified the communities move from a pre-bloom to a bloom stage. A post-bloom stage follows when nutrients are depleted in the euphotic zone. The fall-winter stage, with low biomass, is driven by low light levels and water column mixing. Applying this conceptual model to the Nares Strait; Chl a and nutrient profiles from north to south were consistent with a pre-bloom in Kennedy Channel (Ken 1), followed by the beginning of an upper mixed layer biomass increase in Ken 3. We would have missed any surface bloom in Kane Basin because of our limited temporal coverage. Satellite images of the North Water and Nares Strait from 2014 showed a surface chlorophyll increase beginning in the south of Nares Strait, then moving north and east (Marchese et al., 2017). Consistent with these observations Kane Basin surface nutrient and chlorophyll concentrations would be assumed to have been depleted by early August at the time we sampled and the system was moving into a post-bloom stage.
However, the TS plots (Figure 2) suggested a more complex scenario, with solar warming and much fresher water persisting in the surface of Kane Basin, notably for stations 3–5 (Supplementary Table S1). In addition, the PML for those three stations showed signs of conductive warming to a depth of ca. 15 m (Supplementary Figure S2). The communities in the Kane Basin PML also clustered together, suggesting continued contact and exchange (Monier et al., 2015). To the North, the warm intrusion at 10 m in Kane 1 was consistent with water mass intrusions (warm salty water beneath cold fresh water) associated with cyclonic circulation within the Kane Basin. Such structure suggests that Kennedy Channel and Kane Basin are not a continuous north to south flow through system. The distinct biological communities found in Kennedy Channel compared to Kane Basin strongly argue that the two regions should not be treated as a continuum or single entity following a distance for time seasonal succession pattern.
Outflow shelves, including the Canadian Arctic Archipelago and the North Water in particular, have distinct seasonal production characteristics. Michel et al. (2015) suggested that regions should be put into four conceptual models based on initial nutrient inventories, degree of stratification and light availability due to latitude and ice flow. Briefly, different regions of the Canadian Arctic were classified as having the following characteristics: (1) High initial nutrient, and a highly stratified water column (HN–HS), with Barrow Strait as an example. (2) Low initial nutrients and high stratification (LN–HS) with most of the Beaufort Sea as an example. (3) High nutrients and high mixing (HN–HM) with the North Water, retreating ice edges and wind driven upwelling regions as examples. Finally, (4) variable nutrients and low light (VN–LL), which encompass extremely high latitudes or regions with thick persistent ice. The selectors for microbial species composition in the four conceptual models would differ, with larger diatoms generally favored in the regions with higher nutrient inventories and sufficient light (HN–HS and HN–HM). The seasonal progression of species and production are distinct in the four cases and the implication is that productivity and ecosystem function are constrained by hydrography and latitude. The same patterns cannot simply be displaced north, with consequences for upper trophic levels. An ongoing long productive season only occurs under the HN–HM regime such as seen in the North Water. The other three scenarios have a single peak in production, with the magnitude dependent on initial nutrient inventories, and light as an additional constraint for the VN–LL regions.
A closer examination of our indicator species suggests that the Michel et al.’s (2015) classification should be applied to Nares Strait. The euphotic zone Kennedy Channel and Kane Basin communities formed two distinct clusters consistent with geography and bathymetry. One exception was the 1 m sample from the most northern Kane Basin site which clustered with upper Kennedy Channel communities suggesting recent cold fresh ice melt surface waters. The question arises as to whether the VN–LL regime in the Kennedy Channel would ever resemble the LN–HS situation in Kane Basin. The much less robust pycnocline in Kennedy Channel does not resemble the LN–HS Beaufort Sea and Amundsen Gulf; the Beaufort Sea is highly stratified even in winter with low nutrients in the upper layers (Simpson et al., 2013). In contrast the high latitude and fast flow of Kennedy Channel means it will likely remain a VN–LL system. The microbial eukaryotic communities in the Kennedy Channel consisted mostly small celled arctic species, including haptophytes, the arctic endemic M. polaris and C. neogracilis (Figure 6), which is a small non-chain forming diatom (Balzano et al., 2017). Because of large surface to volume ratios, small celled species have an advantage in both light and nutrient limited systems (Raven, 1998). The abundance of nutrients in Kennedy Channel suggests that light limitation due to recent ice cover and perhaps deep mixing was a primary selection agent for the community. The presence of some larger centric diatoms including Boreal–Arctic Thalassiosira species (Luddington et al., 2016) in both Kennedy Channel and Kane Basin is consistent with the beginnings of an initial (spring like) bloom in both systems, and not a spring to summer progression. These larger diatoms were recovered in both the rDNA and rRNA at the top of Kennedy Channel suggesting that these species were rapidly responding to increasing light levels (Kvernvik et al., 2018).
All water flowing out of Nares Strait goes over a narrow shallow 220 m sill, which tends to bring deeper PW nearer the surface as it enters Northern Baffin Bay. At the time of sampling in 2014, surface fCDOM concentrations at Stn 120 were typical of Pacific influenced waters in the Kane Basin (Kaiser et al., 2017), and did not resemble the PML in Nares Strait. This would suggest that much of the water, including near the surface of Stn 120 had an origin as deeper PW.
Stn 120 Northern North Water communities were sampled at the apex of the complex hydrography of Northern Baffin Bay (Lovejoy et al., 2002; Joli et al., 2018), which is influenced by two major current systems flowing in opposite directions. A strong southward flowing current moves water out of Baffin Bay along the Canadian coast, whereas the West Greenland current on the Greenland side flows north along the coast of Greenland (Bâcle et al., 2002). Because of the Coriolis effect this Northward flow turns left near the top of Northern Baffin Bay (Münchow et al., 2006, 2015) and the two water masses tend to interleave in the center. For example, complex TS profiles were reported at the same latitude in 2005 (Galand et al., 2009), where halocline intrusions were characterized by distinct archaeal phylotypes. In 2014, the cold water intrusion detected at 70–100 m did not resemble any of the water masses in Nares Strait (Figure 2) and would be consistent with lateral advection of water from elsewhere. The cold temperature suggests that it may have been be locally formed winter water, where brine is rejected as surface water freezes, creating dense cold saline water. The inconsistencies between the 71 and 100 m rRNA and rDNA communities at Stn 120 (Figure 4) would also suggest a changing environment with rDNA reflecting historical conditions and rRNA communities more reflective of the current environment. In this case, the mid-depth (70–100 m) communities were converging to resemble communities found closer to the surface. The low chlorophyll concentrations, high proportion of heterotrophic taxa, and high bacteria concentrations found at Stn 120 could indicate that overall the community was senescent (Supplementary Tables S1, S2). However, the high proportion Ctenophore reads suggest that top down selection of the community cannot be ruled out, but quantitative data or grazing studies are needed to verify such a hypotheses.
Conclusion
In conclusion, this study gave a first view of the microbial diversity in Nares Strait. We have shown that the Kennedy Channel and Kane Basin are distinct from each other and from the North Water. Given that local hydrography seemed to be the major species driver, we found little indication that Nares Strait will evolve into a high productivity region and replace the central importance of the North Water. Our study provides a baseline for future analysis and a new perspective of the Pikialasorsuaq ecoregion. Additional studies and monitoring are needed to evaluate the extent of future change in this high Arctic ecosystem.
Significance Statement
The Arctic Ocean has limited exchange with other oceans with Nares Strait, the most northern outflow gateway, contributing nutrients and freshwater to downstream ecosystems. Nares Strait is where a significant quantity of Arctic Water exits the Central Arctic Ocean and flows into the highly productive North Water Polynya. As Arctic ice formation and melt patterns change, Nares Strait is becoming biologically active earlier in the season. However virtually nothing is known about the phytoplankton and other protist communities in this northern gateway. Our north to south survey of these microbial eukaryotes revealed predominantly Pan-Arctic species. Two distinct communities were found in the upper sunlit waters, consistent with the hydrography of Nares Strait.
Data Availability
The datasets generated for this study can be found in the ENA under PRJEB24314 with sample data from ERS2074951 to ERS2075117.
Author Contributions
CL and J-ÉT designed the study. NJ and CL collected the samples. NJ and MP carried out the laboratory work. DK, NJ, MP, and CL analyzed the data. J-ÉT contributed to the data. DK and CL wrote the manuscript. All authors commented on and contributed to the various versions of the manuscript.
Funding
The work was supported by the Natural Sciences and Engineering Research Council of Canada (NSERC) Discovery and Northern Supplement grants to CL and J-ÉT and the Fonds de Recherche du Québec – Nature et Technologies (FRQNT) supporting Québec-Océan. Ship time and logistic support was provided by ArcticNet, a Network of Centers of Excellence (Canada).
Conflict of Interest Statement
The authors declare that the research was conducted in the absence of any commercial or financial relationships that could be construed as a potential conflict of interest.
Acknowledgments
This study is a contribution to ArcticNet. We thank P. Guillot for processing CTD data, and J. Gagnon and G. Deslongchamps for nutrient analysis. Support for sequencing was from the Plate-forme d’Analyses Génomiques (IBIS, Université Laval), for data analysis from the Comput Canada, and for logistics from the officers and crew of the CCGS Amundsen are acknowledged. The data collected by the CCGS Amundsen were made available through the Amundsen Science program, supported by the Canada Foundation for Innovation and the NSERC.
Supplementary Material
The Supplementary Material for this article can be found online at: https://www.frontiersin.org/articles/10.3389/fmars.2019.00479/full#supplementary-material
FIGURE S1 | Bray–Curtis cluster analysis grouping the water masses based on the temperature, the salinity, and the Pacific Water contribution (see the text). The dot colors show a normalized representation of each of the three parameters, with blue for the minimum value through to red for the maximum value. The warmed and fresh surface water clustered apart.
FIGURE S2 | Depth profiles of temperature (black), Chl a (green), nitrate concentration (red l), and density (blue) at the seven stations sampled.
FIGURE S3 | Decision tree applied to each OTUs present in the Ken1 station to categorize them into each of the eight categories used in source tracking from the rarified data set (see the text). Below each category is the number of sequences and OTUs in the category.
FIGURE S4 | Depth profiles of the rDNA and rRNA fractions showing the relative proportion of sequences belonging to the categories defined from station Kennedy 1 following Supplementary Figure S3.
FIGURE S5 | Taxonomic contribution to the categories displayed in Supplementary Figure S4, for the rDNA and rRNA fraction. (a) “Ken1 All Depths rDNA” and “Ken1 All Depths rDNA and rRNA” categories. (b) “Ken1 aphotic rDNA” and “Ken1 aphotic rDNA and rRNA” categories. (c) “Ken1 photic rDNA” and “Ken1 photic rDNA and r RNA” categories. (d) “Ken1 rRNA only” category. (e) “Rare in Ken1” category and (f) “Not detected in Ken1” category.
TABLE S1 | Sample ID is the station from Figure 1 main text and depth in meters (m), salinity (Sal) nitrate, phosphate, and silicate in micrometers, oxygen as percent saturation at depth and photosynthetically available radiation (PAR) as % attenuation relative to first surface reading, values <0.01% are not shown.
TABLE S2 | Additional contextual data. Trip depth is the actual depth (m) recorded as the sample bottle closed on the upward cast. The fCDOM (ppb) units refer to factory calibrations and Chl a concentrations (mg m–3) estimated from relative fluorescence. Cell counts from FCM for bacteria (×105 cells ml–1), both picophytoplankton (PPP and nanophytoplankton (NPP) in cells ml–1.
TABLE S3 | Closest BLASTn hits, origins, and references were available for the 52 OTUs indicated in Figures 6, 7.
Footnotes
References
Ardyna, M., Gosselin, M., Michel, C., Poulin, M., and Tremblay, J.-É. (2011). Environmental forcing of phytoplankton community structure and function in the canadian high arctic: contrasting oligotrophic and eutrophic regions. Mar. Ecol. Prog. Ser. 442, 37–57. doi: 10.3354/meps09378
Aumack, C., and Juhl, A. (2015). Light and nutrient effects on the settling characteristics of the sea ice diatom Nitzschia frigida. Limnol. Oceanogr. 60, 765–776. doi: 10.1002/lno.10054
Bachy, C., López-García, P., Vereshchaka, A., and Moreira, D. (2011). Diversity and vertical distribution of microbial eukaryotes in the snow, sea ice and seawater near the North Pole at the end of the Polar Night. Front. Microbiol. 2:106. doi: 10.3389/fmicb.2011.00106
Bâcle, J., Carmack, E. C., and Ingram, G. R. (2002). Water column structure and circulation under the North Water during spring transition: April–July 1998. Deep Sea Res. Part II Top. Stud. Oceanogr. 49, 4907–4925. doi: 10.1016/s0967-0645(02)00170-4
Balzano, S., Marie, D., Gourvil, P., and Vaulot, D. (2012). Composition of the summer photosynthetic pico and nanoplankton communities in the beaufort sea assessed by T-RFLP and sequences of the 18S rRNA gene from flow cytometry sorted samples. ISME J. 6, 1480–1498. doi: 10.1038/ismej.2011.213
Balzano, S., Percopo, I., Siano, R., Gourvil, P., Chanoine, M., Marie, D., et al. (2017). Morphological and genetic diversity of Beaufort Sea diatoms with high contributions from the Chaetoceros neogracilis species complex. J. Phycol. 53, 161–187. doi: 10.1111/jpy.12489
Bauch, D., and Cherniavskaia, E. (2018). Water mass classification on a highly variable arctic shelf region: origin of Laptev Sea water masses and implications for the nutrient budget. J. Geophys. Res.–Oceans 123, 1896–1906. doi: 10.1002/2017jc013524
Blazewicz, S. J., Barnard, R. L., Daly, R. A., and Firestone, M. K. (2013). Evaluating rRNA as an indicator of microbial activity in environmental communities: limitations and uses. ISME J. 7, 2061–2068. doi: 10.1038/ismej.2013.102
Boetius, A., Albrecht, S., Bakker, K., Bienhold, C., Felden, J., Fernández-Méndez, M., et al. (2013). Export of algal biomass from the melting arctic sea ice. Science 339, 1430–1432. doi: 10.1126/science.1231346
Booth, B., Larouche, P., Bélanger, S., Klein, B., Amiel, D., and Mei, Z.-P. (2002). Dynamics of Chaetoceros socialis blooms in the North Water. Deep Sea Res. Part II Top Stud. Oceanogr. 49, 5003–5025. doi: 10.1016/s0967-0645(02)00175-3
Bushnell, B., Rood, J., and Singer, E. (2017). BBMerge – accurate paired shotgun read merging via overlap. PLoS One 12:e0185056. doi: 10.1371/journal.pone.0185056
Camacho, C., Coulouris, G., Avagyan, V., Ma, N., Papadopoulos, J., Bealer, K., et al. (2009). BLAST+: architecture and applications. BMC Bioinformatics 10:421. doi: 10.1186/1471-2105-10-421
Caporaso, G. J., Kuczynski, J., Stombaugh, J., Bittinger, K., Bushman, F. D., Costello, E. K., et al. (2010). QIIME allows analysis of high-throughput community sequencing data. Nat. Methods 7, 335–336. doi: 10.1038/nmeth.f.303
Chamnansinp, A., Li, Y., Lundholm, N., and Moestrup, Ø. (2013). Global diversity of two widespread, colony-forming diatoms of the marine plankton, Chaetoceros socialis (syn. C. radians) and Chaetoceros gelidus sp. nov. J. Phycol. 49, 1128–1141. doi: 10.1111/jpy.12121
Chazdon, R. L., Chao, A., Colwell, R. K., Lin, S.-Y., Norden, N., Letcher, S. G., et al. (2011). A novel statistical method for classifying habitat generalists and specialists. Ecology 92, 1332–1343. doi: 10.1890/10-1345.1
Coachman, L., and Aagaard, K. (1988). Transports through Bering Strait: annual and interannual variability. J. Geophys. Res. Oceans 93, 15535–15539. doi: 10.1029/jc093ic12p15535
Comeau, A. M., Li, W. K., Tremblay, J. -É., Carmack, E. C., and Lovejoy, C. (2011). Arctic ocean microbial community structure before and after the 2007 record sea ice minimum. PLoS One 6:e27492. doi: 10.1371/journal.pone.0027492
Daugbjerg, N., Norlin, A., and Lovejoy, C. (2018). Baffinella frigidus gen. et sp. nov. (Baffinellaceae fam. nov., Cryptophyceae) from Baffin Bay: morphology, pigment profile, phylogeny, and growth rate response to three abiotic factors. J. Phycol. 54, 665–680. doi: 10.1111/jpy.12766
Dixon, P. (2003). VEGAN, a package of R functions for community ecology. J. Veg. Sci. 14, 927–930. doi: 10.1111/j.1654-1103.2003.tb02228.x
Edgar, R. C. (2010). Search and clustering orders of magnitude faster than BLAST. Bioinformatics 26, 2460–2461. doi: 10.1093/bioinformatics/btq461
Ellegaard, M., and Ribeiro, S. (2018). The long-term persistence of phytoplankton resting stages in aquatic ‘seed banks.’. Biol. Rev. 93, 166–183. doi: 10.1111/brv.12338
Galand, P. E., Lovejoy, C., Hamilton, A. K., Ingram, G. R., Pedneault, E., and Carmack, E. C. (2009). Archaeal diversity and a gene for ammonia oxidation are coupled to oceanic circulation. Environ. Microbiol. 11, 971–980. doi: 10.1111/j.1462-2920.2008.01822.x
Gonçalves-Araujo, R., Rabe, B., Peeken, I., and Bracher, A. (2018). High colored dissolved organic matter (CDOM) absorption in surface waters of the central-eastern Arctic Ocean: implications for biogeochemistry and ocean color algorithms. PLoS One 13:e0190838. doi: 10.1371/journal.pone.0190838
Granskog, M. A., Stedmon, C. A., Dodd, P. A., Amon, R. M., Pavlov, A. K., de Steur, L., et al. (2012). Characteristics of colored dissolved organic matter (CDOM) in the arctic outflow in the Fram Strait: assessing the changes and fate of terrigenous CDOM in the Arctic Ocean. J. Geophys. Res. Oceans 117:C12021. doi: 10.1029/2012jc008075
Grasshoff, K., Kremling, K., and Ehrhardt, M. (1999). Methods of Seawater Analysis, 3rd Edn. Hoboken, NY: John Wiley & Sons, 632.
Heide-Jørgensen, M., Burt, L. M., Hansen, R., Nielsen, N., Rasmussen, M., Fossette, S., et al. (2013). The significance of the North Water Polynya to arctic top predators. Ambio 42, 596–610. doi: 10.1007/s13280-012-0357-3
International Oceaographic Congress, SCOR, and IAPSOS. (2010). The International Thermodynamic Equation of Seawater–2010: Calculation and use of Thermodynamic Properties. Paris: UNESCO, 196.
Jackson, J. M., Lique, C., Alkire, M. B., Steele, M., Lee, C. M., Sethie, W. M., et al. (2014). On the waters upstream of Nares Strait, Arctic Ocean, from 1991 to 2012. Cont. Shelf Res. 73, 83–96. doi: 10.1016/j.csr.2013.11.025
Jennings, A., Sheldon, C., Cronin, T., Francus, P., Stoner, J., and Andrews, J. (2011). The holocene history of Nares Strait: transition from glacial bay to Arctic-Atlantic throughflow. Oceanography 24, 26–41. doi: 10.5670/oceanog.2011.52
Joli, N., Gosselin, M., Ardyna, M., Babin, M., Onda, D., Tremblay, J. -É., et al. (2018). Need for focus on microbial species following ice melt and changing freshwater regimes in a Janus Arctic Gateway. Sci. Rep. 8, 9405. doi: 10.1038/s41598-018-27705-6
Joli, N., Monier, A., Logares, R., and Lovejoy, C. (2017). Seasonal patterns in arctic prasinophytes and inferred ecology of Bathycoccus unveiled in an arctic winter metagenome. ISME J. 11, 1372–1385. doi: 10.1038/ismej.2017.7
Jones, P. E., Anderson, L. G., and Swift, J. H. (1998). Distribution of Atlantic and Pacific Waters in the upper Arctic Ocean: implications for circulation. Geophys. Res. Lett. 25, 765–768. doi: 10.1029/98gl00464
Kaiser, K., Benner, R., and Amon, R. (2017). The fate of terrigenous dissolved organic carbon on the Eurasian shelves and export to the North Atlantic. J. Geophys. Res. Oceans 122, 4–22. doi: 10.1002/2016jc012380
Kawai, Y. M., McLaughlin, F., Carmack, E., Nishino, S., and Shimada, K. (2008). Freshwater budget of the Canada Basin, Arctic Ocean, from salinity, δ18O, and nutrients. J. Geophys. Res. Oceans 113:C003858. doi: 10.1029/2006jc003858
Krishfield, R., Proshutinsky, A., Tateyama, K., Williams, W., Carmack, E., McLaughlin, F., et al. (2014). Deterioration of perennial sea ice in the Beaufort Gyre from 2003 to 2012 and its impact on the oceanic freshwater cycle. J. Geophys. Res.Oceans 119, 1271–1305. doi: 10.1002/2013jc008999
Kvernvik, A., Hoppe, C., Lawrenz, E., Prášil, O., Greenacre, M., Wiktor, J., et al. (2018). Fast reactivation of photosynthesis in arctic phytoplankton during the Polar Night. J. Phycol. 54, 461–470. doi: 10.1111/jpy.12750
Leblond, P. (1980). On the surface circulation in some channels of the Canadian Arctic Archipelago. Arctic 33, 189–197. doi: 10.2307/40509282
Liefer, J. D., Garg, A., Campbell, D. A., Irwin, A. J., and Finkel, Z. V. (2018). Nitrogen starvation induces distinct photosynthetic responses and recovery dynamics in diatoms and prasinophytes. PLoS One 13:e0195705. doi: 10.1371/journal.pone.0195705
Lovejoy, C. (2014). Changing views of arctic protists (marine microbial eukaryotes) in a changing Arctic. Acta Protozool. 53, 91–100. doi: 10.4467/16890027ap.14.009.1446
Lovejoy, C., Comeau, A., and Thaler, M. (2016). Curated Reference Database of SSU rRNA for Northern Marine and Freshwater Communities of Archaea, Bacteria and Microbial Eukaryotes. Quebec, QC: Nordicana D. doi: 10.5885/45409XD-79A199B76BCC4110
Lovejoy, C., Legendre, L., and Price, N. (2002). Prolonged diatom blooms and microbial food web dynamics: experimental results from an arctic polynya. Aquat. Microb. Ecol. 29, 267–278. doi: 10.3354/ame029267
Lovejoy, C., Massana, R., and Pedrós-Alió, C. (2006). Diversity and distribution of marine microbial eukaryotes in the Arctic Ocean and adjacent seas. Appl. Environ. Microb. 72, 3085–3095. doi: 10.1128/aem.72.5.3085-3095.2006
Lovejoy, C., and Potvin, M. (2011). Microbial eukaryotic distribution in a dynamic Beaufort Sea and the Arctic Ocean. J. Plankton Res. 33, 431–444. doi: 10.1093/plankt/fbq124
Lovejoy, C., Vincent, W. F., Bonilla, S., Roy, S., Martineau, M. J., Terrado, R., et al. (2007). Distribution, phylogeny, and growth of cold-adapted picoprasinophytes in Arctic Seas. J. Phycol. 43, 78–89. doi: 10.1111/j.1529-8817.2006.00310.x
Luddington, I. A., Lovejoy, C., and Kaczmarska, I. (2016). Species-rich meta-communities of the diatom order Thalassiosirales in the Arctic and northern Atlantic Ocean. J. Plankton Res. 38, 781–797. doi: 10.1093/plankt/fbw030
Majaneva, M., Rintala, J.-M., Piisilä, M., Fewer, D. P., and Blomster, J. (2012). Comparison of wintertime eukaryotic community from sea ice and open water in the Baltic Sea, based on sequencing of the 18S rRNA gene. Polar Biol. 35, 875–889. doi: 10.1007/s00300-011-1132-9
Makarewicz, A., Kowalczuk, P., Sagan, S., Granskog, M. A., Pavlov, A. K., Zdun, A., et al. (2018). Characteristics of chromophoric and fluorescent dissolved organic matter in the Nordic Seas. Ocean Sci. 14, 543–562. doi: 10.5194/os-14-543-2018
Marchese, C., Albouy, C., Tremblay, J. -É, Dumont, D., D’Ortenzio, F., Vissault, S., et al. (2017). Changes in phytoplankton bloom phenology over the North Water (NOW) Polynya: a response to changing environmental conditions. Polar Biol. 40, 1721–1737. doi: 10.1007/s00300-017-2095-2
Marie, D., Simon, N., Guillou, L., Partensky, F., and Vaulot, D. (2001). DNA/RNA analysis of phytoplankton by flow cytometry. Curr. Protoc. Cytom. 11, 11.12.1–11.12.14. doi: 10.1002/0471142956.cy1112s11
McKie-Krisberg, R. W. (2014). Phagotrophy by the picoeukaryotic green alga Micromonas: implications for Arctic Oceans. ISME J. 8, 1953–1961. doi: 10.1038/ismej.2014.16
Michel, C., Hamilton, J., Hansen, E., Barber, D., Reigstad, M., Iacozza, J., et al. (2015). Arctic Ocean outflow shelves in the changing Arctic: a review and perspectives. Prog. Oceanogr. 139, 66–88. doi: 10.1016/j.pocean.2015.08.007
Mitra, A., Flynn, K., Burkholder, J., Berge, T., Calbet, A., Raven, J., et al. (2014). The role of mixotrophic protists in the biological carbon pump. Biogeosciences 11, 995–1005. doi: 10.5194/bg-11-995-2014
Monier, A., Comte, J., Babin, M., Forest, A., Matsuoka, A., and Lovejoy, C. (2015). Oceanographic structure drives the assembly processes of microbial eukaryotic communities. ISME J. 9, 990–1002. doi: 10.1038/ismej.2014.197
Moore, G., and McNeil, K. (2018). The early collapse of the 2017 Lincoln Sea ice arch in response to anomalous sea ice and wind forcing. Geophys. Res. Lett. 45, 8343–8351. doi: 10.1029/2018gl078428
Münchow, A., Falkner, K. K., and Melling, H. (2007). Spatial continuity of measured seawater and tracer fluxes through Nares Strait, a dynamically wide channel bordering the Canadian Archipelago. J. Mar. Res. 65, 759–788. doi: 10.1357/002224007784219048
Münchow, A., Falkner, K. K., and Melling, H. (2015). Baffin Island and West Greenland current systems in northern Baffin Bay. Prog. Oceanogr. 132, 305–317. doi: 10.1016/j.pocean.2014.04.001
Münchow, A., and Melling, H. (2008). Ocean current observations from Nares Strait to the west of Greenland: interannual to tidal variability and forcing. J. Mar. Res. 66, 801–833. doi: 10.1357/002224008788064612
Münchow, A., Melling, H., and Falkner, K. K. (2006). An observational estimate of volume and freshwater flux leaving the arctic ocean through Nares Strait. J. Phys. Oceanogr. 36, 2025–2041. doi: 10.1175/jpo2962.1
Onda, D. F., Medrinal, E., Comeau, A. M., Thaler, M., Babin, M., and Lovejoy, C. (2017). Seasonal and interannual changes in ciliate and dinoflagellate species assemblages in the Arctic Ocean (Amundsen Gulf, Beaufort Sea, Canada). Front. Mar. Sci. 4:16. doi: 10.3389/fmars.2017.00016
Pavlov, A. K., Taskjelle, T., Kauko, H. M., Hamre, B., Hudson, S. R., Assmy, P., et al. (2017). Altered inherent optical properties and estimates of the underwater light field during an Arctic under-ice bloom of Phaeocystis pouchetii. J. Geophys. Res. Oceans 122, 4939–4961. doi: 10.1002/2016jc012471
Preußer, A., Heinemann, G., Willmes, S., and Paul, S. (2015). Multi-decadal variability of polynya characteristics and ice production in the North Water Polynya by means of passive microwave and thermal infrared satellite imagery. Remote Sens. 7, 15844–15867. doi: 10.3390/rs71215807
Przytulska, A., Comte, J., Crevecoeur, S., Lovejoy, C., Laurion, I., and Vincent, W. (2016). Phototrophic pigment diversity and picophytoplankton in permafrost thaw lakes. Biogeosciences 13, 13–26. doi: 10.5194/bg-13-13-2016
Rabe, B., Münchow, A., Johnson, H., and Melling, H. (2010). Nares Strait hydrography and salinity field from a 3-year moored array. J. Geophys. Res. Oceans 115:C07010. doi: 10.1029/2009jc005966
Raven, J. (1998). The twelfth Tansley Lecture. Small is beautiful: the picophytoplankton. Funct. Ecol. 12, 503–513. doi: 10.1046/j.1365-2435.1998.00233.x
Renaut, S., Devred, E., and Babin, M. (2018). Northward expansion and intensification of phytoplankton growth during the early ice-free season in Arctic. Geophys. Res. Lett. 45, 10590–10598. doi: 10.1029/2018gl078995
Revell, L. J. (2011). phytools: an R package for phylogenetic comparative biology (and other things). Methods Ecol. Evol. 3, 217–223. doi: 10.1111/j.2041-210x.2011.00169.x
Riisgaard, K., Nielsen, T., and Hansen, P. (2015). Impact of elevated pH on succession in the arctic spring bloom. Mar. Ecol. Prog. Ser. 530, 63–75. doi: 10.3354/meps11296
Rognes, T., Flouri, T., Nichols, B., Quince, C., and Mahé, F. (2016). VSEARCH: a versatile open source tool for metagenomics. Peerj 4:e2584. doi: 10.7717/peerj.2584
Schloss, P. D., Westcott, S. L., Ryabin, T., Hall, J. R., Hartmann, M., Hollister, E. B., et al. (2009). Introducing mothur: open-source, platform-independent, community-supported software for describing and comparing microbial communities. Appl. Environ. Microb. 75, 7537–7541. doi: 10.1128/aem.01541-09
Simon, N., Foulon, E., Grulois, D., Six, C., Desdevises, Y., Latimier, M., et al. (2017). Revision of the genus Micromonas Manton et Parke (Chlorophyta, Mamiellophyceae), of the type species M. pusilla (Butcher) Manton & Parke and of the species M. commoda van Baren, Bachy and Worden and description of two new species based on the genetic and phenotypic characterization of cultured isolates. Protist 168, 612–635. doi: 10.1016/j.protis.2017.09.002
Simpson, K., Tremblay, J., and Price, N. (2013). Nutrient dynamics in the western Canadian Arctic. I. New production in spring inferred from nutrient draw-down in the Cape Bathurst Polynya. Mar. Ecol. Prog. Ser. 484, 33–45. doi: 10.3354/meps10275
Stamatakis, A. (2006). RAxML-VI-HPC: maximum likelihood-based phylogenetic analyses with thousands of taxa and mixed models. Bioinformatics 22, 2688–2690. doi: 10.1093/bioinformatics/btl446
Stasko, A., Bluhm, B. A., Michel, C., Archambault, P., Majewski, A., Reist, J., et al. (2018). Benthic-pelagic trophic coupling in an arctic marine food web along vertical water mass and organic matter gradients. Mar. Ecol. Prog. Ser. 594, 1–19. doi: 10.3354/meps12582
Svenning, J., Dalheim, L., Eilertsen, H., and Vasskog, T. (2019). Temperature dependent growth rate, lipid content and fatty acid composition of the marine cold-water diatom Porosira glacialis. Algal Res. 37, 11–16. doi: 10.1016/j.algal.2018.10.009
Thaler, M., Vincent, W. F., Lionard, M., Hamilton, A. K., and Lovejoy, C. (2017). Microbial community structure and interannual change in the last epishelf lake ecosystem in the North Polar region. Front. Mar. Sci. 3:275. doi: 10.3389/fmars.2016.00275
Vader, A., Marquardt, M., Meshram, A. R., and Gabrielsen, T. M. (2015). Key Arctic phototrophs are widespread in the Polar Night. Polar Biol. 38, 13–21. doi: 10.1007/s00300-014-1570-2
Vincent, R. F., and Marsden, R. F. (2010). An analysis of the dissolution of ice in Nares Strait using AVHRR imagery. Atmosph. Ocean 39, 209–222. doi: 10.1080/07055900.2001.9649677
Keywords: marine microbial eukaryotes, pan-Arctic biome, Phaeocystis, North Water Polynya, diatoms (Bacillariophyta), ice loss
Citation: Kalenitchenko D, Joli N, Potvin M, Tremblay J-É and Lovejoy C (2019) Biodiversity and Species Change in the Arctic Ocean: A View Through the Lens of Nares Strait. Front. Mar. Sci. 6:479. doi: 10.3389/fmars.2019.00479
Received: 06 May 2019; Accepted: 16 July 2019;
Published: 14 August 2019.
Edited by:
Anne Helene Solberg Tandberg, University Museum of Bergen, NorwayReviewed by:
Zi-Min Hu, Institute of Oceanology (CAS), ChinaAnna Vader, The University Centre in Svalbard, Norway
Copyright © 2019 Kalenitchenko, Joli, Potvin, Tremblay and Lovejoy. This is an open-access article distributed under the terms of the Creative Commons Attribution License (CC BY). The use, distribution or reproduction in other forums is permitted, provided the original author(s) and the copyright owner(s) are credited and that the original publication in this journal is cited, in accordance with accepted academic practice. No use, distribution or reproduction is permitted which does not comply with these terms.
*Correspondence: Connie Lovejoy, connie.lovejoy@bio.ulaval.ca
†Present address: Dimitri Kalenitchenko, Centre for Arctic Gas Hydrate, Environment and Climate (CAGE), Department of Geosciences, UiT – The Arctic University of Norway in Tromsø, Tromsø, Norway Nathalie Joli, CNRS UMR 8197, Institut de Biologie de l’École Normale Supérieure, Paris, France