Partial Recovery of Macro-Epibenthic Assemblages on the North-West Shelf of the Black Sea
- 1School of Environment and Science, Griffith University, Brisbane, QLD, Australia
- 2Marine Institute, University of Plymouth, Plymouth, United Kingdom
- 3The Scottish Association for Marine Science, Oban, United Kingdom
- 4Helmholtz Center for Polar and Marine Research, Alfred Wegener Institute, Bremerhaven, Germany
- 5Center for Materials and Coastal Research, Helmholtz-Zentrum Geesthacht, Geesthacht, Germany
- 6Institute of Marine Biology, The National Academy of Sciences of Ukraine, Odessa, Ukraine
The north-west shelf of the Black Sea has suffered well-documented declines in biodiversity since the 1960s, and by the 1990s was considered a dead zone with virtually no sign of macroscopic epibenthic life. It was characterised by high levels of anthropogenic input, massive phytoplankton blooms, and periodically hypoxic to anoxic bottom waters. An important contributor to primary production on the northwest shelf is the red alga Phyllophora spp. growing in waters to 70 m depth. Phyllophora is a habitat forming taxon supporting complex assemblages of bivalves, sponges, and ascidians, with an associated rich fish fauna. From 1990 on, nutrient loads entering the system plummeted and the severity of algal blooms decreased. Changes to benthic communities, however, were far less rapid, and the trajectory and rate of any recovery of the dead zone, in particular Zernov’s Phyllophora Field, is far from certain. This study used towed underwater video imagery from research cruises in summer 2006 and spring 2008 to classify and map macro-epibenthic assemblage structure, and related this to putative physical, chemical and spatial drivers. Distinct and relatively stable benthic communities were in evidence across the northwest shelf at that time. These communities were largely structured by substrate type and depth, but there is some evidence that nutrients continued to play a role. Phyllophora spp. was present across much, but not all, of its former range, but at far lower percent cover than previously. The pattern of abundance of Phyllophora in 2006–2008 did not correlate with the documented pre-eutrophication pattern from 1966. There is some evidence that faster-growing opportunistic species have hindered recovery. We conclude that while there was evidence of sustained recovery, by 2008 the macro-epibenthic communities of the northwest shelf of the Black Sea were far from their pre-eutrophication state.
Introduction
“The forgotten sea returns… to our consciousness, our everyday life, our politics”
(Winship, 2007, p. 7).
The long-term decline in biodiversity on the northwest shelf of the Black Sea from the 1960s to 1990s is well documented (Mee, 1992; Zaitzev and Mamaev, 1997). The Black Sea suffers from the combined effects of anthropogenic eutrophication, overfishing and climate forcing (Mee et al., 2005; Oguz and Gilbert, 2007). By the early 1990s, as a result of unrestrained nutrient inputs, coupled with overexploitation of fish stocks (Daskalov, 2002), habitat loss though intensive near-bottom trawling (Revkov et al., 2018) and the invasion of exotic species (Shiganova, 1998; Shiganova et al., 2003; Siokou-Frangou et al., 2004), this once highly productive habitat was considered a dead zone (Mee, 2006; Todorova et al., 2019). It was characterised by high levels of anthropogenic nutrients delivered by the Danube, Dniester and Dniepr rivers, periodic massive phytoplankton blooms, and anoxic bottom waters during the growing season with virtually no sign of macroscopic epibenthic life, as described elsewhere (Diaz and Rosenberg, 2008; Samyshev and Zolotarev, 2018). An important contributor to primary production on the northwest shelf had been the red algae from the genus Phyllophora, growing drifting or attached to shell-bed substrates, in waters to 70 m depth as first described by Zernov (1909). Phyllophora spp. was present in very high densities over an area of more than 10,000 km2, and was commercially harvested for fertiliser (Schapova, 1954; Kalugina and Lachko, 1966). It was also important as a habitat forming taxon and occurred in complex assemblages with high densities of bivalves, sponges, and ascidians, with an associated rich fish fauna (Zaitsev, 1992; Mee, 2006). Through the 1970s and 1980s, these extensive Phyllophora beds, growing to mesophotic depths and hence at the limits of light availability, were lost from the effects of eutrophication and persistent overfishing (Daskalov, 2002), leading to shading from algal blooms at the surface and hypoxia at depth (Shapiro et al., 2011). This triggered in turn a trophic cascade leading to the collapse of most fisheries, echoing up the food chain, with the Monk Seal Monachus monachus populations in the Black Sea reduced to a handful of individuals by the mid-1990s (Zaitzev and Mamaev, 1997).
With the collapse of centrally planned economies in eastern Europe in 1989, agricultural subsidies ceased, dramatically reducing fertiliser use (Mee et al., 2005). Simultaneously, more stringent EU regulations reduced nutrient and other contaminant loads entering the western end of the Black Sea via the Danube (Konovalov and Murray, 2001; Artioli et al., 2008). Within a few years, nutrient concentrations in the waterbody plummeted, and the size, severity, frequency and duration of algal blooms dramatically decreased (Mee et al., 2005; Mee, 2006). Changes to benthic communities, however, have been far less rapid, and there remains uncertainty about the fate of nutrients and other contaminants bound up in sediments (Friedl et al., 1998; Wijsman et al., 1999; Fillmann et al., 2002; Readman et al., 2002), and rates of benthic nutrient cycling (Friedrich et al., 2002; Gregoire and Friedrich, 2004). Concurrently, the Black Sea has been subject to successive invasive species outbreaks, most notably by the ctenophore Mnemiopsis leidyi. M. leidyi was first noted in the Black Sea in the early 1980s (Shiganova, 1998) and reached peak densities in the late 1980s and early 1990s (Shiganova et al., 2001). The species represented a trophic “dead-end” and had well documented effects on planktonic and pelagic biodiversity until it rapidly declined subsequent to the introduction of the predatory ctenophore Beroe ovata in 1997 (Shiganova et al., 2003, 2018; Siokou-Frangou et al., 2004; Oguz and Velikova, 2010). Effects of these and other invasives on benthic ecosystems are, however, not well understood (Akoglu et al., 2014a; Minicheva, 2015).
In spring and summer, the water column of northwest shelf of the Black Sea is characterised by the formation of a strong thermohaline stratification, restricting mixing of bottom shelf waters with the surface layers, which thereby exacerbates hypoxic conditions. In winter the shelf is well-mixed (Sorokin, 2002). Isopycnic analysis of a long-term time series of temperature anomaly records available since the 1950s, reveals the presence of a c.20 year cycle in Bottom Shelf Water (BSW) temperature, with a warming period observed from the late 1950s to early 1970s followed by a cooling phase until the mid-1990s (Shapiro et al., 2010). A warming stage has been in place since then. The regime shift in the Black Sea Western Shelf ecosystem, including the dramatic reductions in nutrient inputs outlined above, thus coincides in time (mid 1990s) with the switch from cooling to warming in BSW (Oguz and Gilbert, 2007). It is therefore important to examine the influence of oceanographic and water body properties on observed epibenthic assemblage structure, as well as nutrients and biophysical factors.
Environmental conditions on the northwest shelf of the Black Sea are clearly influenced by a wide range of drivers, and there remains considerable uncertainty about the rate and likely trajectory of recovery of benthic communities in this region (Mee et al., 2005; Minicheva, 2007; Friedrich et al., 2014; Jessen et al., 2017). This is particularly important to understand, since the emerging economies of Eastern Europe are now faced with critical societal choices (Langmead et al., 2009; O’Higgins et al., 2014) about their future use of the Black Sea and its catchments. Recovery is by no means assured (Oguz and Velikova, 2010), especially in the context of current regional geopolitical instability (Christakis, 2015; Hansen, 2015). However, there are encouraging signs of the adoption of contemporary adaptive management approaches (Mee, 2005; Douvere and Ehler, 2011; Dungaciu, 2015), including the declaration of a 4,025 km2 marine reserve within the area of the former “Zernov’s Phyllophora Field” (ZPF) (Kostylev et al., 2010).
However, there remains little information about the status and trends in macro-epibenthic assemblage structure and distributions at time-points through the “post-crisis” stage (Revkov et al., 2018), and their relationship with documented changes in sediment, nutrient and water body characteristics. This paper presents results from research cruises in the boreal summer of 2006 (RV Akademik) and spring of 2008 (RV Poseidon) which examined a wide range of benthic and pelagic parameters in the region, as reported elsewhere (Pakhomova et al., 2008; Minicheva et al., 2013, 2018; Friedrich et al., 2015a). With regard to epibenthic assemblages, this study aimed to:
• Survey and classify macro-epibenthic communities across the northwest shelf of the Black Sea, from inshore areas to mesophotic depths, to compare these with pre-eutrophication accounts of assemblage composition.
• Quantify the relative influence of physical, chemical and spatial ecosystem drivers on observed assemblage structure at that time, in the context of a recovering, highly damaged ecosystem.
• Compare the 2006–2008 distribution and abundance of the key habitat-forming algae from the genus Phyllophora to historic distributions.
Materials and Methods
Study Area
The study was conducted on the northwest shelf of the Black Sea (Figure 1) in an area bounded in the west by the coasts of Bulgaria and Romania, and in the north and east by the coast of Ukraine including the Crimean Peninsula. The area extended northward to include the extent of the ZPF, close to the mouths of the Dnieper and the Dniester rivers, and south to include the area influenced by the outflow from Danube Delta. This encompasses a sea area of roughly 50,000 km2, and 800 km of coastline. Benthic assemblage structure was examined at depths from 13 to 122 m.
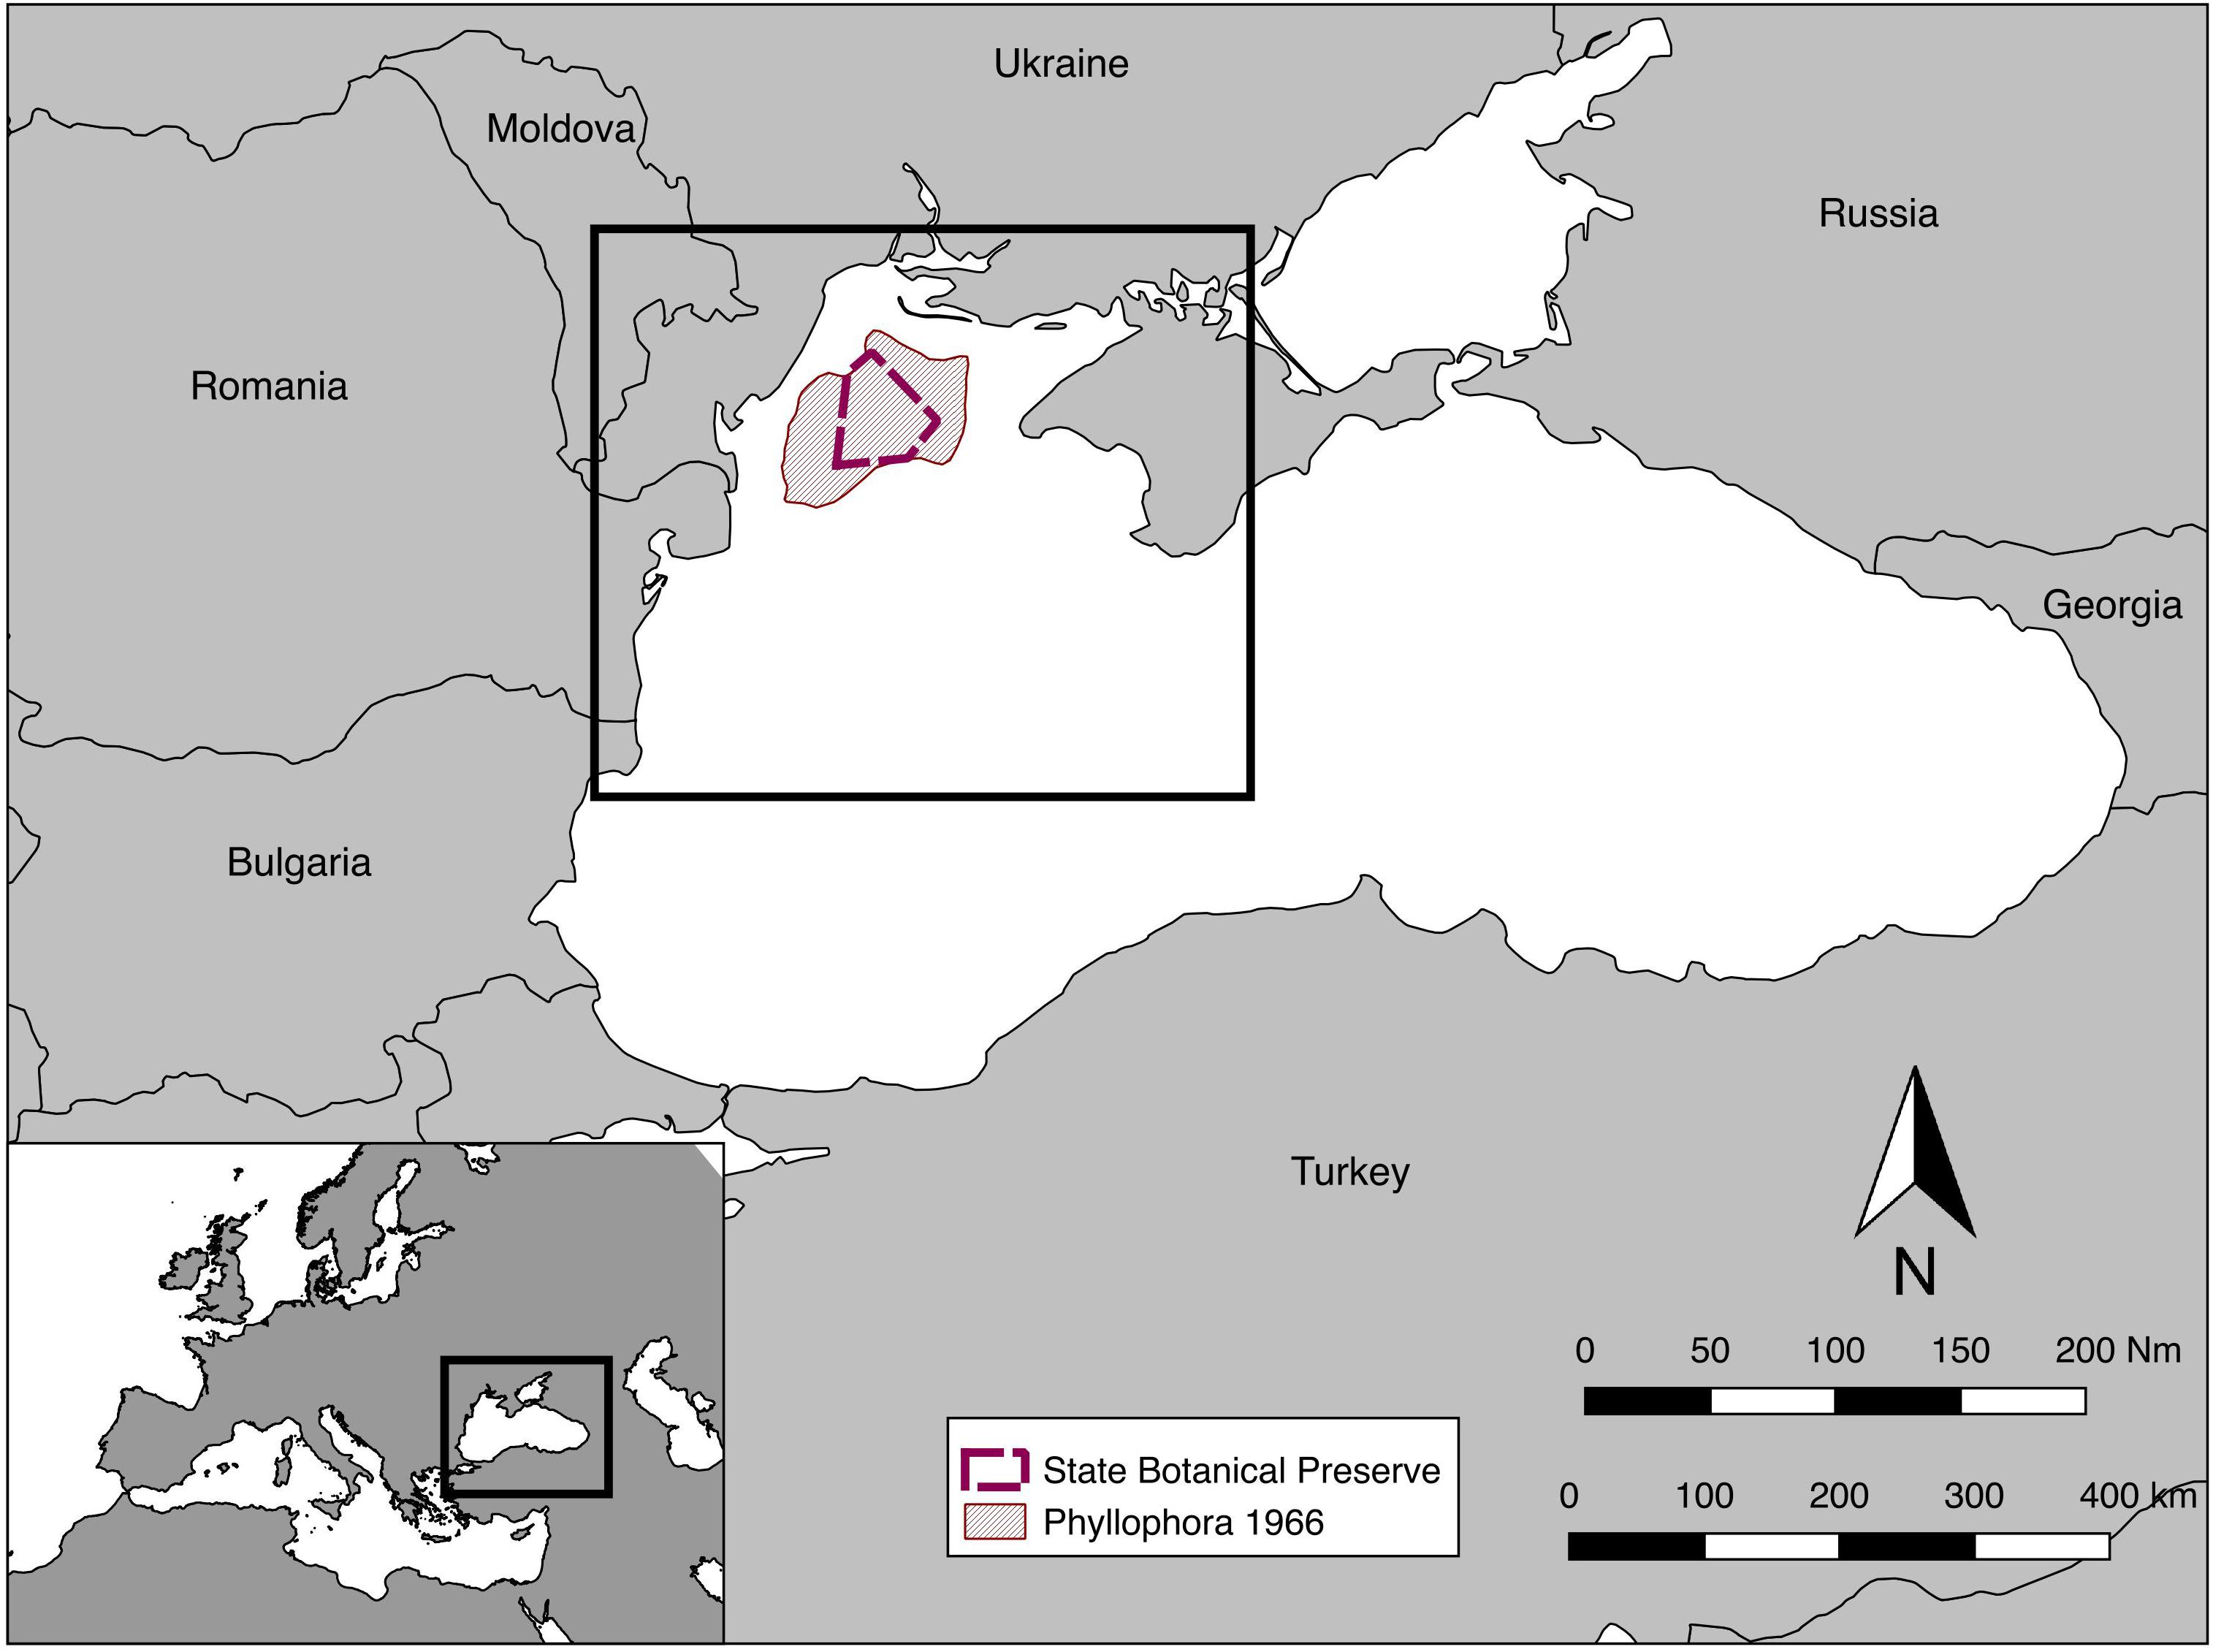
Figure 1. Location map, including the extent of Zernov’s Phyllophora Field from Kalugina and Lachko (1966), and the State Botanical Preserve declared in 2008. The box on the main map shows the approximate extent of subsequent maps.
Macro-Epibenthos Surveys
The structure of macro-epibenthic communities was assessed using a combination of remotely deployed and in situ sampling techniques. The primary sampling technique was visual sampling using video and still images from sensors mounted on a towed benthic imaging sled, a technique now widely used for benthic habitat classification and mapping (Barker et al., 1999; Stevens and Connolly, 2005), and for monitoring of ecosystem changes over time (Sheehan et al., 2013; Stevens et al., 2014). Image-based underwater sampling has the advantage of being able to sample very large areas cost-effectively (Michaelis et al., 2019), and including sites beyond the practical reach of diver-based surveys (Enrichetti et al., 2019). The imagery also allows examination of the relationship between structural elements of the benthos in situ. The primary disadvantage is lower taxonomic resolution, as samples are not retained for verification of identification.
In the 2006 (July–August: summer) cruise, imagery was collected using a Sony 1/3” CCD analogue video sensor in a custom underwater housing. Images were viewed at the surface in real-time and recorded on a DV8 digital handycam at VGA resolution (640 × 480 pixels) for later analysis. For the 2008 (March: spring) cruise, imagery was collected using a Kongsberg Simrad 14-208 camera, which allows for real-time capture of video at VGA resolution, plus higher resolution still images at 5-megapixels. Video was recorded on an ARCHOS AV700 digital video recorder as.avi files, using a DivX codec. Still images were stored in the camera and downloaded after each tow. For both cruises lighting was provided by two OM1000 250w underwater floodlights. Expert commentary about the imagery from the scientific staff aboard was recorded as they viewed an on-deck monitor in real-time, allowing items of interest to be flagged for more detailed investigation.
The basic sampling unit was a single (nominally) 200 m video tow at each station, located by GPS. Video tows were effected by either allowing the vessel to drift with wind and tide, or by steaming into the direction of drift to effect a speed over the ground of ≤ 0.25 ms–1; at any greater speed images were blurred and not usable for data extraction. This is consistent with contemporary practise for remote image-based sampling in deep water (e.g., Cánovas-Molina et al., 2016; Michaelis et al., 2019).
The imaging sensors were mounted on the sled at an angle of 45° because previous experience had shown that it is easier to recognise organisms in this orientation than looking straight down. In both cruises the field of view was calibrated by tank testing both before and after sampling.
Quantitative data was extracted from the video stream by sub-sampling a frame every 2–5 s, depending on the speed of the camera over the ground, providing maximum coverage without overlapping images. Some of the resultant frames were not usable due to blurring, or turbidity, so 50 good quality video frames per tow were randomly selected for analysis. Taxon identification was aided by samples retrieved by a small dredge, and, during the Spring 2008 survey, by ten 5-megapixel still images taken during each tow, giving high-resolution images of taxa in situ.
Video files were analysed using using Quicktime ProTM v7 software. A counting frame was superimposed on the video files, representing a constant 1 m2 of sea floor. Since the field of view was known and constant, counts of individual organisms within the 1 m2 frame were made and average density of each species (ind m–2) calculated over the number of frames (nominally 50) for each tow. The counting frame also contained an array of nine points (representing the intersections of a 0.25 m grid within the counting frame). Percent cover of macrophytes was therefore estimated by and counting the number of points falling on each taxon, in each frame. The number of points for each taxon was summed over the entire tow and divided by the total number of points from all the frames to give an accurate estimate of percent cover for each taxon (Sheehan et al., 2010; Stevens et al., 2014). In some cases digital filters were used to improve contrast and clarity of the imagery.
The extracted data were arranged in sites by species matrices for density of individual organisms and % cover of macrophytes, respectively. These were then subjected to univariate and multivariate analyses as detailed below.
Possible Drivers of Epibenthic Structure
CTD, Water Chemistry, and Nutrients
Water samples were taken using a rosette of 12 sampling bottles mounted on a circular frame, together with a Sea-Bird SBE 9 CTD equipped with Conductivity, Temperature, Pressure sensors, providing a continuous profile of water body properties. Samples were taken 1 m below the surface and c. 2 m above the bottom, as well as at intervals through the profile representing discontinuities in the water body; however only the surface and bottom data are included in our analyses. On recovery of the rosette, water subsamples were taken from each bottle, and processed on board for water chemistry and nutrient concentrations using standard laboratory techniques (Pakhomova et al., 2008; Friedrich et al., 2015a). In 2006, oxygen concentrations were determined by Winkler titration of the water samples. Sensors for primary productivity (by fluorescence: Chelsea Minisensor), and oxygen concentrations (SBE 43, in 2008 only) were also deployed, either on the rosette frame or a separate array (Friedrich et al., 2015a,b; Aleynik et al., 2019). Hypoxia can also be detected by increased NH4 in the water samples (Friedrich et al., 2014).
Substrate Type
Substrate type was estimated from the video images in four grain size classes. Much of the sediment of the north-west shelf of the Black Sea is biogenic, and this is reflected in the classes used: sand/mud, shell grit, Modiolus shell, Mytilus shell. The final two classes denote recognisable dead but whole or nearly whole shells of these two taxa, which in places form the dominant substrate on the sea floor (Wijsman et al., 1999). For each frame, the substrate type which formed at least 50% of the field of view was recorded. For each video tow, therefore, a percent cover value for each substrate class was derived. In addition, for simplicity in subsequent analyses, we calculated a single substrate score ranging from 1 to 4, weighted by sediment size so that 1 represented 100% sand/mud, and 4 represented 100% Mytilus shell.
Spatial Drivers
For each tow, spatial information relating to the distance from major input sources (the mouths of the Danube, Dnieper and Dniester rivers), as well as the distance offshore, were derived using GIS techniques in ARCGIS version 9.1. Depth at the start, mid-point and end of each tow was also noted, and the mean value used in subsequent analyses.
Analyses
Patterns in Epibenthic Assemblage Structure
Patterns of biodiversity within the macro-epibenthos were investigated using ordination analyses of the sites by species matrices in PRIMER v6 (Clarke and Warwick, 2001). Data were fourth-root transformed to moderate the influence of numerically dominant taxa, and similarity matrices were constructed using the Bray-Curtis similarity measure. Differences between assemblage groups derived from the ordination analyses were verified by one-way Permuted Multivariate Analysis of Variance (PERMANOVA) within the PRIMER package (Anderson, 2001; Anderson et al., 2007). Contribution of individual benthic species or bioturbation indicators to assemblage group similarity was assessed using the SIMPER routine in PRIMER, which quantifies the percent contribution of each variable to group similarity. This information was used to assign descriptive titles to the groups and allowed comparisons of groups with similar composition between the two sampling periods.
Influence of Drivers of Epibenthic Assemblage Structure
Data on putative biological and abiotic drivers were assembled into sites by indicators matrices. The influence of this range of physico-chemical and spatial drivers on the derived biological assemblage structure was assessed using the BIOENV routine in PRIMER, which iteratively tests the correlation between matrices of abiotic similarity, derived from available combinations of specified drivers, and the corresponding matrix of biological similarity. BIOENV provides a Spearman’s ranked correlation value (ρ) for possible drivers, both individually and in combination, as a measure of their relative contribution to assemblage structure.
Distribution and Abundance of Phyllophora and Other Macroalgae
Three separate analyses (presence/absence, overall abundance, distribution pattern) were conducted to compare the distribution and abundance of Phyllophora from the 2006–2008 surveys with known historical values.
The presence or absence of Phyllophora spp. at detectable densities on the northwest shelf was mapped for combined Summer 2006 and Spring 2008 data. Distribution of Phyllophora presence was compared with mapped historical extents of the ZPF, derived from georeferenced and digitised historical maps of Phyllophora spp. distribution and biomass, primarily contained in Minicheva (2005) and Zaitzev and Mamaev (1997), in order to determine the relationship between historical and 2006–2008 range.
To compare overall abundance of Phyllophora spp. within the ZPF between 2006–2008 and pre-eutrophication values, the derived values for percent cover of Phyllophora were compared with percent cover estimates from the ZPF documented in the percent cover distribution map of Kalugina and Lachko (1966) reproduced in Minicheva (2005). Raw data for the 1966 distribution map is not available, so percent cover values for each station sampled in Summer 2006 and Spring 2008 were derived by superimposing the sample locations on the 1966 map, and scoring the value of the polygon beneath each point. Percent cover values for the 1966 map were derived from grab or dredge samples, supplemented by diver assessments (Kalugina and Lachko, 1966), which are arguably less accurate than the video method used in this study, in that they do not sample cover in situ. This is reflected in the categorical nature of the 1966 data. Because the categories represent a range of values, and the ranges for each category are not continuous (i.e., 10–20% then 50–70%) we conservatively assumed the lowest value in the range, except for the range 0–5%, where we assumed a value of 1%, indicating presence. Only sample locations within the footprint of the 1966 polygons were used. Given the categorical nature of the data, and assumptions made in deriving data from the 1966 maps, the non-parametric Wilcoxon’s signed ranks test was then used to test for differences between mean 1966 percent cover, and mean percent cover in 2006 and 2008 separately, and pooled to give additional power in the analysis. Because of the possibility of bias when comparing percent cover values derived using very different methods, the results of this and the following analysis are interpreted with caution.
The distribution pattern of percent cover of Phyllophora within the boundaries of the ZPF at 1966 was compared to the 2006–2008 patterns of percent cover by using correlation analyses to compare the values at each sampled point. This analysis tests whether the historical patterns of greater or lesser percent cover predicted post-crisis patterns.
In addition, twelve of the fourteen stations sampled on both cruises lay within the footprint of the former ZPF, forming in effect a cross-shelf transect from near the mouth of the Dniester inlet to the 50 m isobath (Figure 2). This allowed analyses of differences, especially in algal abundance and depth distribution, between Summer 2006 and Spring 2008. It is not possible to properly test for seasonal effects without replication across years, nevertheless the differences between these two times are of interest, particularly from the point of view of the dynamics of Phyllophora spp. growth and coverage (Minicheva et al., 2013).
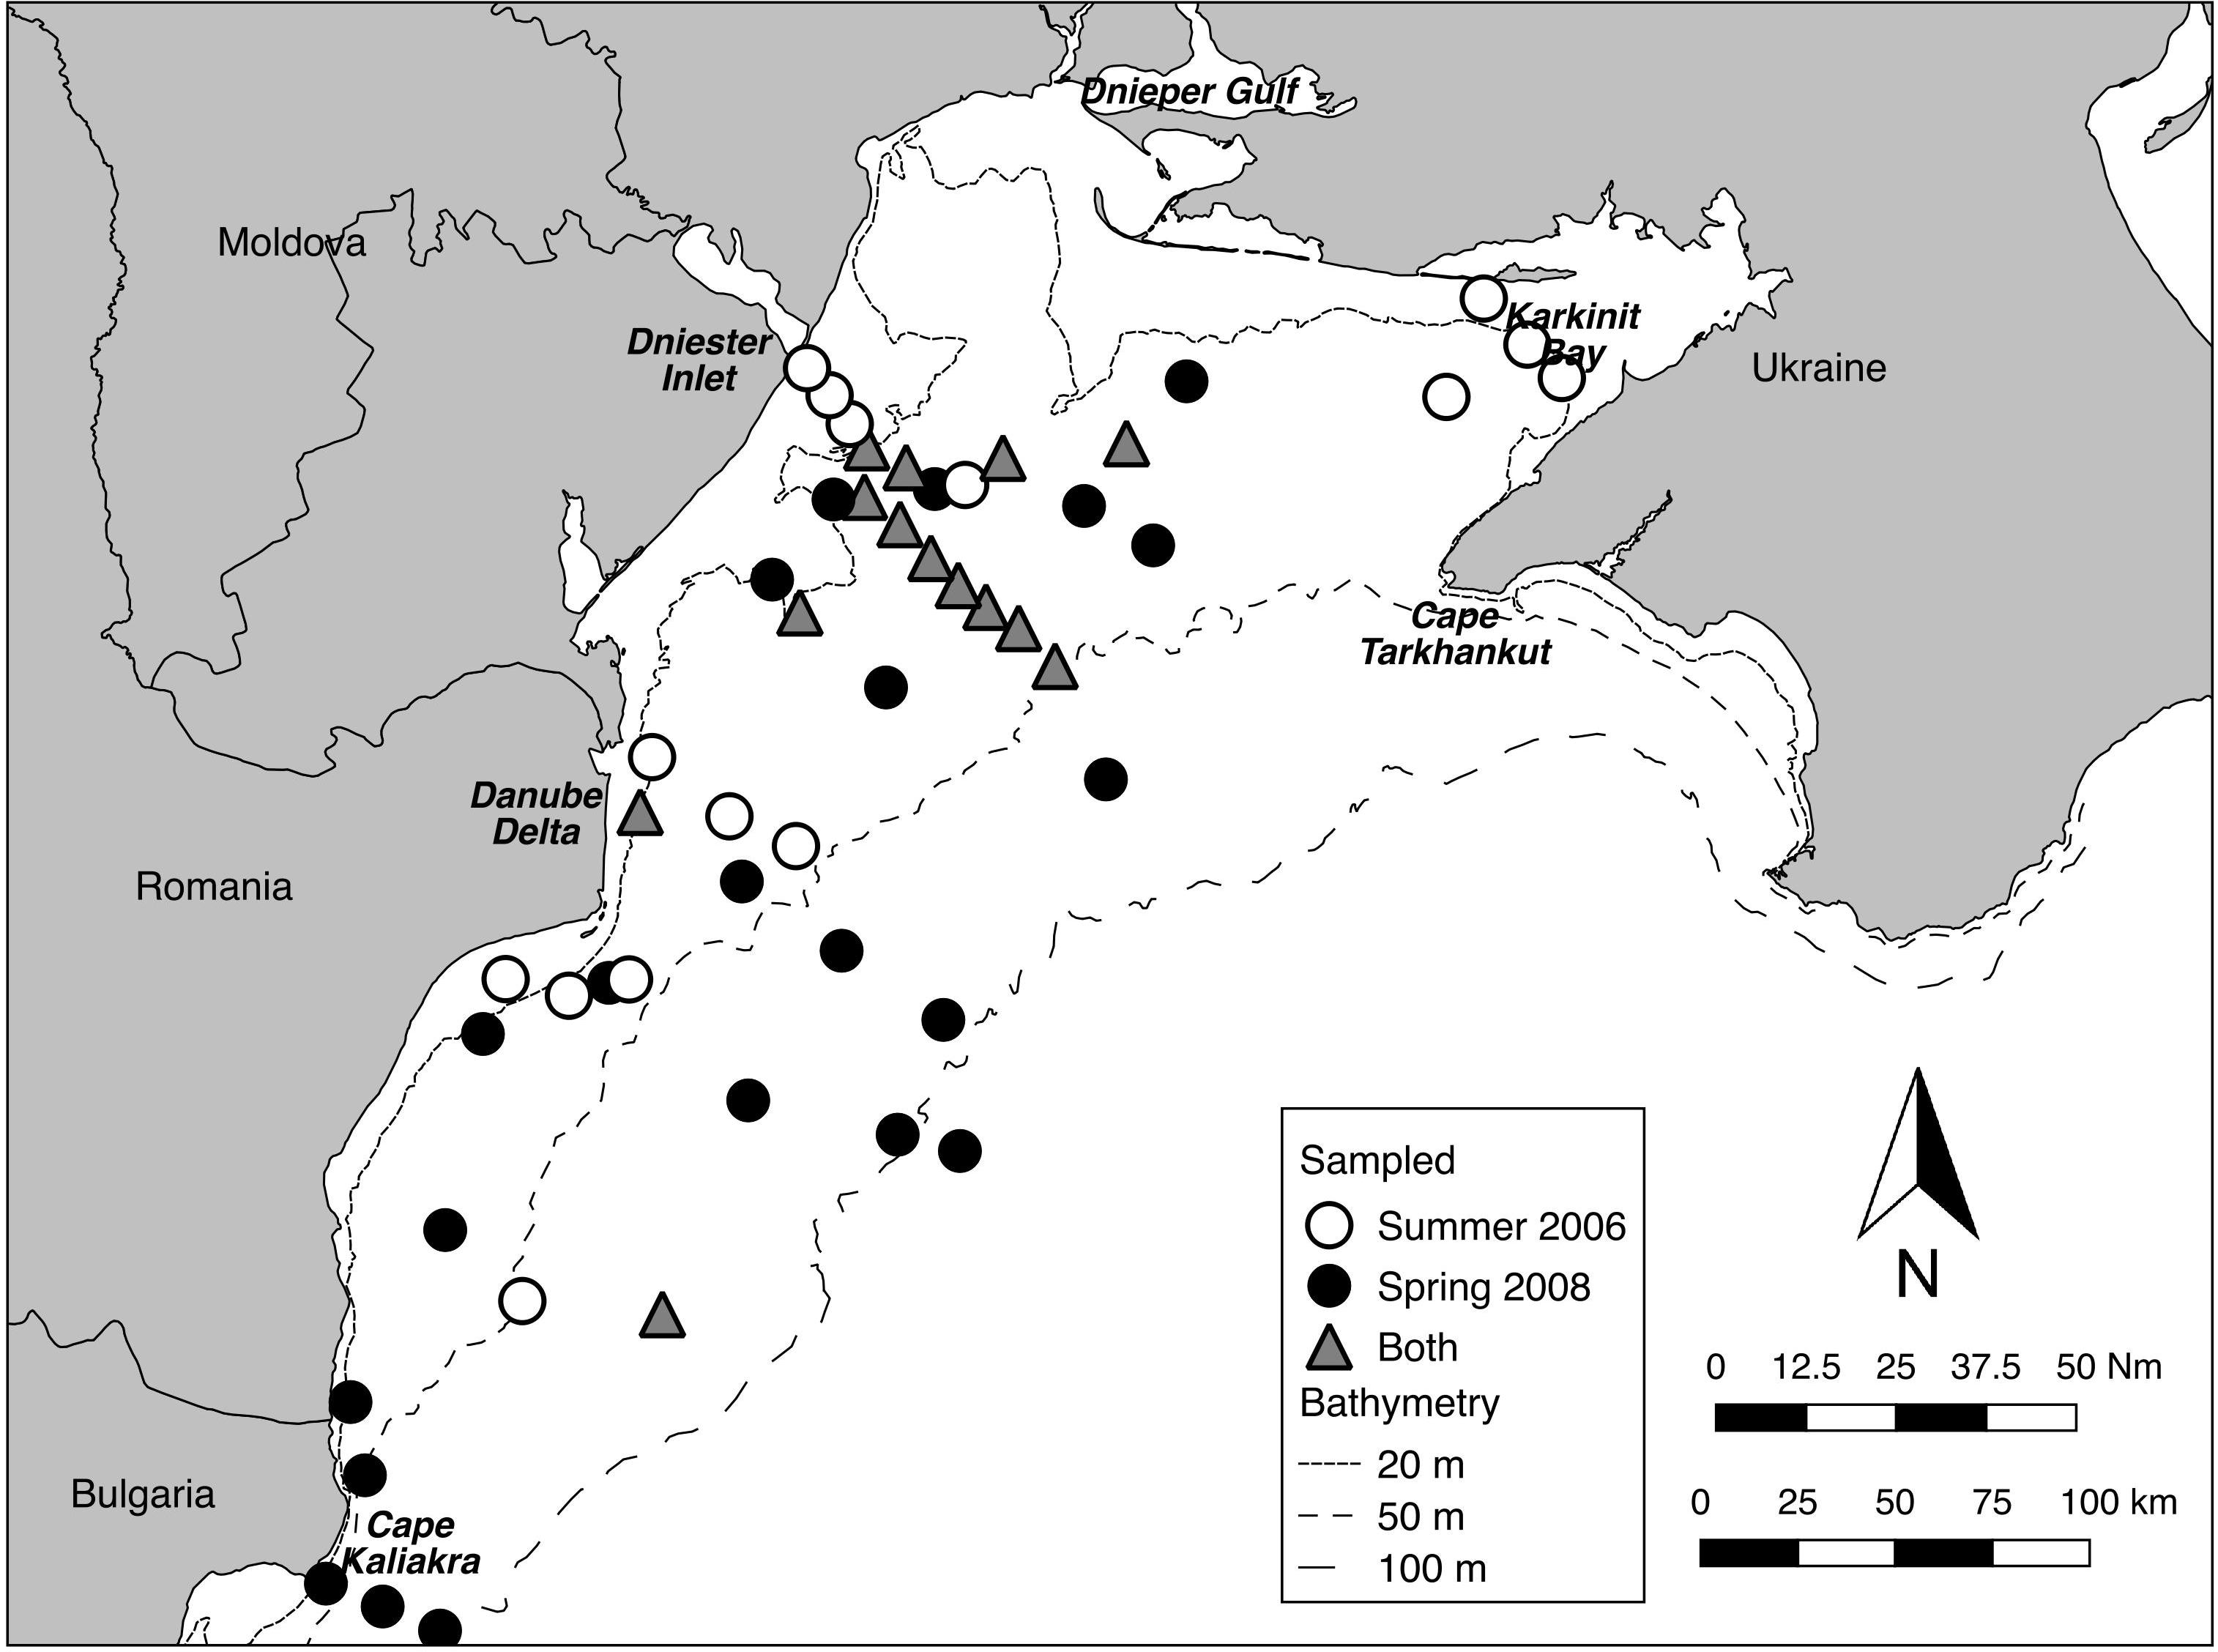
Figure 2. Sampling distribution for Summer 2006 and Spring 2008. Fourteen stations were sampled in both periods (transect centroids within 500 m).
Results
Descriptions of Datasets
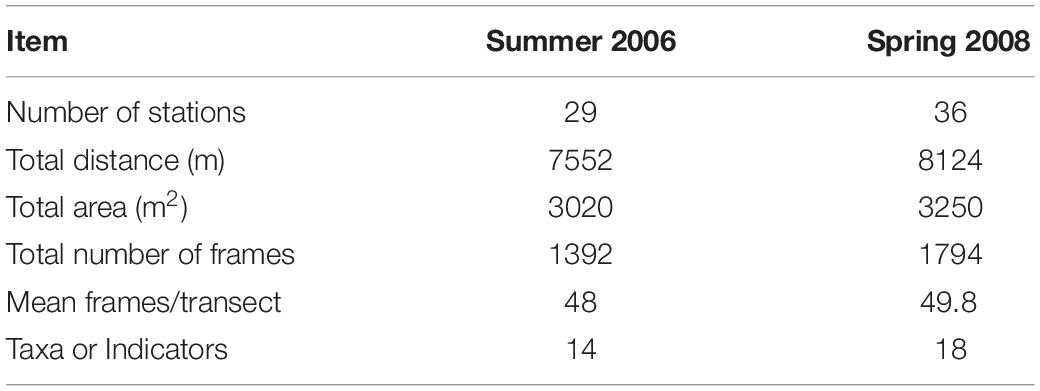
Twenty-nine stations were successfully sampled with the video sled in Summer 2006, and 36 in Spring 2008 (Table 1 and Figure 2) for a total sampled distance of over 7.5 km in 2006, and over 8 km in 2008. While nominally 50 still frames were sampled per tow, in a few tows, especially in turbid waters closer to the Danube Delta, less than 50 useable frames were available. Data matrices used for analyses of assemblage structure in each year were therefore 29 stations by 14 taxa or indicators (burrows, tracks) for 2006, and 36 stations by 18 taxa or indicators for 2008. These data have been lodged with Pangaea1.
Benthic Assemblage Structure Summer 2006
Three distinct groups were apparent within the benthic assemblage on the northwest shelf of the Black Sea in Summer of 2006 (Figure 3A). These groups were consistent across ordination techniques and data transformations; the nMDS based on fourth root transformed data is shown because this has the lowest stress value. A one-way PERMANOVA test confirmed that the derived groups were statistically distinct (df = 4, Pseudo-F = 20.3, all pairwise tests p < 0.001). Group names are assigned based on the results of SIMPER analyses which show which taxa/indicators are responsible for with-in group similarity. Table 2 shows the taxa contributing up to 90% of within-group similarity, pooled by growth form (notionally phylum) for ease of interpretation. The vectors on the nMDS (Figure 3A) illustrate the influence of these. The group labelled Bioturbators is most strongly influenced by the presence of burrows, tracks, and tubeworms. The other two groups Mytilus/Ascidians and Mytilus/Algae are, as the names suggest, both characterised by relatively high densities of living Mytilus galloprovincialis shell, but with quite different associations of several species of colonial ascidians, on the one hand, and algae (principally the Rhodophytes Phyllophora crispa and Polysiphonia sanguinea) on the other (Table 2). Two stations (one in Karkinit Bay, and the other in deep water off the Romanian coast) were statistically distinct from these three groups, and from each other (PERMANOVA p < 0.01). In both cases these stations were quite depauperate.
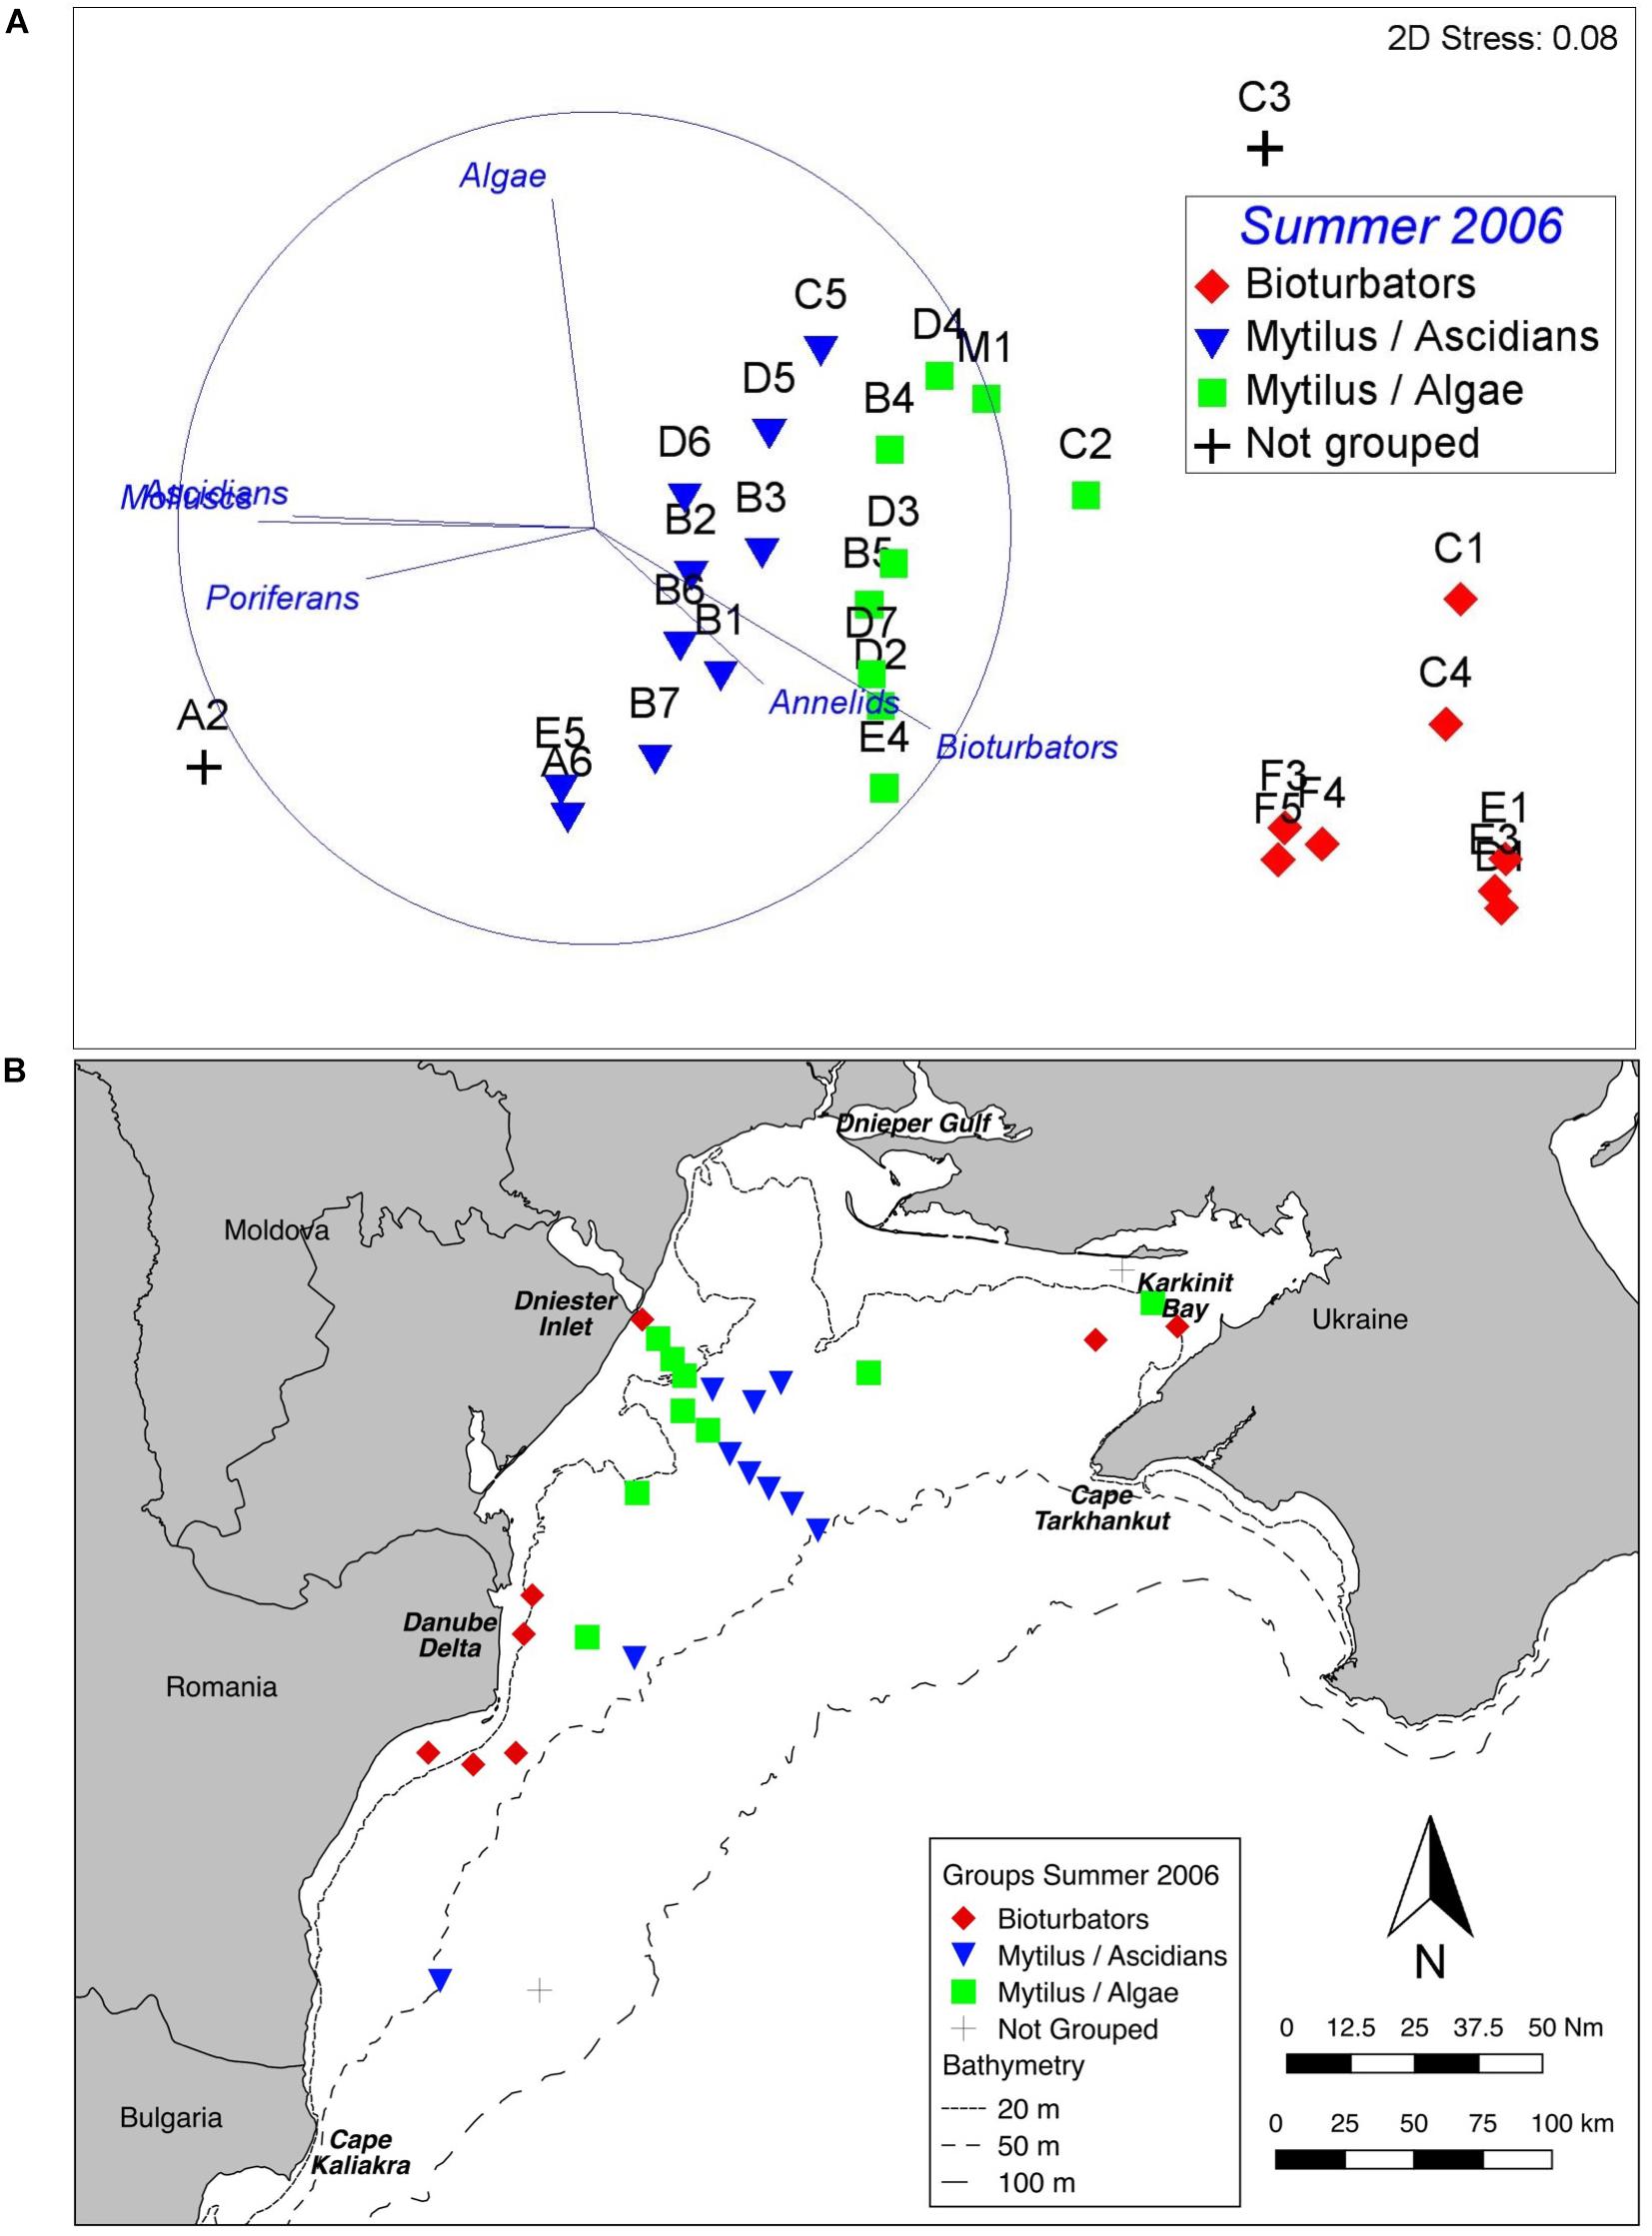
Figure 3. Benthic assemblage structure, Summer 2006. (A) nMDS of fourth root transformed abundance data showing three clearly defined groups. The vectors illustrate the contribution of main growth forms. (B) Map of derived groups. Group names are derived from the most influential taxa in the BIOENV analyses.
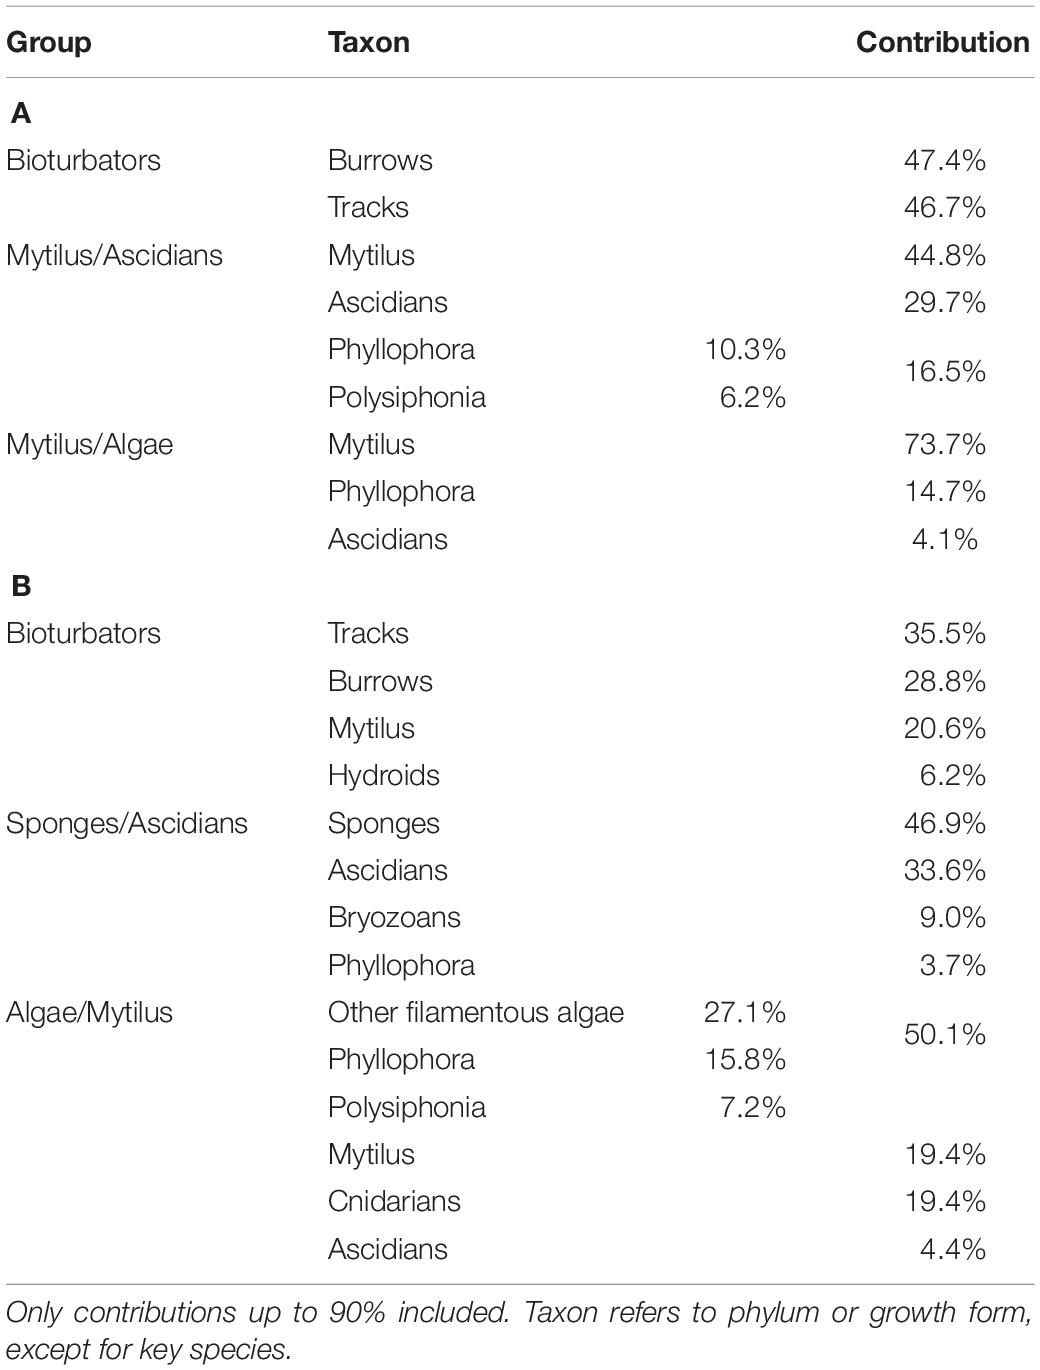
Table 2. SIMPER analysis of contribution to within-group similarity (A) Summer 2006, (B) Spring 2008.
Plotting the derived groups (Figure 3B) shows a clear spatial pattern. The Bioturbators group occurs inshore, while the Mytilus dominated groups are in deeper water, further from the coastline (although stations near the Dniester inlet are in < 20 m). Mytilus/Algae stations are generally shallower than the Mytilus / Ascidians stations; the analysis of possible drivers (below) explores this further.
Benthic Assemblage Structure Spring 2008
Similarly, there are three well defined groups apparent in benthic assemblage structure from the Spring 2008 cruise data, and these are also consistent across ordination techniques and data transformations (Figure 4A). The one-way PERMANOVA test confirmed that the derived groups were statistically distinct (df = 4, Pseudo-F = 19.6, all pairwise tests p < 0.001). Again, group names were assigned on the basis of SIMPER results (Table 2). Symbology has been kept consistent with the Summer 2006 analysis (Figure 3) since the principal contributors to within-group similarity are largely the same. The exception to this is the Sponges/Ascidians group, where the same symbology as the Mytilus/Ascidians group from 2006 has been used because the group is also characterised by Ascidians. Again, vectors on the nMDS (Figure 4A) illustrate the influence of benthic growth forms on the derived pattern. Two stations (not the same two) were also found to be statistically distinct from the derived groups and each other (PERMANOVA p < 0.01); in this case they were depauperate stations in >100 m depth.
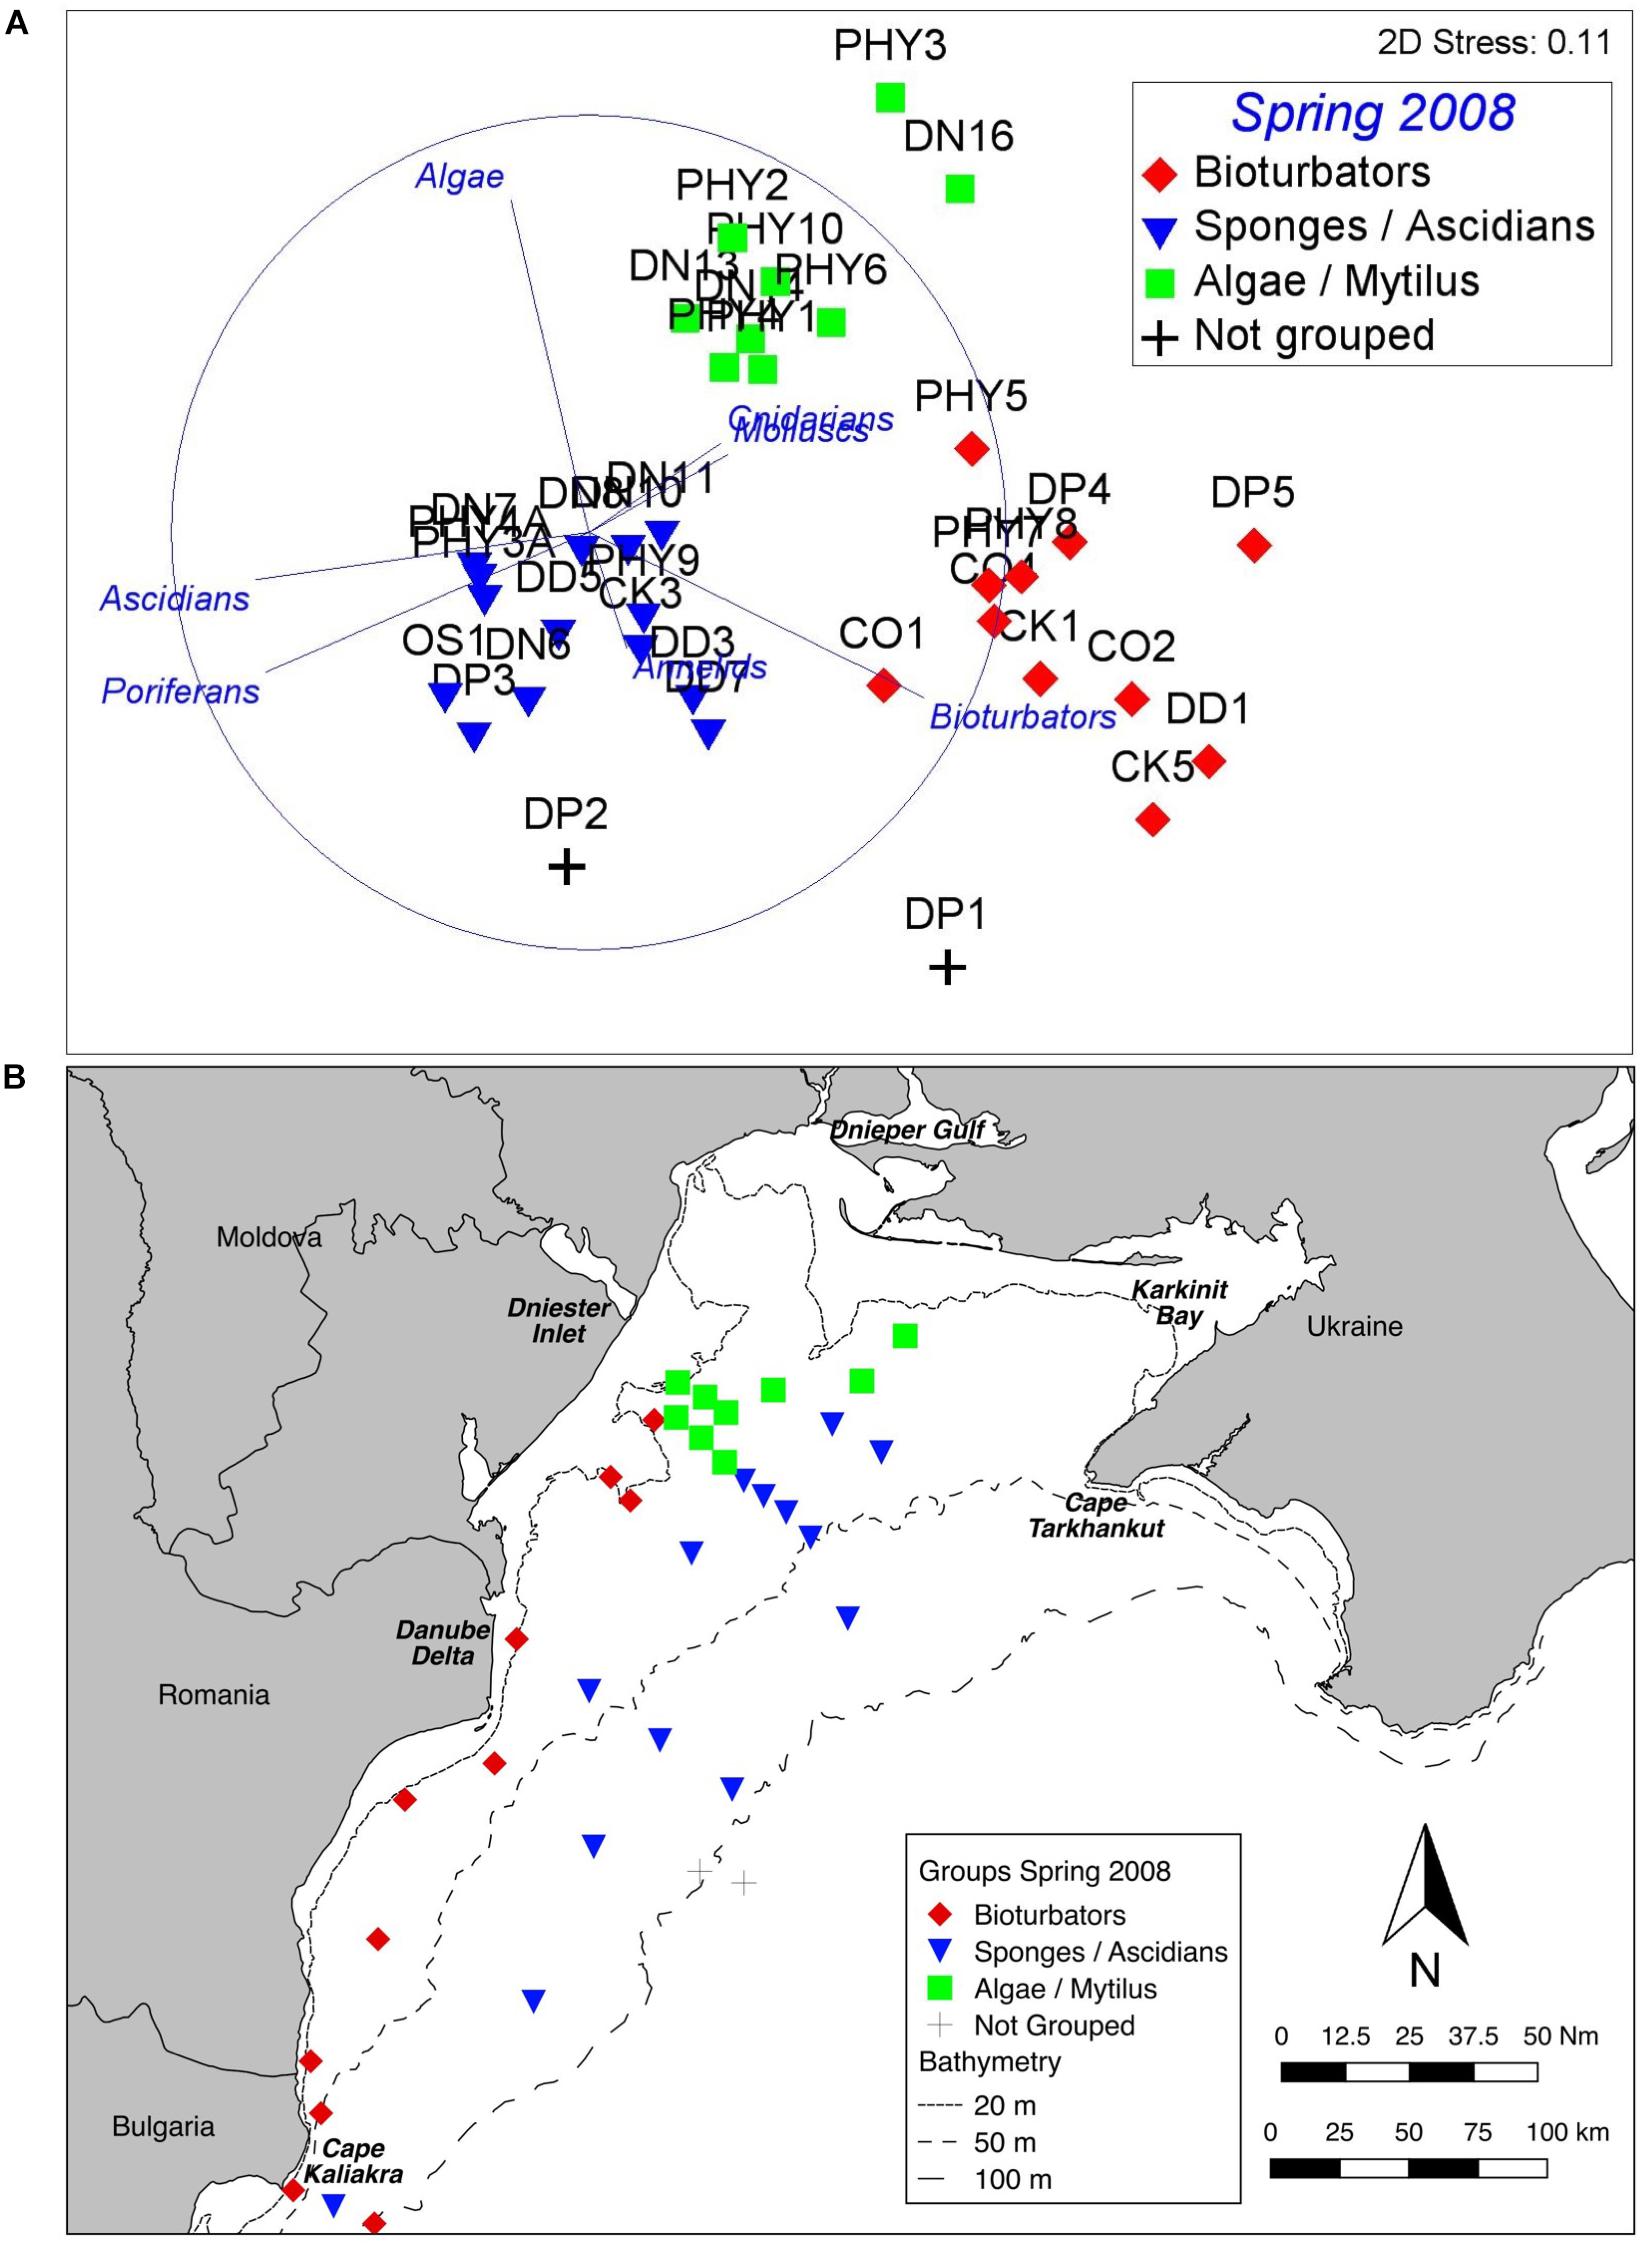
Figure 4. Benthic assemblage structure, Spring 2008. (A) nMDS of fourth root transformed abundance data showing three clearly defined groups. The vectors illustrate the contribution of main growth forms. (B) Map of derived groups. Group names are derived from the most influential taxa in the BIOENV analyses.
Plotting the derived groups (Figure 4B) shows a notionally similar spatial pattern to the Summer 2006 stations, with the Bioturbator-dominated group inshore, and the Algae dominated group constrained largely within the historical footprint of the ZPF off the Dniester inlet. Further offshore the Sponge/Ascidian dominated group is widespread across the shelf.
Abiotic Drivers for Patterns in Assemblage Structure
The influence of abiotic factors on benthic assemblage structure for each sampling period was determined by iterative BIOENV analyses. Abiotic data was not available for all stations, so the BIOENV analyses were carried out for the subset where both biological and abiotic data was available. Data on 32 environmental factors were available at 24 stations for 2006, and 27 stations for 2008.
The relative contribution of individual factors was determined (Supplementary Appendix 1) prior to testing combined models. To avoid undue weight in the analyses from related parameters, we cross-correlated all parameters and where pairs correlated highly (r > 0.7) we removed the factor with the lowest individual BIOENV (ρ) value from subsequent BIOENV analyses. Factors with no significant relationship to the derived assemblage structure were also excluded from subsequent analyses. We also excluded surface waterbody factors (included in Table 3 for comparative purposes) as less relevant to structuring benthic assemblages than bottom waterbody factors.
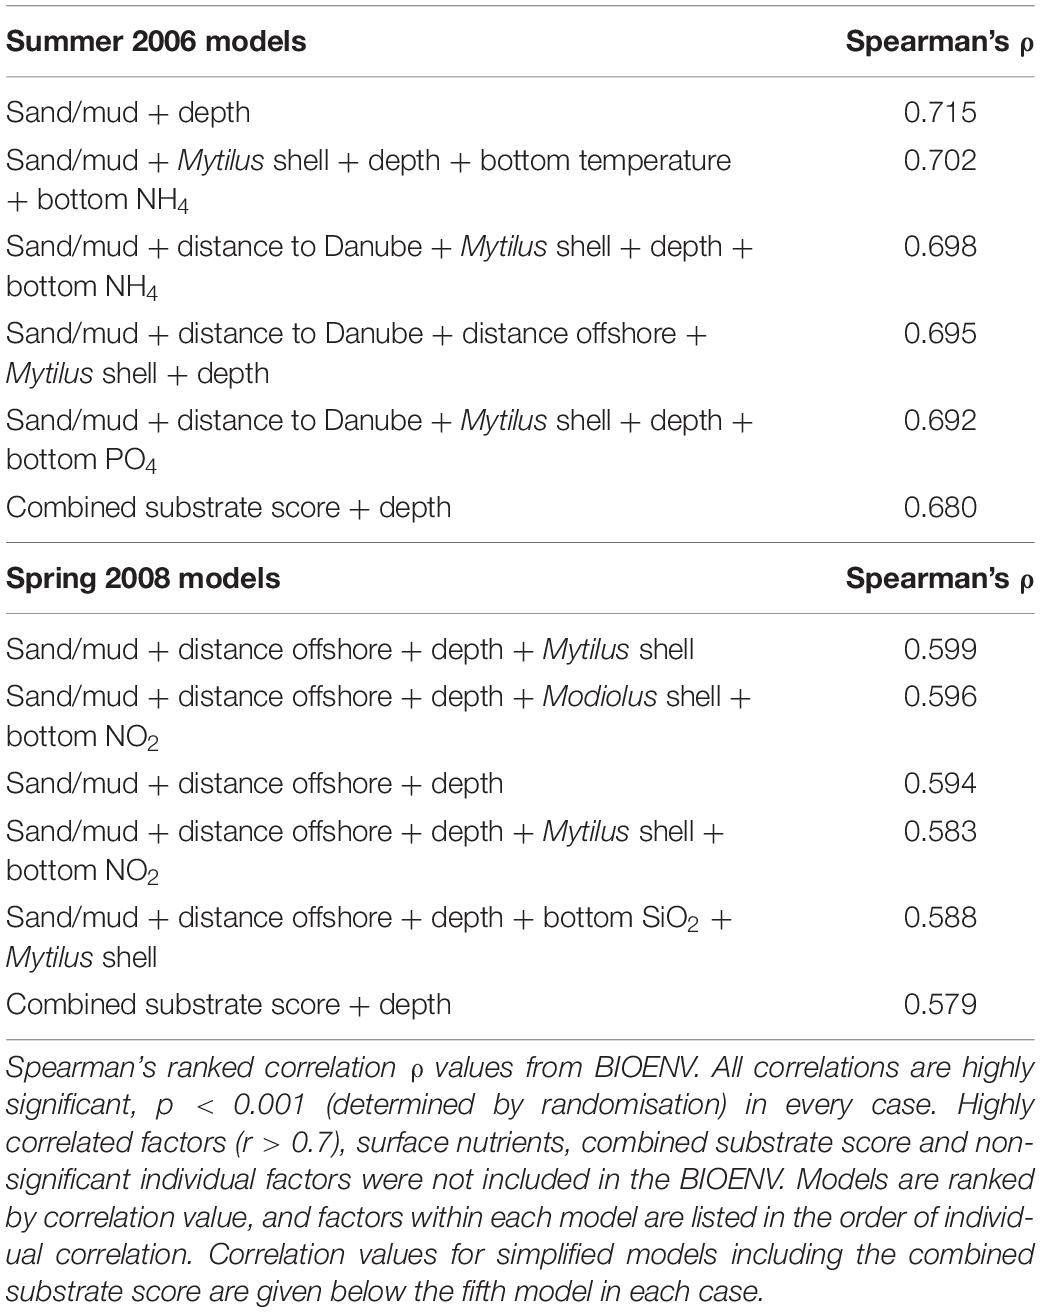
Table 3. Best-fit models of combinations of abiotic drivers for macro-epibenthic assemblage structure in Summer 2006 and Spring 2008.
It is clear that factors relating to substrate and geographical position, as well as depth, consistently have a stronger relationship to the observed assemblage structure than waterbody nutrients and physical parameters. Rather than “cherry-pick” the strongest relationships for inclusion in the combined models, we iteratively tested all possible combinations of up to five factors (Table 3).
Combined models provided strong correlations with derived assemblage structure in both years. The core of each model was geographic and substrate related factors, as well as depth; changes in associated factors such as nutrients had only minor influence on the strength of the correlation. To illustrate this we included simplified models, using only depth and the single substrate score; it can be seen that these correlated only slightly less well with the assemblage structure than the complex models with up to five factors (Table 3).
Phyllophora Distribution and Abundance Compared to Historical Data
Presence or Absence of Phyllophora in 2006–2008 Compared to Pre-eutrophication Extent
The presence or absence of Phyllophora spp. at detectable densities derived from video sampling in 2006-08 was compared with pre-eutrophication extents derived from historical maps of Phyllophora spp. distribution (Figure 5). Because the 2006 and 2008 surveys were not structured with the sole objective of mapping the extent of current Phyllophora distribution, distribution within the previous extents was not comprehensively sampled, and thus comparable estimates of area are not available. Nonetheless it is clear that Phyllophora was present in 2006–2008 in detectable densities in the core of its former range, but not across all of it, which in 1962 extended southwest to include the Danube Delta front (Michaylov and Mashtakova, 1966), and across deeper (>50 m) areas of the northwest shelf, to about 20 km west of the Crimean peninsula at Cape Tarkhankut (Schapova, 1954).
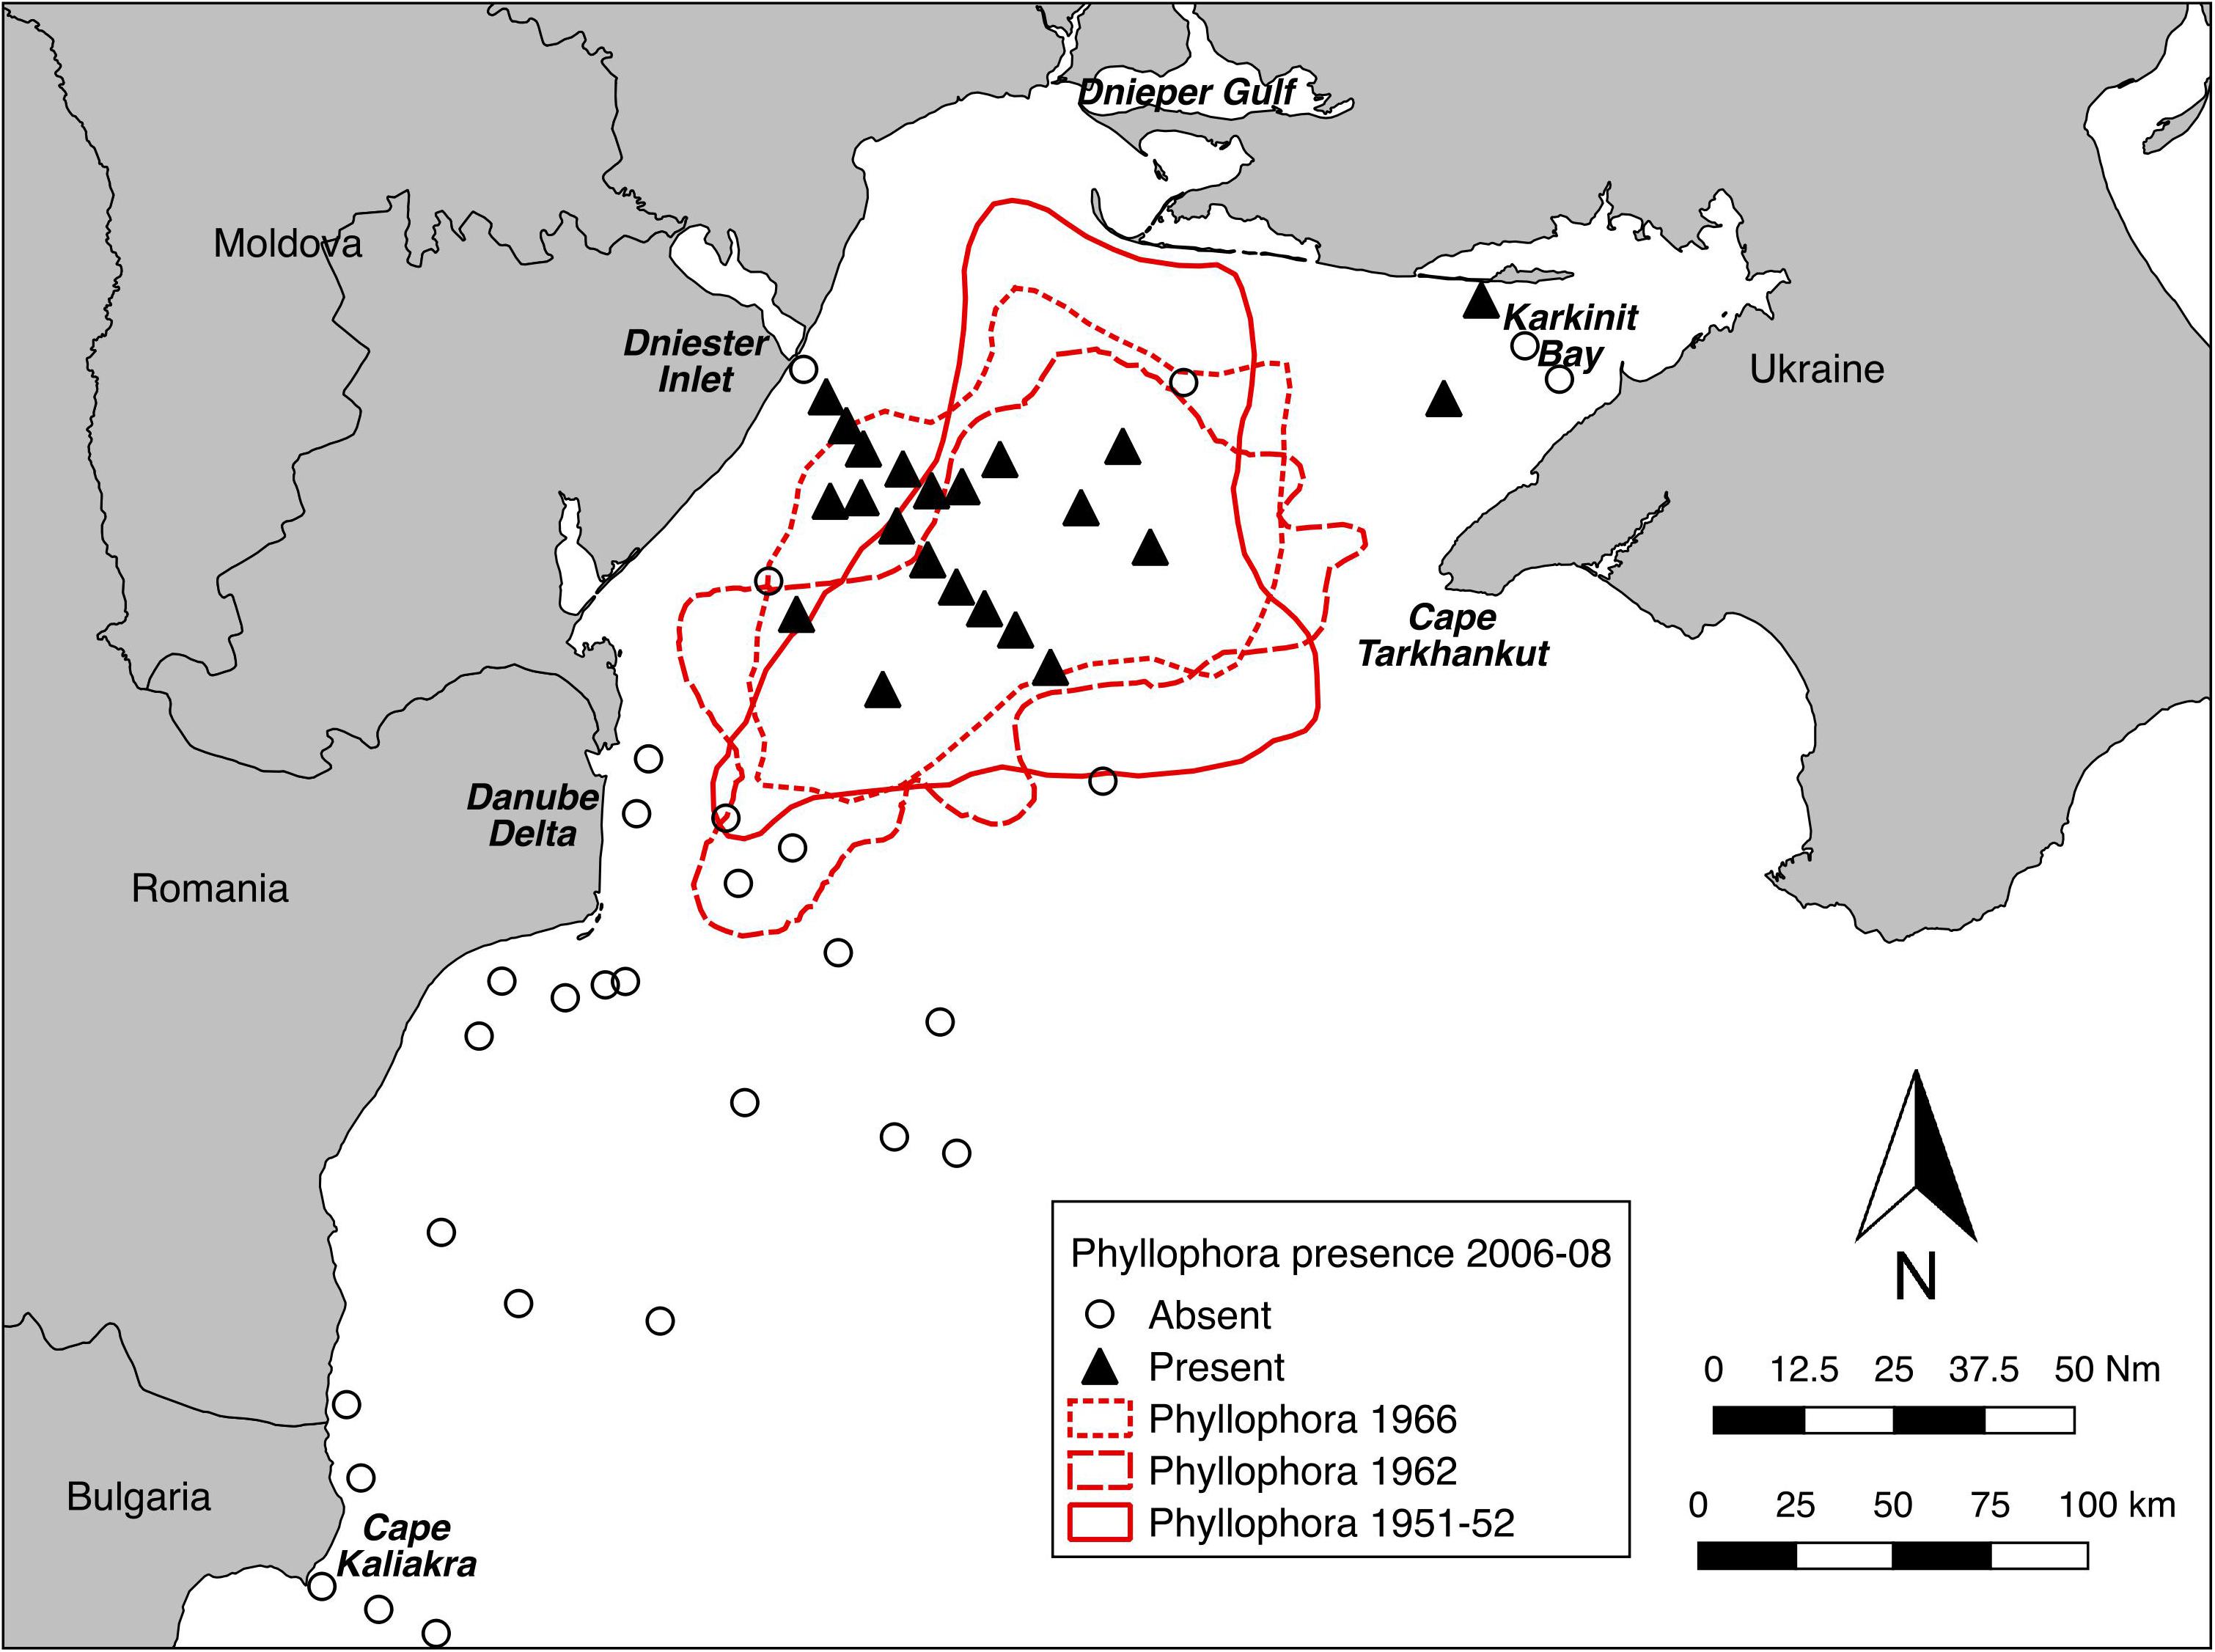
Figure 5. Presence/absence of Phyllophora spp. at detectable densities from towed video sampling in 2006–2008, compared to mapped extents of ZPF pre-eutrophication. Maps digitised and georeferenced from Minicheva (2005) and Zaitzev and Mamaev (1997).
Overall Abundance and Distribution Patterns Within the 1966 Footprint
Derived values for percent cover of the habitat-forming Phyllophora spp. at each station sampled were plotted (Figures 6A,B) and overlaid on polygons digitised from the earliest available percent cover estimates for the ZPF (Kalugina and Lachko, 1966).
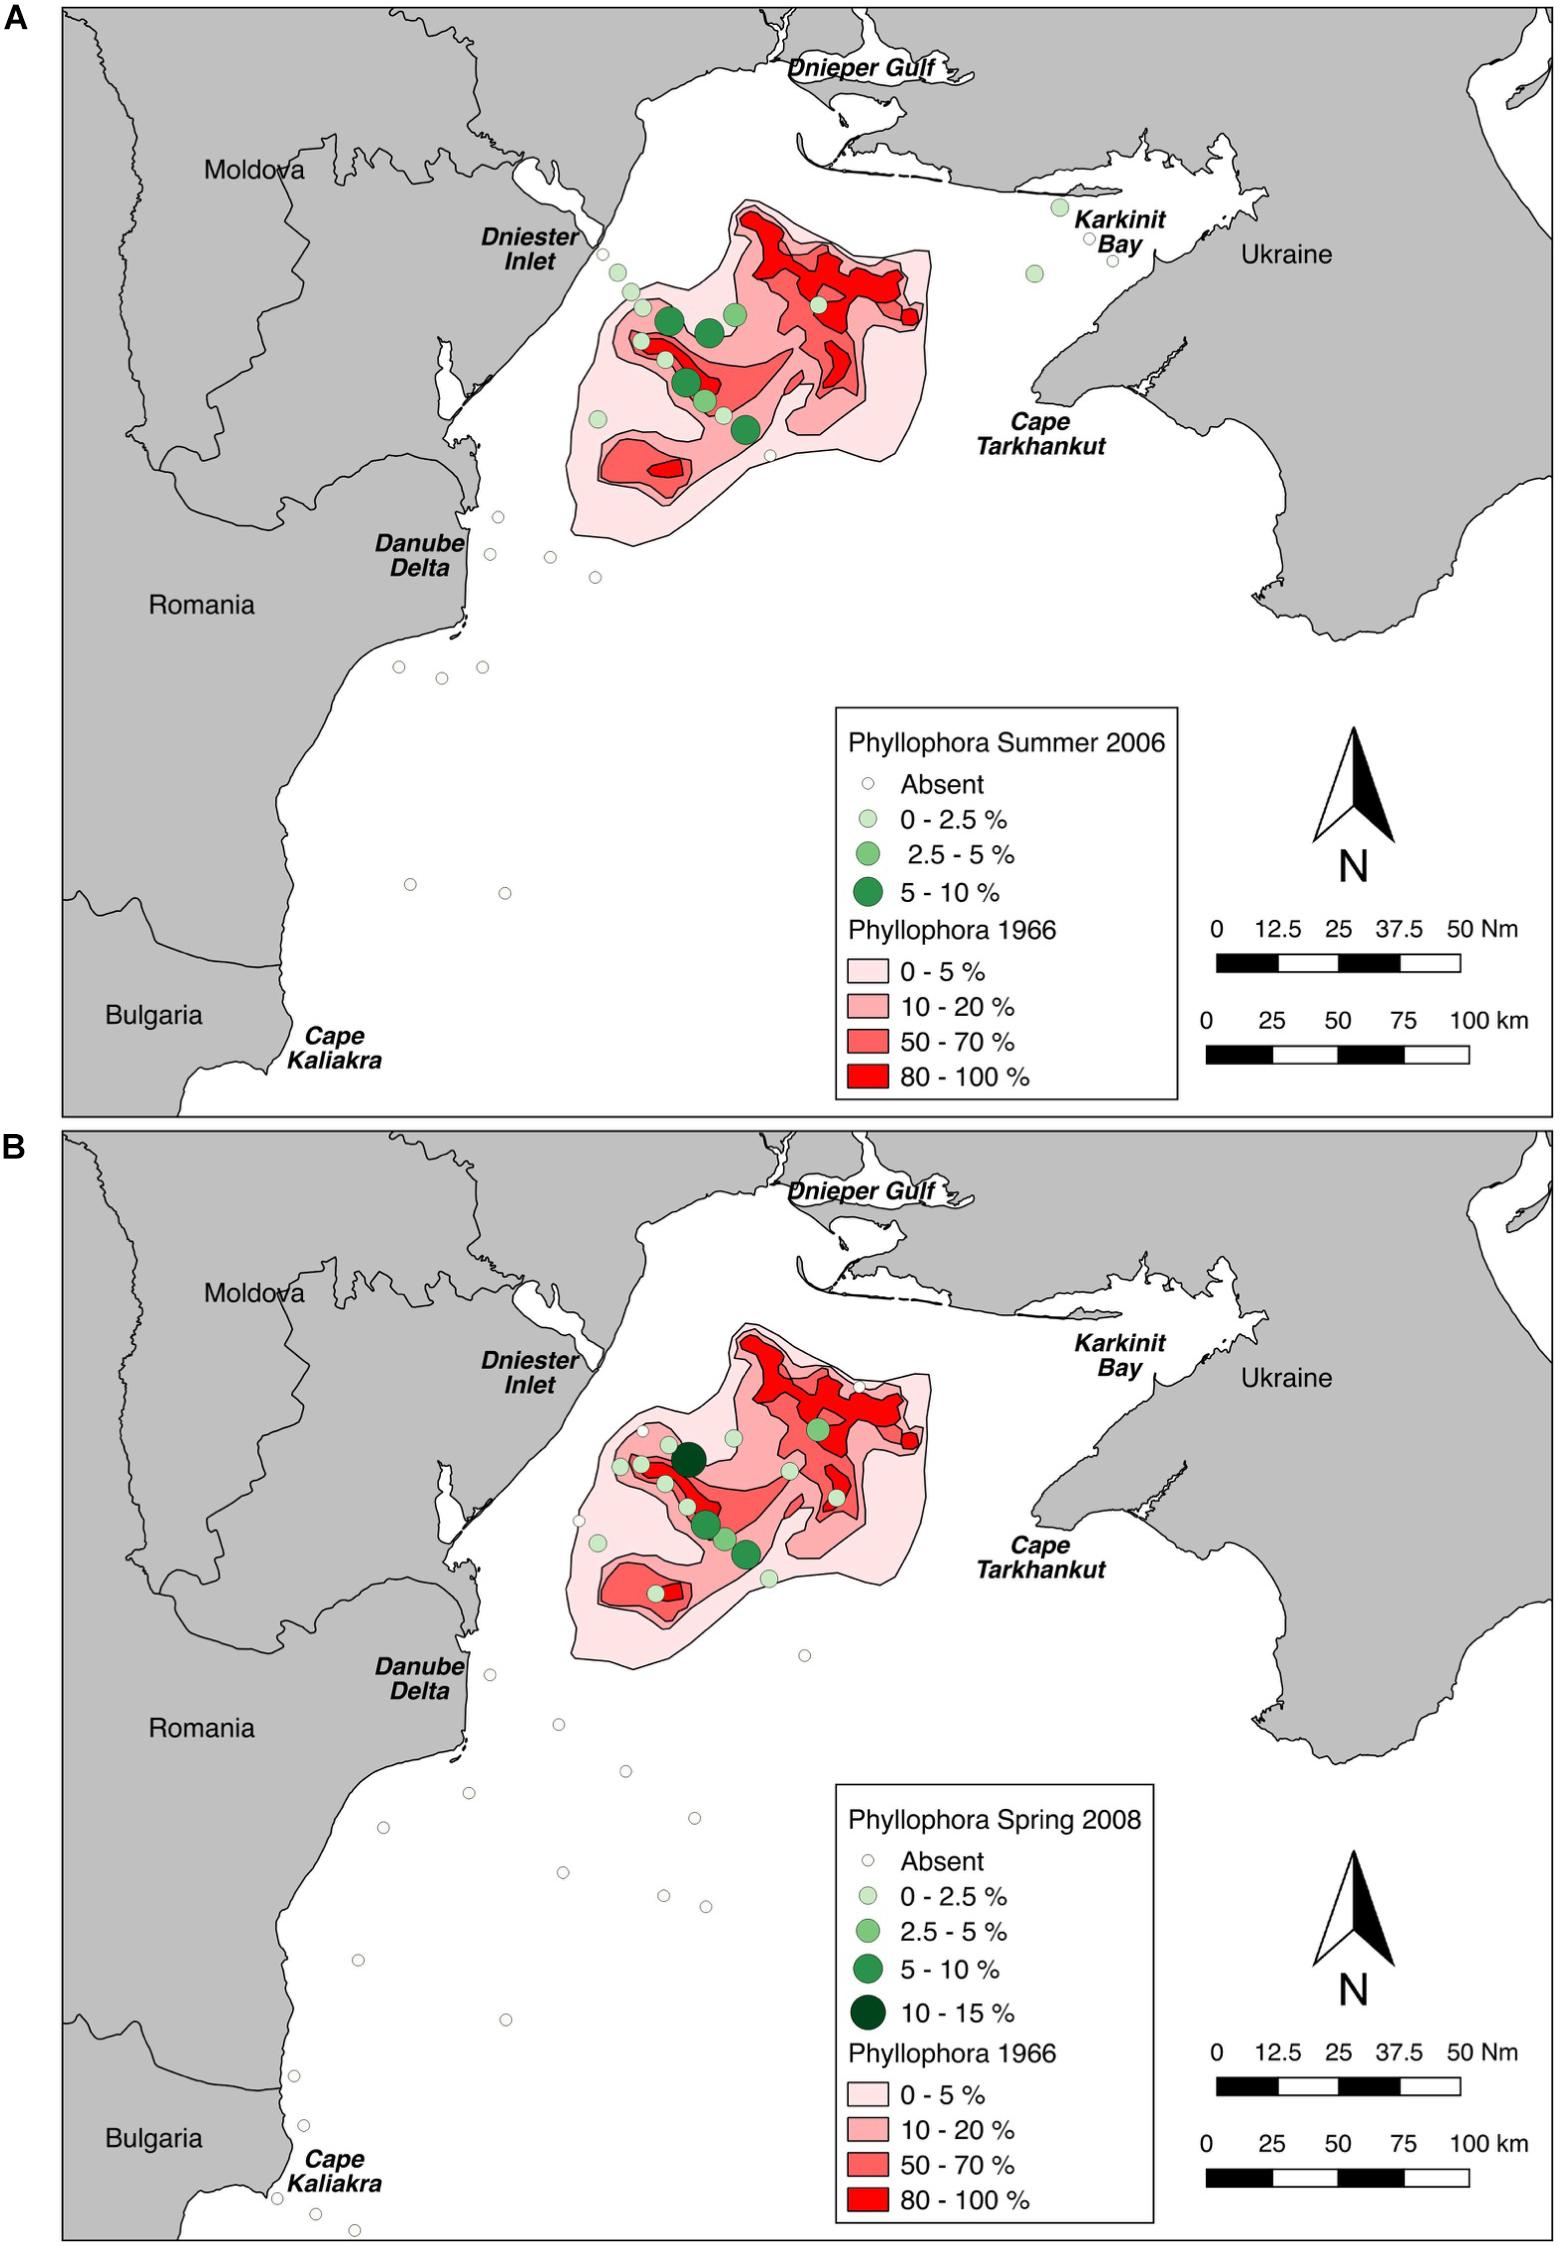
Figure 6. Sampled percent cover of Phyllophora spp. overlaid on percent cover class polygons from Kalugina and Lachko (1966). (A) Sampled percent cover in Summer 2006. (B) Sampled percent cover in Spring 2008.
Maximum cover at any station was 9% in Summer 2006 (Station D5), and 13.3% in Spring 2008 (Station PHY1), whereas Kalugina and Lachko (1966), and other contemporary accounts, noted extensive areas of 100% cover. Phyllophora spp. was not observed in continuous beds anywhere in this study, but only as isolated patches. Wilcoxon’s matched-pairs signed rank test showed that percent cover at the locations sampled in 2006 and 2008 was very significantly lower than in 1966 (2006: p = 0.016; 2008 and pooled years p < 0.001) (Figure 7). Although the percent cover values compared in this analysis were derived using different methods, the differences observed are so marked as to overcome any methodological bias.
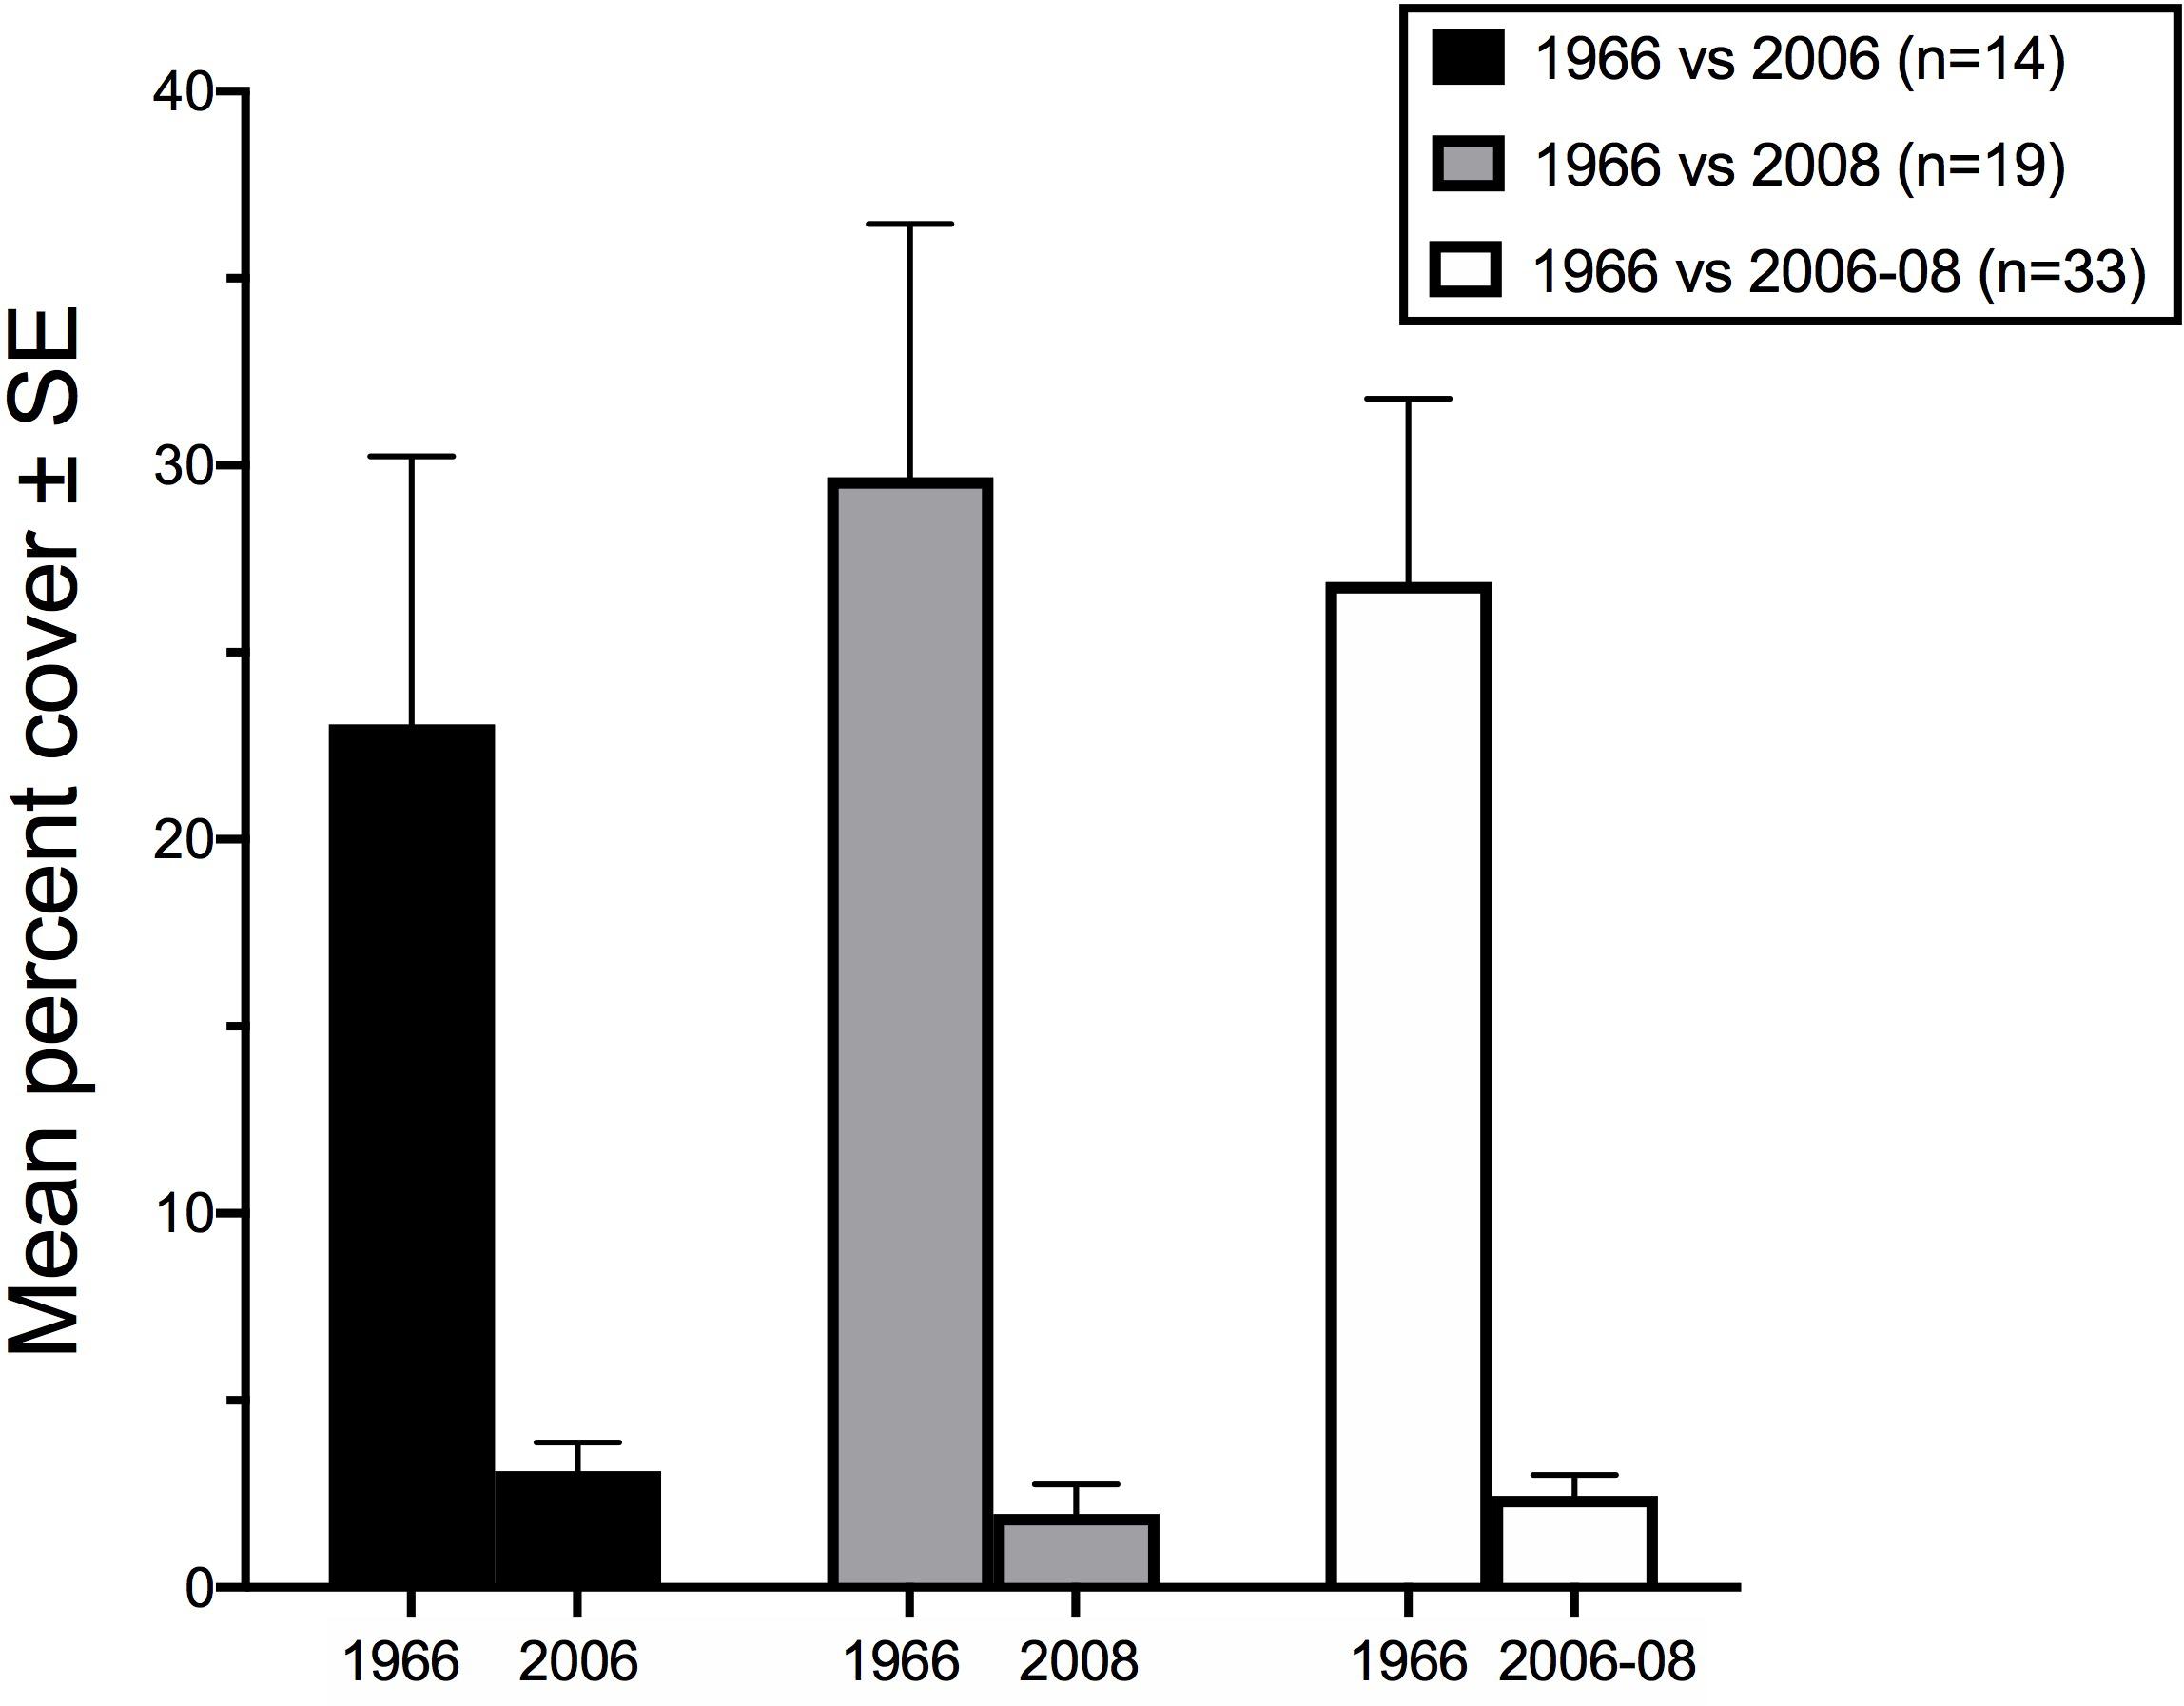
Figure 7. Mean percent cover of Phyllophora spp. compared to percent cover from Kalugina and Lachko (1966) at the points sampled in Summer 2006, Spring 2008 and for both periods combined. Values for 1966 derived from the lower value of the cover class at the sampled point. Number of points sampled in each case is given in the legend.
For each sample period, and for the pooled data from both years, correlation analyses were used to determine whether the pattern of higher and lower percent cover of Phyllophora in 2006–2008 corresponds to the 1966 pattern of percent cover. Spearman’s ranked correlations were not significant between 1966 and 2006 (n = 14, Spearman’s ρ = 0.310, p = 0.278), 2008 (n = 19, ρ = 0.283, p = 0.242), or the pooled dataset (n = 33, ρ = 0.218, p = 0.222). In other words, the pattern of Phyllophora percent cover within the historical footprint does not predict the sampled distributions sampled in 2006–2008. Since this analysis compares patterns of distribution (relatively greater or lesser percent cover), rather than absolute values, methodological bias in the estimation of percent cover is not considered a limitation here.
Macroalgal Abundance
Fourteen stations were common to the Summer 2006 and Spring 2008 surveys, and these permit comparisons of abundance of key components of the epibenthos between these two times. Twelve stations were within the former extent of the former ZPF, and analyses therefore focus on this important habitat-forming taxon, with opportunistic filamentous algae with which it is associated. Figures 8A,B show the percent cover of both filamentous algae and Phyllophora along a depth gradient for both sampling periods, corresponding to a cross-shelf transect through the former ZPF. Two key differences are evident. Firstly, there is a very clear overall difference between the percent cover of all macroalgae in 2006 compared to 2008 (Wilcoxon’s signed ranks test, z = −2.746, p = 0.006); secondly, this difference is much more marked in shallower water (<35 m) than in deeper waters. There is a distinct bimodal distribution of Phyllophora spp. with depth in the Summer 2006 survey (Figure 9), which is less evident in the Spring 2008 survey. We suggest growth of filamentous algae and Phyllophora may be seasonal in warmer shallow water during summer months, whereas in mesophotic depths (>35 m) Phyllophora is better able to cope with low light availability, and not subject to shading and overgrowth by these faster growing macroalgal forms. There is no overall difference in the percent cover of Phyllophora spp. between the two sampling periods (Wilcoxon’s signed ranks test, z = −1.373, p = 0.171).
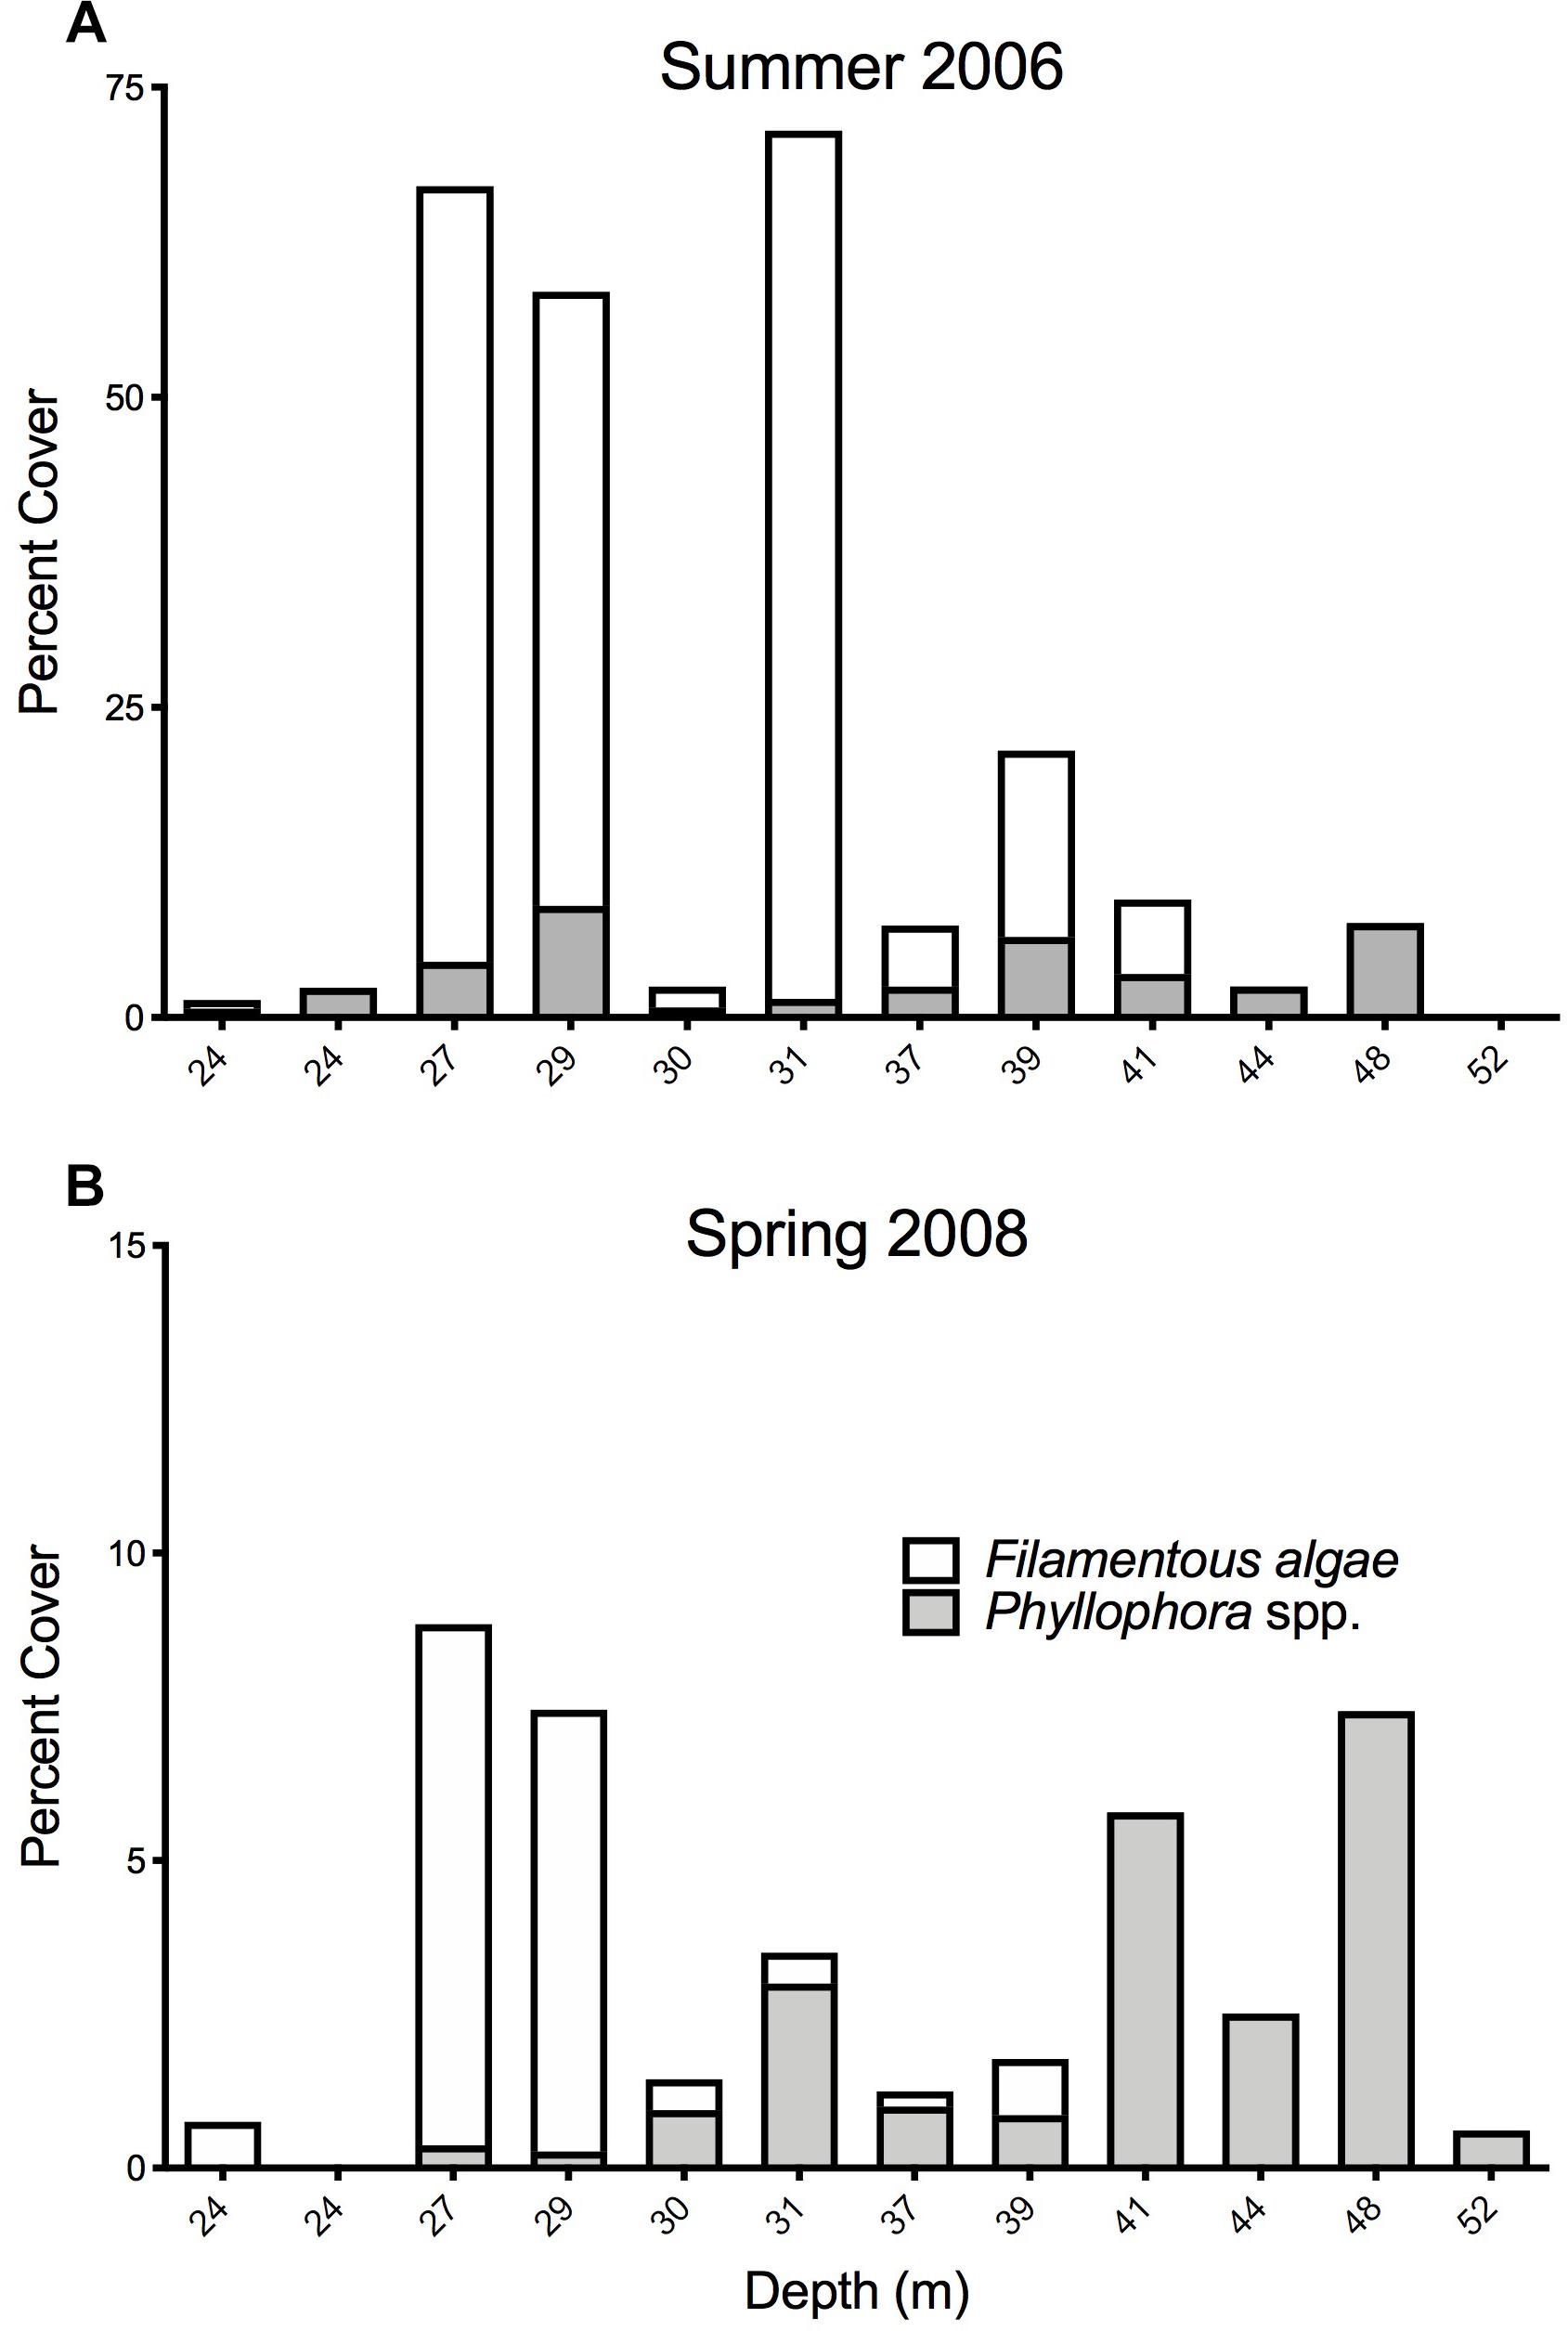
Figure 8. Percent cover of macroalgal forms at 12 stations representing a cross-shelf transect through Zernov’s Phyllophora field. Note that the scales of the Y-axes are different. (A) sampled percent cover of macroalgae in Summer 2006. (B) Sampled percent cover of macroalgae in Spring 2008.
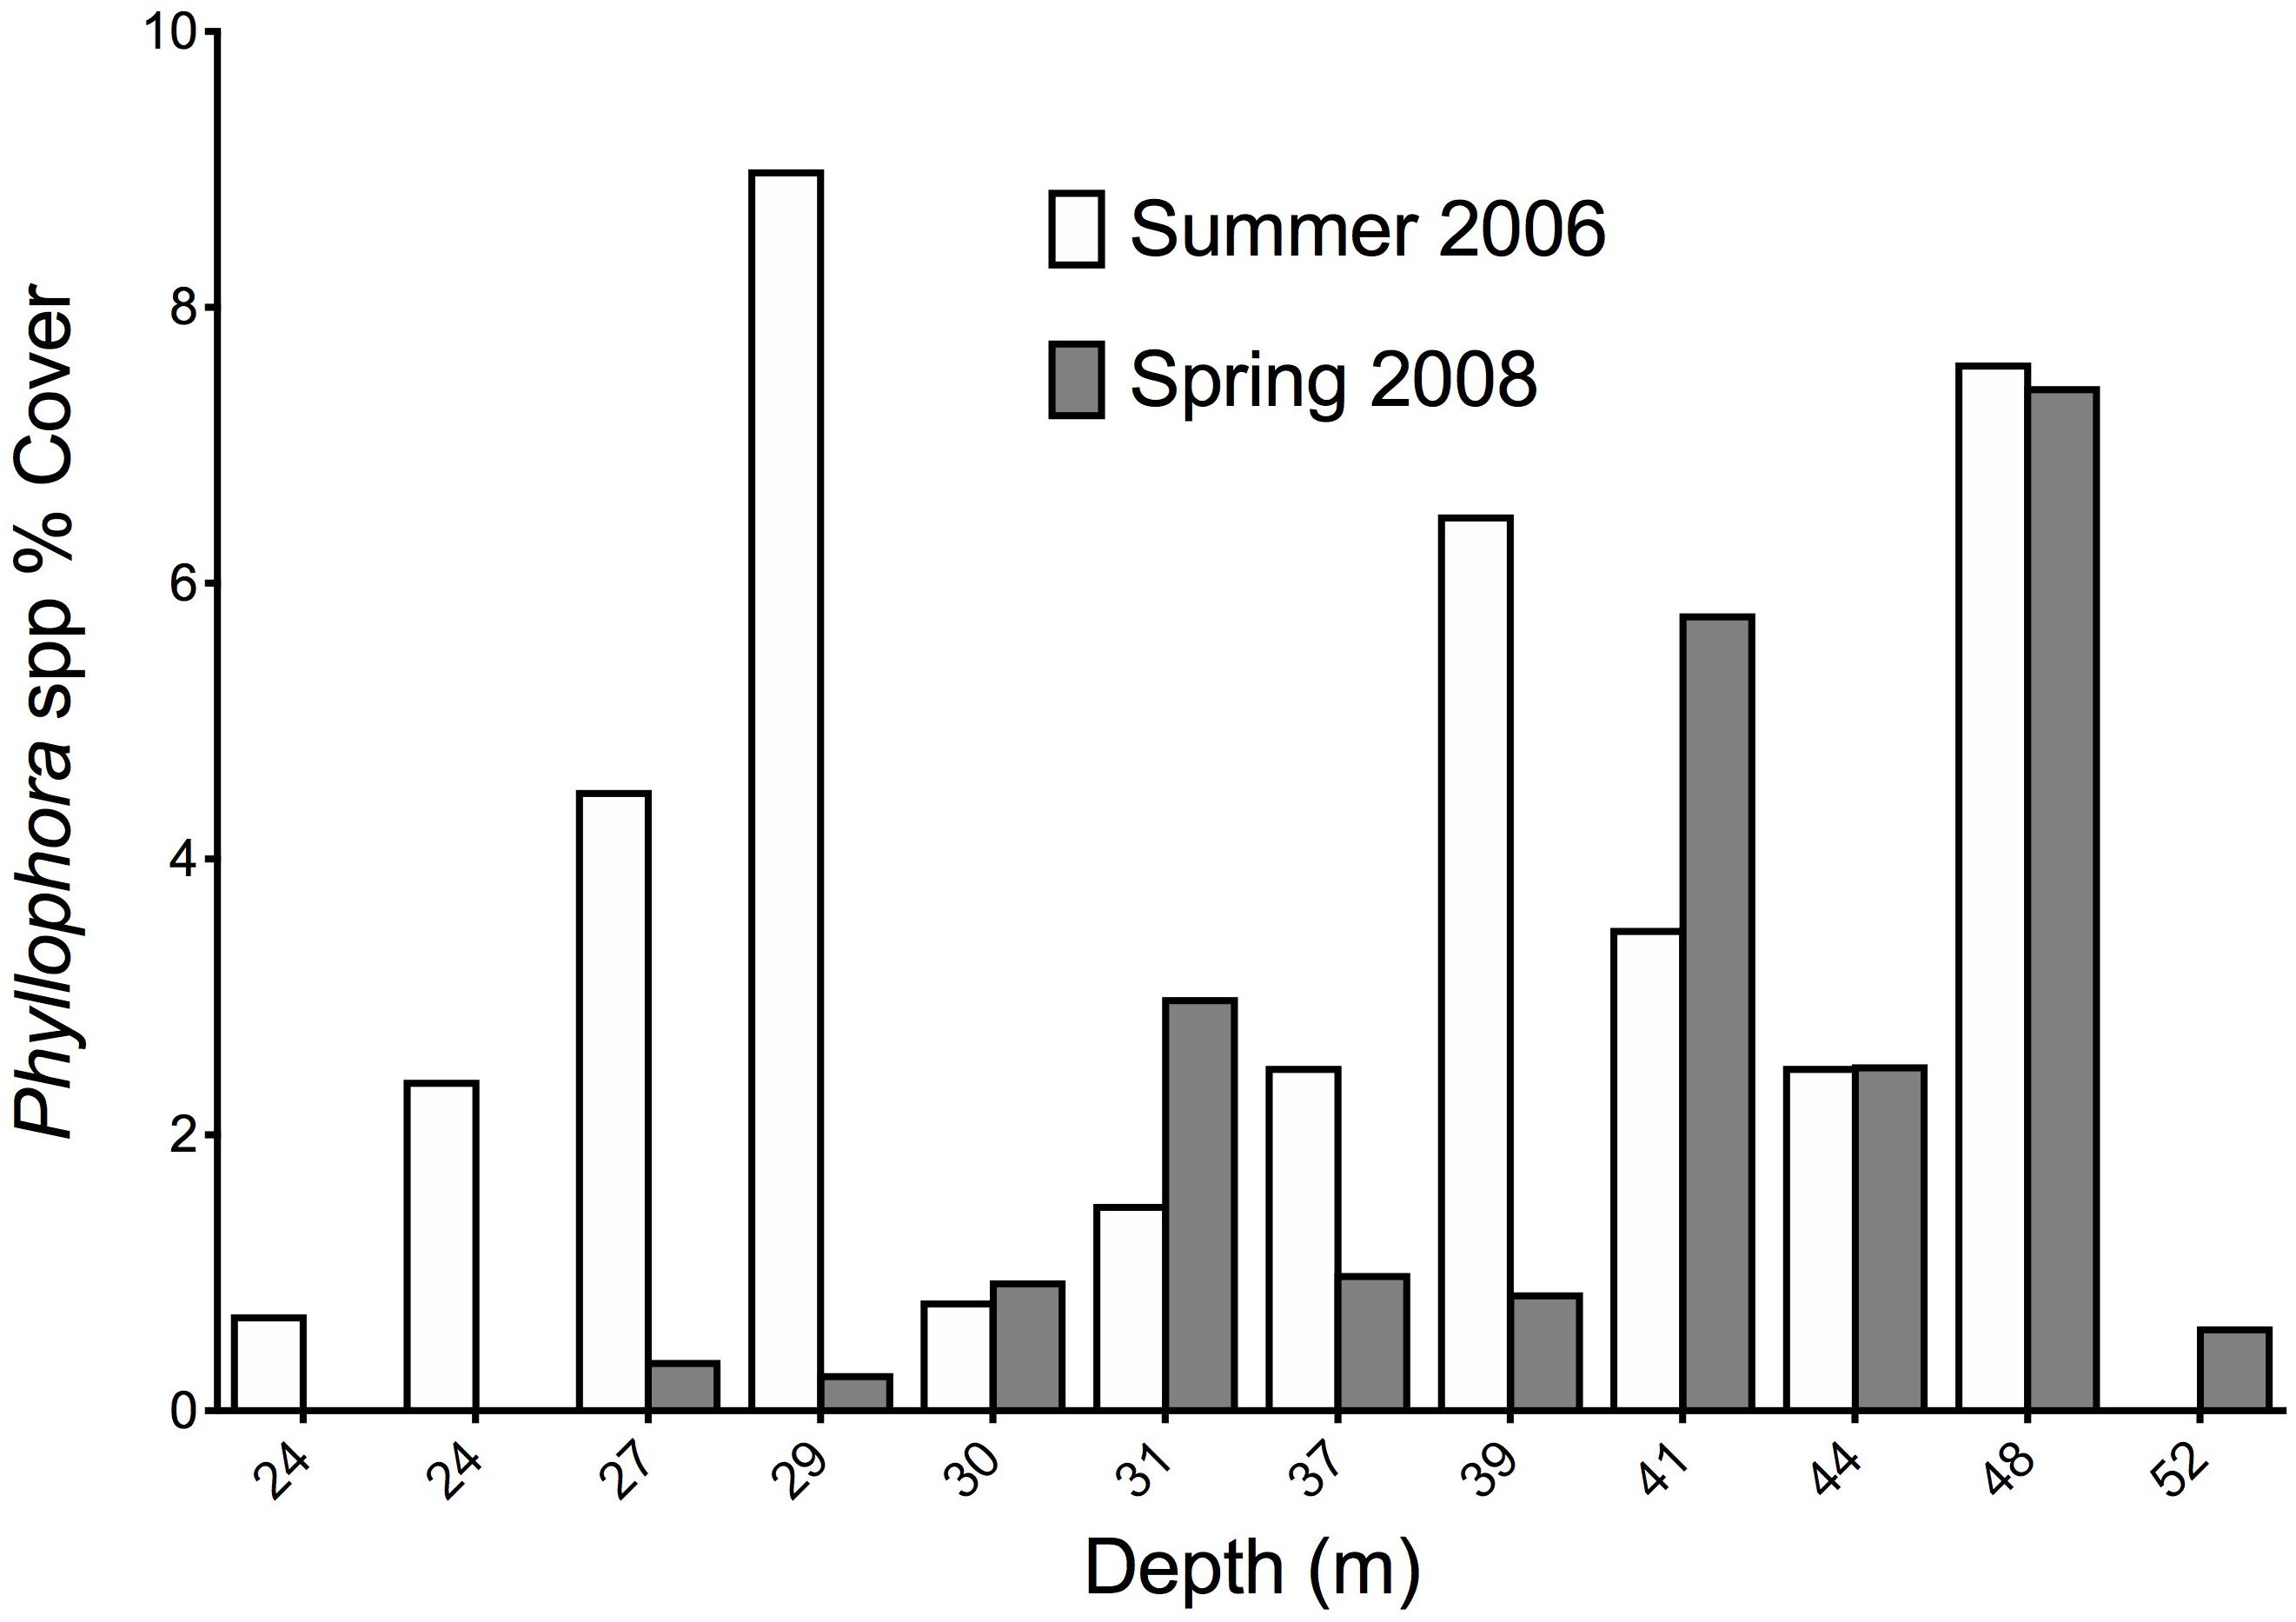
Figure 9. Percent cover of Phyllophora spp. at 12 stations representing a cross-shelf transect through Zernov’s Phyllophora field in Summer 2006 and Spring 2008.
Discussion
This study has illustrated that in 2006–2008 there were distinct and relatively diverse macro-epibenthic communities on the northwest shelf of the Black Sea, in contrast to the impoverished, or absent, macrobenthic biota in the dead zones of the 1980s and 1990s.
The derived communities were statistically distinct in both years; and relatively consistent between years, although there were some important differences. Inshore stations in both years, particularly near the Dniester Inlet and the Danube Delta, were dominated by bioturbating macrofauna, with only occasional clumps of live M. galloprovincialis. In deeper waters, the assemblage structure was dominated by varying combinations of bivalves (principally Mytilus), ascidians, algae and sponges. Critically, in the Summer 2006 surveys, the keystone Phyllophora spp., while present, did not play the primary structuring role in any derived assemblage, but contributed 14–17% to within-group similarity of the two Mytilus-dominated groups, which were otherwise distinguished by the very high (c.30%) contribution of ascidians in the Mytilus/Ascidians group. In both years, Phyllophora was present in detectable quantities in the area of the former Zernov’s Phyllophora field, and as part of species complexes including high densities of mussels Mytilus, acsidians Ciona intestinalis and other algae especially Polysiphonia spp. However, only in the Spring 2008 surveys, and in a quite constrained distribution of nine stations (Algae/Mytilus group) within a radius of c.44km, did Phyllophora appear as a structuring element of the macrobenthos. This is heartening, but short of its pre-eutrophication role as the major benthic biomass component and habitat engineer, as shown by the comparison between 1966 and 2006–2008 percent cover. While it is not possible to properly test for seasonal effects based on just two sampling periods, it is reasonable to infer that the observed differences in algal species dominance and cover may relate to seasonal differences in water temperature and light availability, which are more marked in shallower water. Certainly the dominance of Polysiphonia sp. and the filamentous algal complex in 2006, and not in 2008, suggests this relationship, perhaps facilitated by nutrient availability.
The key drivers for assemblage structure were substrate and depth, but consistently included distance from input sources and a small nutrient contribution (principally forms of N). The overgrowth of Phyllophora by faster growing filamentous algal forms in the Summer 2006 sampling event suggests that some nutrient enrichment, either from continuing inputs, or by diffusion across the sediment-water interface, remained important at the time of the surveys. Benthic nutrient flux was quantified at several stations (Friedrich et al., 2010), but not enough to be included in the BIOENV models.
Comparing the release of nutrients from the sediments measured in 2006 and 2008 to that in the 1990s (Friedrich et al., 2010) reveals there is little difference in the rate of release of ammonia, nitrate, phosphorus and silica between those times. This is an example of the sediment’s memory of eutrophication, whereby burial of organic matter from past eutrophication and its ongoing decomposition leads to continued release of dissolved nutrients for decades after eutrophication has ceased (Friedrich et al., 2010). In general, the highest nutrient release from the sediments was found inshore where eutrophication was heaviest, and decreases toward the outer shelf; for example, maximum flux of nitrogen (ammonia plus nitrate) from the sediments was found adjacent to the mouth of the Dniester at > 4 mmol m–2 d–1, but falling to <0.8 mmol m–2 d–1 at the deeper Phyllophora field stations in 2006 and 2008 (in situ and ex situ sediment incubations, Friedrich unpublished data).
The observed distribution of Phyllophora in 2006-08 provides clear evidence for recovery, in that it was co-located within its historical range. However, within that historical footprint, observed patterns of abundance (as percent cover) did not correlate with the available historical patterns (Kalugina and Lachko, 1966). Unsurprisingly, on the path to recovery, fast-growing opportunistic species may occupy newly formed niches; e.g., filamentous algae like Polysiphonia have hindered the recovery of macroalgae like Phyllophora by overgrowth, and ascidians such as C. intestinalis have replaced filter-feeding mussels (Friedrich et al., 2014). This 2006-08 data revealed a still fragile macrobenthic ecosystem that differed from the pre-eutrophication state, and remained susceptible to anthropogenic and environmental impacts. Clearly, recovery at that time was far from complete, in that percent cover of Phyllophora remained very low compared to pre-eutrophication values, and it was not present in parts of its former range. However, the relatively consistent cover of Phyllophora at depths greater than 35 m showed that it was re-establishing across its former depth range, and that in these deeper, more offshore areas it was less affected by residual nutrients than in the shallower inshore waters. This suggests that in 2006–2008, there remained capacity for further recovery, if ongoing pressures are removed or ameliorated; in particular, stringent measures to limit nutrient inputs should remain, with ongoing monitoring to determine trends in riverine nutrient discharge and sediment/water nutrient flux. This is particularly important in the context of modelling recovery trajectories. Modelling by Capet et al. (2013) suggested that frequency of bottom hypoxia has declined much less than other metrics for possible recovery (e.g., Langmead et al., 2009). This is further confirmed by high-resolution time-series observations of bottom water oxygen in an hypoxia-prone location on the shelf (Friedrich et al., 2014, 2017, 2019). This suggests that the recovery of Black Sea benthic biota subsequent to the reduction of nutrient load may not have been as rapid, or extensive, as suggested for the pelagic ecosystem (Kideys, 2002; Steckbauer et al., 2011). In contrast, Revkov et al. (2018), documented macrozoobenthos distribution and biomass via grab sampling in 2010–2013 (c. 5 years a fter this study) and noted species richness comparable to, or greater than, pre-eutrophication data, although this may in part be attributed to differing treatments of the samples. That study and the present one are not comparable in terms of methods (grabs versus video), taxonomic resolution or scope (macrozoobenthos versus epibenthos including algae); nonetheless they both point toward a recovery trend, while suggesting differing points along that continuum.
Recovery of large-scale (<1000 km2) dead zones elsewhere has been rarely, if ever, been documented. Of the two largest dead zones (Diaz et al., 2010), hypoxic conditions in the Baltic Sea over an area of >40,000 km2 have persisted since the 1960s (Carstensen et al., 2014), prompting calls for controversial “engineered” solutions (Conley, 2012). The extent of the dead zone in the northern Gulf of Mexico varies between about 5,000 and 20,000 km2 with catchment rainfall, and therefore river flow volumes (Diaz and Rosenberg, 2008), indicating a clear link with catchment-sourced nutrients (Boesch et al., 2009). In both cases there is no apparent recovery trend, despite seasonal variation and efforts to mitigate nutrient inputs (Rabotyagov et al., 2014). Elsewhere, dead zones continue to occur seasonally in hundreds of locations. Diaz et al. (2010) note measurable recovery in 55 previously hypoxic locations, including the Black Sea, but with that exception, these are all very small (mostly < 100 km2), and in most, periodic hypoxia still occurs. The meta-analysis by McCrackin et al. (2016) showed a huge variation in time to recovery of dead zones from less than a year to over a century, and emphasises the need for long-term studies to better understand recovery timescales, and assess the effectiveness of policy measures.
Conclusion
Set in this context, the signs of recovery in the northwest shelf of Black Sea, documented in this and other studies (Revkov et al., 2018; Samyshev and Zolotarev, 2018) although far from complete, are all the more remarkable. The recovery of this ecosystem after its earlier ecological collapse appeared, in 2006–2008, to be at a stage characterised by: slow recovery of Phyllophora abundance; a shift in benthic communities toward opportunistic species with short life cycles; and a shift in the baseline conditions relative to the situation prior to eutrophication (Friedrich et al., 2014). It is ironic that the observed turnaround in nutrient inputs to the Black Sea is in large part due to the collapse of the Soviet Union and the ensuing social and political restructuring of the region (Rabotyagov et al., 2014), rather than the co-ordinated actions of interested parties, as well as European Union regulations governing nutrient inputs via the Danube (Artioli et al., 2008). At present, the region faces significant geopolitical instability (Christakis, 2015; Hansen, 2015) and stark choices about the future use of the resources of the Black Sea and its catchments (Langmead et al., 2009; O’Higgins et al., 2014; Dungaciu, 2015). It is therefore critically important that the regional players, including the EU, recognise the progress that has been made, and continue to press for regional-scale agreements in areas such as nutrient inputs and fisheries management (O’Higgins et al., 2014), as well as a commitment to long-term studies (McCrackin et al., 2016). Encouraging progress has been made in the declaration of a marine reserve over a large proportion of Zernov’s Phyllopora field (Kostylev et al., 2010; Revkov et al., 2018), and the adoption of contemporary adaptive management approaches (Douvere and Ehler, 2011) by several of the Black Sea member states. However, predicted scenarios for the Black Sea ecosystem suggest significant declines (Akoglu et al., 2014b) if current policy settings are retained. The risk remains, especially if regional tensions around resource use are not resolved, of sliding into another of Hardin’s (1968) “tragedy of the commons.”
Dedication
In memory of our colleague, mentor, co-author, and dear friend Laurence Mee, who passed away during the preparation of this manuscript. Laurence Mee made an enormous contribution to the understanding and management of our oceans; he is sorely missed.
Data Availability
The datasets generated for this study are available on request to the corresponding author.
Author Contributions
TS conducted and analysed the video tows, performed most of the analyses, and prepared the text and figures. LM was the cruise leader in 2006, and provided data on historical trends on the Dead Zone. JF was the cruise leader in 2008, and provided data on waterbody variables and sediment geochemistry. DA provided data on oceanography of the Black Sea shelf. GM provided data and expertise on Ecology of Phyllophora and other algae in the Black Sea, and historical maps of Phyllophora distribution. All authors contributed to the editorial process.
Funding
The study was funded by the UN’s Black Sea Ecosystem Recovery Project (BSERP). Additional funding was provided by the Helmholtz Center for Polar and Marine Research, Alfred Wegener Institute.
Conflict of Interest Statement
The authors declare that the research was conducted in the absence of any commercial or financial relationships that could be construed as a potential conflict of interest.
Acknowledgments
We thank the captains and crews of RV “Akademik” and RV “Poseidon” for their patience and assistance in the field. We are grateful to colleagues from Griffith University, The Marine Institute, AWI, SAMS, IMB NASU, and GeoEcoMar for productive discussions and feedback on drafts of this paper, especially Marian-Traian Gomoiu and Adrian Teaca.
Supplementary Material
The Supplementary Material for this article can be found online at: https://www.frontiersin.org/articles/10.3389/fmars.2019.00474/full#supplementary-material
Footnotes
References
Akoglu, E., Salihoglu, B., Libralato, S., Oguz, T., and Solidoro, C. (2014a). An indicator-based evaluation of Black Sea food web dynamics during 1960-2000. J. Mar. Syst. 134, 113–125. doi: 10.1016/j.jmarsys.2014.02.010
Akoglu, E., Salihoglu, B., Salihoglu, B. F., Libralato, S., Cannaby, H., Oguz, T., et al. (2014b). Changes in the ecosystem structure of the Black Sea under predicted climatological and anthropogenic variations. Geophys. Res. Abstr. 16:EGU2014–EGU15351.
Aleynik, D., Friedrich, J., Mee, L., and Shapiro, G. (2019). Physical oceanography during POSEIDON cruise POS363 in March 2008 in Black Sea. PANGAEA. doi: 10.1594/PANGAEA.902968
Anderson, M. J. (2001). A new method for non-parametric multivariate analysis of variance. Austral Ecol. 26, 32–46. doi: 10.1111/j.1442-9993.2001.01070.pp.x
Anderson, M. J., Gorley, R. N., and Clarke, K. R. (2007). PERMANOVA+ for Primer: Guide to Software and Statistical Methods. Plymouth: PRIMER-E.
Artioli, Y., Friedrich, J., Gilbert, A. J., McQuatters-Gollop, A., Mee, L. D., Vermaat, J. E., et al. (2008). Nutrient budgets for European seas: a measure of the effectiveness of nutrient reduction policies. Mar. Pollut. Bull. 56, 1609–1617. doi: 10.1016/j.marpolbul.2008.05.027
Barker, B. A. J., Helmond, J. I, Bax, N., Williams, A., Davenport, S., and Wadley, V. A. (1999). A vessel-towed camera platform for surveying seafloor habitats of the continental shelf. Cont. Shelf Res. 19, 1161–1170. doi: 10.1016/s0278-4343(99)00017-5
Boesch, D. F., Boynton, W. R., Crowder, L. B., Diaz, R. J., Howarth, R. W., Mee, L. D., et al. (2009). Nutrient enrichment drives Gulf of Mexico Hypoxia. Eos Trans. Am. Geophys. Union 90, 117–118. doi: 10.1029/2009eo140001
Cánovas-Molina, A., Montefalcone, M., Bavestrello, G., Cau, A., Bianchi, C. N., Morri, C., et al. (2016). A new ecological index for the status of mesophotic megabenthic assemblages in the mediterranean based on ROV photography and video footage. Cont. Shelf Res. 121, 13–20. doi: 10.1016/j.csr.2016.01.008
Capet, A., Beckers, J. M., and Grégoire, M. (2013). Drivers, mechanisms and long-term variability of seasonal hypoxia on the Black Sea northwestern shelf – is there any recovery after eutrophication? Biogeosciences 10, 3943–3962. doi: 10.5194/bg-10-3943-2013
Carstensen, J., Andersen, J. H., Gustafsson, B. G., and Conley, D. J. (2014). Deoxygenation of the Baltic Sea during the last century. Proc. Natl. Acad. Sci. U.S.A. 111, 5628–5633. doi: 10.1073/pnas.1323156111
Christakis, T. (2015). Self-Determination, Territorial Integrity and Fait Accompli in the Case of Crimea. ZaoRV/Heidelberg J. Int. Law 75, 75–100.
Clarke, K. R., and Warwick, R. M. (2001). Change in Marine Communities: An Approach to Statistical Analysis and Interpretation, 2nd Edn. Plymouth: PRIMER-E.
Daskalov, G. M. (2002). Overfishing drives a trophic cascade in the Black Sea. Mar. Ecol. Prog. Ser. 225, 53–63. doi: 10.3354/meps225053
Diaz, R., Selman, M., and Chique-Canache, C. (2010). Global Eutrophic and Hypoxic Coastal Systems: Eutrophication and Hypoxia–Nutrient Pollution in Coastal Waters. Washington, DC: World Resources Institute.
Diaz, R. J., and Rosenberg, R. (2008). Spreading dead zones and consequences for marine ecosystems. Science 321, 926–929. doi: 10.1126/science.1156401
Douvere, F., and Ehler, C. (2011). The importance of monitoring and evaluation in adaptive maritime spatial planning. J. Coast. Conserv. 15, 305–311. doi: 10.1007/s11852-010-0100-9
Dungaciu, D. (2015). “Geopolitics and security by the Black Sea: The strategic options of Romania and Republic of Moldova,” in Geopolitics, Development, and National Security, eds S. Vaduva and A. R. Thomas (Basel: Springer International Publishing), 23–51. doi: 10.1007/978-3-319-12685-2_2
Enrichetti, F., Bo, M., Morri, C., Montefalcone, M., Toma, M., Bavestrello, G., et al. (2019). Assessing the environmental status of temperate mesophotic reefs: a new, integrated methodological approach. Ecol. Indic. 102, 218–229. doi: 10.1016/j.ecolind.2019.02.028
Fillmann, G., Readman, J. W., Tolosa, I., Bartocci, J., Villeneuve, J. P., Cattini, C., et al. (2002). Persistent organochlorine residues in sediments from the Black Sea. Mar. Pollut. Bull. 44, 122–133. doi: 10.1016/s0025-326x(01)00188-6
Friedl, G., Dinkel, C., and Wehrli, B. (1998). Benthic fluxes of nutrients in the northwestern Black Sea. Mar. Chem. 62, 77–88. doi: 10.1016/s0304-4203(98)00029-2
Friedrich, J., Balan, S., van Beusekom, J. E., Naderipour, C., and Secrieru, D. (2017). “Seasonal seafloor oxygen dynamics on the Romanian Black Sea Shelf,” in Proceedings of the 19th EGU General Assembly Conference, (Vienna), 2845.
Friedrich, J., Cociasu, A., and Mee, L. D. (2010). Historical legacy of Danube River nutrient discharge and eutrophication in the North-Western Black Sea – Nutrient recycling in the shelf sediments. Danube News 12, 7–9.
Friedrich, J., Dinkel, C., Friedl, G., Pimenov, N., Wijsman, J., Gomoiu, M. T., et al. (2002). Benthic nutrient cycling and diagenetic pathways in the north-western Black Sea. Estuar. Coast. Shelf Sci. 54, 369–383. doi: 10.1006/ecss.2000.0653
Friedrich, J., Janssen, F., Aleynik, D., Bange, H. W., Boltacheva, N., Çagatay, M. N., et al. (2014). Investigating hypoxia in aquatic environments: diverse approaches to addressing a complex phenomenon. Biogeosciences 11, 1215–1259. doi: 10.5194/bg-11-1215-2014
Friedrich, J., Mee, L., Eulenburg, A., and Minicheva, G. (2015a). Nutrients in the Water (Dissolved Inorganic and Organic forms, Particle-Bound Forms) of the Western Black Sea Shelf During POSEIDON Cruise POS363 in March 2008. PANGAEA: Helmholtz-Zentrum Geesthacht Centre for Materials and Coastal Research.
Friedrich, J., Mee, L., Eulenburg, A., and Minicheva, G. (2015b). Water Transparency Measurements with a Secchi Disc at CTD Stations during POSEIDON Cruise POS363 in March 2008. PANGAEA: Helmholtz-Zentrum Geesthacht Centre for Materials and Coastal Research.
Friedrich, J., Van Beusekom, J. E. E., Naderipour, C., Balan, S., Radulescu, V., and Secrieru, D. (2019). River-born and climate drivers of hypoxia on the NW Black Sea Shelf. Geophys. Res. Abstr. 21:16147.
Gregoire, M., and Friedrich, J. (2004). Nitrogen budget of the northwestern Black Sea shelf inferred from modeling studies and in situ benthic measurements. Mar. Ecol. Prog. Ser. 270, 15–39. doi: 10.3354/meps270015
Hansen, F. S. (2015). Framing yourself into a corner: Russia, Crimea, and the minimal action space. Eur. Secur. 24, 141–158. doi: 10.1080/09662839.2014.993974
Jessen, G. L., Lichtschlag, A., Ramette, A., Pantoja, S., Rossel, P. E., Schubert, C. J., et al. (2017). Hypoxia causes preservation of labile organic matter and changes seafloor microbial community composition (Black Sea). Sci. Adv. 3:e1601897. doi: 10.1126/sciadv.1601897
Kalugina, A. A., and Lachko, O. A. (1966). Composition, Distribution and Stock of the Black Sea’s Seaweeds in the Region of Zernov’s Phyllophora Field. Benthic Distribution and Biology of Benthic Animals in the Southern Seas. Kiev: Naukoova Dumka, 28–42.
Kideys, A. E. (2002). Fall and rise of the Black Sea ecosystem. Science 297, 1482–1484. doi: 10.1126/science.1073002
Konovalov, S. K., and Murray, J. W. (2001). Variations in the chemistry of the Black Sea on a time scale of decades (1960-1995). J. Mar. Syst. 31, 217–243. doi: 10.1016/s0924-7963(01)00054-9
Kostylev, E. F., Tkachenko, F. P., and Tretiak, I. P. (2010). Establishment of “Zernov’s Phyllophora field” marine reserve: protection and restoration of a unique ecosystem. Ocean Coast. Manag. 53, 203–208. doi: 10.1016/j.ocecoaman.2010.04.010
Langmead, O., McQuatters-Gollop, A., Mee, L. D., Friedrich, J., Gilbert, A. J., Gomoiu, M. T., et al. (2009). Recovery or decline of the northwestern Black Sea: a societal choice revealed by socio-ecological modelling. Ecol. Model. 220, 2927–2939. doi: 10.1016/j.ecolmodel.2008.09.011
McCrackin, M. L., Jones, H. P., Jones, P. C., and Moreno-Mateos, D. (2016). Recovery of lakes and coastal marine ecosystems from eutrophication: a global meta-analysis. Limnol. Oceanogr. 62, 507–518. doi: 10.1002/lno.10441
Mee, L. D. (1992). The Black-Sea in Crisis - a need for concerted international action. AMBIO 21, 278–286.
Mee, L. D. (2005). “Assessment and monitoring requirements for the adaptive management of Europe’s regional seas,” in Managing European Coasts: Past, Present and Future, eds J. Vermaat, W. Salomons, L. Bouwer, and K. Turner (Berlin227: Springer), </UBLOC>–237.
Mee, L. D., Friedrich, J., and Gomoiu, M. T. (2005). Restoring the Black Sea in times of uncertainty. Oceanography 18, 100–111. doi: 10.5670/oceanog.2005.45
Michaelis, R., Hass, H. C., Mielck, F., Papenmeier, S., Sander, L., Ebbe, B., et al. (2019). Hard-substrate habitats in the German Bight (South-Eastern North Sea) observed using drift videos. J. Sea Res. 144, 78–84. doi: 10.1016/j.seares.2018.11.009
Michaylov, B. N., and Mashtakova, G. P. (1966). Boundary distribution of Phyllophora of the Black Sea. Fish Ind. 5, 12–13.
Minicheva, G. (2005). Historical Trends in Benthic Communities of the North-Werstern Shelf of the Black Sea. Odessa: Odessa Branch Institute Biology of Southern Seas of National Academy of Sciences of Ukraine.
Minicheva, G. G. (2007). Contemporary morpho-functional transformation of seaweed communities of the Zernov phyllophora field (Black Sea). Int. J. Algae 9, 1–21. doi: 10.1615/interjalgae.v10.i10.10
Minicheva, G. G. (2015). New invader in the Black Sea: kelp chorda tomentosa Lyngb. Int. J. Algae 17, 219–224. doi: 10.1615/interjalgae.v17.i3.30
Minicheva, G. G., Bolshakov, V. N., Kalashnik, E. S., Zotov, A. B., and Marinets, A. V. (2018). Assessment of the reactions of algal communities to influence of climatic factors in the North-Western Black Sea ecosystem. Int. J. Algae 20, 121–134. doi: 10.1615/interjalgae.v20.i2.20
Minicheva, G. G., Tuchkovenko, Y. S., Bolshakov, V., Zotov, A. B., and Rusnak, E. (2013). Responses of algal communities of the North-Western Black Sea to the impact of local, regional, and global factors. Int. J. Algae 15, 164–179. doi: 10.1615/interjalgae.v15.i2.50
Oguz, T., and Gilbert, D. (2007). Abrupt transitions of the top-down controlled Black Sea pelagic ecosystem during 1960–2000: evidence for regime-shifts under strong fishery exploitation and nutrient enrichment modulated by climate-induced variations. Deep Sea Res. Part I Oceanogr. Res. Pap. 54, 220–242. doi: 10.1016/j.dsr.2006.09.010
Oguz, T., and Velikova, V. (2010). Abrupt transition of the northwestern Black Sea shelf ecosystem from a eutrophic to an alternative pristine state. Mar. Ecol. Prog. Ser. 405, 231–242. doi: 10.3354/meps08538
O’Higgins, T., Farmer, A., Daskalov, G., Knudsen, S., and Mee, L. (2014). Achieving good environmental status in the Black Sea: scale mismatches in environmental management. Ecol. Soc. 19:54.
Pakhomova, S., Chelysheva, M., and Yakushev, E. (2008). “Hydrochemical studies in R/V “Akademik” cruise, July 25 – August 04, 2006,” in Proceedings of the Black Sea Climate Change BS-HOT 2008 Conference and 2nd Biannual and Black Sea SCENE EC Project Joint Conference ”Climate Change in the Black Sea: Hypothesis, Observations, Trends, Scenarios and Mitigation Strategy fro the Ecosystem, (Sofia), 23.
Rabotyagov, S. S., Kling, C. L., Gassman, P. W., Rabalais, N. N., and Turner, R. E. (2014). The economics of dead zones: causes, impacts, policy challenges, and a model of the Gulf of Mexico Hypoxic Zone. Rev. Environ. Econ. Policy 8, 58–79. doi: 10.1093/reep/ret024
Readman, J. W., Fillmann, G., Tolosa, I., Bartocci, J., Villeneuve, J. P., Catinni, C., et al. (2002). Petroleum and PAH contamination of the Black Sea. Mar. Pollut. Bull. 44, 48–62. doi: 10.1016/s0025-326x(01)00189-8
Revkov, N. K., Boltacheva, N. A., Timofeev, V. A., Bondarev, I. P., and Bondarenko, L. V. (2018). Macrozoobenthos of the Zernov’s Phyllophora Field, northwestern Black Sea: species richness, quantitative representation and long-term variations. Nat. Conserv. Res. 3, 32–43.
Samyshev, E. Z., and Zolotarev, P. N. (2018). Pattern of Anthropogenic Impact on Benthos and Structure of Bottom Biocenoses in the North-West Part of the Black Sea. Sevastopol: Kovalevsky Institute of Marine Biological Research of RAS, 208.
Schapova, T. F. (1954). “Phyllophora of the Black Sea,” in Proceedings of the Intsitute of Oceanology, (Moscow: Academy of Sciences of USSR publishing house), 3–35.
Shapiro, G. I., Aleynik, D. L., and Mee, L. D. (2010). Long term trends in the sea surface temperature of the Black Sea. Ocean Sci. 6, 491–501. doi: 10.5194/os-6-491-2010
Shapiro, G. I., Wobus, F., and Aleynik, D. L. (2011). Seasonal and inter-annual temperature variability in the bottom waters over the western Black Sea shelf. Ocean Sci. 7, 585–596. doi: 10.5194/os-7-585-2011
Sheehan, E. V., Stevens, T. F., and Attrill, M. J. (2010). A Quantitative, non-destructive methodology for habitat characterisation and benthic monitoring at offshore renewable energy developments. PLoS One 5:e14461. doi: 10.1371/journal.pone.0014461
Sheehan, E. V., Stevens, T. F., Gall, S. C., Cousens, S. L., and Attrill, M. J. (2013). Recovery of a temperate reef assemblage in a marine protected area following the exclusion of towed demersal fishing. PLoS One 8:e83883. doi: 10.1371/journal.pone.0083883
Shiganova, T. A. (1998). Invasion of the Black Sea by the ctenophore Mnemiopsis leidyi and recent changes in pelagic community structure. Fish. Oceanogr. 7, 305–310. doi: 10.1046/j.1365-2419.1998.00080.x
Shiganova, T. A., Alekseenko, E., Lidia, M., and Paul, N. (2018). Modelling assessment of interactions in the Black Sea of the invasive ctenophores Mnemiopsis leidyi and Beroe ovata. Ecol. Model. 376, 1–14. doi: 10.1016/j.ecolmodel.2018.02.008
Shiganova, T. A., Mirzoyan, Z. A., Studenikina, E. A., Volovik, S. P., Siokou-Frangou, I., Zervoudaki, S., et al. (2001). Population development of the invader ctenophore Mnemiopsis leidyi, in the Black Sea and in other seas of the Mediterranean basin. Mar. Biol. 139, 431–445. doi: 10.1007/s002270100554
Shiganova, T. A., Musaeva, E. I., Bulgakova, Y. V., Mirzoyan, Z. A., and Martynyuk, M. L. (2003). Invaders ctenophores Mnemiopsis leidyi (A. Agassiz) and Beroe ovata Mayer 1912, and their influence on the pelagic ecosystem of northeastern Black Sea. Biol. Bull. 30, 180–190. doi: 10.3389/fmicb.2015.01427
Siokou-Frangou, I., Shiganova, T., Christou, E. D., Kamburska, L., Gubanova, A., Konsulov, A., et al. (2004). Mesozooplankton communities in the Aegean and Black Seas: a comparative study. Mar. Biol. 144, 1111–1126. doi: 10.1007/s00227-003-1277-3
Sorokin, Y. I. (2002). The Black Sea: Ecology and Oceanography. Leiden, NL: Backhuys Publishers, 875.
Steckbauer, A., Duarte, C. M., Carstensen, J., Vaquer-Sunyer, R., and Conley, D. J. (2011). Ecosystem impacts of hypoxia: thresholds of hypoxia and pathways to recovery. Environ. Res. Lett. 6, 1–12.
Stevens, T., and Connolly, R. M. (2005). Local-scale mapping of benthic habitats to assess representation in a marine protected area. Mar. Freshw. Res. 56, 111–123.
Stevens, T. F., Sheehan, E. V., Gall, S. C., Fowell, S. C., and Attrill, M. J. (2014). Monitoring benthic biodiversity restoration in Lyme Bay marine protected area: design, sampling and analysis. Mar. Policy 45, 310–317. doi: 10.1016/j.marpol.2013.09.006
Todorova, N., Alyomov, S. V., Chiotoroiu, B. C., Fach, B., Osadchaya, T. S., Rangelov, M., et al. (2019). “Chapter 8 - Black Sea,” in World Seas: an Environmental Evaluation, 2nd Edn, ed. C. Sheppard (Cambridge, MA: Academic Press), 209–226.
Wijsman, J. W. M., Herman, P. M. J., and Gomoiu, M. T. (1999). Spatial distribution in sediment characteristics and benthic activity on the northwestern Black Sea shelf. Mar. Ecol. Prog. Ser. 181, 25–39. doi: 10.3354/meps181025
Zaitsev, Y. P. (1992). Recent changes in the trophic structure of the Black Sea. Fish. Oceanogr. 1, 180–198. doi: 10.1098/rsbl.2012.0474
Zaitzev, Y. P., and Mamaev, V. O. (1997). “Biological diversity in the Black Sea: a study of change and decline,” in Black Sea Envrironmental Series, Vol. 3, ed. V. O. Mamaev (New York, NY: United Nations), 208.
Keywords: macro-epibenthos, Black Sea, Phyllophora, towed video, dead zone, ecosystem recovery
Citation: Stevens T, Mee L, Friedrich J, Aleynik D and Minicheva G (2019) Partial Recovery of Macro-Epibenthic Assemblages on the North-West Shelf of the Black Sea. Front. Mar. Sci. 6:474. doi: 10.3389/fmars.2019.00474
Received: 08 May 2019; Accepted: 12 July 2019;
Published: 31 July 2019.
Edited by:
Romuald Lipcius, College of William & Mary, United StatesReviewed by:
Levent Bat, Sinop University, TurkeyPeter M. J. Herman, Delft University of Technology, Netherlands
Copyright © 2019 Stevens, Mee, Friedrich, Aleynik and Minicheva. This is an open-access article distributed under the terms of the Creative Commons Attribution License (CC BY). The use, distribution or reproduction in other forums is permitted, provided the original author(s) and the copyright owner(s) are credited and that the original publication in this journal is cited, in accordance with accepted academic practice. No use, distribution or reproduction is permitted which does not comply with these terms.
*Correspondence: Tim Stevens, t.stevens@griffith.edu.au
 Tim Stevens
 Laurence Mee2,3
  Jana Friedrich
 Dmitry Aleynik
 Galina Minicheva