Pelagic Ecosystem Characteristics Across the Atlantic Water Boundary Current From Rijpfjorden, Svalbard, to the Arctic Ocean During Summer (2010–2014)
 Haakon Hop1,2*
  Philipp Assmy1
  Anette Wold1 Arild Sundfjord1
  Malin Daase2
  Pedro Duarte1 Slawomir Kwasniewski3 Marta Gluchowska3
  Józef M. Wiktor3
  Agnieszka Tatarek3 Józef Wiktor Jr.3
  Svein Kristiansen2 Agneta Fransson1
  Melissa Chierici4,5
  Mikko Vihtakari1,4
- 1Norwegian Polar Institute, Fram Centre, Tromsø, Norway
- 2Department of Arctic and Marine Biology, Faculty of Biosciences, Fisheries and Economics, UiT The Arctic University of Norway, Tromsø, Norway
- 3Institute of Oceanology, Polish Academy of Sciences, Sopot, Poland
- 4Institute of Marine Research, Fram Centre, Tromsø, Norway
- 5Department of Arctic Geophysics, University Centre in Svalbard, Longyearbyen, Norway
The northern coast of Svalbard contains high-arctic fjords, such as Rijpfjorden (80°N 22°30′E). This area has experienced higher sea and air temperatures and less sea ice in recent years, and models predict increasing temperatures in this region. Part of the West Spitsbergen Current (WSC), which transports relatively warm Atlantic water along the continental slope west of Svalbard, bypasses these fjords on its route in the Arctic Ocean. In this setting, it is of interest to study the structure of water masses and plankton in the Atlantic Water Boundary Current. This study describes physical and biological conditions during summer (July–August, 2010–2014) from Rijpfjorden across the shelf and continental slope to the Arctic Ocean. Atlantic water (AW) resides over the upper continental slope and occasionally protrudes onto the shelf area. The interplay between the intrusion of AW and meltwater affected the chemical balance of the region by making the carbonate chemistry variable depending on season, depth and distance along the gradient. The pH (aragonite saturation) varied from 7.96 (0.99) to 8.58 (2.92). Highest values were observed in surface waters due to biological CO2 uptake, except in 2013, when meltwater decreased aragonite saturation to <1 in surface waters on the shelf. All years were characterized by post-bloom situations with very low nutrient concentrations in Polar Surface Water and subsurface chlorophyll a maxima. In such circumstances, phytoplankton optimized growth near the limit of the euphotic depth, where the algae still had access to nutrients. In terms of biomass, the protist community was dominated by nanoplankton (2–20 μm), in particular dinoflagellates and ciliates. The prymnesiophyte Phaeocystis pouchetii and diatoms often prevailed at subsurface depths associated with the chlorophyll a maximum. The boreal Calanus finmarchicus and Oithona similis dominated AW over the slope and outer shelf, whereas Calanus glacialis and neritic zooplankton (Pseudocalanus, Parasagitta elegans, and meroplankton) dominated cold water masses inside Rijpfjorden. Continued climate warming is expected to increase the contribution of boreal species and pelagic production in the Arctic Ocean.
Introduction
Svalbard is located in a transition between boreal and Arctic biogeographic zones. This is most pronounced along the west coast of Svalbard, where the West Spitsbergen Current (WSC) transports Atlantic water (AW) northwards and where its influence is well documented on both protists (Piwosz et al., 2009, 2014; Hegseth et al., 2019) and zooplankton communities (Hop et al., 2006, 2019; Svensen et al., 2011; Vogedes et al., 2014; Soltwedel et al., 2016; Gluchowska et al., 2017b; Ormanczyk et al., 2017). North of Svalbard the Atlantic influence remains substantial as the AW Boundary Current turns eastwards, passing the Yermak Plateau, supplying AW, heat, nutrients and carbon along the upper continental slope en route to the Nansen Basin of the Arctic Ocean (Cokelet et al., 2008; Renner et al., 2018). However, due to the wider and shallow shelf north of Svalbard, the contact between fjords and the core of the Atlantic water is less direct than along the west coast. Fjords along the north coast therefore maintain a more Arctic signature. The northern coast of Svalbard is lined with high-Arctic fjords, such as Rijpfjorden (80°N 22°30′E) that face the Arctic Ocean. Rijpfjorden is a cold system influenced by Arctic Water (ArW) for most parts of the year (January–July), and covered by sea ice for 6–8 months. The pelagic ecosystem of the fjord varies seasonally (Leu et al., 2011; Weydmann et al., 2013), not only because of the seasonal variation in local radiation, but also due to occasional inflow of Atlantic-origin water during summer to late autumn (Wallace et al., 2010).
Continued climate warming with increased “Atlantification” is expected to advance the loss of sea ice in the Eurasian Basin (Polyakov et al., 2017). It will also influence the rate of change in the marine ecosystem on a seasonal basis as the part of the year with ice-covered ocean shortens and open water with associated processes (e.g., wind-driven mixing, air-sea exchanges) will become a more dominant feature of the Arctic Ocean, particularly along the shelves and ice edges and during summer and autumn. Increased heat and volume transport from northward flowing currents affect the phenology and development rates of plankton (Søreide et al., 2010). Water temperature strongly influences the geographical, vertical and seasonal distributions of plankton and can be particularly important for species at the edge of their thermal optimum range (Greene et al., 2003).
The AW Boundary Current affects not only the Arctic Ocean thermal conditions and sea ice cover (Beszczynska-Möller et al., 2012; Onarheim et al., 2014), but also the stocks and structures of biotic communities from primary producers to higher trophic level consumers, through the supply of nutrients and drifting organisms (Kosobokova and Hirche, 2009; Bluhm et al., 2015; Wassmann et al., 2015). High biomass of both boreal and Arctic zooplankton is transported along this route (Kosobokova and Hirche, 2009; Wassmann et al., 2015; Gluchowska et al., 2017a; Basedow et al., 2018). Models and temperature records from moorings suggest that the area north of Svalbard will be particularly affected by ocean warming due to increased advection of heat within the WSC, and because of atmospheric warming (Slagstad et al., 2011, 2015; Polyakov et al., 2017). This will also influence the position of the southern extent of the pack ice and its seasonal retreat off the shelf (Onarheim et al., 2014; Polyakov et al., 2017), and will add to the observed loss in sea ice extent and thickness for the Arctic Ocean (Barber et al., 2015). In this setting, it is of particular interest to study the transition of water masses, nutrients, ocean acidification (OA) state and plankton from the fjord, via the shelf and continental slope into the deep Arctic Ocean. As part of the ICE-project (NPI) we extended an established transect in Rijpfjorden northwards across the Atlantic and ArW masses on the shelf and continental slope to 3000 m depth in the Nansen Basin. The crossing of the pelagic zone of the AW Boundary Current is based on summer data along the Rijpfjorden-Arctic Ocean transects from 2010 to 2014 (Figure 1). Thus, we here provide baseline conditions for the pelagic system in this part of the Arctic Ocean, which are crucial for identifying and interpreting future changes in the area north of Svalbard. This transect was the most northern and eastern crossing of the AW Current as part of the Carbon Bridge project, and our study is the first to present physical, chemical and biological data along a transect from a fjord to the Arctic Ocean. Because of challenging ice conditions, no repeated transect studies have been carried out previously from fjords at 80°N. Based on our knowledge, we expected to find a post-bloom situation with nutrient limitations in the upper part of the water column during our summer sampling campaigns, and predominance of Arctic zooplankton in ArW masses (e.g., inside cold Rijpfjorden) and boreal zooplankton in the AW Boundary Current.
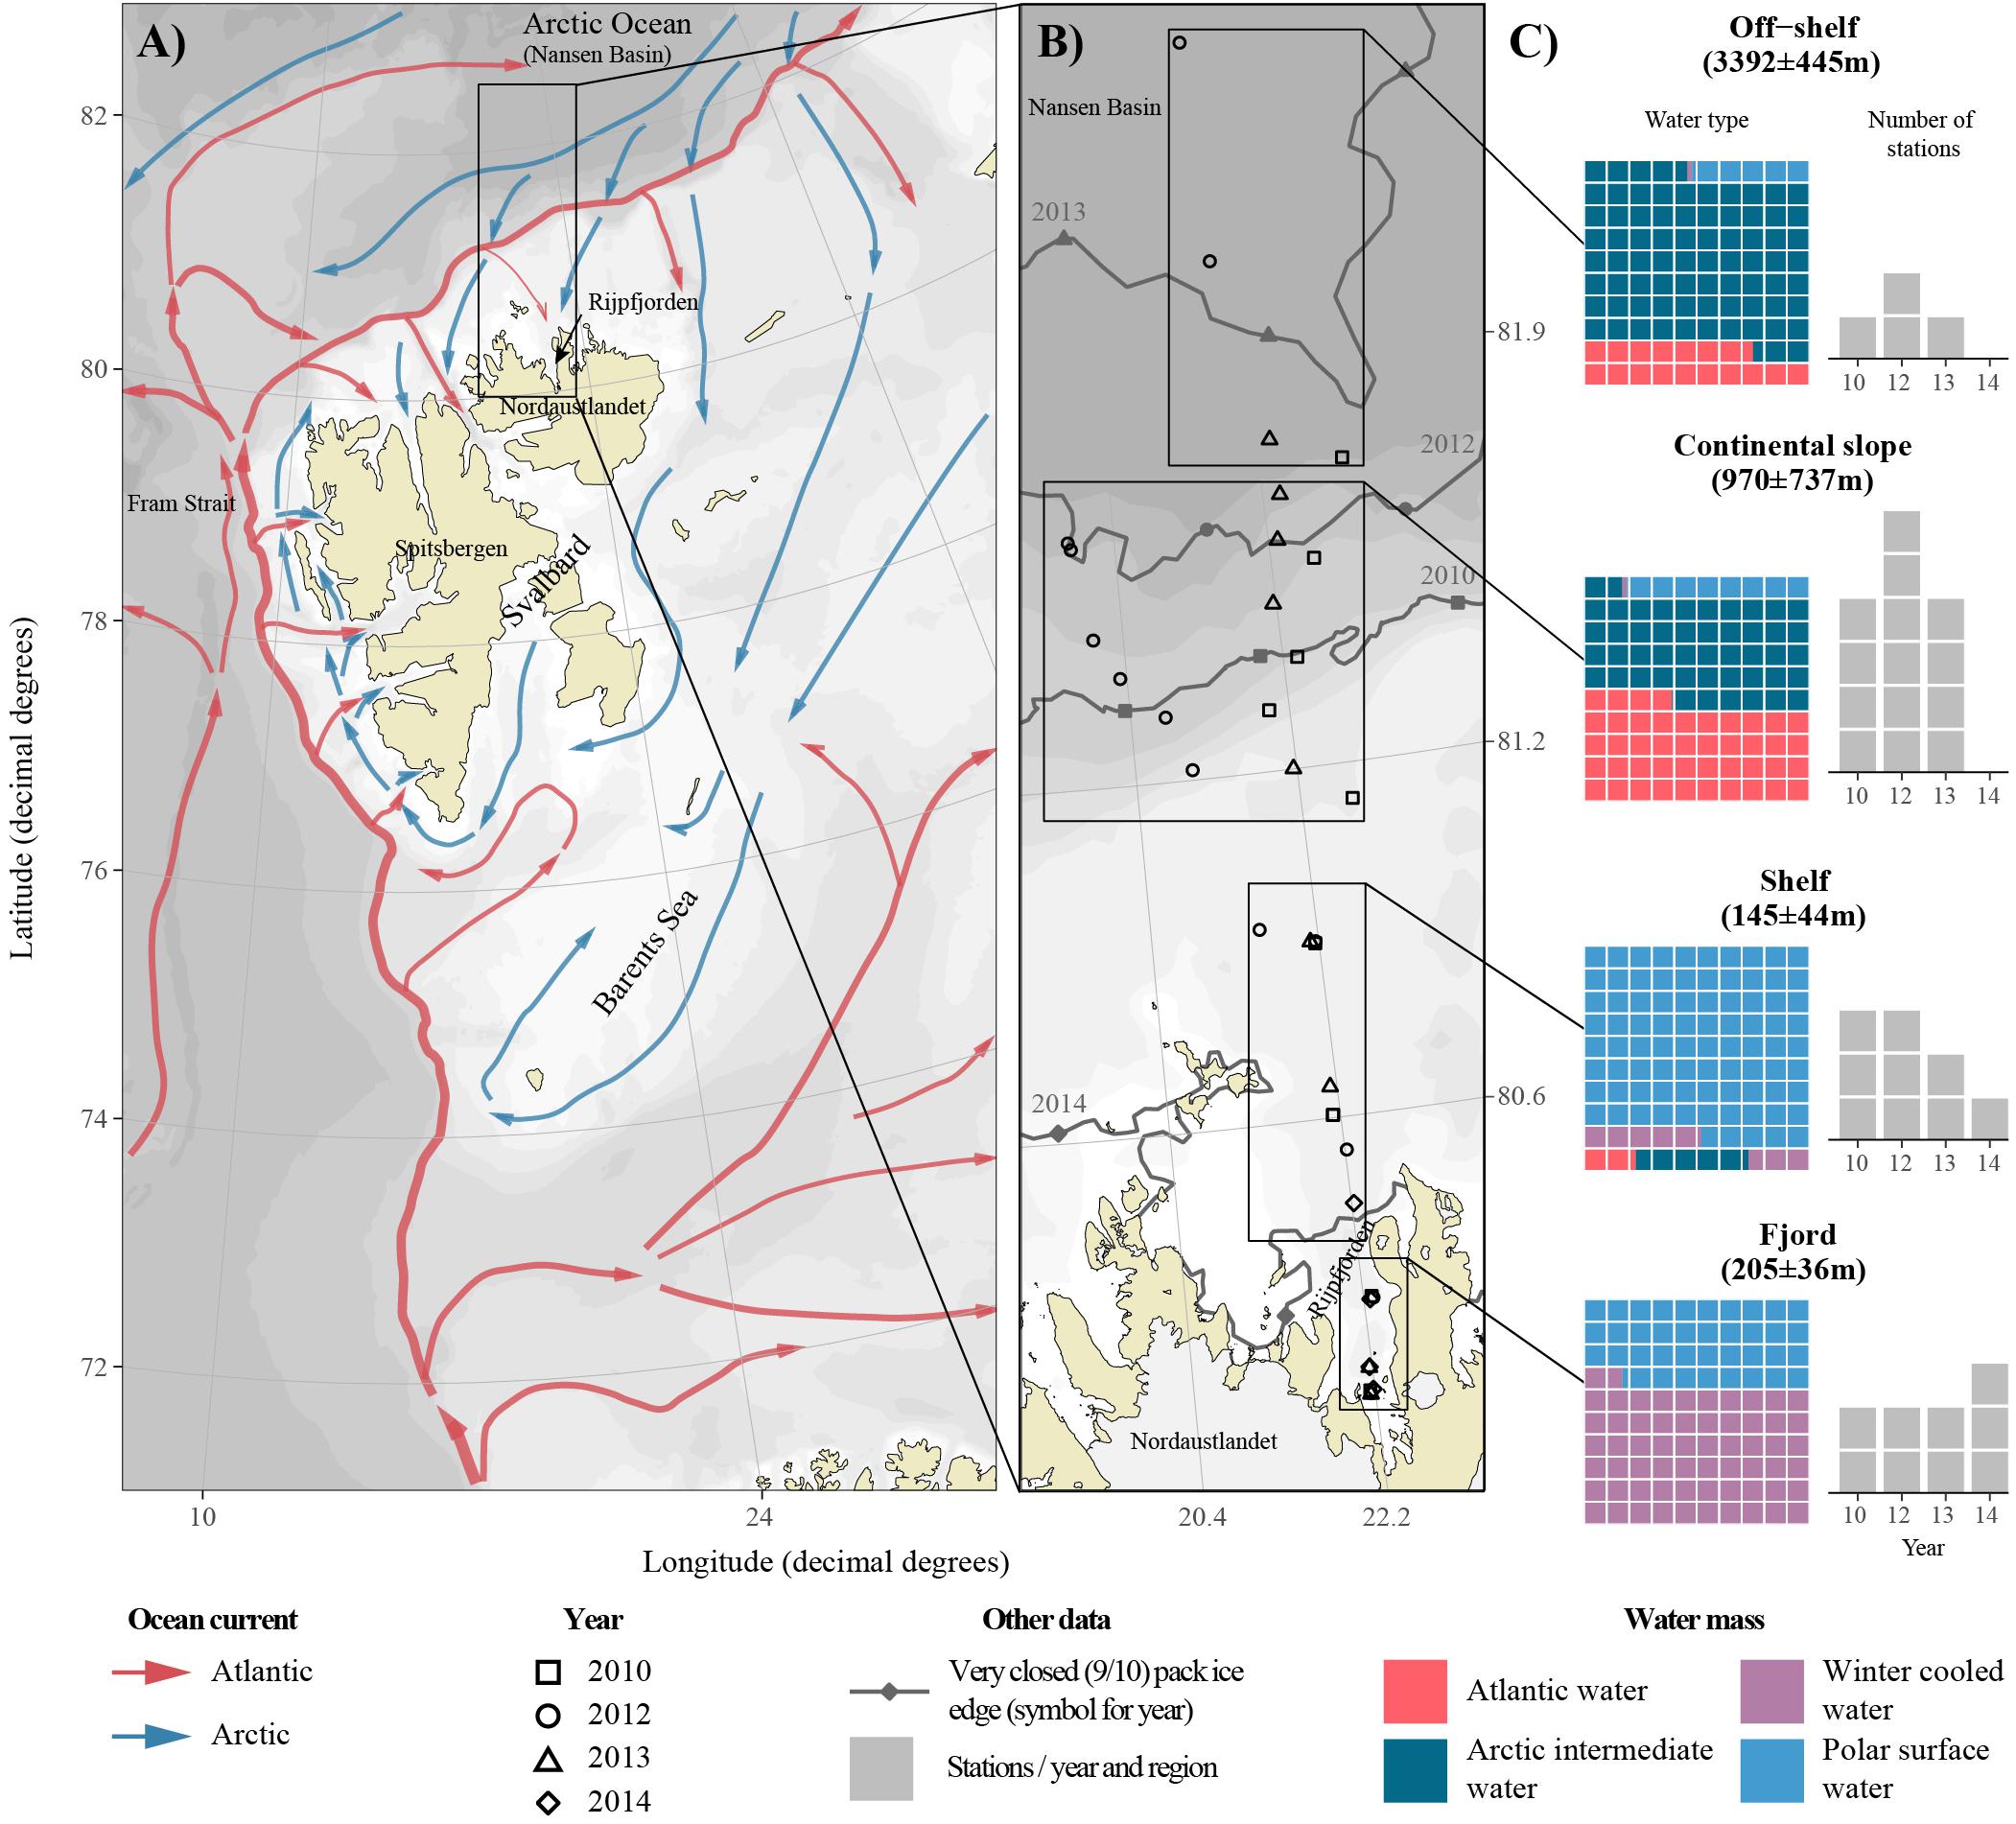
Figure 1. Map of the study area. (A) Atlantic and Arctic Water currents around Svalbard (Vihtakari et al., 2019, modified from Eriksen et al., 2018). The study region is highlighted in a black rectangle. (B) Detailed location of transect stations during the 4 years. Black rectangles indicate the regions used in data categorization and gray lines represent the consolidated pack ice (>9/10 ice concentration) for each year. In 2014, the pack ice was present along the entire study area, and sampling was possible only in Rijpfjorden. (C) Average depth (± standard deviation), with waffle chart presenting the contribution of different water masses, and the number of stations for each region, represented as gray boxes. The waffle charts are arranged in 10 × 10% grid, with each cell representing 1% of water mass contribution. The number of stations for each year are represented as gray boxes.
Materials and Methods
Sampling
Physical, chemical and biological data including hydrography (temperature and salinity), nutrient concentrations, carbonate chemistry, and chlorophyll a (Chl a), as well as protist and zooplankton composition and abundance were collected during annual summer cruises to Rijpfjorden and the adjacent Nansen Basin of the Arctic Ocean with R/V Lance on 17–29 August in 2010, 16 July–3 August 2012, 26–30 July 2013, and 27–29 July 2014 (Table 1). Chlorophyll a, nutrients and protist abundance and biomass were determined for the depths of 0, 10, 25, 50, 100 m, and Chl a maximum when it differed ( ± 5 m) from the standard depths. Occasionally, samples were collected from depths differing from those listed above. Dissolved inorganic carbon (DIC), pH and total alkalinity (AT) were determined, for carbonate chemistry, during 2012–2014. In 2014, sampling was limited to four stations in Rijpfjorden and inner shelf, because of heavy ice further out on the shelf. Stations along the sampled transects were categorized into four regions: fjord, shelf, continental slope, and off-shelf (Figure 1), each of the regions representing a different environmental setting.
Table 1. Overview of water chemistry parameters.
Ice Cover
The location of dense, consolidated (9/10) sea ice north of Rijpfjorden was estimated from vectorized ice maps from the Norwegian Meteorological Institute (MET Norway1), for a time close to mid-date of each sampling campaign (Figure 1).
MET Norway ice maps are interpreted manually from Synthetic Aperture Radar data from several available earth observing satellites2.
Hydrography
Oceanographic measurements and water samples were collected using a ship-board CTD probe attached to a Rosette-sampler with 12 Niskin bottles (SBE911 plus, Sea Bird Electronics, Bellevue, WA, United States). The CTD is calibrated by Sea Bird Electronics annually before each sampling season. Photosynthetically Active Radiation (PAR, 400–700 nm) was measured with planar sensors (Biospherical Instruments Inc.), one mounted on the CTD Rosette for underwater PAR measurements (2012–2014) and one mounted on the front deck of RV Lance for reference measurements of incoming PAR (2014). Euphotic depth was defined as the depth with PAR closest to 0.48 μmol photons m-2 s-1. The threshold value was an average of 0.1% surface PAR (sPAR) for the four CTD casts with sPAR information in 2014. The depth of maximum stratification was defined as the depth of maximum squared buoyancy frequency (N2), which was calculated with the oce package (Kelley and Richards, 2018).
Four different water masses were identified based on a modified classification from Pérez-Hernández et al. (2017): Atlantic Water (AW) was defined using the temperature threshold >1°C and salinity >34.87; Arctic Intermediate Water (AIW) was defined using the same salinity threshold and temperature range of [-1, 1]; Winter Cooled Water (WCW) was defined following Cottier et al. (2005) with a temperature threshold of < -0.5°C and salinity threshold of >34.4 (excluding the AIW data points); Remaining salinity and temperature values were assigned to Polar Surface Water (PSW, Figure 2).
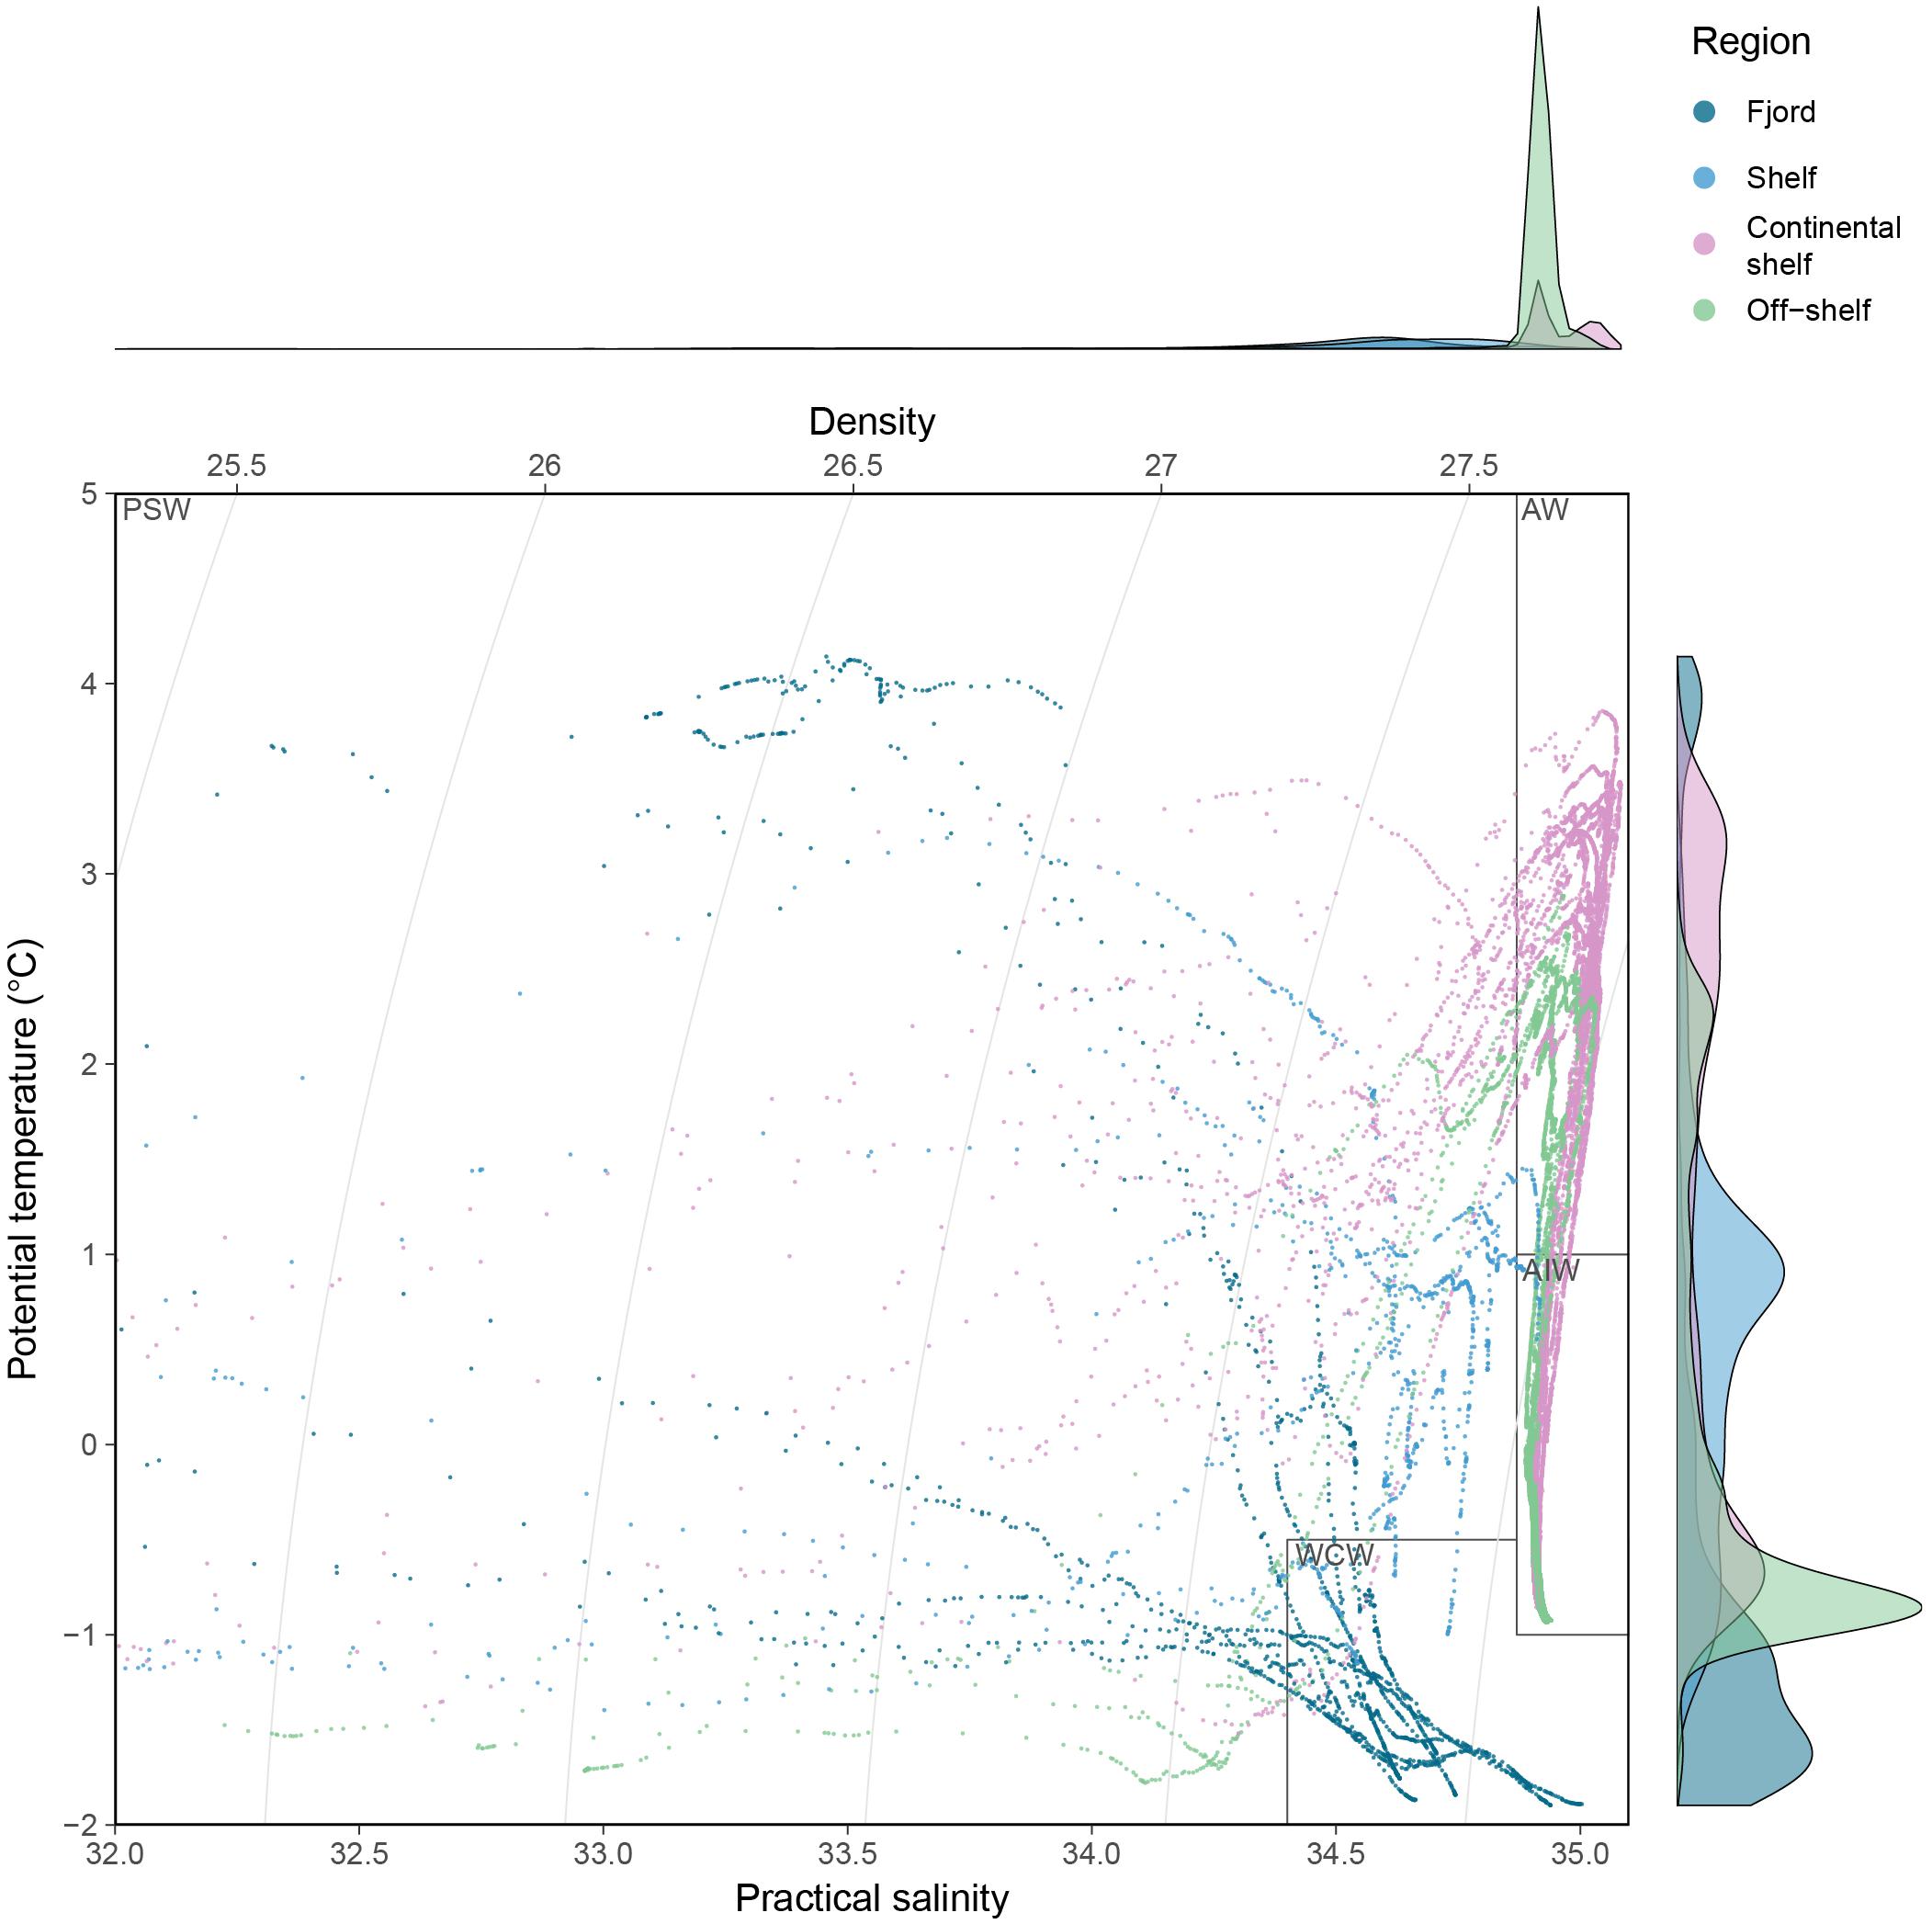
Figure 2. Temperature-salinity plot of all CTD casts in the study. Colors indicate regions and water types are illustrated using polygons (PSW, Polar Surface Water; AW, Atlantic Water; AIW, Arctic Intermediate Water; WCW, Winter Cooled Water). The marginal plots show the density distribution of 1 m binned salinity (x-axis) and temperature (y-axis) values.
Carbonate Chemistry and Ocean Acidification State
Carbonate chemistry parameters were calculated from DIC and total alkalinity (AT) values that were analyzed after the cruises at the Institute of Marine Research (IMR Tromsø, Norway) following the method described in Dickson et al. (2007). DIC was determined using gas extraction of acidified samples followed by coulometric titration and photometric detection using a Versatile Instrument for the Determination of Titration carbonate (VINDTA 3C, Marianda, Germany). The AT was determined by potentiometric titration with 0.1 N hydrochloric acid using a Versatile Instrument for the Determination of Titration Alkalinity (VINDTA 3D, Marianda, Germany). Routine analyses of Certified Reference Materials (CRM, provided by A. G. Dickson, Scripps Institution of Oceanography, United States) ensured the accuracy of the measurements, which was better than ± 1 μmol kg-1 and ± 2 μmol kg-1 for DIC and AT, respectively. We used DIC, AT and nutrient concentrations as input parameters in a CO2-chemical speciation model (CO2SYS program; Pierrot et al., 2006) to calculate other variables in the carbonate chemistry, such as pH, fugacity of CO2 (fCO2), saturation state of aragonite (ΩAr) and calcite (ΩCa). The calculations are based on the carbonate system dissociation constants (K∗1 and K∗2) estimated by Mehrbach et al. (1973), modified by Dickson and Millero (1987), and the HSO4- dissociation constant from Dickson (1990).
Inorganic Nutrients, Chlorophyll a, and Protist Community Composition
Inorganic nutrient samples (2010–2014) were frozen and later analyzed at UiT The Arctic University of Norway by standard seawater methods using a Flow Solution IV analyzer (O.I. Analytical, United States). The analyzer was calibrated using reference seawater from Ocean Scientific International Ltd., United Kingdom. Detection limits were 0.02 μmol L-1 for nitrate+nitrite (NOx), 0.01 μmol L-1 for phosphate and 0.07 μmol L-1 for silicic acid. The set of samples from the inner fjord from 2012 was analyzed at IMR. These samples were collected in 20 mL scintillation vials, fixed with 0.2 mL chloroform and stored refrigerated until sample analysis approximately 3 months later. Nitrite, nitrate, phosphate and silicic acid were measured spectrophotometrically at 540, 540, 810, and 810 nm, respectively, on a modified Scalar autoanalyzer. The measurement uncertainty for nitrite was 0.06 μmol L-1 and 10% or less for nitrate, phosphate and silicic acid.
To estimate Chl a concentrations, seawater samples of 100–500 mL were filtered through 25 mm GF/F filters (Whatman), extracted in 100% methanol for 12 h at 5°C on board the ship and measured fluorometrically with an AU10 Turner Fluorometer (Turner Design, Inc.) according to the method by Parsons et al. (1984).
Seawater subsamples for protist enumeration were settled in 50 mL Utermöhl sedimentation chambers (Hydro-Bios, Kiel, Germany) for 48 h. Protists in the subsamples were identified and enumerated at 100–600× magnification using an inverted Nikon Ti-S light microscope. The organisms were identified to the lowest taxonomic level possible and grouped into size-classes. In cases when detailed identification was not possible, specimens were assigned to higher-rank taxa, incertae sedis (i.e., protists, but not determined to higher rank) or three size classes (3, 3–7, and >7 μm) in case of unidentified flagellates (Flagellates indet.). Counts of the dominant organisms in each sample were always well above the recommended number of 50 counts per sample. Protist abundance per liter was calculated considering the area of the investigated chamber surface, chamber volume and proportion of total chamber surface area to the ocular field of view area. When possible, dominant taxa were measured and the mean cell size was used to calculate the biovolumes from equivalent geometrical shapes (Hillebrand et al., 1999). When detailed measurements were not possible, mean biovolumes were taken from HELCOM database or from http://nordicmicroalgae.org. The biovolume was converted to cellular carbon content in μg C cell-1 using published carbon conversion factors (Menden-Deuer and Lessard, 2000).
Mesozooplankton Community Composition
Stratified vertical net hauls to collect zooplankton samples were performed with a multiple plankton net (MultiNet, Hydro-Bios, Kiel, Germany) consisting of five nets with 0.25 m2 opening and 200 μm mesh size. The depth strata sampled were: 0–20, 20–50, 50–100, 100–200, and 200 m–bottom, or 0–20, 20–50, 50–200, 200–600, and 600 m–bottom in deeper water. The lower limit of the deepest layer sampled was set at 20 m above the bottom. Samples were preserved in 4% final concentration hexamethylenetetramine-buffered seawater formaldehyde solution immediately after collection. The organisms were identified and counted under a stereomicroscope equipped with an ocular micrometer, following sample examination procedures recommended by Postel (2000). Each sample was first scanned for macrozooplankton (organisms with total length >5 mm), which were picked out, identified and counted for the entire sample. The remaining mesozooplankton size fraction (<5 mm) was suspended in a fixed volume of water, from which 2 mL subsamples were taken using a large-volume automatic pipette with tip cut to make 5 mm opening (an equivalent of Stempel pipette). At least three subsamples were examined thoroughly under a stereomicroscope during this part of sample examination, and the total number of individuals recorded, identified and enumerated was never less than 500. The rest of the sample was searched in order to identify and enumerate numerically less important taxa. Zooplankters were identified to species or the lowest taxonomic level possible, including identification of the developmental stages whenever feasible. Calanus spp. were identified to species for each developmental stage based on morphology and size according to the criteria from Kwasniewski et al. (2003).
Original zooplankton data represent abundance values of zooplankters per unit volume (ind. m-3) for each sampled depth strata (see above). Abundance values were converted to biomass estimates (mg dry mass m-3) using species-specific dry mass values gathered from published sources or measured by the authors (see Hop et al., 2019 for details). The biomass for each organism in each layer was summed up and converted to depth-averaged biomass at a station using the following equation:
where ai is the biomass of species a at depth stratum i, di is the sampled distance for depth stratum i in meters, and n is the number of depth strata in net haul at a station. Dry mass was converted to carbon using conversion factors of 0.5 for crustaceans and chordates, 0.3 for meroplankton, and 0.1 for gelatinous taxa (Table 3).
The Shannon-Wiener diversity index and evenness as well as abundance-biomass ratios, were calculated for zooplankton from each of the four regions (Figure 1) and for the two main water masses – Atlantic Water and ArW (including all sub-types listed in Figures 1, 2). All identified zooplankton taxa were considered for these calculations. Regarding the four regions, abundance data were vertically integrated using the above equation for each station and sampling instance, and then averaged over all the stations included in each of the four regions. Calculations were then performed on the averaged data. The abundance of taxa in each water mass was computed from the product of the total abundance of a given taxa in a sample and the fraction of each water mass in the water sample. These calculations were done over all the available samples leading to average abundance of each taxa per water mass weighted by the two main water mass fractions. Abundance data were used to compute the Shannon-Wiener diversity index, based on natural logarithm and natural digits, nats. ind-1 as measurement unit, and evenness. Biomass data were averaged following the same method as for abundance data, allowing the calculation of abundance-biomass ratios.
Results
Ice Cover
The sea ice extent varied considerably between summers (Figure 1B). In 2010 and 2012, the ice edge was situated over the continental slope while in 2013 it had retreated further northwards over the deep basin. The summer 2014 was distinctively different. Sea ice covered the entire shelf down to the coast of Nordaustlandet with only parts of Rijpfjorden being ice-free.
Water Mass Distribution
The study area is influenced by relatively warm AW transported in the Svalbard branch of the WSC, flowing at subsurface depths along the continental slope into the Arctic Ocean, as the AW Boundary Current, and by colder and fresher Arctic surface waters transported with the Transpolar Drift and Arctic coastal waters (Figure 1A). The relative contribution of the four different water masses identified in this study varied depending on region (Figure 1C). Polar Surface Water and WCW were present along the entire transect. WCW was the dominant water mass inside the fjord, occupying the deeper part of the fjord basin (Figure 3), but its relative contribution declined toward the shelf with only minor contribution to continental slope waters. Polar Surface Water was generally restricted to the upper 100 m of the water column, and the presence of this water mass lead to a stratified water column from the fjord system out to the continental slope (Figure 3). The temperature of the PSW was the coldest in the last 2 years of the time series. In 2013, the water in the upper 50 m was generally colder and fresher than in July 2012, and PSW was coldest in 2014, the year with most extensive ice cover. In contrast, in 2010, sampling along the transect was conducted later in the season than in the other years, thus, the PSW had received the largest surface insolation, which had warmed the water up to nearly 4°C. Penetration of AW onto the shelf was evident in 2010–2013, but made a relatively minor contribution to the water mass budget. The main core of AW was located over the upper continental slope (typically between the 500 and 1000 m isobath) with temperature reaching 3°C and salinity >35.0. The extent of AW differed among years, as can be appreciated from the varying positions of the T = 1°C, S = 34.87 isolines (Figure 3). Atlantic Water remained a prominent water mass off-shelf, where AIW dominated. Distribution of AIW showed an opposite trend to WCW; it declined toward the continental slope and shelf and was absent inside the fjord (Figure 1).
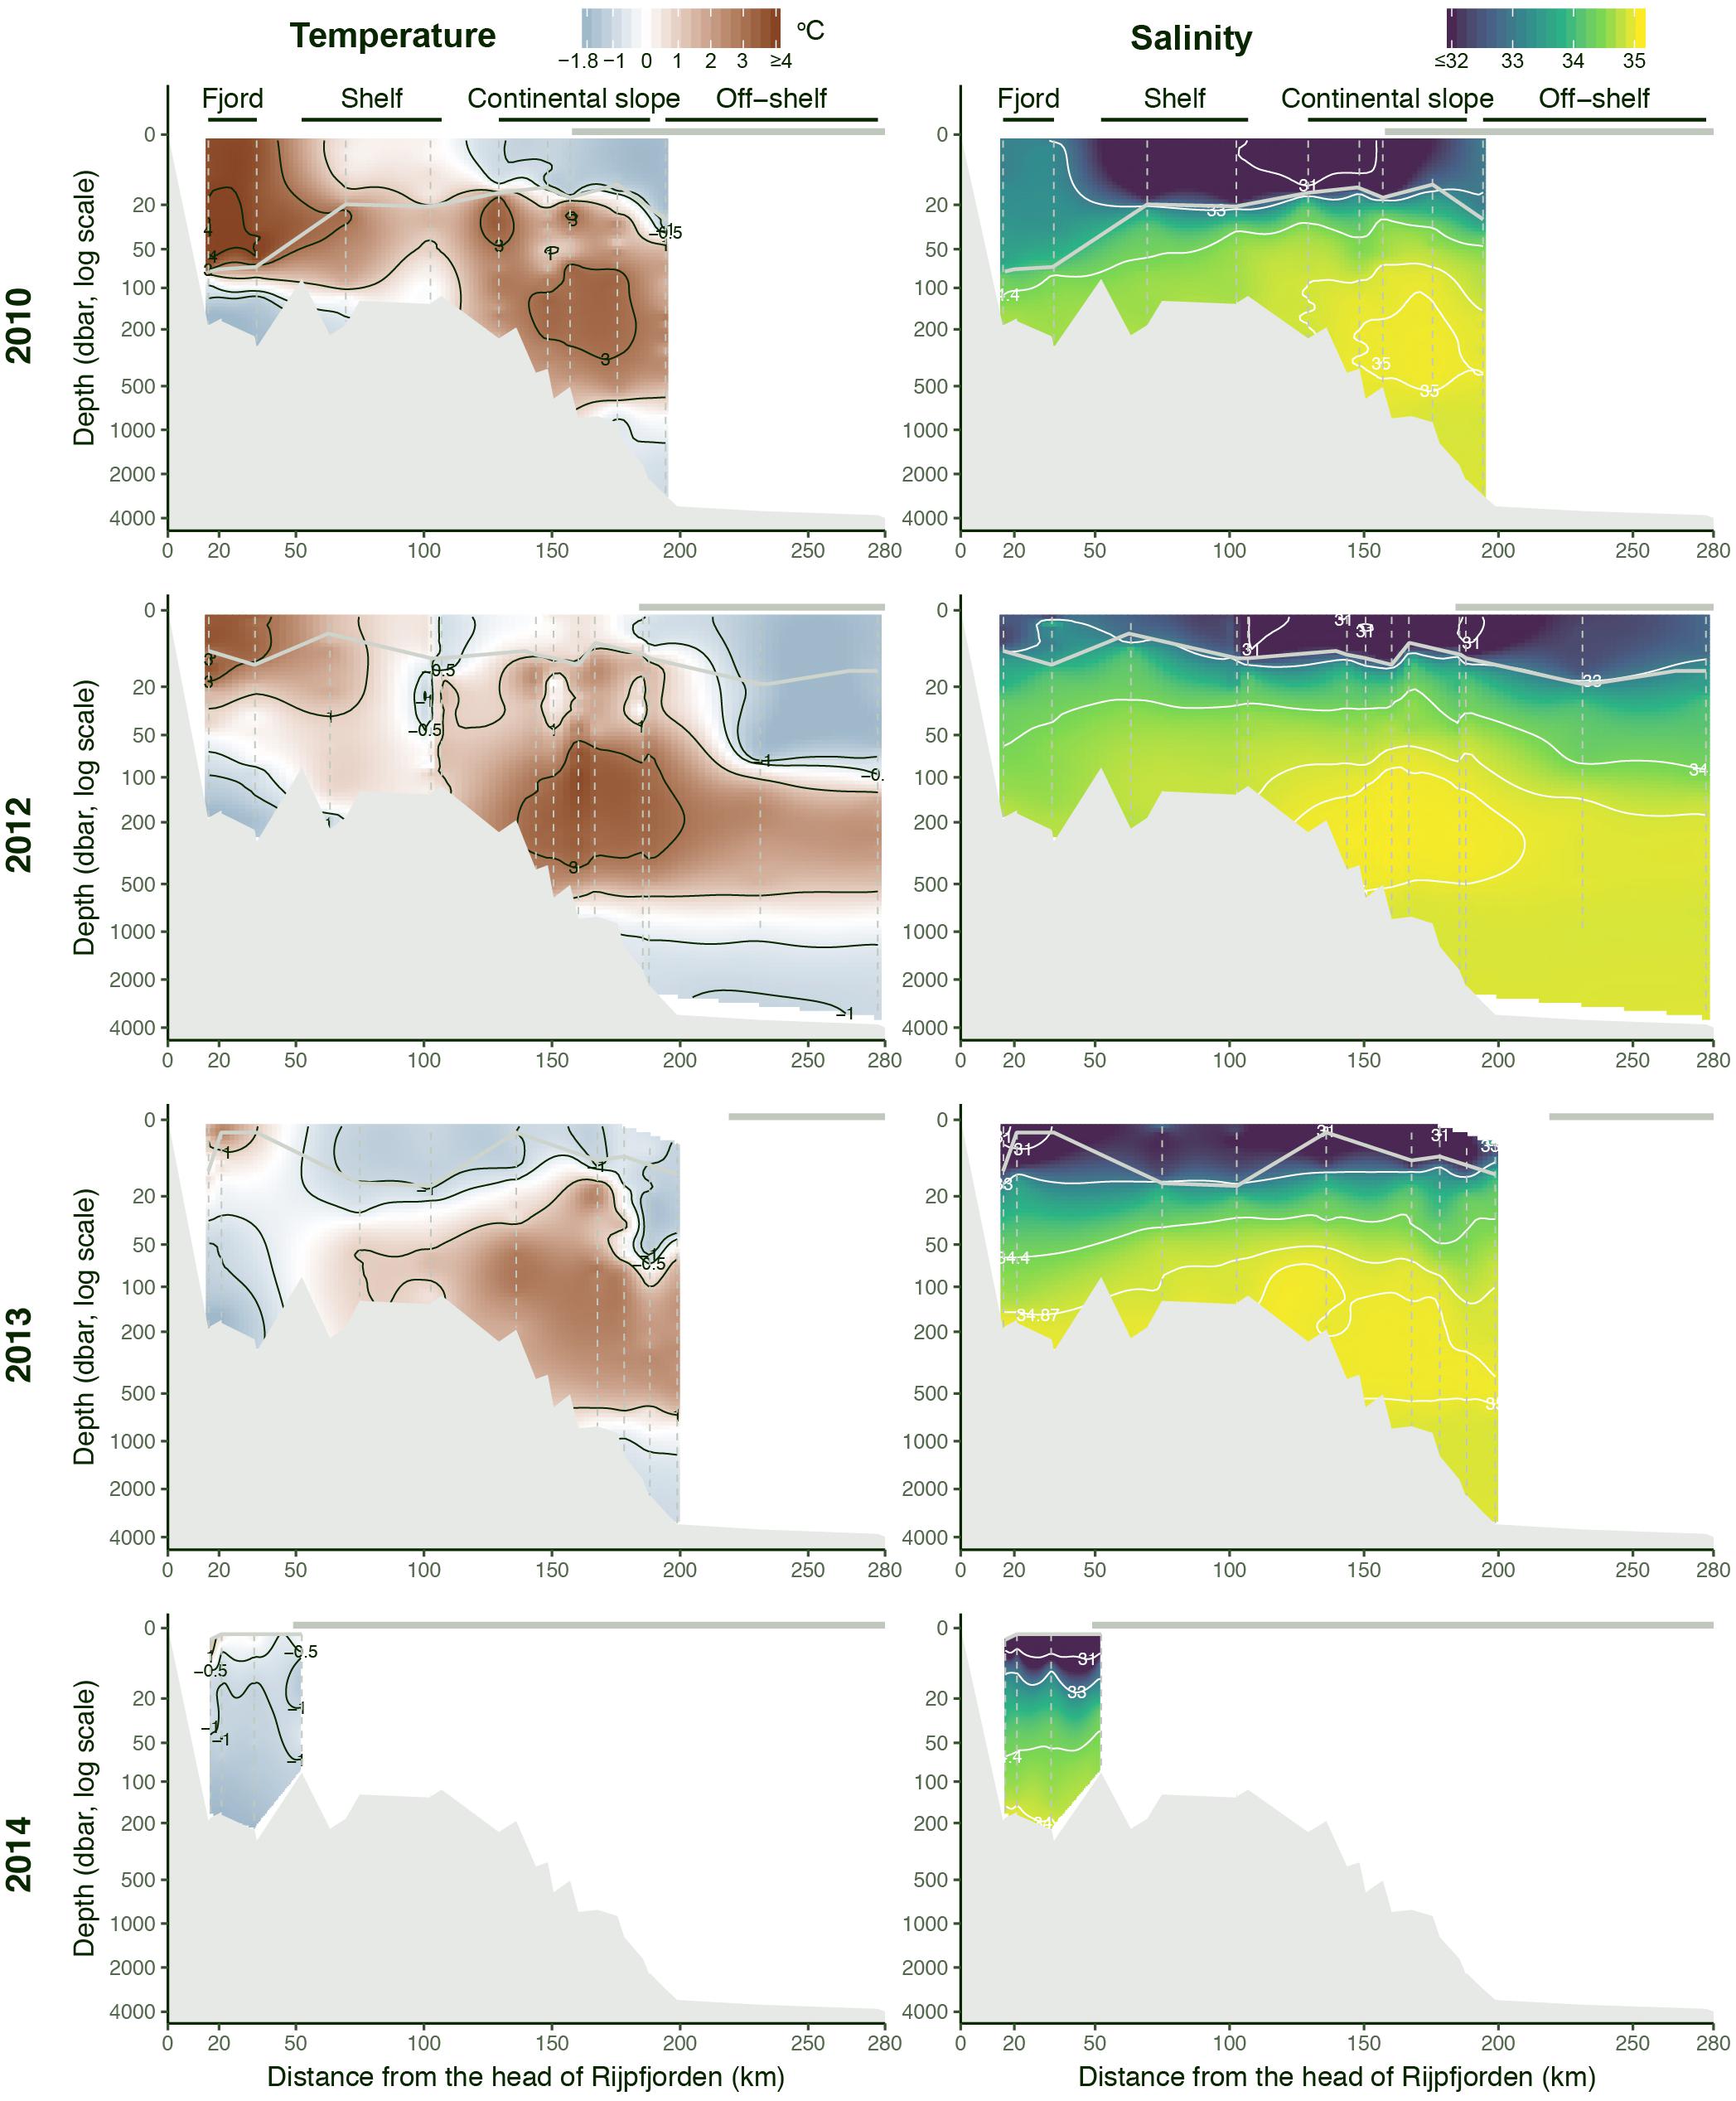
Figure 3. Temperature and salinity along transects from inner Rijpfjorden to the deep Arctic Ocean, in July–August 2010, 2012, 2013, and 2014. Gray horizontal line at 0 m indicates the extent of consolidated pack ice, and they gray line on top of the gridded values is the depth of maximum stratification. The section from 2014 was limited to Rijpfjorden because of heavy sea ice. Vertical dashed lines indicate individual CTD casts.
Carbonate Chemistry and Ocean Acidification State
The pH-values and the aragonite and calcite saturation states (ΩAr, ΩCa) showed large spatial variability (Figure 4). In 2013, pH and ΩAr were relatively high in the surface water along the transect from inside the fjord to shelf slope and off slope, compared to further down in the water column. The variables most relevant for ocean acidification, pH and ΩAr (ΩCa) varied between 7.96 and 8.58, and 0.99 (1.53) and 2.92 (4.68), respectively (Figure 4). The highest pH and ΩAr were found at the surface and local spots coinciding with depleted nitrate and phosphate concentrations for all years. The lowest ΩAr of about 0.99 was observed in the bottom water off the slope in 2013 and was close to 1 (near undersaturation) in the upper 10 m on the shelf. The ΩAr horizon, where ΩAr < 1, was located at 2000 m depth in the off-slope area. The highest pH (8.58) and ΩAr (2.92) were observed in the fjord in the upper 20 m in 2014.
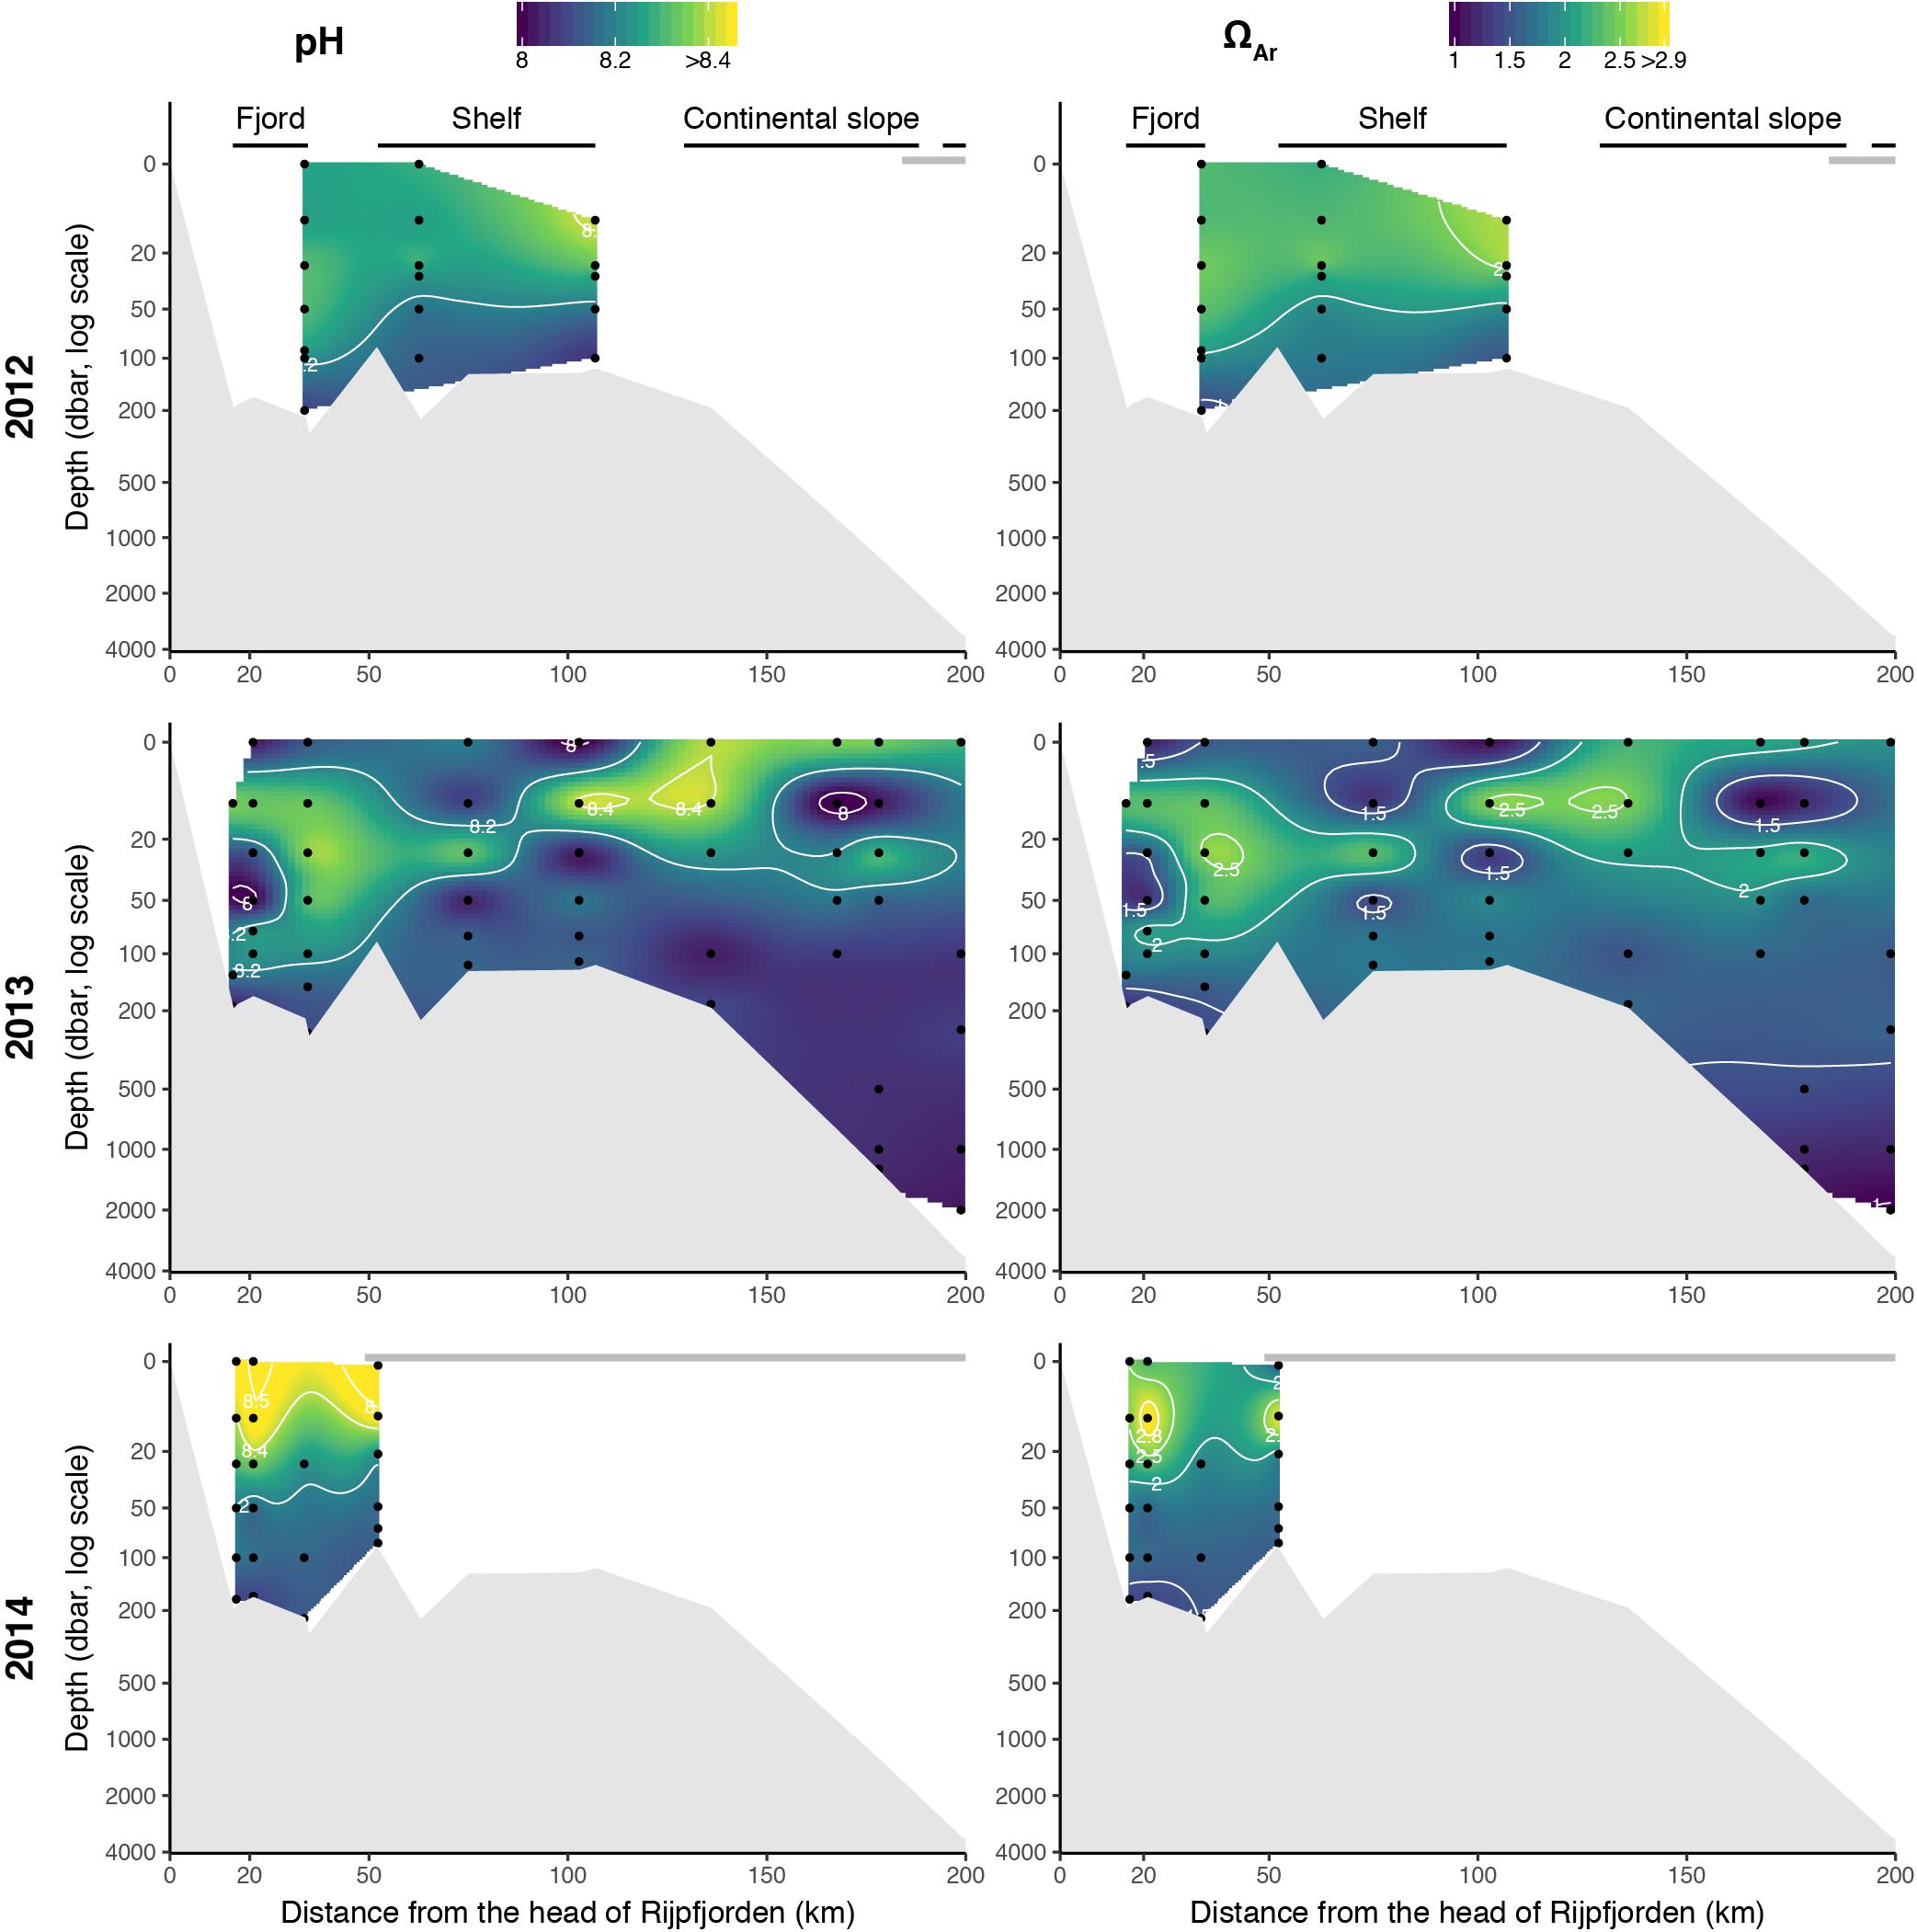
Figure 4. pH and aragonite saturation (ΩAr) along the Rijpfjorden transect, July–August 2012–2014. Gray horizontal line at 0 m indicates the extent of consolidated pack ice.
The pH and ΩAr values varied between years in the upper 200 m along the Rijpfjorden transect (Figure 4). Generally, ΩAr values were higher at the surface decreasing toward the bottom, except for in the fjord and shelf in 2013.
Nutrients and Chlorophyll a Concentration
Nitrate and nitrite (NOx) concentrations were low or at detection limit in the upper 25–50 m of the water column in all years and increased below 50 m depth (Figure 5). NOx was strongly correlated with PO4 and Si(OH)4 with Pearson’s correlation coefficients of 0.93 and 0.90, respectively. The nutrient status, as indicated by the NOx:PO4 ratio, was related to water masses (Figure 6). Polar Surface Water showed the lowest NOx:PO4 ratio, well below Redfield (N:P = 16:1), indicating nitrogen as the putative limiting nutrient and an increase in nitrogen limitation toward the fjord. Shoaling of the nutricline was observed at the upper slope in 2010, 2012 and 2013 with elevated NOx concentrations at 25 m depth. In 2010 and 2012, elevated surface NOx concentrations were observed at the northernmost ice-covered stations.
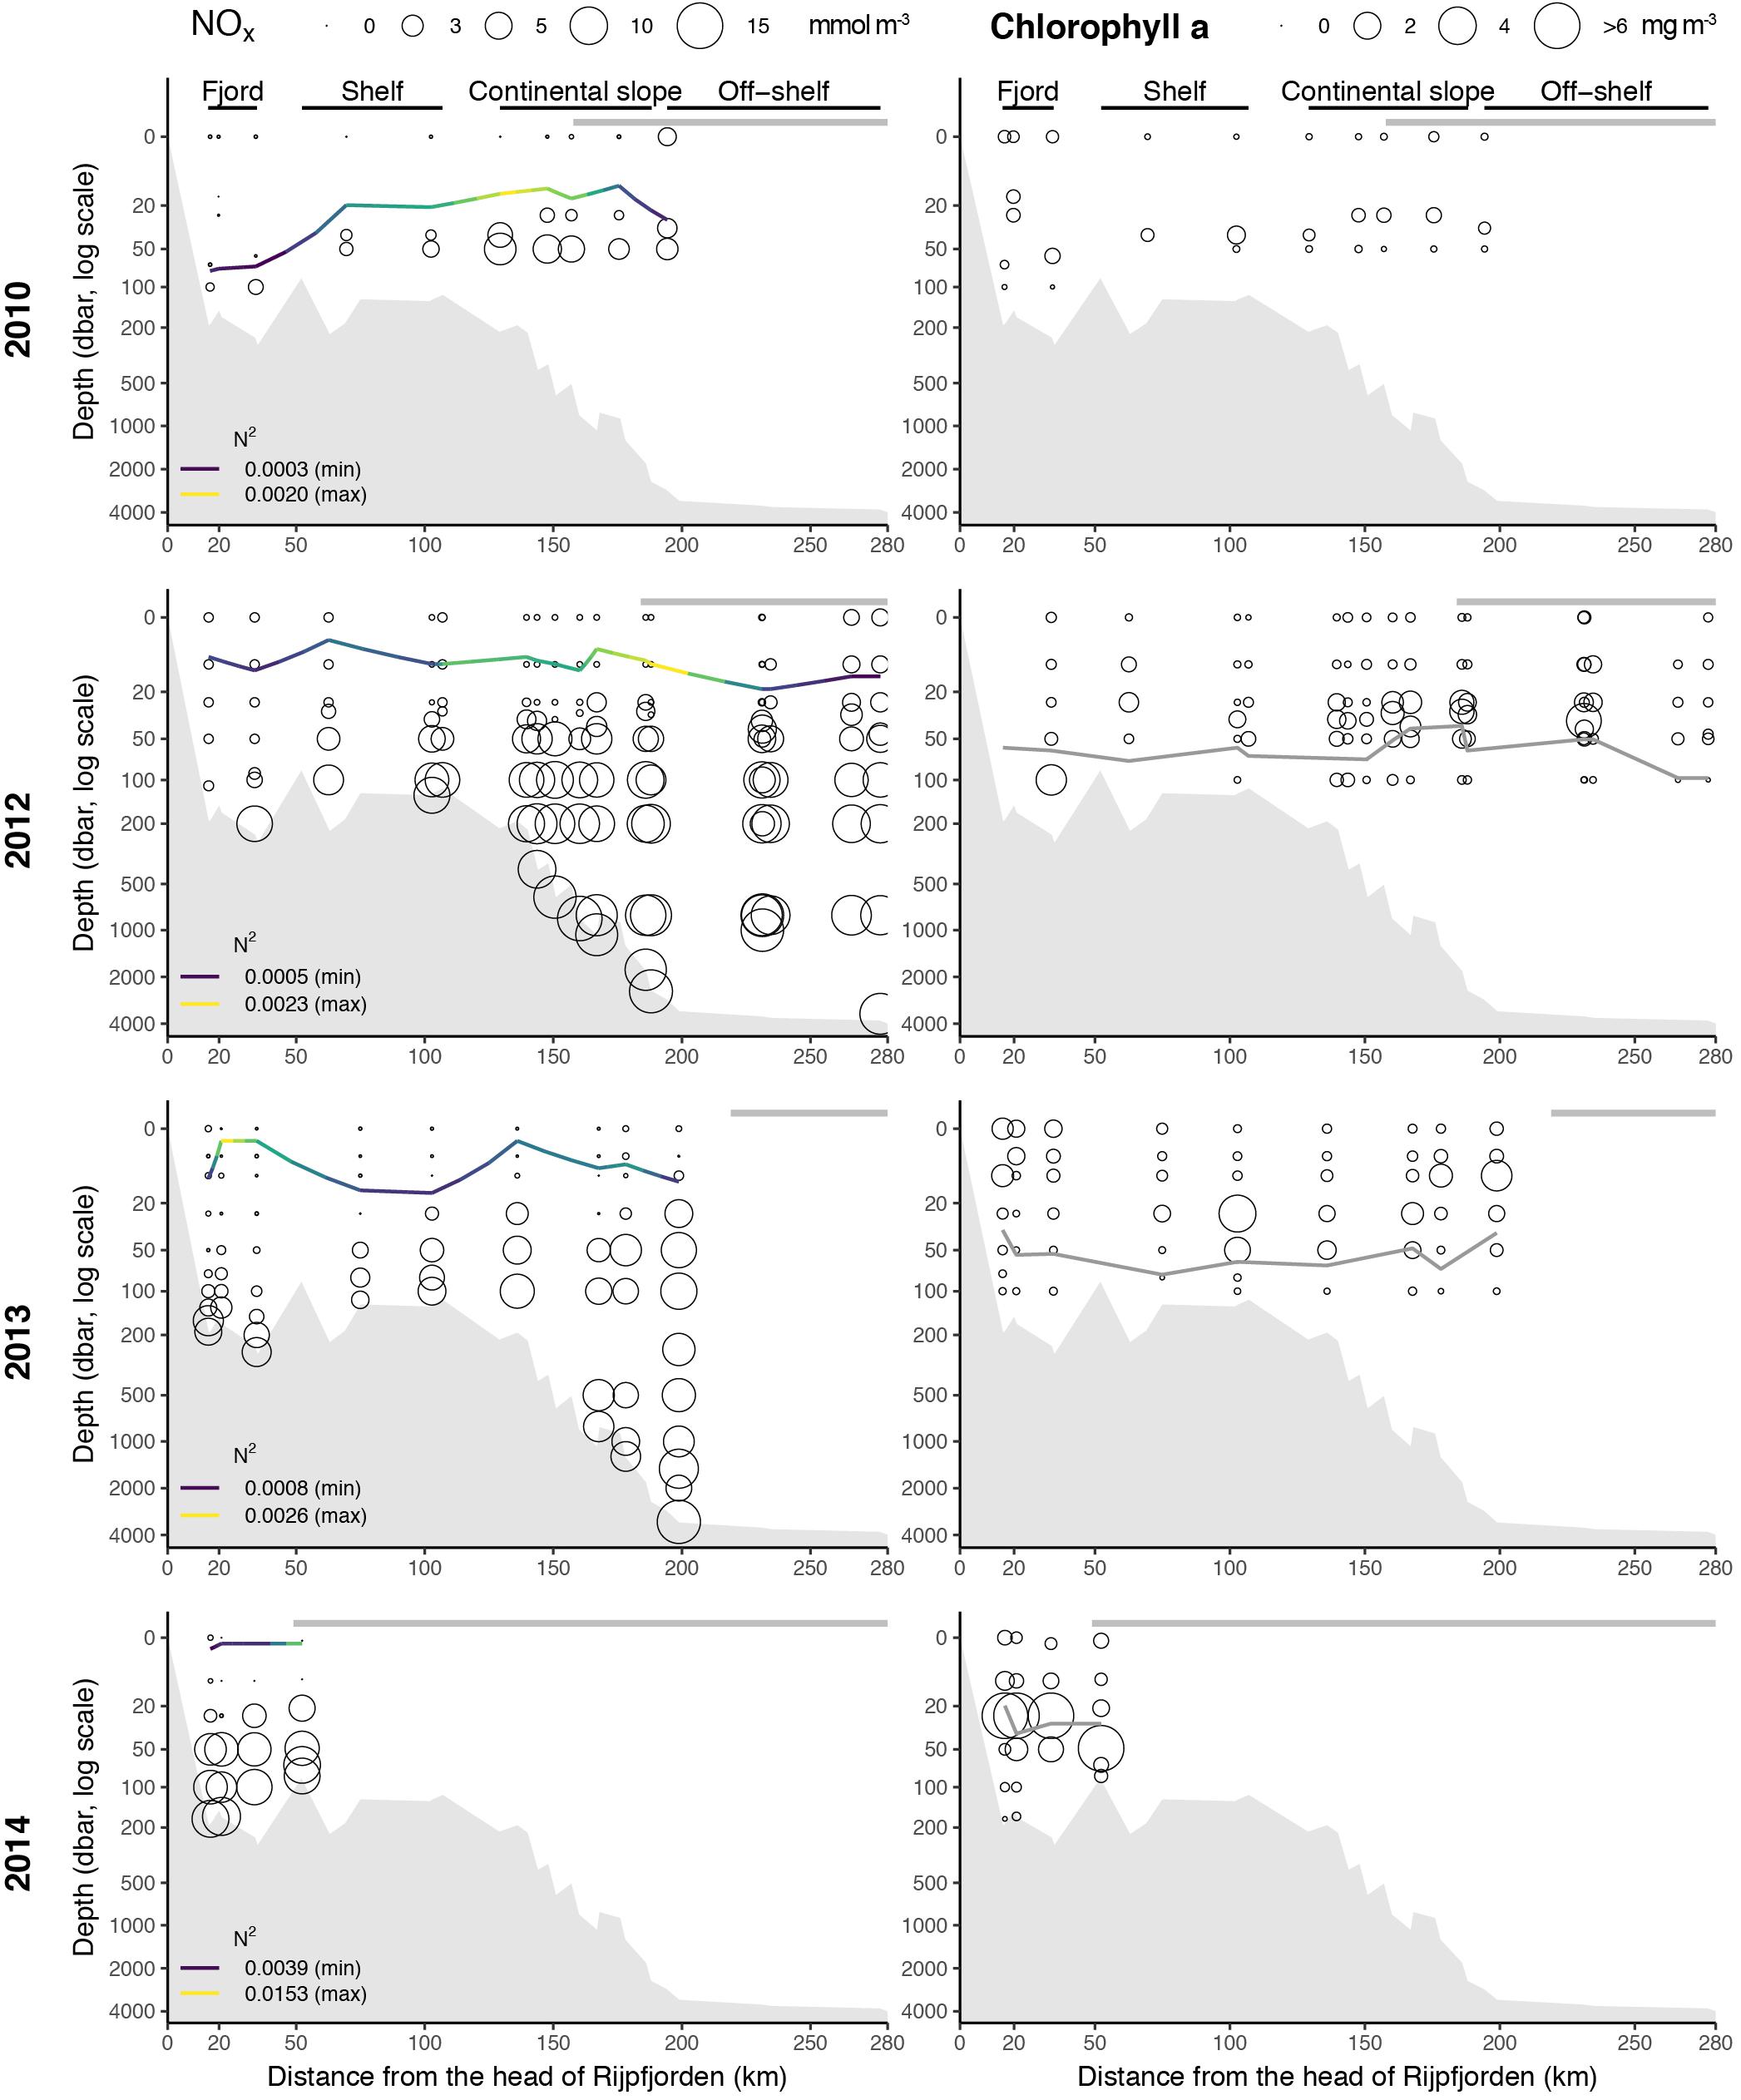
Figure 5. Nitrate and nitrite (NOx) (left panels) and Chlorophyll a (right panels) concentrations along the Rijpfjorden transect. Size of bubbles relates to concentration (mmol m-3 and mg m-3, respectively). Thin line in left panels indicates depth of maximum stratification with minimum and maximum levels specified (colors and numbers). Thin gray line in right panels indicates euphotic zone depth (i.e., CTD depth with PAR value 0.47 μmol photons m-2 s-1, which is 0.1% of surface radiance value for the CTD with surface irradiance measurement). The thick gray horizontal line indicates the extent of consolidated pack ice.
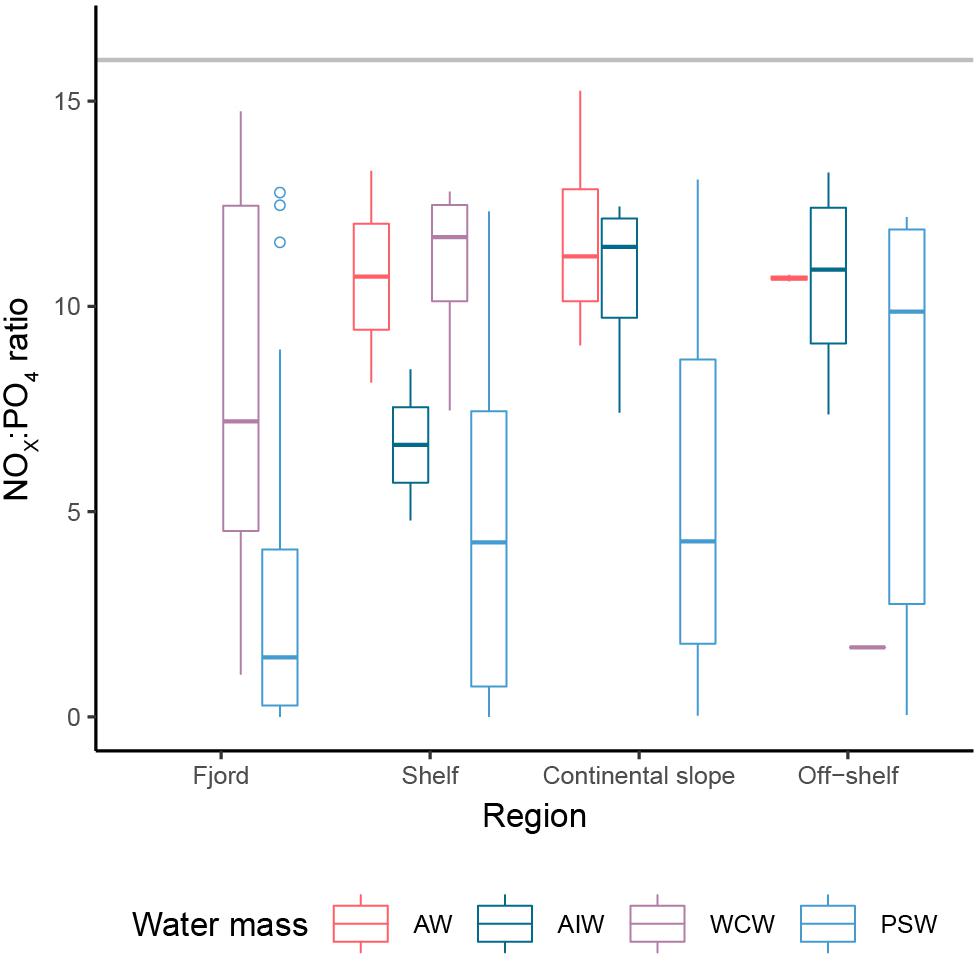
Figure 6. Nitrogen/phosphorous ratio (NOx:PO4) in different water masses (AW, Atlantic Water; AIW, Atlantic Intermediate Water; WCW, Winter Cooled Water; PSW, Polar Surface Water), along the Rijpfjorden transect. The horizontal gray line indicates the Redfield ratio.
Chlorophyll a concentrations were generally < 1 mg m-3 in surface waters and showed distinct subsurface maxima coinciding with the bottom of the euphotic zone (Figure 5). The depth of maximum stratification was always shallower than the euphotic zone (no PAR data available for 2010) indicating that phytoplankton growth was not light-limited. In 2014, there was a marked sub-surface bloom, with deep Chl a max at 30–40 m depth, in the outer part of the fjord while the situation further out is unknown due to the lack of measurements in that year. Depth-integrated (0–50 m) Chl a standing stocks ranged from 9 to 233 mg m-2 (Supplementary Figure S1). The subsurface bloom in 2014 is reflected in the high Chl a standing stocks of 209 and 233 mg m-2 inside the fjord and the inner shelf, respectively, while the range in the other years was much more confined (9–48 mg Chl a m-2).
Protist Abundance, Biomass, and Composition
Overall, 321 taxa were identified with 141 to species, 121 to genus and 59 to class. The number of taxa varied between years. In 2010, the highest number of 166 taxa was observed: 76 inside the fjord, 86 on the shelf, 135 over the continental slope and 66 off-shelf. In 2012, nearly as many taxa were observed (164). In that year, the fjord also had fewer taxa than shelf waters, whereas off-shelf waters hosted higher number of protists than the continental slope (145 versus 67). In 2013, the lowest protists richness was recorded (94). In spite of heavy ice conditions in 2014, as much as 129 taxa were observed that year, surpassing the number of taxa observed in this part of the transect the previous years.
The most frequently occurring taxa (F > 90%, sizes < 30 μm) were; choanoflagellates (Monosiga sp.), flagellates of unknown taxonomic affiliation and nutritional mode (flagellates indet.), dinoflagellates (Gymnodinium galeatum, Gymnodinium sp., 5–10 μm and 10–20 μm, respectively), the heterotrophic cryptophyte Eucocryptos marina and the ciliate Lochmaniella oviformis.
Protist abundance and biomass ranged from 2.21 × 10² to 1.39 × 10⁷ cells L-1 and 0.1–633 μg C L-1 depending on depth and year (Supplementary Tables S1, S2). The biovolume of the observed cells (μm3) ranged from 1 to 827 × 103 μm3 (mean 2.1 × 103 μm3). In terms of abundance, species within the nanoplankton size range (2–20 μm) dominated the protistan assemblage, with most prominent taxa being prymnesiophytes (15.9–60.3%), flagellates indet. (10.6–33.0%), chrysophytes (4.3–13.2%) and cryptophytes (1.3–13.7%), the latter two combined under “other” (Supplementary Figure S2). In total, their pooled share ranged from 70.7–82.6%. The common and important members of protistan plankton – dinoflagellates and diatoms – contributed with only 1.7–3.7 and 1.4–12.6% to overall abundance, respectively. However, in terms of biomass, dinoflagellates were the dominant component of protist biomass and standing stocks (0–50 m) in all years (Figures 7, 8). Athecate (naked) dinoflagellates belonging to the Gymnodiniales were particularly prominent. Ciliates also contributed a significant share of protist biomass and were represented by both aloricate (in particular Lohmanniella oviformis, Leegaardiella sol, Laboea strobila, and Mesodinium rubrum) and loricate (in particular Parafavella obtusangula, Ptychocylis acuta, and Acanthostomella norvegica) ciliate species. Prymnesiophytes, mainly represented by Phaeocystis pouchetii, and diatoms were often predominant at subsurface depths (Figure 7). Diatoms contributed only significantly to protist biomass in the subsurface bloom on the inner shelf station in 2014 (Figures 7, 8). The dominant species in the subsurface bloom were Fragilariopsis oceanica and Shionodiscus bioculatus (formerly Thalassiosira bioculata).
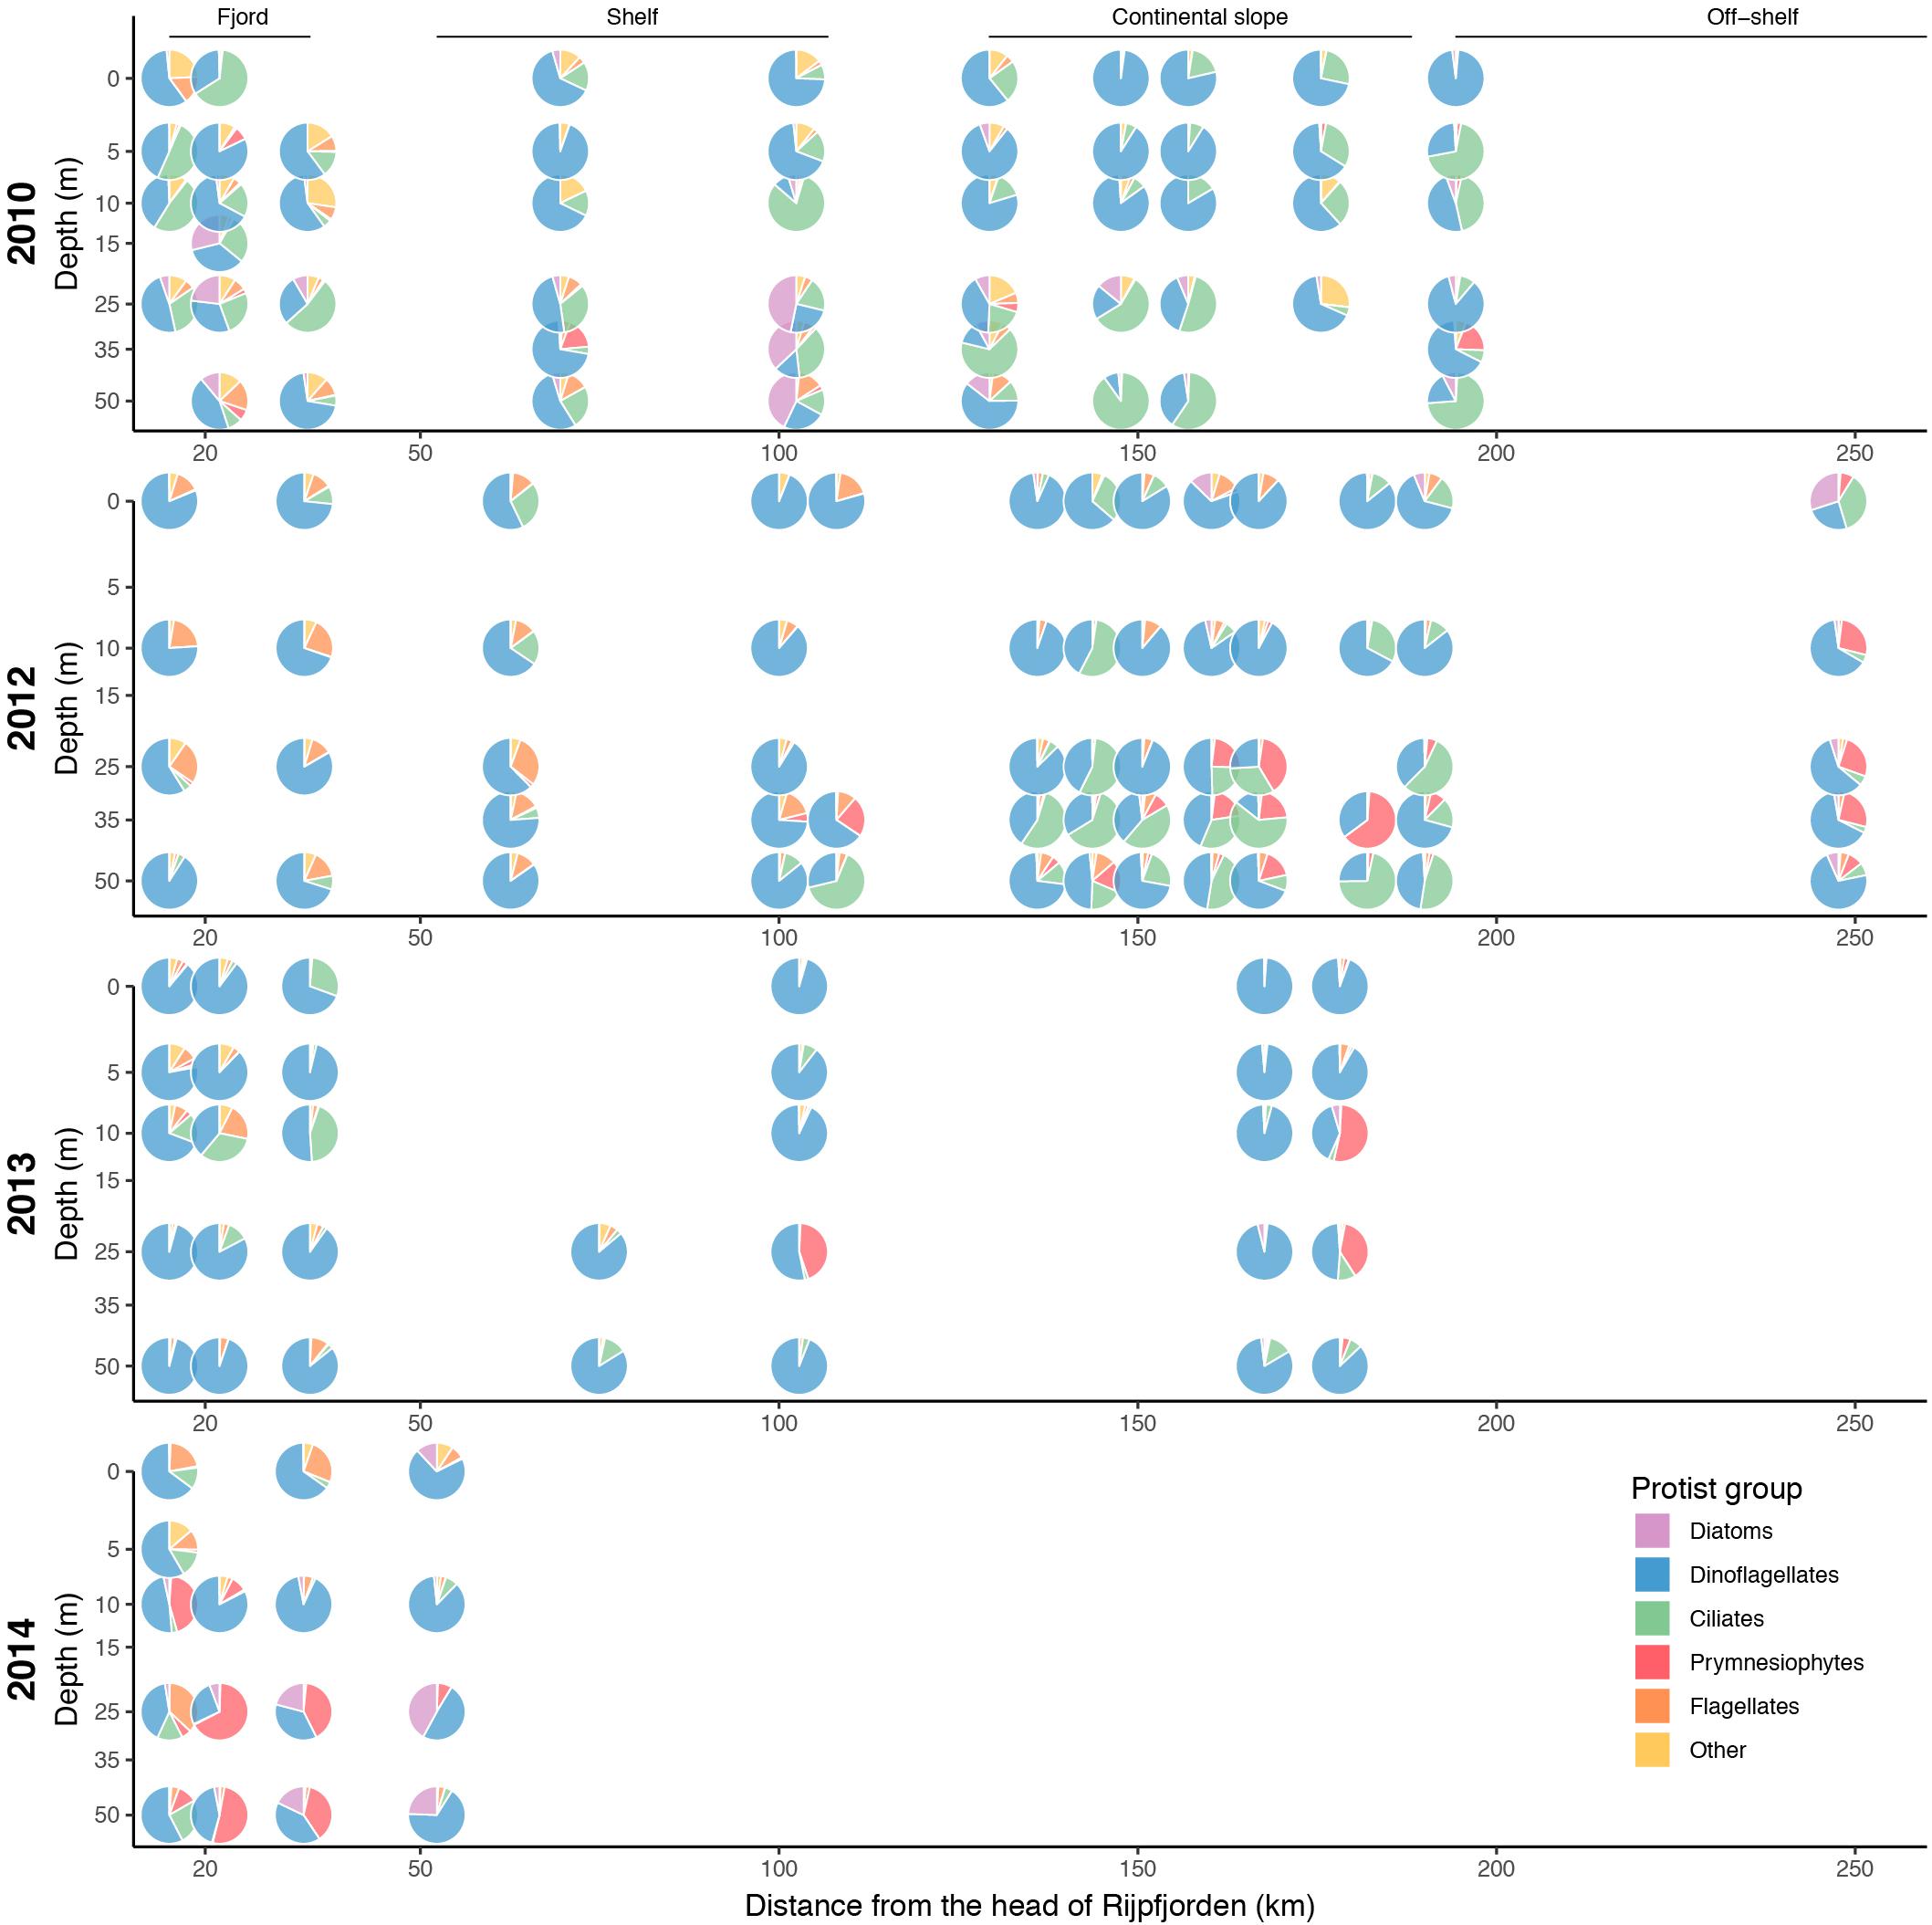
Figure 7. Average contribution of major protists groups to total protist biomass (μg C L-1) along the transect from Rijpfjorden to the Arctic Ocean for 2010, 2012, 2013, and 2014. Samples have been binned vertically to [0, 5], [5, 10], [10, 15], [15, 30], [30, 40], and [40, 50] m depth groups.
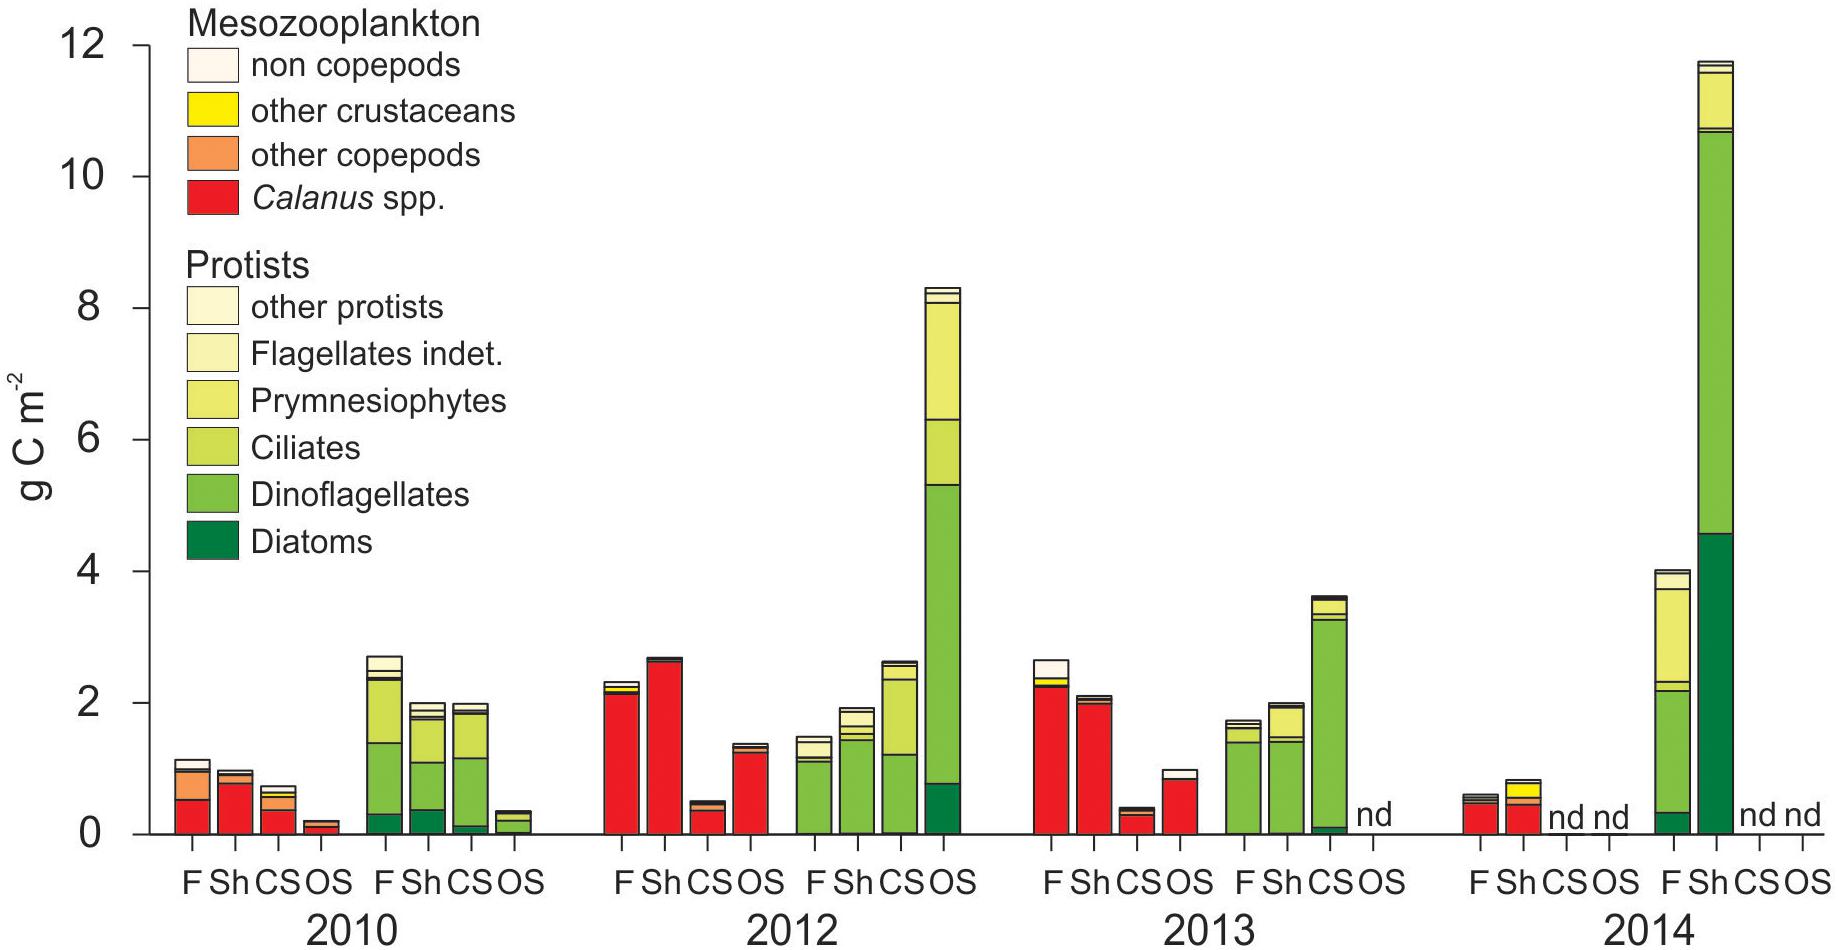
Figure 8. Depth-integrated (0–50 m) protists and mesozooplankton carbon standing stock (g C m-2) in the four regions (F, fjord; Sh, shelf; CS, continental slope; OS, off-shelf) along the transect from Rijpfjorden to the Arctic Ocean in 2010, 2012, 2013, and 2014.
Protist standing stocks in the upper 50 m exceeded zooplankton standing stocks in 2010 and 2014 on all sampled regions, and on the continental slope and off-shelf in 2012 and 2013, while zooplankton standing stocks exceeded protist standing stocks inside the fjord and on the shelf in those years (Figure 8).
Mesozooplankton
In general, zooplankton was more abundant in the fjord and on the shelf than on the continental slope and off-shelf regions, for both meroplankton (Cirripedia nauplii, Echinodermata larvae, Bivalvia veligers) and holoplankton (Table 2). Copepods dominated the zooplankton community in terms of abundance, with Calanus glacialis being the most common copepod in 2012–2014 and Oithona similis dominating in 2010 (Figure 9). Among non-copepods, meroplanktic taxa dominated in terms of abundance in 2012–2014, whereas Fritillaria borealis tended to overrun the community in 2010. Among pelagic predators, chaetognaths were most common, with Parasagitta elegans dominating in the fjord and Eukrohnia hamata in the open water.
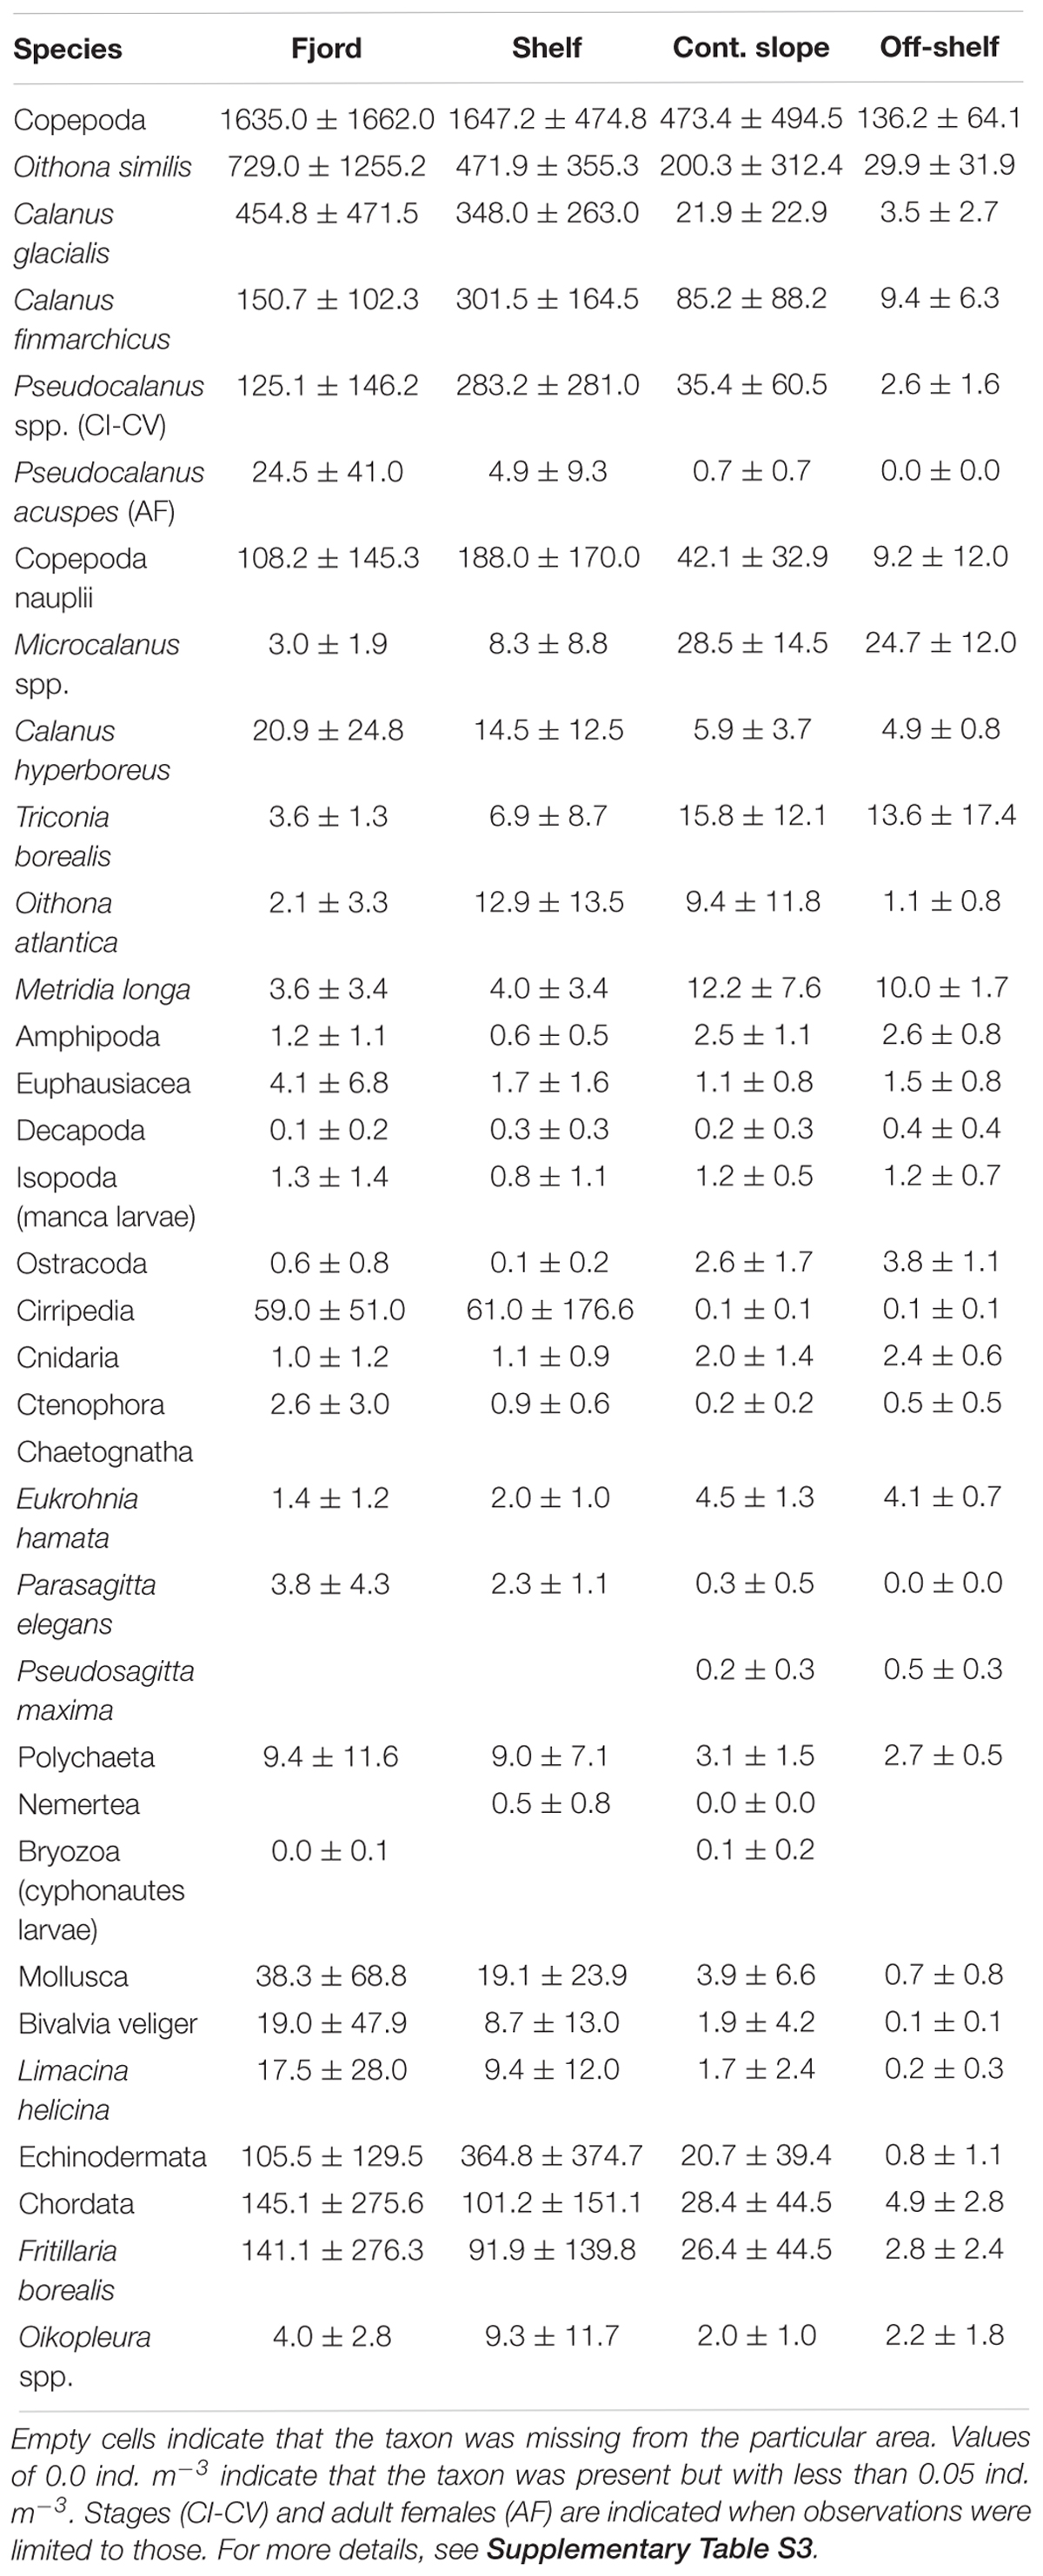
Table 2. Mean zooplankton abundance (ind. m-3) and standard deviation of major taxonomical groups and 16 most abundant taxa across the four areas of the study.
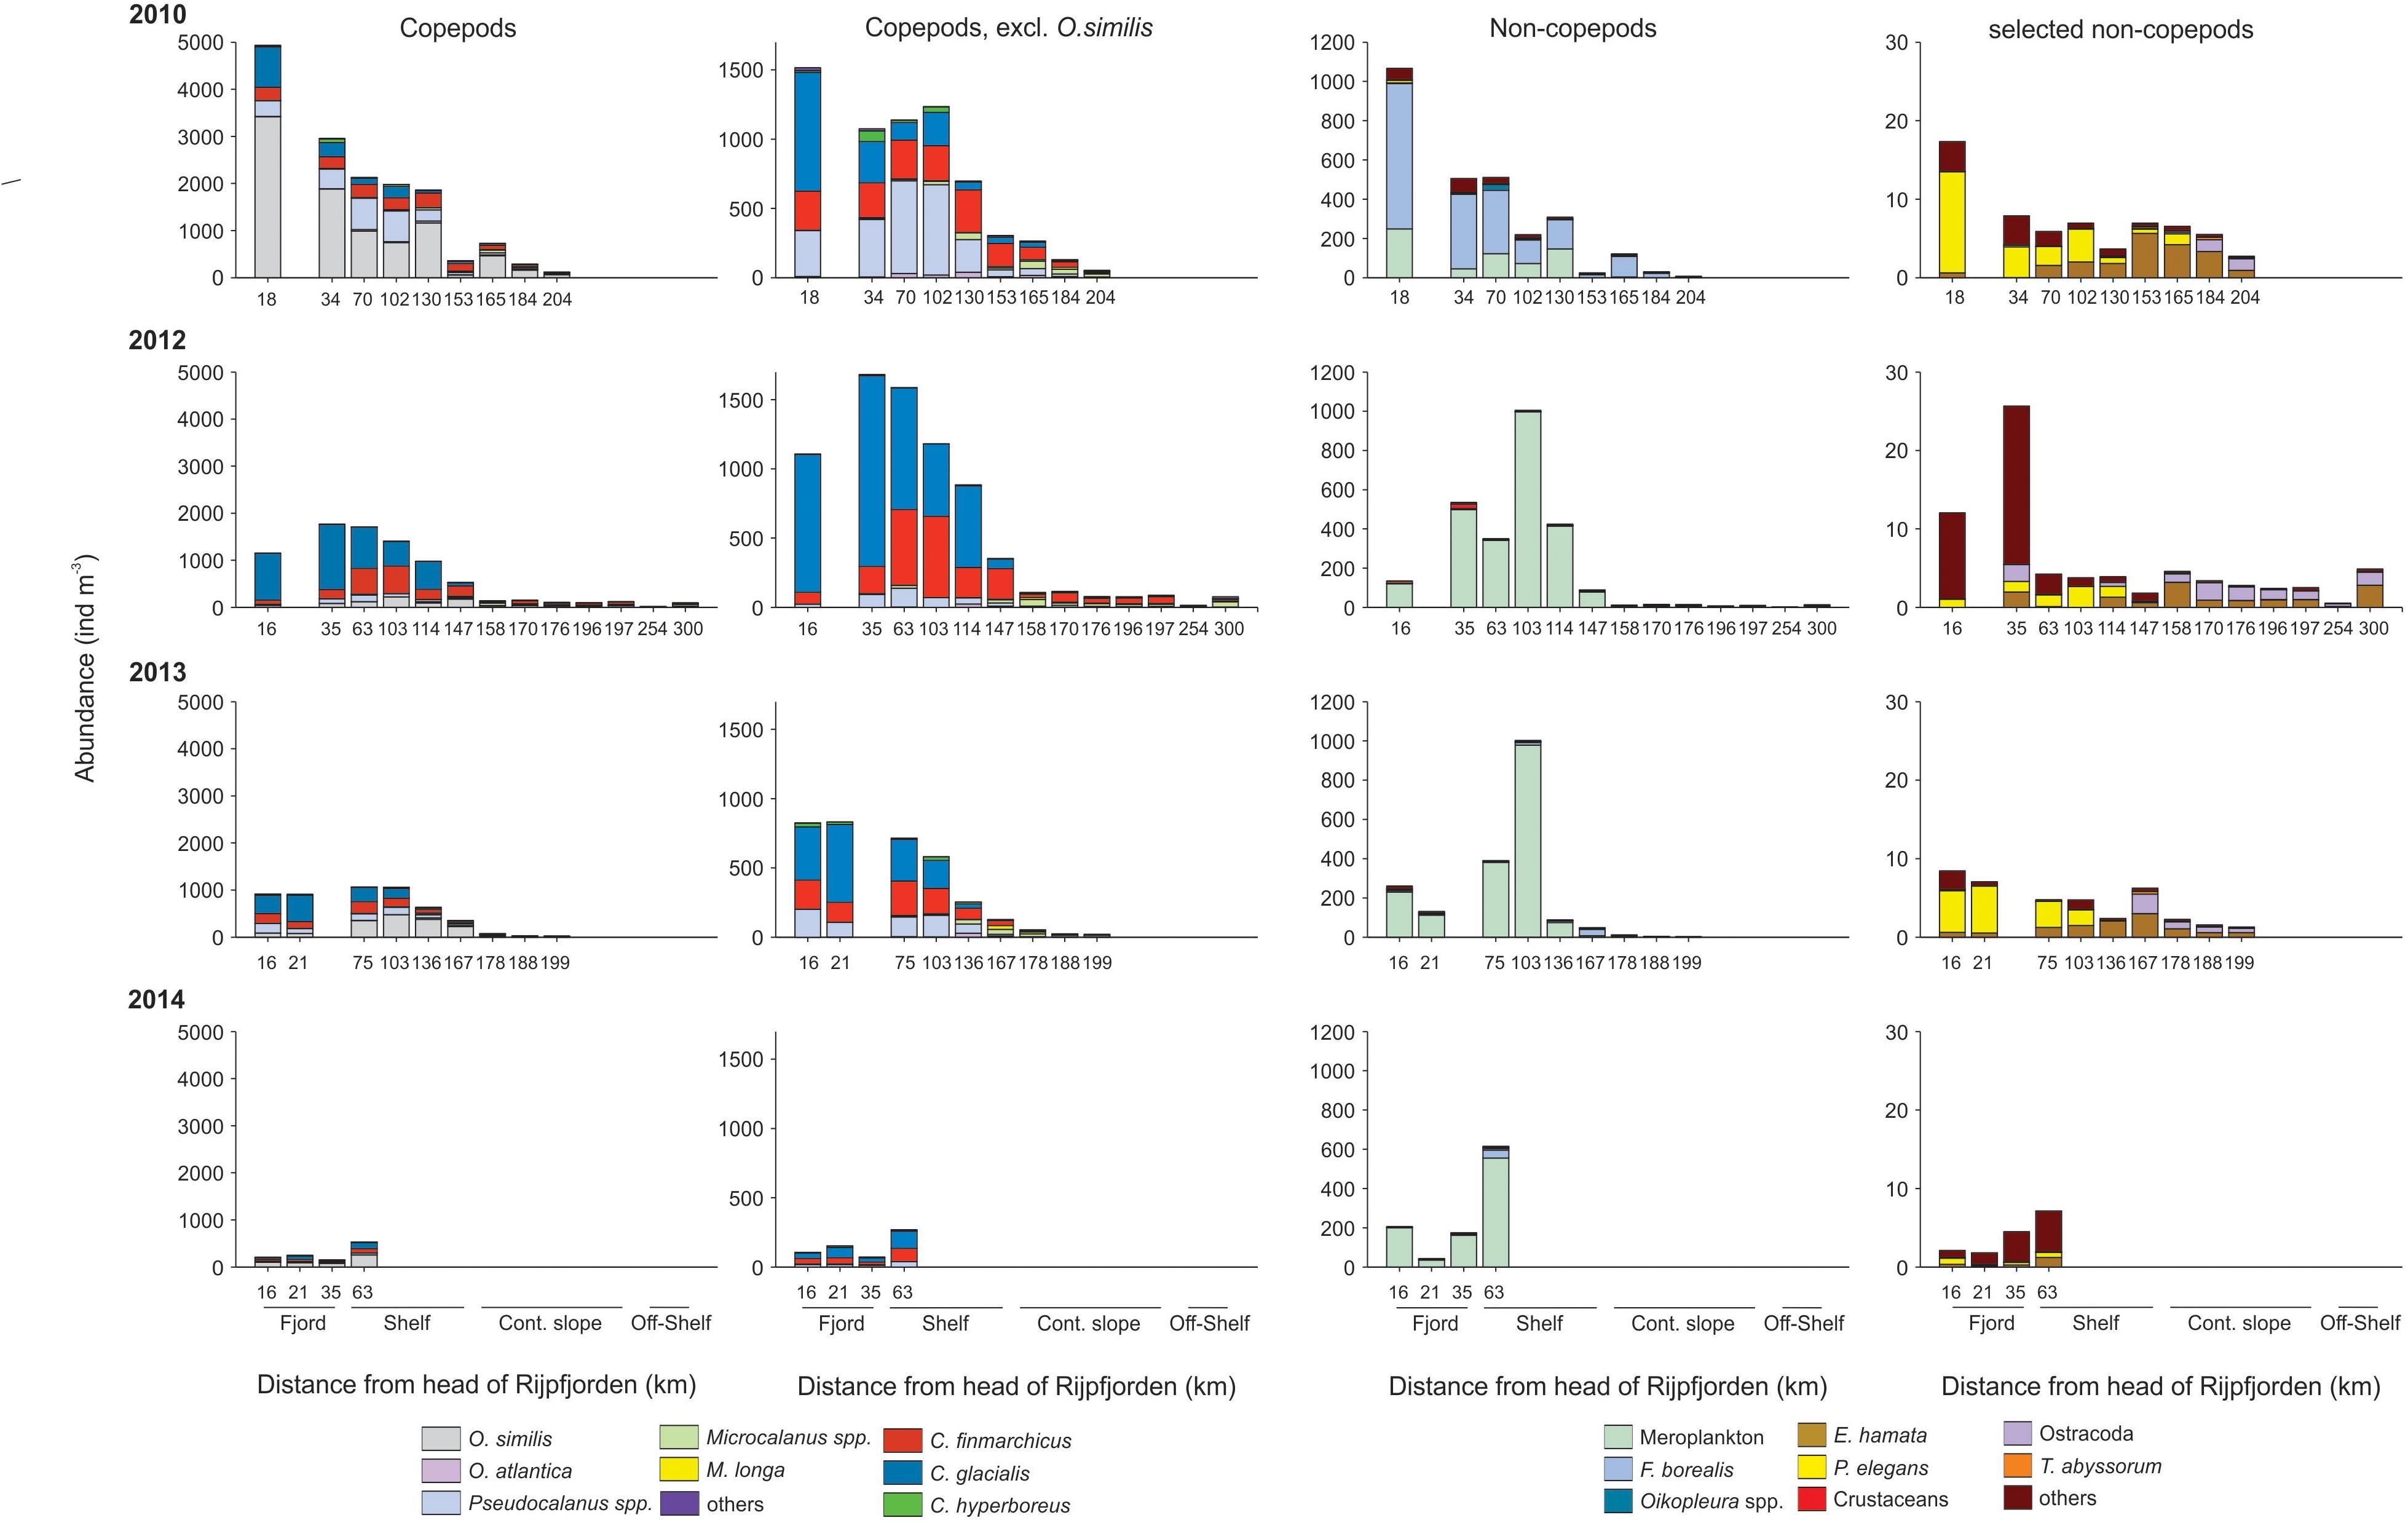
Figure 9. Barplot showing zooplankton abundance (ind. m-3) and species composition at stations sampled along the transects in 2010, 2012, 2013, and 2014. X-axis shows distance of each station from the head of Rijpfjorden. Left column shows composition of most common copepod species. Second left column shows the same but excludes O. similis to enhance readability of other species. The two right columns show species composition of most common non-copepod species.
There were significantly negative relationships between the abundance (log transformed) of C. finmarchicus, C. glacialis, C. hyperboreus, Pseudocalanus spp., O. similis, copepod nauplii, P. elegans, meroplankton, Oikopleura sp., and Limacina helicina and the distance to the head of Rijpfjorden, i.e., the abundance of these species decreased toward the open water (Supplementary Figure S3). In reverse, the abundance of Microcalanus spp., Metridia longa, Ostracods, E. hamata, Triconia borealis, and Themisto abyssorum increased toward open water. The abundance of Oithona atlantica, F. borealis, Aglantha digitale, and Themisto libellula showed no significant trend in distribution along the transect, but in case of the last two species firm conclusions cannot be made because of typically low species abundance.
A comparison of distribution of water masses and zooplankton shows that C. glacialis, P. elegans, and Mertensia ovum occurred in higher numbers in WCW inside the fjord, than outside in association with open ocean water masses (Table 2). The AW along the slope had high abundance of boreal C. finmarchicus, O. similis, and T. abyssorum as well as other oceanic species such as E. hamata and Microcalanus spp.
Zooplankton biomass per unit volume (mg dry mass m-3) was highest inside Rijpfjorden and on the shelf, but dropped at the shelf break (Figure 10A). Outside the fjord, the deeper strata had the largest zooplankton biomass. Zooplankton carbon standing stocks (0–50 m) were dominated by Calanus spp. across all regions and years (Figure 8). Only inside the fjord and on the continental slope in 2010 was the contribution of O. similis comparable to that of Calanus spp. (Figure 8). Among the Calanus species, C. glacialis contributed the most to the total biomass of mesozooplankton in the fjord and on the shelf (Figures 10B, 11A), while its contribution to total zooplankton biomass decreased at the shelf break and further into the deep Arctic Ocean. Calanus finmarchicus contributed 19% of the total Calanus biomass inside the fjord, but in the core of the AW at shelf and intermediate depth of the continental slope, C. finmarchicus and C. glacialis contributed in similar amounts to the Calanus biomass (30–40%; Figure 11B). Calanus hyperboreus contributed generally less to the Calanus biomass in the fjord and on the shelf (∼10%), but contributed substantially off the shelf (70%) (Table 3 and Figure 11C).
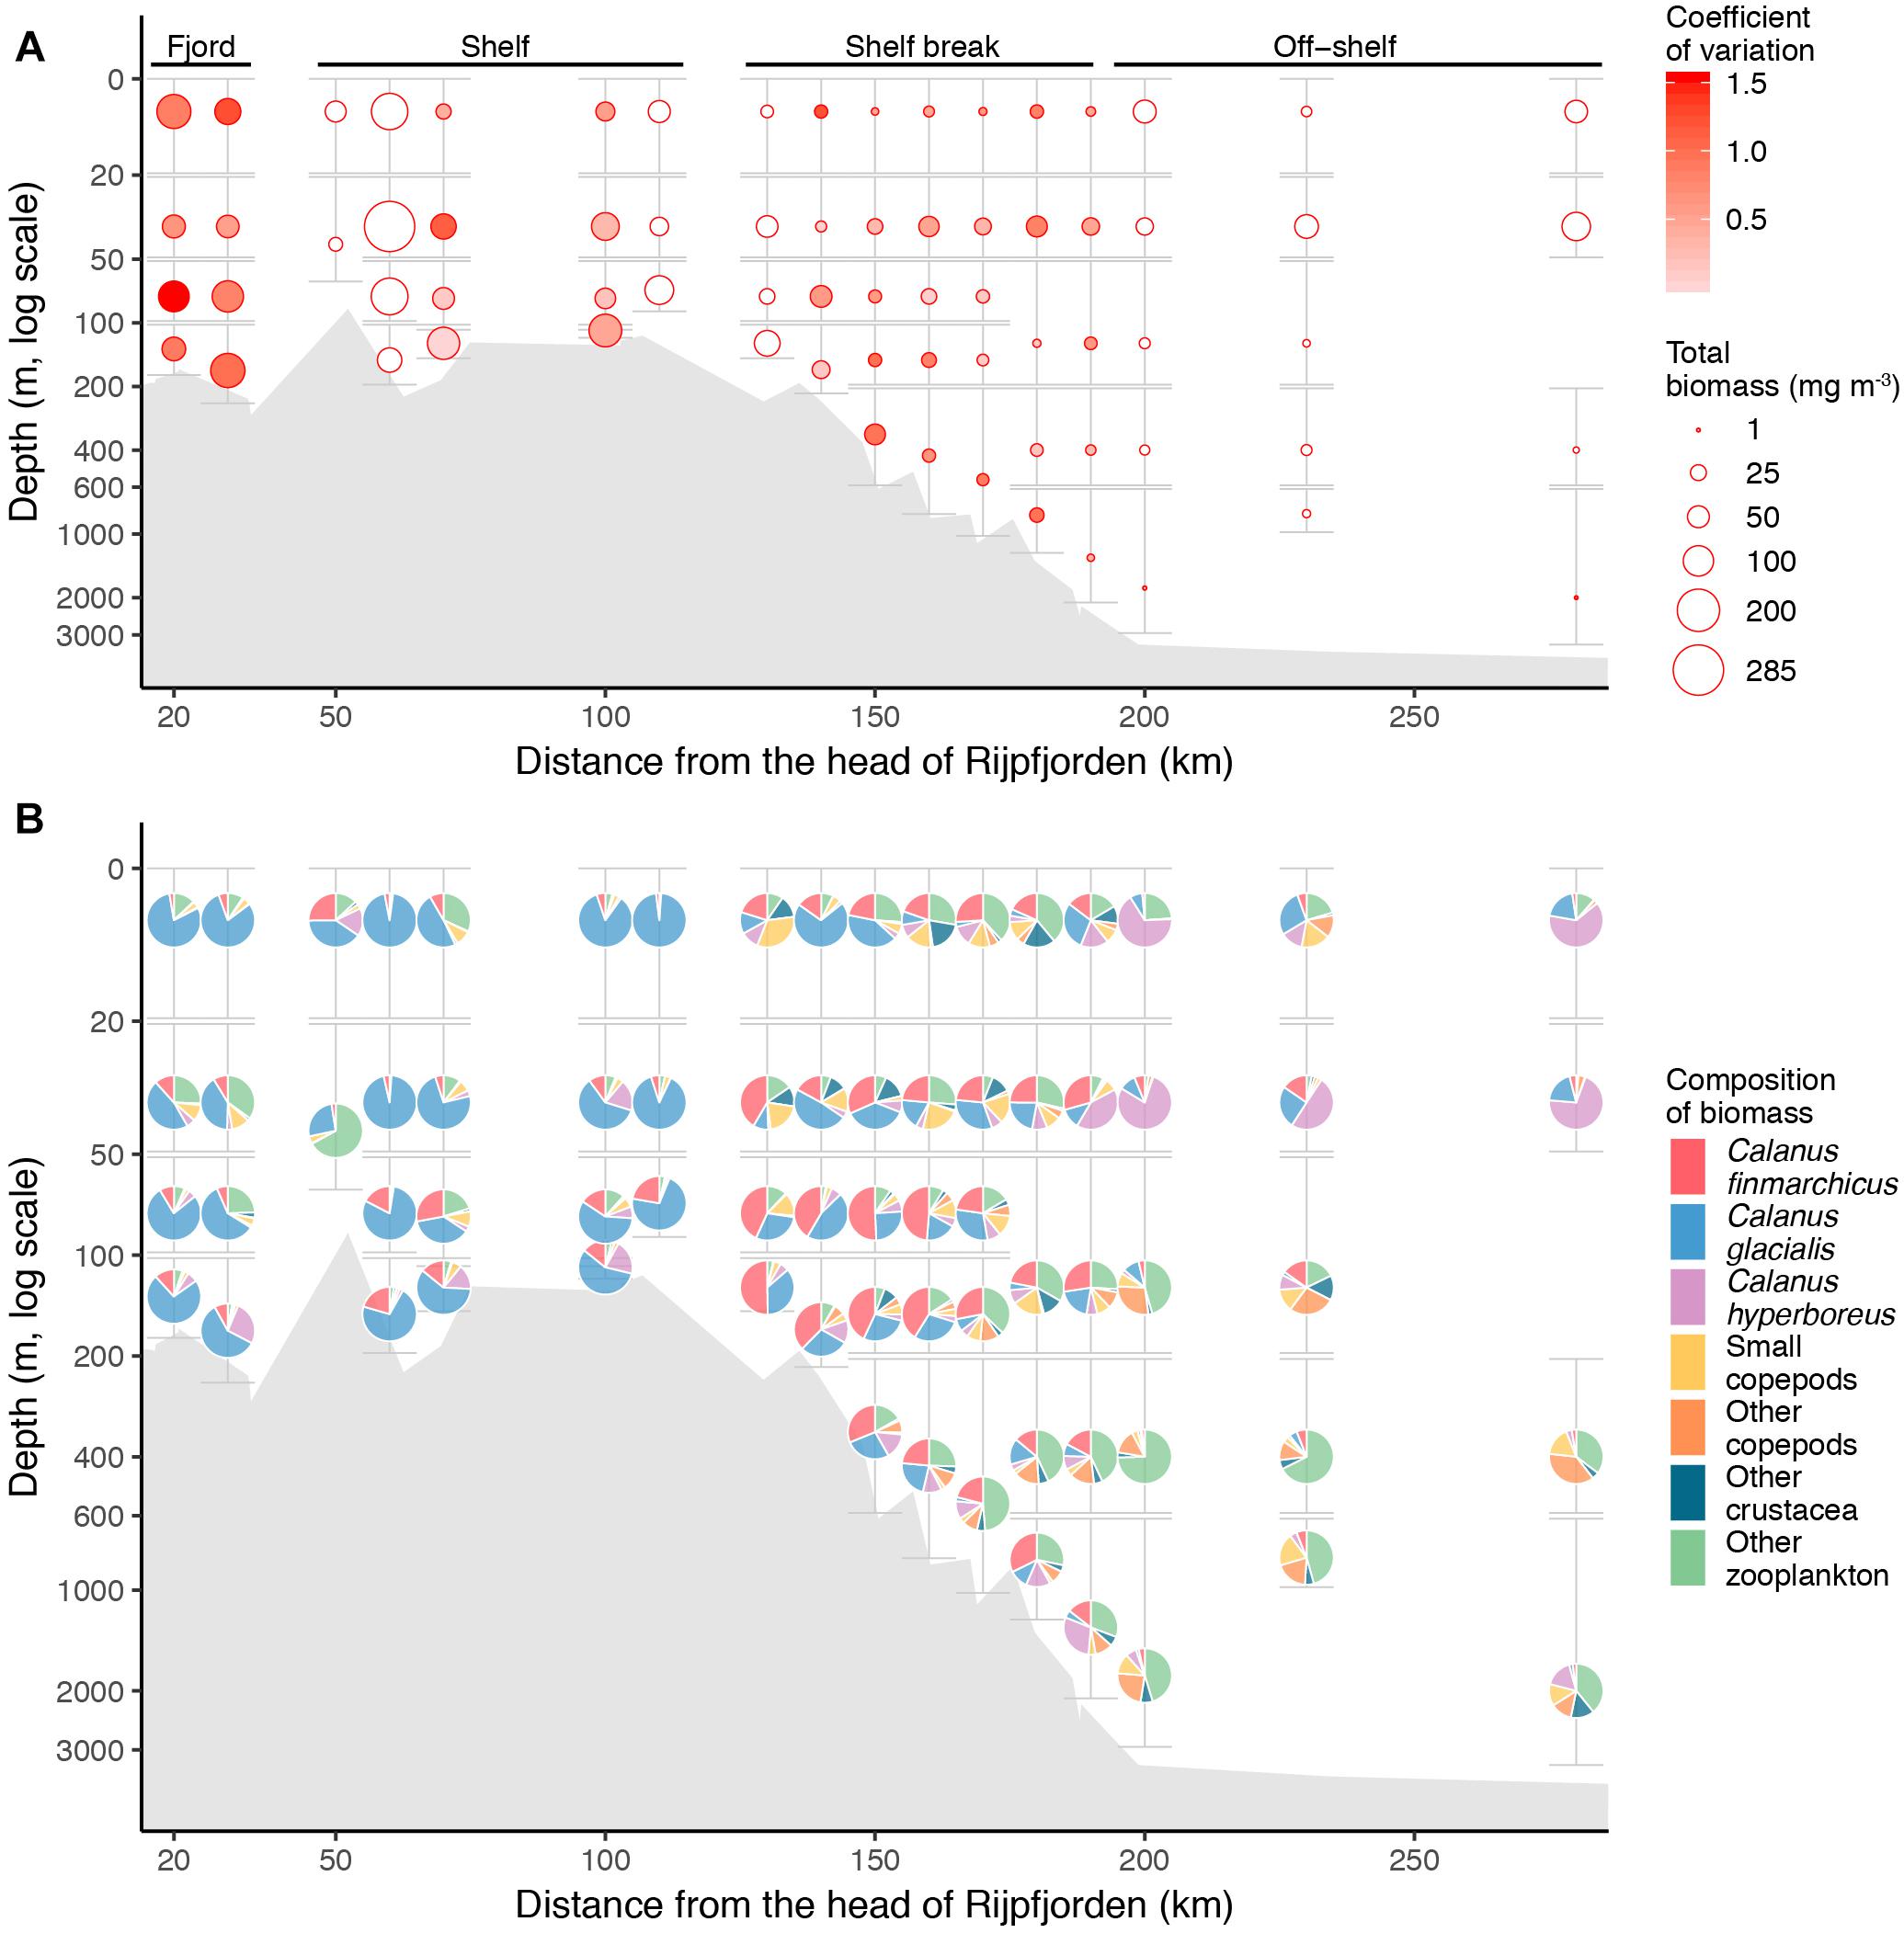
Figure 10. Zooplankton distribution for data from all years combined. (A) Mean total mesozooplankton biomass (mg m-3) and (B) average composition of main groups along the section from Rijpfjorden to the Arctic Ocean. The data are binned using a 10 km horizontal grid and the maximum and minimum vertical range of binned MultiNet samples. The radius of the dots in A is scaled to average biomass (mg m-3, legend giving the range of averages) and the fill is scaled to coefficient of variation. White fill indicates only one sample from a given location. The height of error bars indicate the maximum and minimum vertical range of binned MultiNet samples, while the width of the error bars indicates the width of horizontal binning. Empty space indicates that sample from that stratum was lost.
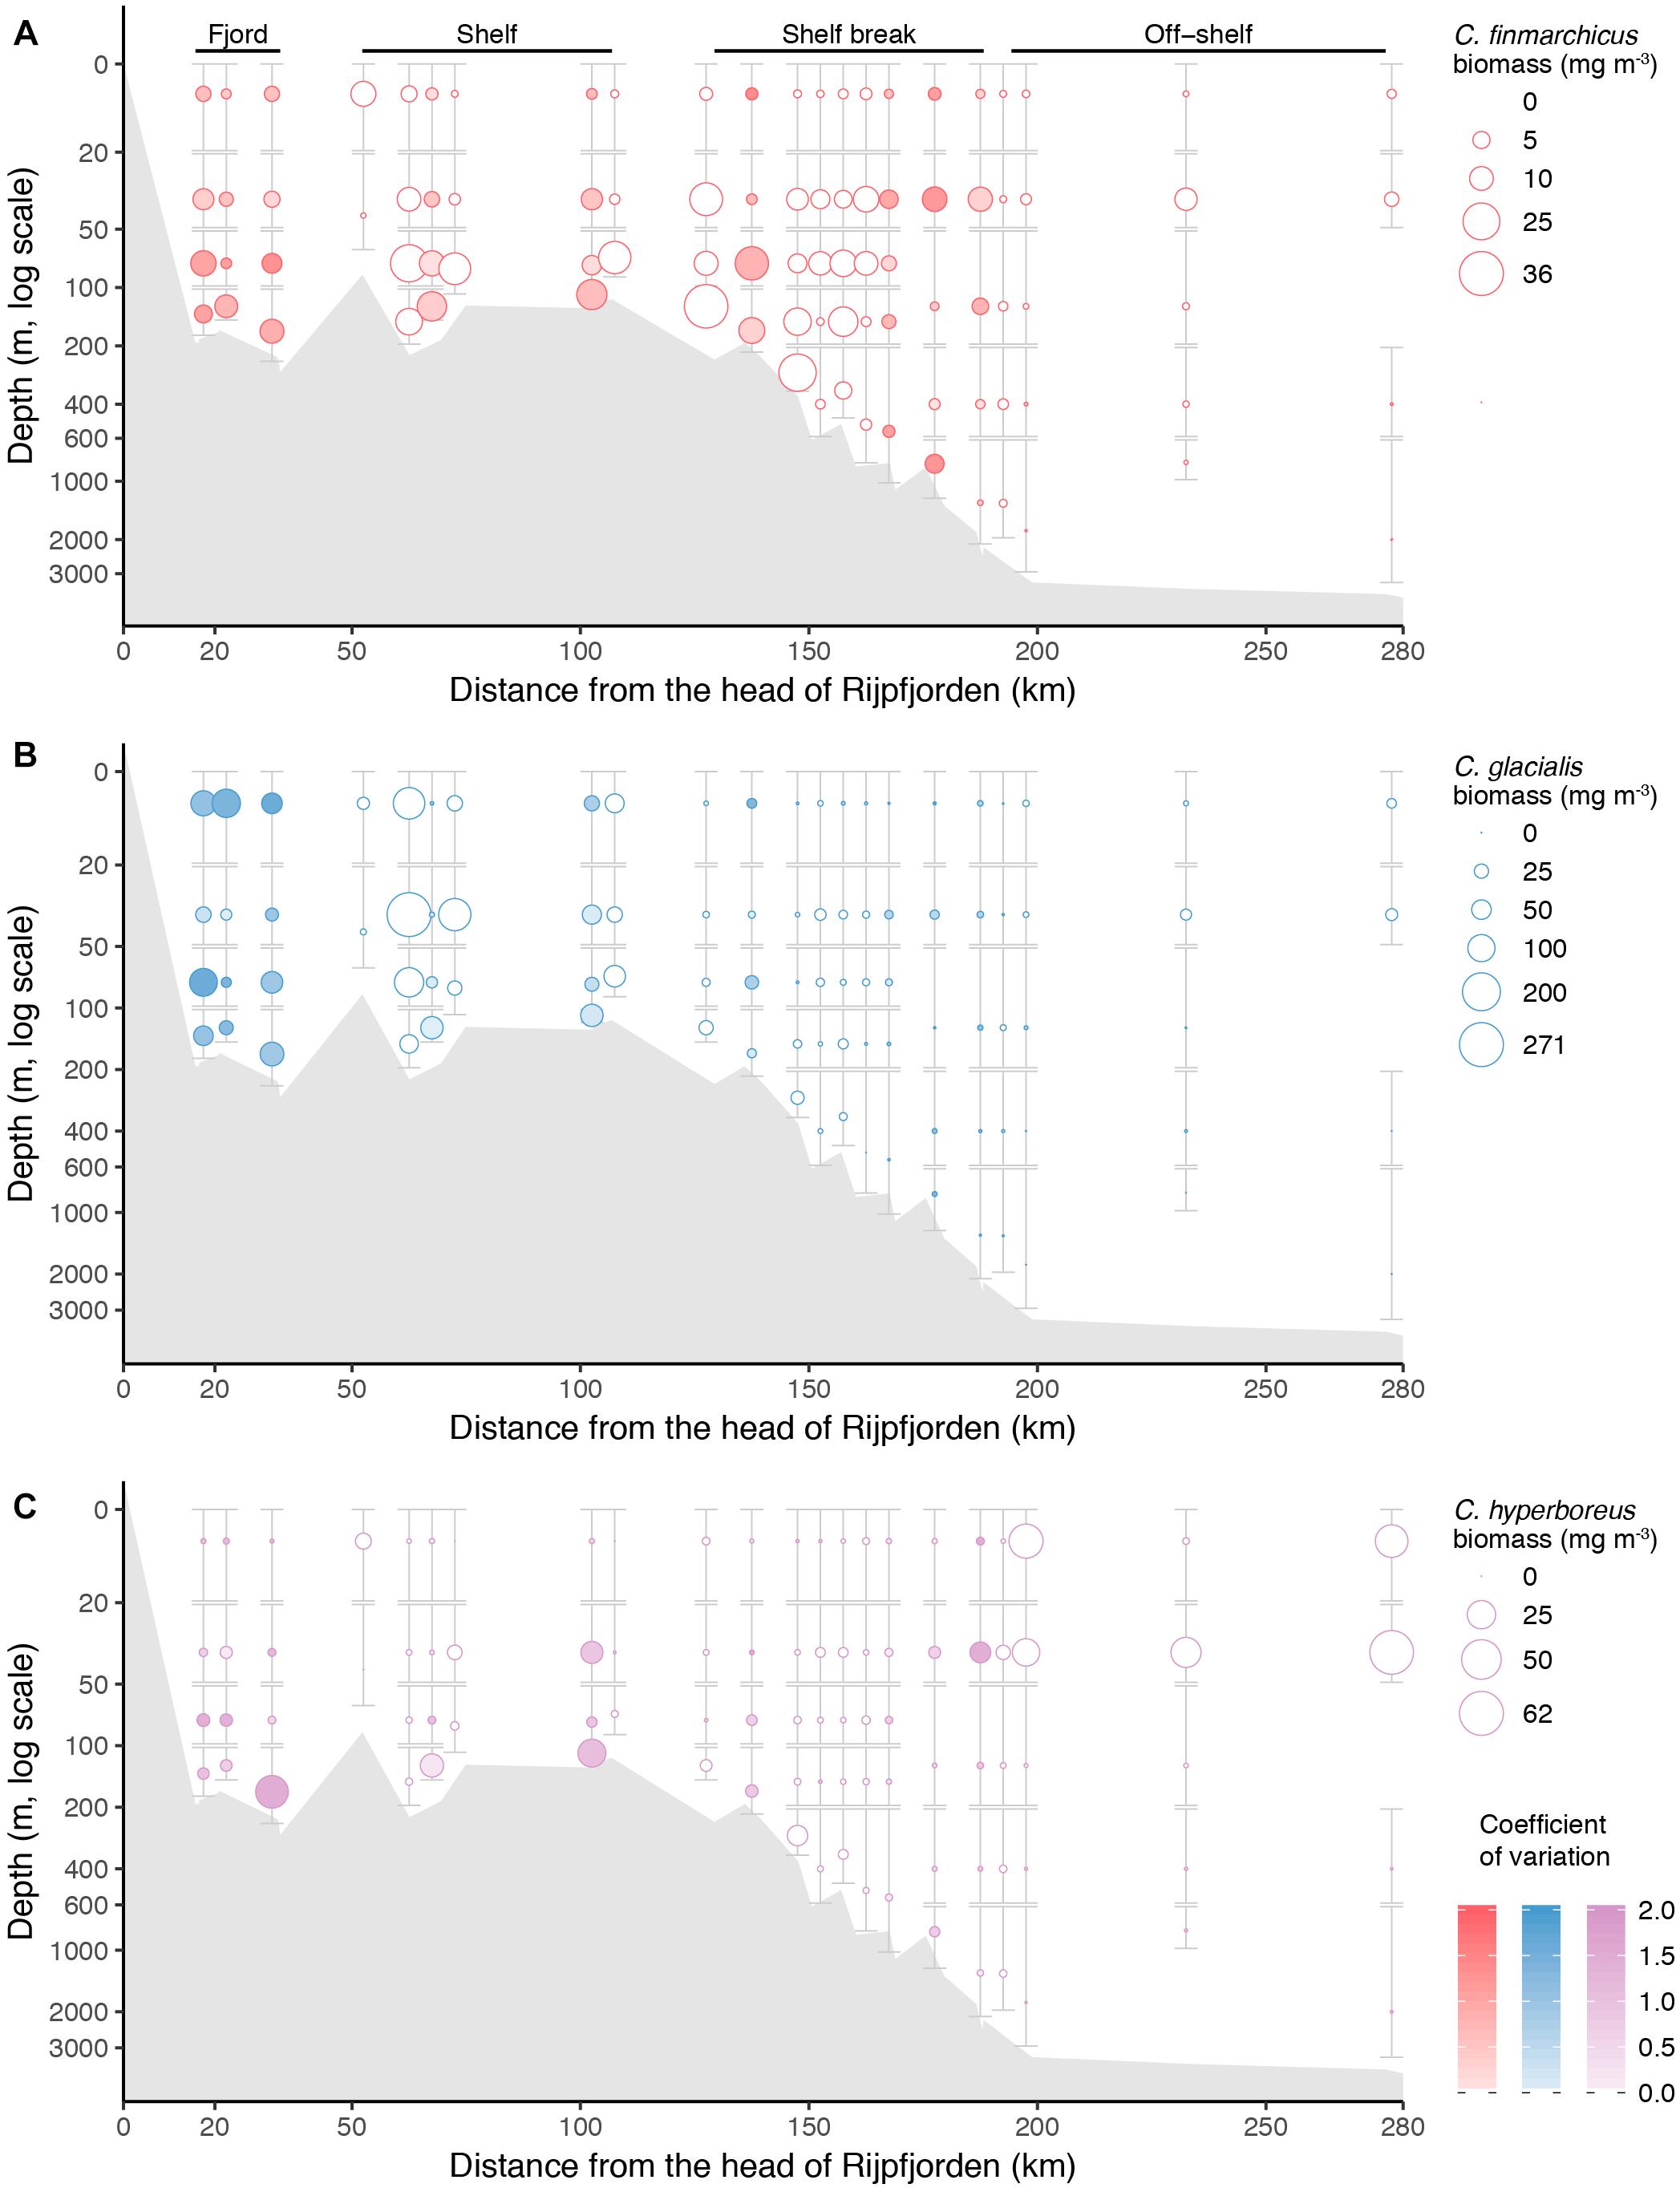
Figure 11. Biomass (mg m-3) of the three Calanus species along the transect from Rijpfjorden to the Arctic Ocean with data from all years combined. (A) C. finmarchicus, (B) C. glacialis, and (C) C. hyperboreus. See Figure 10 for explanation of figure elements.
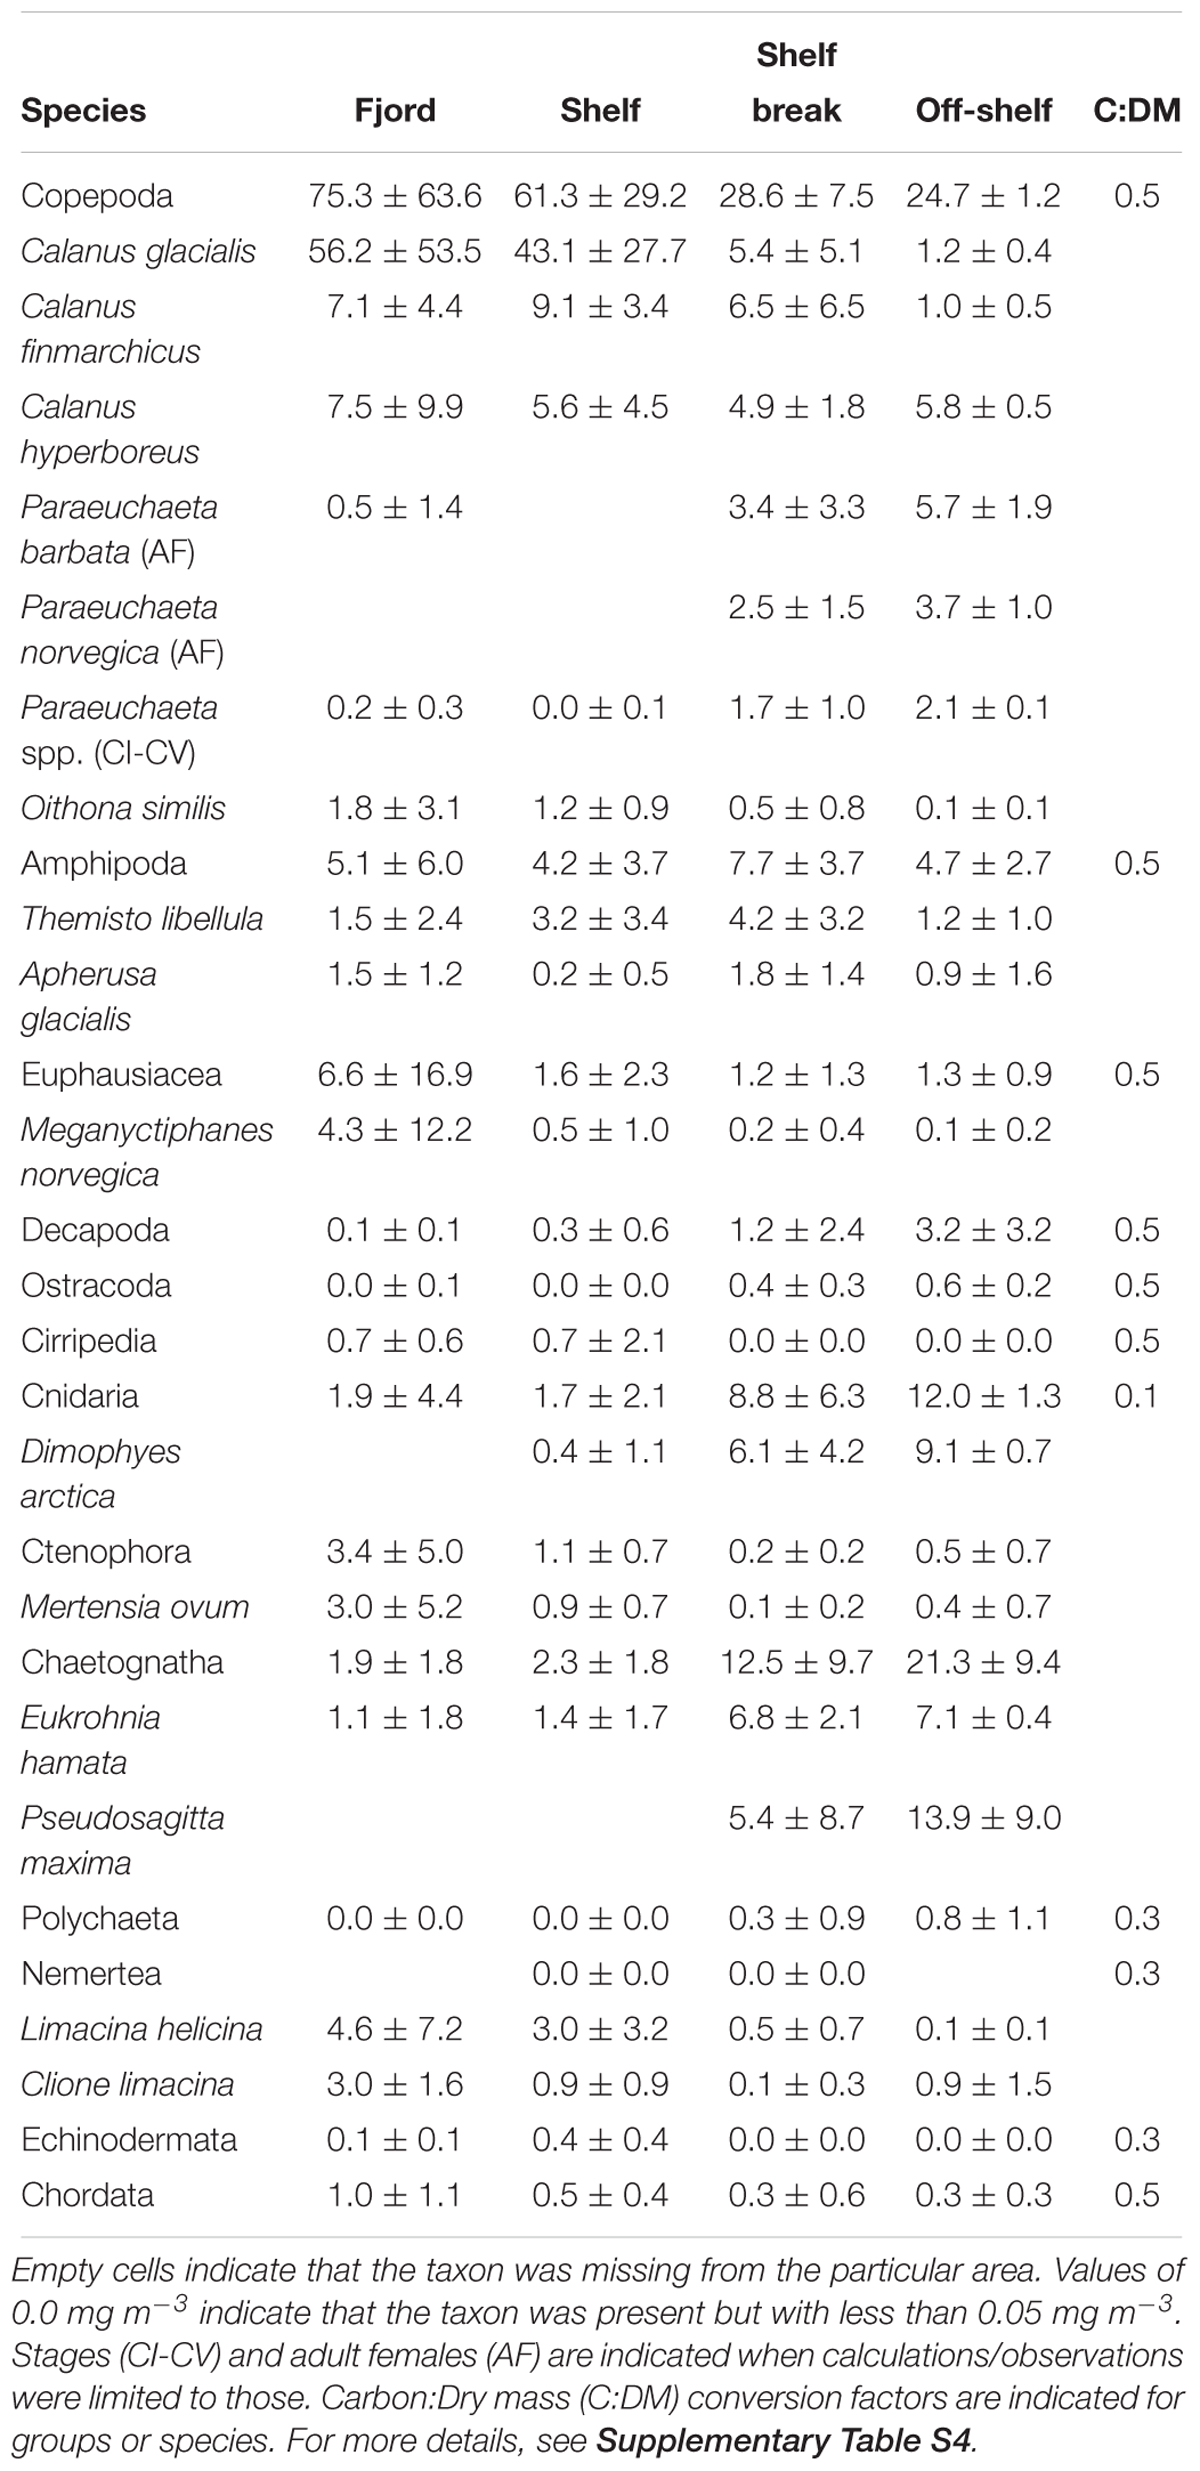
Table 3. Mean zooplankton biomass (mg dry mass m-3) and standard deviation of major taxonomical groups and 18 taxa with most biomass across the four areas of the study.
The Shannon-Wiener diversity indexes for fjord, shelf, slope and off-shelf regions were 2.04, 2.14, 2.05, and 2.36 nats ind.-1, respectively, whereas corresponding evenness values were 0.49, 0.53, 0.45, and 0.52. The number of taxa for those four regions were: 64, 57, 96, and 95. Thus, higher diversity, was found toward the open ocean and this was reflected in higher diversity index for AW (2.20) than ArW (2.07). Abundance-biomass ratios for the distinguished regions were: 134, 145, 110, and 114 ind. mg-1. This indicates that the average size of zooplankton taxa was smaller in the fjord and shelf than over the slope and open ocean, which likely reflected the substantial contribution of small-sized Oithona similis and meroplankton closer to the coast.
Discussion
Variations in Atlantic Water Boundary Current
The AW Boundary Current has been shown to vary considerably on small temporal and geographical scales, both when comparing nearby transects from the same cruise (Pérez-Hernández et al., 2017) and from mooring time series (Renner et al., 2018). Short-term variability due to meandering (Pérez-Hernández et al., 2017) as well as eddies (Våge et al., 2016; Crews et al., 2017) affect the position and extent of the AW core. It is therefore difficult to diagnose variability in e.g., advected volume of AW to the region based on single transects occupied in different years; the only published time-series from moorings in the boundary current are from summer 2012–2013 (Renner et al., 2018), hence covering only part of the period between the 2012 and 2014 cruises presented in this study.
The results of the Regional Arctic System Model (RASM), a fully-coupled sea ice-ocean model for the Arctic (Cassano et al., 2017), indicate that the sea ice concentration and volume during the 8 months preceding the survey were the highest in 2014 and 2010 and the lowest in 2013, compared to the average during 1997–2016. On the other hand, anomalies in net heat transport, calculated for a fragment of the study section from the edge of the shelf to the 1000 m isobaths, for the 100–600 m layer, were the highest in 2012 and the lowest in 2014. This suggests that the amount of Atlantic water transported eastward into the Arctic Ocean was the largest in 2012 and the least in 2014.
Sea ice cover and the position of the Marginal Ice Zone (MIZ) are strongly dependent on the position and depth of the AW Boundary Current as well as wind conditions in case of the MIZ position. Warming of the AW and heat loss to the atmosphere are the major drivers of sea ice reduction in this area, whereas local winds showed no significant temporal trends (Onarheim et al., 2014). Regional sea ice cover does have a profound impact on surface layer temperatures, melt water volume and hence onset of the spring bloom and consumption of nutrients (Søreide et al., 2010). In this respect, summer 2014 stands out as very different from the preceding years in that the sea ice cover persisted until late summer in the region. Over other parts of the Arctic, sea surface temperatures were not particularly unique in 2014, except for cooler-than-average conditions in the northern Barents and Kara seas where the ice remained extensive compared to recent summers3.
Physical-Chemical Setting
The PSW layer was characterized by low salinity due to sea ice melt and, potentially, glacier run-off inside the fjord, and extended across the entire study area. Nutrients and Chl a levels were low and pH and ΩAr values were high in PSW indicative of the summer post-bloom situation and the Chl a maximum was situated at the bottom of the euphotic zone coinciding with the nutricline. This indicates that phytoplankton optimized growth near the limit of the euphotic depth, where the algae still had access to nutrients. The subsurface Chl a maximum is a prominent feature in the Arctic Ocean during summer (Arrigo et al., 2011; Ardyna et al., 2013).
Doming of the isopycnals associated with the AW inflow at the shelf break and over the upper slope resulted in elevated NOx concentrations toward the surface (Randelhoff et al., 2015) reflected in elevated subsurface Chl a levels, relative to the other stations in 2010 and 2013. The low NOx:PO4 ratio in PSW, well below the 16:1 Redfield ratio, indicates that nitrogen was the limiting nutrient in summer, which is in accordance with nitrogen being the main limiting nutrient of primary production during summer in the Arctic Ocean at large (Codispoti et al., 2013; Vancoppenolle et al., 2013). Nutrient versus salinity plots (Supplementary Figure S4) suggest that the fjord, shelf and continental slope are biogeochemical sinks for NOx and silicic acid in PSW, which was the water mass with the lowest NOx:PO4 molecular ratios. The sharp increase in nutrients in PSW for salinities >33 shows that higher salinity water types are the main nutrient source for this region and not freshwater drainage from land or from glaciers; higher salinity waters were found near the lower boundary of the PSW layer.
Variations in Chl a Biomass and Protist Community Composition
The low surface Chl a concentrations and a protist community dominated by nanoplanktonic dinoflagellates (gymnodiniales), ciliates and prymnesiophytes are typical for the late summer post-bloom situation in the high-Arctic (Owrid et al., 2000; Piwosz et al., 2009, 2014; Kubiszyn et al., 2017). During these oligotrophic conditions, the protist plankton is characterized by a regenerating community that efficiently recycles nutrients between small autotrophs and their protozoan grazers. Inter-annual differences in Chl a levels can largely be attributed to differences in the length of the open water season. Year 2010 in our data was characterized by the lowest surface nutrient and Chl a concentrations as sampling this year was latest in the season (mid to end of August), which was also reflected in elevated surface temperatures. In contrast, the high Chl a concentrations at the outer fjord and inner shelf in the coldest year 2014 were associated with large amounts of pack ice in the neighboring Arctic Ocean and proximity to the ice edge. Interestingly, the two dominant diatoms Fragilariopsis oceanica and Shionodiscus bioculatus in the subsurface blooms in 2014 are both cryo-pelagic species (Syvertsen, 1991; von Quillfeldt, 2000; Fernández-Méndez et al., 2018) indicating that they might have originated from sea ice. However, the fact that the Chl a maxima were found at subsurface depths with surface nutrients already largely depleted indicate a late bloom situation. Prymnesiophytes (in particular Phaeocystis pouchetii) and diatoms often had a higher biomass-share at subsurface depths. Access to elevated nutrient concentrations associated with the nutricline is the most likely explanation for the distributional patterns of these two taxa. The post-bloom P. pouchetii dominance has also been reported from other areas, such as waters adjacent to west Spitsbergen (Smoła et al., 2017).
Variations in Zooplankton
The zooplankton community in northern Svalbard waters consists of a mixture of boreal, boreo-Arctic, Arctic and ubiquitous species (Daase and Eiane, 2007; Blachowiak-Samolyk et al., 2008), and the community composition along the transect did not deviate from this pattern. Shannon-Wiener diversity and number of taxa were higher toward the continental slope and Arctic Ocean than on the shelf and inside Rijpfjorden. This partly reflected higher values of Shannon-Wiener diversity in Atlantic water, where one tends to find higher diversity of boreal species as well as the presence of Arctic species. The ubiquitous copepod O. similis dominated in terms of numbers, while biomass was dominated by Calanus spp., with the Arctic shelf species C. glacialis dominating inside Rijpfjorden where PSW and WCW prevailed. The Atlantic C. finmarchicus, which is advected into Rijpfjorden along with AW waters (Falk-Petersen et al., 2008), constituted a similar biomass to C. glacialis on the shelf and over the continental slope, in association with the AW Boundary Current. The biomass of C. glacialis on the continental slope was comparable to that of C. finmarchicus, which was not as expected since its contribution in terms of abundance was relatively low (Table 2). The smaller boreal species was about 4 times more abundant than C. glacialis over the continental slope. However, because the biomass of C. glacialis is on average 3.2 times the biomass of C. finmarchicus, as for older life stages CIV-AF (Falk-Petersen et al., 2009), its low abundance results in relatively high biomass (Table 2). North-east of Svalbard, C. finmarchicus may still contribute 40% to the total mesozooplankton biomass (Kosobokova, 2012) before its biomass diminishes rapidly en route to the Nansen Basin, to approximately 10%. There, the contribution by C. glacialis is higher, about 19% (Kosobokova and Hirche, 2009).
Seasonal changes in Rijpfjorden have been described with regard to zooplankton abundance (Leu et al., 2011; Weydmann et al., 2013). Calanus glacialis dominates inside the fjord and at the shelf during all seasons, whereas C. finmarchicus increases toward the shelf break, with the highest numbers found in the core of the AW at the shelf break during autumn (Weydmann et al., 2013; NPI unpubl. data). Small copepods (O. similis, O. atlantica, Microcalanus spp., Pseudocalanus spp., and T. borealis/Oncaea spp.) make up a large fraction of the relative abundance during all seasons, especially in autumn and winter, but contribute little to the total biomass. During winter, the zooplankton community in the fjord is dominated by smaller copepods such as Pseudocalanus spp., and Calanus species, with C. glacialis making up 40% of the biomass (Weydmann et al., 2013). The occurrence of C. finmarchicus in Rijpfjorden is likely dependent on replenishment, in summer and autumn, by inflowing Atlantic water and less on local production. Weydmann et al. (2013) observed late developmental stages in September-October, indicating that this boreal species most likely overwinters in Rijpfjorden. There have also been observations showing high abundance of C. finmarchicus in January (Daase et al., 2014, 2018). This is most likely associated with stronger advection of Atlantic waters in autumn and winter (Basedow et al., 2018; Renner et al., 2018). However, the winter mortality of Calanus spp., can be high (e.g., Daase et al., 2014), and abundance of C. finmarchicus has been found to be very low in spring and early summer (Leu et al., 2011; Weydmann et al., 2013). Physical conditions in Rijpfjorden, such as sub-zero temperatures and a seasonal ice cover causing algal blooms and reproductive events for zooplankton to occur later in the season (Leu et al., 2011; Daase et al., 2013), likely put constrains on this boreal species.
The zooplankton composition showed variability among years. High abundances of O. similis and F. borealis occurred in 2010. The high abundance of O. similis indicates that conditions may have been favorable for omnivorous grazers in summer of 2010 compared to the other years. One likely explanation is that sampling was conducted relatively late in 2010 (mid-August), thus the zooplankton community was in a different state of its annual cycle and many of the larger Calanus species might have already started their seasonal descent to greater depths. Furthermore, O. similis is known to preferentially feed on motile prey such as ciliates and dinoflagellates (Svensen and Kiørboe, 2000), which dominated protist standing stocks in 2010. Fritillaria borealis often appears in pulses, which has been related to its high fecundity and growth rates resulting in short generation time (Hopcroft and Roff, 1995). Populations of larvaceans have also been reported to increase rapidly in response to bacterio- and nanophytoplankton blooms (King, 1982). Sampling in 2010 likely coincided with such a larvacean “bloom.” If this is a common occurrence in Rijpfjorden, and was just missed in the other years, is unknown.
The abundances of zooplankton in Rijpfjorden were generally low in 2014 compared with the other years. Low temperature and late ice break up likely led to less favorable conditions for growth and development. The abundance of C. glacialis has been shown to vary with the timing of ice break up, with cold years potentially leading to a mismatch between recruitment and spring bloom with reduced reproductive success and survival (Søreide et al., 2010; Leu et al., 2011). This would also negatively affect boreal species, such as C. finmarchicus. However, this did not seem to affect the recruitment of the benthic community, as meroplankton abundance was quite similar between 2012, 2013, and 2014. The lowest meroplankton abundance was observed in 2010, but sampling that year was conducted later in the season when the development of benthic larvae had most probably advanced beyond pelagic life stages.
The zooplankton community in Svalbard waters and the Arctic Ocean can be considerably influenced by Atlantic expatriates (Wassmann et al., 2015). Time series data from the core of WSC in Fram Strait indicate that an increase in warming will likely lead to an increase in Atlantic and ubiquitous species such as C. finmarchicus and O. similis, respectively (Weydmann et al., 2014; Gluchowska et al., 2017a). During a warm event in 2011, there were more young copepodids of C. finmarchicus in the WSC (Gluchowska et al., 2017a). Basedow et al. (2018) estimated that approximately 500,000 tons C y-1 in form of C. finmarchicus are transported through Fram Strait into the Arctic. A considerable part of this biomass is transported along the continental margin north of Svalbard, with some redistribution onto the shelf including Rijpfjorden. The abundance of C. finmarchicus in the upper 600 m in the off-shelf region varied between 10,600 ind. m-2 in 2013, 13,800 ind. m-2 in 2010 and 39,400 ind. m-2 in 2012. These value are lower than what Basedow et al. (2018) observed in August 2014 in the core of the WSC west of Svalbard (28,000–118,000 ind. m-2), although the 2012 values fall into the lower range of those observations. The transport time from Fram Strait to the western Nansen Basin is about 3 weeks (Hattermann et al., 2016). Based on our lowest and Basedow et al. (2018) highest estimates we can assume that minimum 10% of the C. finmarchicus abundance transported along the west coast reaches the area north of Rijpfjorden, but based on mean values for our observations and the range reported in Basedow et al. (2018) it could be higher, likely around 30%. A decrease in abundance between the west and north coast is to be expected as the WSC is splitting into different branches north of Svalbard and some of these recirculate into Fram Strait (Hattermann et al., 2016; von Appen et al., 2016). Part of this loss can also be associated with grazing by populations of larval fish and other pelagic zooplanktivorous grazers (e.g., jellyfish and amphipods) following the AW flow (Basedow et al., 2018). The zooplankton have to pass concentrations of Atlantic cod (Gadus morhua) and their prey, as well as mesopelagic concentrations of fish and predatory zooplankton at the NW corner of Spitsbergen and along the northern continental shelf (Ingvaldsen et al., 2017; Knutsen et al., 2017). Diel vertical migration for mesopelagic predators in Fram Strait involved the lower part of the north-flowing AW (Gjøsæter et al., 2017). Seabirds, such as the little auk (Alle alle), prey on Calanus spp. in the upper part of the water column (e.g., Hovinen et al., 2014).
The population of C. finmarchicus diminishes further as it is transported eastward along the Siberian shelf, and this species has not yet been observed to reproduce successfully in the Arctic Ocean (Hirche and Kosobokova, 2007; Kosobokova and Hirche, 2009). Thus, it is believed that the population of this species is maintained because of continuous advection (Wassmann et al., 2015). However, recently some zooplankton have shown reproductive activity at high-Arctic latitudes, including krill Thysanoessa raschii and the pelagic amphipod Themisto compressa (Buchholz et al., 2012; Kraft et al., 2013). With increased warming, C. finmarchicus may potentially produce two generations in 1 year, by populations inhabiting Atlantic waters in the WSC along the west coast of Spitsbergen (Gluchowska et al., 2017a), and this second reproduction may result in the presence of active, older developmental stages in the middle of winter in surface waters in Fram Strait (Basedow et al., 2018), even if the chances of these instars to survive are probably limited. Furthermore, changes in generation length and population turnover time due to climate warming may diminish the differences in size and lipid content between C. finmarchicus and C. glacialis and make the Calanus-based food chains more efficient (Renaud et al., 2018).
With regard to ocean acidification effects on northern and Arctic crustacean zooplankton, no studies have shown severe effects. Runge et al. (2016) found no effects of elevated CO2 on vital rates of C. finmarchicus. Bailey et al. (2017) determined that early life stags of C. glacialis were largely unaffected by increased CO2, and Thor et al. (2018b) found no maternal or direct effects of ocean acidification on egg hatching for this species. Weydmann et al. (2012) also found that CO2-induced seawater acidification had no significant effect on egg production of C. glacialis. However, Thor et al. (2018a) detected negative effects of OA on scope for growth in C. glacialis copepodid stage IV at pH 7.87, and Weydmann et al. (2012) noted delayed hatching and possibly reduced overall hatching success for this species at lower pH of 6.9. Opstad et al. (2018) showed little effect of ocean acidification (high CO2 levels, low pH) on the northern krill T. inermis. However, the low ΩAr saturation value (0.98) observed in surface waters in this study may affect the aragonite-shelled pteropod L. helicina, which has a critical ΩAr limitation of 1.4 (Bednarsek et al., 2014).
Nutritional Status and Successional Stage of High-Arctic Plankton Communities During Summer
Although we do not have information on the nutritional mode of the different protist taxa, it can be assumed that the majority of ciliates and a large fraction of dinoflagellates were characterized by heterotrophic or mixotrophic feeding modes. The same applies to the unidentified flagellates. Thus, with the possible exception of the subsurface blooms in 2014, the planktonic communities along the transect from Rijpfjorden into the Arctic Ocean were net heterotrophic which is consistent with net community production measurements for the Svalbard region in summer (Vaquer-Sunyer et al., 2013). The protist carbon to Chl a ratio was generally well above 50, which indicates nutrient limitation but also that a large fraction of the protist biomass was composed of heterotrophs. The 4 years included in this study cover a seasonal gradient from the late bloom phase in the heavy ice year 2014 characterized by subsurface blooms of diatoms and Phaeocystis pouchetii and low biomass of larger copepods likely due to less successful recruitment (Leu et al., 2011), to the late post-bloom phase in 2010 characterized by low protist standing stocks, the larger copepods residing at depth and the zooplankton community predominated by small-sized taxa (e.g., Oithona similis, and Fritillaria biorealis; Supplementary Figure S5). The years 2012 and 2013 fell somewhere in between these two scenarios and had the highest surface zooplankton standing stocks. Our study illustrates how differences in ice cover can modulate phyto- and zooplankton phenology and that the late summer plankton community observed in 2010 might expand over a larger temporal window with the ongoing “Atlantification” of the eastern Arctic.
Future Perspectives
Future warming and reduced ice cover may lead to conditions that are more favorable with regard to survival of Atlantic expatriates in the Arctic Ocean. Rijpfjorden will likely change with climate warming in a direction to resemble Kongsfjorden, as it appeared during the cold years prior to 2006 (Hop et al., 2019; Tverberg et al., 2019). If climate warming continues with temperatures in the range predicted by models (Slagstad et al., 2011, 2015), then Rijpfjorden will continue to develop into a warmer system with higher contribution of boreal species. Thus, it should be continually monitored and models should be applied to the data to forecast regime shifts and resilience in this high-Arctic fjord (Griffith et al., unpublished).
Data Availability
The data are available in the Norwegian Polar Institute’s database (https://doi.org/10.21334/npolar.2019.199f540e).
Author Contributions
Study design and sampling during research cruise involved AW, AF, MD, HH, PA, PD, and MV. Data analyses and assemblage of figures were done by MV assisted by AW and MD. Analyses of carbonates involved AF and MC, nutrients PD and SKr, protists AT, JMW, and JW, and zooplankton MG and SKw. Oceanographic interpretations were performed by AS. Writing of the manuscript was completed by HH with input from all authors.
Funding
This project was supported by the Centre of Ice, Climate and Ecosystems at the Norwegian Polar Institute, and partly funded by the Research Council of Norway (projects Carbon Bridge 226415 and Boom or Bust 244646). The ocean acidification studies were supported by the Ocean Acidification Flagship program within the Fram Centre, Tromsø. MG position was funded by the Polish Scientific Council projects: KongHau4 (W84/KongHau4/2016) and KongHau5 (W88/KongHau5/2017). She was also supported by the Ministry of Science and Higher Education Outstanding Young Scientist Scholarship. AT and JW position were partly funded by Polish Scientific Council project W6/Norway/2017 and W93/Svalbard/2017.
Conflict of Interest Statement
The authors declare that the research was conducted in the absence of any commercial or financial relationships that could be construed as a potential conflict of interest.
Acknowledgments
We would like to thank the captain and crew on RV Lance and all that assisted with sampling during these research cruises. We thank Anna M. Kubiszyn and Magdalena Różańska-Pluta for analyzing phytoplankton samples based on agreement between NPI and IOPAN. The RASM model results referred to in the discussion have been provided courtesy of Prof. Wieslaw Maslowski (Naval Postgraduate School, Monterey, CA) and the RASM Team. Further information on RASM can be found at: www.oc.nps.edu/NAME/RASM.htm.
Supplementary Material
The Supplementary Material for this article can be found online at: https://www.frontiersin.org/articles/10.3389/fmars.2019.00181/full#supplementary-material
FIGURE S1 | Depth-integrated (0–50 m) Chl a standing stocks (mg m-2) along the transect from Rijpfjorden to the Arctic Ocean for 2010, 2012, 2013, and 2014. Chl a standing stocks are averaged for each region.
FIGURE S2 | Average contribution of major protist groups to total protist abundance (cells L-1) along the transect from Rijpfjorden to the Arctic Ocean for 2010, 2012, 2013, and 2014. Samples have been binned vertically to [0, 5], [5, 10], [10, 15], [15, 30], [30, 40], and [40, 50] m depth groups.
FIGURE S3 | Relationship between log transformed abundance (ind. m-3) of common zooplankton species and distance from head of Rijpfjorden. Lines are linear regression lines. ∗∗∗p < 0.001, ∗∗p < 0.01, ∗p < 0.05. Left column shows species whose abundance decreases with distance from the head of the fjord, middle column shows species that increase in abundance with distance to the fjord. Right column shows species with non-significant trends (p > 0.05) in abundance along the transect.
FIGURE S4 | Relationship between nutrient concentrations and salinities for different regions and water types (light blue = Polar Surface Water (PSW), purple = Winter Cooled Water, red = Atlantic water and dark blue = Arctic Intermediate Water). Lines indicate Local Polynomial Regression (LOESS) fits for PSW and linear regressions for other water types with > 4 observations.
FIGURE S5 | Depth-integrated zooplankton carbon standing stock (g C m-2) in the upper (0–50 m) and lower (50-bottom) water column in the four regions [fjord (F), shelf (Sh), continental slope (CS) and off-shelf (OS)] along the transect from Rijpfjorden to the Arctic Ocean in 2010, 2012, 2013, and 2014.
TABLE S1 | Mean abundance (cells 103 L-1) and standard error for the main protist taxa for consecutive years and regions of the Rijpfjorden transect. Values are depth-weighted means for the upper 50 m [∗ – Abundance < 10 cells L-1].
TABLE S2 | Mean carbon biomass (μg C L-1) and standard error for the main protist taxa for consecutive years and regions of the Rijpfjorden transect. Values are depth-weighted means for the upper 50 m [∗ – Biomass < 0.01 μg C L-1].
TABLE S3 | Mean zooplankton abundance (ind. m-3) and standard deviation for all taxa presented in the 4 years and areas of the study. Taxa presented with < 0.1 ind. m-3 in any of the four areas or years are not included. Empty cells indicate that the species was missing from the particular area. All life stages are included, except when stages (CI-CV) and adult females (AF) are specified for accounts concerning these particular life stages.
TABLE S4 | Mean zooplankton biomass (mg dry weight m-3) and standard deviation for all taxa presented in the 4 years and areas of the study. Taxa presented with < 0.1 mg m-3 in any of the four areas or years are not included. Empty cells indicate that the species was missing from the particular area. All life stages are included, except when stages (CI-CV) and adult females (AF) are specified for accounts concerning these particular life stages.
Footnotes
- ^http://polarview.met.no/
- ^http://polarview.met.no/documentation.html
- ^http://nsidc.org/arcticseaicenews/2014/09/
References
Ardyna, M., Babin, M., Gosselin, M., Devred, E., Belanger, S., Matsuoka, A., et al. (2013). Parameterization of vertical chlorophyll a in the Arctic Ocean: impact of the subsurface chlorophyll maximum on regional, seasonal, and annual primary production estimates. Biogeosciences 10, 4383–4404. doi: 10.5194/bg-10-4383-2013
Arrigo, K. R., Matrai, P. A., and van Dijken, G. L. (2011). Primary productivity in the Arctic Ocean: impacts of complex optical properties and subsurface chlorophyll maxima on large-scale estimates. J. Geophys. Res.-Oceans 116:C11022. doi: 10.1029/2011JC007273
Bailey, A., Thor, P., Browman, H. I., Fields, D. M., Runge, J., Vermont, A., et al. (2017). Early life stages of the Arctic copepod Calanus glacialis are unaffected by increased seawater pCO2. ICES J. Mar. Sci. 74, 996–1004.
Barber, D. G., Hop, H., Mundy, C. J., Else, B., Dmitrenko, I. A., Tremblay, J. –E., et al. (2015). Selected physical, biological and biogeochemical implications of a rapidly changing Arctic marginal ice zone. Progr. Oceanogr. 139, 122–150. doi: 10.1016/j.pocean.2015.09.003
Basedow, S. L., Sundfjord, A., von Appen, W.-J., Halvorsen, E., Kwasniewski, S., and Reigstad, M. (2018). Seasonal variation in transport of zooplankton into the Arctic Basin through the Atlantic gateway, Fram Strait. Front. Mar. Sci. 5:194. doi: 10.3389/fmars.2018.00194
Bednarsek, N., Tarling, G. A., Bakker, D. C. E., Fielding, S., and Feely, R. A. (2014). Dissolution dominating calcification process in polar pteropods close to the point of aragonite undersaturation. PLoS One 9:e109183. doi: 10.1371/journal.pone.0109183
Beszczynska-Möller, A., Fahrbach, E., Schauer, U., and Hansen, E. (2012). Variability in Atlantic water temperature and transport at the entrance to the Arctic Ocean, 1997–2010. ICES J. Mar. Sci. 69, 852–863. doi: 10.1093/icesjms/fss056
Blachowiak-Samolyk, K., Søreide, J. E., Kwasniewski, S., Sundfjord, A., Hop, H., Falk-Petersen, S., et al. (2008). Hydrodynamic control of mesozooplankton abundance and biomass in northern Svalbard waters (79-81°N). Deep Sea Res. II 55, 2210–2224. doi: 10.1016/j.dsr2.2008.05.018
Bluhm, B., Kosobokova, K., and Carmack, E. (2015). A tale of two basins: an integrated physical and biological perspective of the deep Arctic Ocean. Progr. Oceanogr. 139, 89–121. doi: 10.1016/j.pocean.2015.07.011
Buchholz, F., Werner, T., and Buchholz, C. (2012). First observation of krill spawning in the high Arctic Kongsfjorden, west Spitsbergen. Polar Biol. 35, 1273–1279. doi: 10.1007/s00300-012-1186-3
Cassano, J., DuVivier, A., Roberts, A., Hughes, M., Seefeldt, M., Brunke, M., et al. (2017). Development of the regional Arctic system model (RASM): near-surface atmospheric climate sensitivity. J. Climate 30, 5729–5753. doi: 10.1175/JCLI-D-15-0775.1
Codispoti, L. A., Kelly, V., Thessen, A., Matrai, P., Suttles, S., Hill, V., et al. (2013). Synthesis of primary production in the Arctic Ocean: III. Nitrate and phosphate based estimates of net community production. Progr. Oceanogr. 110, 126–150. doi: 10.1016/j.pocean.2012.11.006
Cokelet, E. D., Tervalon, N., and Bellingham, J. G. (2008). Hydrography of the West Spitsbergen current, Svalbard branch: autumn 2001. J. Geophys. Res. 113:C01006. doi: 10.1029/2007JC004150
Cottier, F., Tverberg, V., Inall, M., Svendsen, H., Nilsen, F., and Griffiths, C. (2005). Water mass modification in an Arctic fjord through cross-shelf exchange: the seasonal hydrography of Kongsfjorden, Svalbard. J. Geophys. Res. 110:C12005. doi: 10.1029/2004JC002757
Crews, L., Sundfjord, A., Albretsen, J., and Hattermann, T. (2017). Mesoscale eddy activity and transport in the Atlantic water inflow region north of Svalbard. J. Geophys. Res. Oceans 123, 201–215. doi: 10.1002/2017JC013198
Daase, M., and Eiane, K. (2007). Mesozooplankton distribution in northern Svalbard waters in relation to hydrography. Polar Biol. 30, 969–981. doi: 10.1007/s00300-007-0255-5
Daase, M., Falk-Petersen, S., Varpe,Ø, Darnis, G., Søreide, J. E., Wold, A., et al. (2013). Timing of reproductive events in the marine copepod Calanus glacialis: a pan-Arctic perspective. Can. J. Fish. Aquat. Sci. 70, 871–884. doi: 10.1139/cjfas-2012-0401
Daase, M., Kosobokova, K., Last, K. S., Cohen, J. H., Choquet, M., Hatlebakk, M., et al. (2018). New insights into the biology of Calanus spp. (Copepoda) males in the Arctic. Mar. Ecol. Prog. Ser. 607, 53–69. doi: 10.3354/meps12788
Daase, M., Varpe,Ø, and Falk-Petersen, S. (2014). Non-consumptive mortality in copepods: occurrence of Calanus spp. carcasses in the Arctic Ocean during winter. J. Plankton Res. 36, 129–144. doi: 10.1093/plankt/fbt079
Dickson, A. G. (1990). Standard potential of the reaction-AgCl(S)+1/2H-2(G) = Ag(S)+HCL(Aq) and the standard acidity constant of the ion HSO4- in synthetic sea-water from 273.15 K to 318.15 K. J. Chem. Thermodyn. 22, 113–127. doi: 10.1016/0021-9614(90)90074-Z
Dickson, A. G., and Millero, F. J. (1987). A comparison of the equilibrium constants for the dissociation of carbonic acid in seawater media. Deep-Sea Res. 34, 1733–1743. doi: 10.1016/0198-0149(87)90021-5
Dickson, A. G., Sabine, C. L., and Christian, J. R. (2007). Guide to Best Practices for Ocean CO2 Measurements. Sidney: PICES Special Publication.
Eriksen, E., Gjøsæter, H., Prozorkevich, D., Shamray, E., Dolgov, A., Skern-Mauritzen, M., et al. (2018). From single species surveys towards monitoring of the Barents Sea ecosystem. Progr. Oceanogr. 166, 4–14. doi: 10.1016/j.pocean.2017.09.007
Falk-Petersen, S., Leu, E., Berge, J., Kwasniewski, S., Nygård, H., Røstad, A., et al. (2008). Vertical migration in high Arctic waters during autumn 2004. Deep Sea Res. II 55, 2275–2284. doi: 10.1016/j.dsr2.2008.05.010
Falk-Petersen, S., Mayzaud, P., Kattner, G., and Sargent, J. R. (2009). Lipids and life strategy of Arctic Calanus. Mar. Biol. Res. 5, 18–39. doi: 10.1080/17451000802512267
Fernández-Méndez, M., Olsen, L. M., Kauko, H. M., Myer, A., Rösel, A., Merkouriadi, I., et al. (2018). Algal hotspots in a changing Arctic Ocean: sea-ice ridges and the snow-ice interface. Front. Mar. Sci. 5:75. doi: 10.3389/fmars.2018.00075
Gjøsæter, H., Wiebe, P. H., Knutsen, T., and Ingvaldsen, R. B. (2017). Evidence of diel vertical migration of mesopelagic sound-scattering organisms in the Arctic. Front. Mar. Sci. 4:332. doi: 10.3389/fmars.2017.00332
Gluchowska, M., Dalpadado, P., Beszczynska-Möller, A., Olszewska, A., Ingvaldsen, R. B., and Kwasniewski, S. (2017a). Interannual zooplankton variability in the main pathways of the Atlantic water flow into the Arctic Ocean (Fram Strait and Barents Sea branches). ICES J. Mar. Sci. 74, 1921–1936. doi: 10.1093/icesjms/fsx033
Gluchowska, M., Trudnowska, E., Goszczko, I., Kubiszyn, A. M., Blachowiak-Samolyk, K., Walczowski, W., et al. (2017b). Variations in the structural and functional diversity of zooplankton over vertical and horizontal environmental gradients en route to the Arctic Ocean through the Fram Strait. PLoS One 12:e0171715. doi: 10.1371/journal.pone.0171715
Greene, C., Pershing, A., Conversi, A., Planque, B., Hannah, C., Sameoto, D., et al. (2003). Trans-Atlantic responses of Calanus finmarchicus populations to basin-scale forcing associated with the north atlantic oscillation. Progr. Oceanogr. 58, 301–312. doi: 10.1016/j.pocean.2003.08.009
Hattermann, T., Isachsen, P. E., von Appen, W., Albretsen, J., and Sundfjord, A. (2016). Eddy-driven recirculation of Atlantic water in Fram Strait. Geophys. Res. Lett. 43, 3406–3414. doi: 10.1002/2016GL068323
Hegseth, E. N., Assmy, P., Wiktor, J. M., Kristiansen, S., Leu, E., Piquet, A. M. T., et al. (2019). “Phytoplankton seasonal dynamics in Kongsfjorden, Svalbard and the adjacent shelf,” in The Ecosystem of Kongsfjorden, Svalbard, eds H. Hop and C. Wiencke (Cambridge: Springer), 173–228. doi: 10.1007/978-3-319-46425-1_6
Hillebrand, H., Dürselen, C.-D., Kirschtel, D., Pollingher, U., and Zohary, T. (1999). Biovolume calculation for pelagic and benthic microalgae. J. Phycol. 35, 403–424. doi: 10.1046/j.1529-8817.1999.3520403.x
Hirche, H. –J., and Kosobokova, K. (2007). Distribution of Calanus finmarchicus in the northern North Atlantic and Arctic Ocean - expatriation and potential colonization. Deep Sea Res. II 54, 2729–2747. doi: 10.1016/j.dsr2.2007.08.006
Hop, H., Falk-Petersen, S., Svendsen, H., Kwasniewski, S., Pavlov, V., Pavlova, O., et al. (2006). Physical and biological characteristics of the pelagic system across Fram Strait to Kongsfjorden. Progr. Oceanogr. 71, 182–231. doi: 10.1016/j.pocean.2006.09.007
Hop, H., Wold, A., Vihtakari, M., Daase, M., Kwasniewski, S., Gluchowska, M., et al. (2019). “Zooplankton in Kongsfjorden (1996-2016) in relation to climate change,” in The Ecosystem of Kongsfjorden, Svalbard, eds H. Hop and C. Wiencke (Cambridge: Springer), 229–302. doi: 10.1007/978-3-319-46425-1_7
Hopcroft, R. R., and Roff, J. C. (1995). Zooplankton growth rates: extraordinary production by the larvacean Oikopleura dioica in tropical waters. J. Plankton Res. 17, 205–220. doi: 10.1093/plankt/17.2.205
Hovinen, J. E. H., Welcker, J., Rabindranath, A., Brown, Z. W., Hop, H., Berge, J., et al. (2014). At-sea distribution of foraging little auks relative to physical factors and potential food supply. Mar. Ecol. Prog. Ser. 503, 263–277. doi: 10.3354/meps10740
Ingvaldsen, R. B., Gjøsæter, H., Ona, E., and Michalsen, K. (2017). Atlantic cod (Gadus morhua) feeding over deep water in the high Arctic. Polar Biol. 40, 2105–2111. doi: 10.1007/s00300-017-2115-2
King, K. R. (1982). “The population biology of the larvacean Oikopleura dioica in enclosed water columns,” in Marine Mesocosms: Biological and Chemical Research in Experimental Ecosystems, eds G. D. Grice and M. R. Reeve (New York, NY: Springer).
Knutsen, T., Wiebe, P. H., Gjøsæter, H., Ingvaldsen, R. B., and Lien, G. (2017). High latitude epipelagic and mesopelagic scattering layers - a reference for future Arctic ecosystem change. Front. Mar. Sci. 4:334. doi: 10.3389/fmars.2017.00334
Kosobokova, K., and Hirche, H.-J. (2009). Biomass of zooplankton in the eastern Arctic Ocean – a base line study. Progr. Oceanogr. 82, 265–280. doi: 10.1016/j.pocean.2009.07.006
Kosobokova, K. N. (2012). Zooplankton of the Arctic Ocean: Community Structure, Ecology, Spatial Distribution. Moscow: GEOS.
Kraft, A., Nöthig, E.-M., Bauerfeind, E., Wildish, D. J., Pohle, G. W., Bathmann, U. V., et al. (2013). First evidence of reproductive success in a southern invader indicates possible community shifts among Arctic zooplankton. Mar. Ecol. Prog. Ser. 493, 291–296. doi: 10.3354/meps10507
Kubiszyn, A. M., Wiktor, J. M., Wiktor, J. M. Jr., Griffiths, C., Kristiansen, S., and Gabrielsen, T. M. (2017). The annual planktonic protist community structure in an ice-free high Arctic Fjord (Adventfjorden, West Spitsbergen). J. Mar. Syst. 169, 61–72. doi: 10.1016/j.jmarsys.2017.01.013
Kwasniewski, S., Hop, H., Falk-Petersen, S., and Pedersen, G. (2003). Distribution of Calanus species in Kongsfjorden, a glacial fjord in Svalbard. J. Plankton Res. 25, 1–20.
Leu, E., Søreide, J. E., Hessen, D. O., Falk-Petersen, S., and Berge, J. (2011). Consequences of changing sea-ice cover for primary and secondary producers in the European Arctic shelf seas: timing, quantity, and quality. Progr. Oceanogr. 90, 18–32. doi: 10.1016/j.pocean.2011.02.004
Mehrbach, C., Culberson, C. H., Hawley, J. E., and Pytkowicz, R. M. (1973). Measurement of the apparent dissociation constants of carbonic acid in seawater at atmospheric pressure. Limnol. Oceanogr. 18, 897–907. doi: 10.4319/lo.1973.18.6.0897
Menden-Deuer, S., and Lessard, E. J. (2000). Carbon to volume relationships for dinoflagellates, diatoms, and other protest plankton. Limnol. Oceanogr. 45, 569–579. doi: 10.4319/lo.2000.45.3.0569
Onarheim, I. H., Smedsrud, L. H., Ingvaldsen, R. B., and Nilsen, F. (2014). Loss of sea ice during winter north of Svalbard. Tellus A 66:23933. doi: 10.3402/tellusa.v66.23933
Opstad, I., Jensen, A. M., Sperfeld, E., Semb Johansen, I., Fransson, A., Chierici, M., et al. (2018). Effects of high pCO2 on the northern krill Thysanoessa inermis in relation to carbonate chemistry of its collection area, Rijpfjorden. Mar. Biol. 165, 116. doi: 10.1007/s00227-018-3370-7
Ormanczyk, M. R., Gluchowska, M., Oszewska, A., and Kwasniewski, S. (2017). Zooplankton structure in high latitude fjords with contrasting oceanography (Hornsund and Kongsfjorden, Spitsbergen). Oceanologia 59, 508–534. doi: 10.1016/j.oceano.2017.06.003
Owrid, G., Socal, G., Civitarese, G., Luchetta, A., Wiktor, J., Nöthig, E.-M., et al. (2000). Spatial variability of phytoplankton, nutrients and new production estimates in the waters around Svalbard. Polar Res. 19, 155–171. doi: 10.1111/j.1751-8369.2000.tb00340.x
Parsons, T. R., Maita, Y., and Lalli, C. M. (1984). A Manual of Chemical and Biological Methods for Seawater Analysis. Oxford: Pergamon Press.
Pérez-Hernández, M. D., Pickart, R. S., Pavlov, V., Våge, K., Ingvaldsen, R. B., Sundfjord, A., et al. (2017). The Atlantic water boundary current north of Svalbard in late summer. J. Geophys. Res. Ocean 122, 2269–2290. doi: 10.1002/2016JC012486
Pierrot, D., Lewis, E., and Wallace, D. W. R. (2006). MS Excel Program Developed for CO2 System Calculations, ORNL/CDIAC-105. Washington, D.C: U.S. Department of Energy.
Piwosz, K., Spich, K., Calkiewicz, J., Weydmann, A., Kubiszyn, A., and Wiktor, J. M. (2014). Distribution of small phytoflagellates along an Arctic fjord transect. Environ. Microbiol. 17, 2393–2406. doi: 10.1111/1462-2920.12705
Piwosz, K., Walkusz, W., Hapter, R., Wieczorek, P., Hop, H., and Wiktor, J. (2009). Comparison of productivity and phytoplankton in a warm (Kongsfjorden) and a cold (Hornsund) Spitsbergen fjord in mid-summer 2002. Polar Biol. 32, 549–559. doi: 10.1007/s00300-008-0549-2
Polyakov, I. V., Pnyushkov, A. V., Alkire, M. B., Ashik, I. M., Baumann, T. M., Carmack, E. C., et al. (2017). Greater role for Atlantic inflows on sea-ice loss in the Eurasian Basin of the Arctic Ocean. Science 536, 285–291. doi: 10.1126/science.aai8204
Postel, L. (2000). “Biomass and abundance,” in ICES Zooplankton Methodology Manual, eds R. Harris, P. Wiebe, J. Lens, H. R. Skjoldal, and M. Huntley (San Diego, CA: Academic Press), 83–192. doi: 10.1016/B978-012327645-2/50005-0
Randelhoff, A., Sundfjord, A., and Reigstad, M. (2015). Seasonal variability and fluxes of nitrate in the surface waters over the Arctic shelf slope. Geophys. Res. Lett. 42, 3442–3449. doi: 10.1002/2015GL063655
Renaud, P. E., Daase, M., Banas, N. S., Gabrielsen, T. M., Søreide, J. E., Varpe, Ø, et al. (2018). Pelagic food-webs in a changing Arctic: a trait-based perspective suggests a mode of resilience. ICES J. Mar. Sci. 75, 1871–1881. doi: 10.1093/icesjms/fsy063
Renner, A. H. H., Sundfjord, A., Janout, M. A., Ingvaldsen, R. B., Beszczynska-Möller, A., Pickart, R. S., et al. (2018). Variability and redistribution of heat in the Atlantic water boundary current north of Svalbard. J. Geophys. Res.-Oceans 123, 6373–6391. doi: 10.1029/2018JC013814
Runge, J. A., Fields, D. M., Thompson, C. R. S., Shema, S. D., Bjelland, R. M., Durif, C. M. F., et al. (2016). End of the century CO2 concentrations do not have a negative effect on vital rates of Calanus finmarchicus, an ecologically critical planktonic species in North Atlantic ecosystems. ICES J. Mar. Sci. 73, 937–951. doi: 10.1093/icesjms/fsv258
Slagstad, D., Ellingsen, I. H., and Wassmann, P. (2011). Evaluating primary and secondary production in an Arctic Ocean void of summer sea ice: an experimental simulation approach. Progr. Oceanogr. 90, 117–131. doi: 10.1016/j.pocean.2011.02.009
Slagstad, D., Wassmann, P., and Ellingsen, I. H. (2015). Physical constrains and productivity in the future Arctic Ocean. Front. Mar. Sci. 2:85. doi: 10.3389/fmars.2015.00085
Smoła, Z. T., Tatarek, A., Wiktor, J. M., Wiktor, J. M. Jr., Kubiszyn, A., and Wȩsławski, J. M. (2017). Primary producers and production in Hornsund and Kongsfjorden–comparison of two fjord systems. Pol. Polar Res. 38, 351–373. doi: 10.1515/popore-2017-0013
Soltwedel, T., Bauerfeind, E., Bergmann, M., Bracher, A., Budaeva, N., Busch, K., et al. (2016). Natural variability or anthropogenically-induced variation? Insights from 15 years of multidisciplinary observations at the arctic marine LTER site HAUSGARTEN. Ecol. Ind. 65, 89–102. doi: 10.1016/j.ecolind.2015.10.001
Søreide, J. E., Leu, E., Berge, J., Graeve, M., and Falk-Petersen, S. (2010). Timing in blooms, algal food quality and Calanus glacialis reproduction and growth in a changing Arctic. Glob. Change Biol. 16, 3154–3163. doi: 10.1111/j.1365-2486.2010.02175.x
Svensen, C., and Kiørboe, T. (2000). Remote prey detection in Oithona similis: hydromechanical versus chemical cues. J. Plankton Res. 22, 1155–1166. doi: 10.1093/plankt/22.6.1155
Svensen, C., Seuthe, L., Vasilyeva, Y., Pasternak, A., and Hansen, E. (2011). Zooplankton distribution across Fram Strait in autumn: are small copepods and protozooplankton important? Progr. Oceanogr. 91, 534–544. doi: 10.1016/j.pocean.2011.08.001
Syvertsen, E. E. (1991). Ice algae in the barents sea: types of assemblages, origin, fate and role in the ice-edge phytoplankton bloom. Polar Res. 10, 277–288. doi: 10.1111/j.1751-8369.1991.tb00653.x
Thor, P., Bailey, A., Dupont, S., Calosi, P., Søreide, J. E., De Wit, P., et al. (2018a). Contrasting physiological responses to future ocean acidification among Arctic copepod populations. Glob. Change Biol. 24, e365–e377. doi: 10.1111/gcb.13870
Thor, P., Vermandele, F., Carignan, M.-H., Jacque, S., and Calosi, P. (2018b). No maternal or direct effects of ocean acidification on egg hatching in the Arctic copepod Calanus glacialis. PLoS One 13:e1092496. doi: 10.1371/journal.pone.0192496
Tverberg, V., Skogseth, R., Cottier, F., Sundfjord, A., Walczowski, W., Inall, M. E., et al. (2019). “The Kongsfjorden transect: seasonal and inter-annual variability in hydrography,” in The Ecosystem of Kongsfjorden, Svalbard, eds H. Hop and C. Wiencke (Cambridge: Springer), 49–104. doi: 10.1007/978-3-319-46425-1_3
Våge, K., Pickart, R. S., Pavlov, V., Lin, P., Torres, D. J., Ingvaldsen, R. B., et al. (2016). The Atlantic water boundary current in the Nansen basin: transport and mechanisms of lateral exchange. J. Geophys. Res.-Oceans 121, 6946–6960. doi: 10.1002/2016JC011715
Vancoppenolle, M., Bopp, L., Madec, G., Dunne, J., Ilyina, T., Halloran, P. R., et al. (2013). Future Arctic Ocean primary productivity from CMIP5 simulations: uncertain outcome, but consistent mechanisms. Glob. Biogeochem. Cycles 27, 605–619. doi: 10.1002/gbc.20055
Vaquer-Sunyer, R., Duarte, C. M., Regaudie-de-Gioux, A., Holding, J., Garcia-Corral, S., Reigstad, M., et al. (2013). Seasonal patterns in Arctic planktonic metabolism (Fram Strait - Svalbard region). Biogeosciences 10, 2347–2347. doi: 10.5194/bg-10-2347-2013
Vihtakari, M., Sundfjord, A., and de Steur, L. (2019). Barents Sea Ocean-Current Arrows Modified from Eriksen et al. (2018). Tromsø: Norwegian Polar Institute and Institute of Marine Research.
Vogedes, D., Eiane, K., Båtnes, A., and Berge, J. (2014). Variability in Calanus spp. abundance on fine- to mesoscales in an Arctic fjord: implications for little auk feeding. Mar. Biol. Res. 10, 437–448. doi: 10.1080/17451000.2013.815781
von Appen, W.-J., Schauer, U., Hattermann, T., and Beszczynska-Möller, A. (2016). Seasonal cycle of mesoscale instability of the West Spitsbergen current. J. Phys. Oceanogr. 46, 1231–1254. doi: 10.1175/JPO-D-15-0184.1
von Quillfeldt, C. H. (2000). Common diatom species in arctic spring blooms: their distribution and abundance. Bot. Mar. 43, 499–516. doi: 10.1515/BOT.2000.050
Wallace, M. I., Cottier, F. R., Berge, J., Tarling, G. A., Griffiths, C., and Brierley, A. S. (2010). Comparison of zooplankton vertical migration in an ice-free and a seasonally icecovered Arctic fjord: an insight into the influence of sea ice cover on zooplankton behavior. Limnol. Oceanogr. 55, 831–845. doi: 10.4319/lo.2010.55.2.0831
Wassmann, P., Kosobokova, K. N., Slagstad, D., Drinkwater, K. F., Hopcroft, R. R., Moore, S. E., et al. (2015). The contiguous domains of Arctic Ocean advection: trails of life and death. Progr. Oceanogr. 139, 42–65. doi: 10.1016/j.pocean.2015.06.011
Weydmann, A., Carstensen, J., Goszczko, I., Dmoch, K., Olszewska, A., and Kwasniewski, S. (2014). Shift towards the dominance of boreal species in the Arctic: inter-annual and spatial zooplankton variability in the West Spitsbergen Current. Mar. Ecol. Prog. Ser. 501, 41–52. doi: 10.3354/meps10694
Weydmann, A., Søreide, J. E., Kwasniewski, S., Leu, E., Falk-Petersen, S., and Berge, J. (2013). Ice-related seasonality in zooplankton community composition in a high Arctic fjord. J. Plankton Res. 35, 831–842. doi: 10.1093/plankt/fbt031
Keywords: Arctic ecosystem, carbonate system, nutrient limitation, protists, zooplankton, climate change, Svalbard, Arctic Ocean
Citation: Hop H, Assmy P, Wold A, Sundfjord A, Daase M, Duarte P, Kwasniewski S, Gluchowska M, Wiktor JM, Tatarek A, Wiktor J Jr, Kristiansen S, Fransson A, Chierici M and Vihtakari M (2019) Pelagic Ecosystem Characteristics Across the Atlantic Water Boundary Current From Rijpfjorden, Svalbard, to the Arctic Ocean During Summer (2010–2014). Front. Mar. Sci. 6:181. doi: 10.3389/fmars.2019.00181
Received: 31 December 2018; Accepted: 21 March 2019;
Published: 09 April 2019.
Edited by:
Maria Vernet, University of California, San Diego, United StatesReviewed by:
Jose Luis Iriarte, Universidad Austral de Chile, ChileCarlos Moffat, University of Delaware, United States
Copyright © 2019 Hop, Assmy, Wold, Sundfjord, Daase, Duarte, Kwasniewski, Gluchowska, Wiktor, Tatarek, Wiktor, Kristiansen, Fransson, Chierici and Vihtakari. This is an open-access article distributed under the terms of the Creative Commons Attribution License (CC BY). The use, distribution or reproduction in other forums is permitted, provided the original author(s) and the copyright owner(s) are credited and that the original publication in this journal is cited, in accordance with accepted academic practice. No use, distribution or reproduction is permitted which does not comply with these terms.
*Correspondence: Haakon Hop, Haakon.Hop@npolar.no