 Da Huang
 Jiayu Shen
 Lingyun Zhai
 Huanhuan Chen
 Jing Fei
 Xiaoqing Zhu
 Jianwei Zhou
- 1Department of Gynecology, The Second Affiliated Hospital, School of Medicine, Zhejiang University, Hangzhou, China
- 2Department of Obstetrics, The Second Affiliated Hospital, School of Medicine, Zhejiang University, Hangzhou, China
N-Acylethanolamine Acid Amidase (NAAA) is an N-terminal cysteine hydrolase and plays a vital physiological role in inflammatory response. However, the roles of NAAA in tumor immunity are still unclear. By using a series of bioinformatics approaches, we study combined data from different databases, including the Cancer Genome Atlas, the Cancer Cell Line Encyclopedia, Genotype Tissue-Expression, cBioPortal, Human Protein Atlas, TIMER, and ImmuCellAI to investigate the role of NAAA expression in prognosis and tumor immunity response. We would like to reveal the potential correlations between NAAA expression and gene alterations, tumor mutational burden (TMB), microsatellite instability (MSI), DNA methylation, tumor microenvironment (TME), immune infiltration levels, and various immune-related genes across different cancers. The results show that NAAA displayed abnormal expression within most malignant tumors, and overexpression of NAAA was associated with the poor prognosis of tumor patients. Through gene set enrichment analysis (GSEA), we found that NAAA was significantly associated with cell cycle and immune regulation-related signaling pathways, such as in innate immune system, adaptive immune system, neutrophil degranulation, and Toll-like receptor signaling pathways (TLRs). Further, the expression of NAAA was also confirmed to be correlated with tumor microenvironment and diverse infiltration of immune cells, especially tumor-associated macrophage (TAM). In addition to this, we found that NAAA is co-expressed with genes encoding major histocompatibility complex (MHC), immune activation, immune suppression, chemokine, and chemokine receptors. Meanwhile, we demonstrate that NAAA expression was correlated with TMB in 4 cancers and with MSI in 10 cancers. Our study reveals that NAAA plays an important role in tumorigenesis and cancer immunity, which may be used to function as a prognostic biomarker and potential target for cancer immunotherapy.
Introduction
As a worldwide threat to public health, malignant tumors not only bring endless suffering to patients and their families but also add huge economic burden to society. Early screening and subsequent surgical intervention have made an advanced progress in reducing the incidence and mortality of tumors, especially in colon and cervical cancer (1). However, the prognosis and survival rate of many types of cancer are still dissatisfied. Relapsing disease almost inevitably developed resistance to the initially sensitive drugs (2, 3). This implies several possible mechanisms are involved in the occurrence and development of multidrug resistance (MDR) in cancer (4). Tumor microenvironment may play a critical role in these potential mechanisms (5–7). Tumor microenvironment (TME) is a tumor-promoting setting that contains various cells, including innate and adaptive immune cells, cancer-associated fibroblasts (CAFs), tumor-associated endothelial cells (TECs), and extracellular matrix (8). Among all the cellular components, immune cells are the most important components. It is now known that interactions between tumor cells and the proximal immune cells can secrete cytokines and growth factors to promote tumor invasion, metastasis, and suppression of antitumor immunity (9, 10). Tumor immunotherapy, which is different from conventional chemotherapeutics, has witnessed dramatic advances in cancer treatment, particularly immune checkpoint blockade therapy (11, 12). The clinical success of immune checkpoint inhibitors (ICIs), such as anti-programmed cell death protein-1 (PD-1) or its ligand (PD-L1) and anti-cytotoxic T lymphocyte-associated protein 4 (CTLA-4), have been approved the standard of care in many types of malignancies (13–15). However, the overall response rates in many patients are still minimal when provided the same treatment. In addition to tumor cell-intrinsic factors, such as insufficient tumor antigenicity, disruption of interferon-γ signal pathway, and downregulation surface MHC-I level (16, 17), the TME plays a major role in immunosuppression and affects clinical outcomes of cancer patients. Therefore, there is an urgent need to search for new immune-related therapeutic targets in cancers.
N-Acylethanolamine acid amidase (NAAA) is a lysosomal enzyme that is primarily expressed in the adaptive and innate immune cells (18). Its known to promote inflammatory responses through regulating the deactivation of palmitoylethanolamide (PEA) (19, 20), an endogenous lipid mediator that ligates peroxisome proliferator-activated receptor α (PPAR-α) to diminish production of proinflammatory cytokines and achieves anti-inflammatory and analgesic effects (21–23). Therefore, multiple NAAA inhibitors have been developed to treat inflammatory-related diseases, including arthritis (24), lung inflammation (25), inflammatory bowel disease (26), and allergic contact dermatitis (27). Additionally, recent studies showed that NAAA inhibitors have an effect on the antitumor response. For example, Roberta et al. (27) showed that the NAAA inhibitors are able to significantly reduce proliferation and migration of bladder cancer cells.
Borrelli et al. (28) displayed NAAA inhibitors can induce colorectal cancer (CRC) cell cycle arrest in the S phase and reduce cell proliferation and migration. However, the potential role of NAAA in tumorigenesis and tumor progression remains fragmentary, and there are no bioinformatics analysis systematically exploring the relationship of NAAA expression between different types of human cancers.
Rapidly accumulating data from large‐scale cancer genomics studies, many studies have focused pan-cancer analysis to estimate the whole genome, frequently mutated genes and other common genomic characterization that are related to the occurrence and development of cancer (29–32). In this study, we examine the specific role and underlying mechanisms of NAAA in a pan-cancer dataset. On the one hand, we comprehensively deeply analyzed the association between NAAA expression and patient prognosis in 33 cancer types. In addition, we further assessed the expression of NAAA and its association with tumor-infiltrating immune cells. Our findings revealed the possible role of NAAA in tumorigenesis and progression of multiple cancers, suggesting that NAAA is a potential prognostic and immunotherapeutic biomarker.
Materials and Methods
NAAA Gene Data Collection and Processing
NAAA gene expression data and clinical information in tumor and corresponding normal samples were obtained from the Cancer Genome Atlas (TCGA) and the Genotype-Tissue Expression (GTEx) using UCSC Xena (https://xena.ucsc.edu/), an online tool for exploration of gene expression and clinical and phenotype data. The Cancer Cell Line Encyclopedia (CCLE) database was used to analyze NAAA expression in different cancer cell lines for a multidimensional investigation. The expression level of NAAA in 33 different human cancer tissues and 31 different normal tissues, as well as the corresponding 21 tumor cell lines, was systematically analyzed. The RNA sequencing data were Log2-transformed, and two sets of t-tests were conducted on these tumor types; the statistically significant difference was defined to be * p < 0.05; ** p< 0.01; *** p < 0.001. Data analysis was conducted using R software (Version 4.0.2), and the R package “ggpubr” was used to draw radar plots or boxplot. The compiled data were derived from 9,861 TCGA tumor tissues, 712 TCGA normal tissues, and 7,718 GTEx normal tissues, more details as seen in Supplementary Table 1.
Immunohistochemistry Staining
Human Protein Atlas (HPA) (http://www.proteinatlas.org/), a landmark protein research database containing the protein expression of tumor tissues and normal tissues, was applied to explore NAAA expression at the protein level. IHC images of NAAA protein expression in normal and eight tumor tissues including breast invasive carcinoma (BRCA), ovarian cancer (OV), prostate adenocarcinoma (PRAD), stomach adenocarcinoma (STAD), colon adenocarcinoma (COAD), liver hepatocellular carcinoma (LIHC), uterine carcinosarcoma (UCS), and kidney renal papillary cell carcinoma (KIRP) were downloaded from the HPA and analyzed. The antibody used for IHC was CAB026135.
NAAA Gene Expression and Survival Prognosis Analysis
Survival information of overall survival (OS), disease-specific survival (DSS), disease-free interval (DFI), and progression-free interval (PFI) were extracted from TCGA and to reveal the relationship between NAAA expression and patient prognosis. The median of NAAA expression in each tumor was used as cutoff value to divide patients into high- and low-expression subgroups. The survival data of each cancer type were assessed by Kaplan-Meier survival method and log-rank test. The survival curves were drawn using R packages “survminer” and “survival,” and p <0.05 was considered significant. Moreover, a univariate Cox model was used to evaluate the relationships between NAAA expression and various survival outcomes in a pan-cancer analysis, and a hazard ratio (HR) <1 was considered to mean that NAAA is a protection factor in cancer; otherwise, HR >1 means that NAAA is a risk factor in cancer. Data were visualized as forest plots (using the “forestplot” R package).
NAAA Genetic Alteration Analysis
The cBioPortal database (www.cbioportal.org) was used to explore genomic alterations analyses for a specific gene (33). In this study, we applied the “Cancer Types Summary” and below “Cancer Type” button for visualizing genomic alterations of NAAA among 32 cancer types of TCGA. The results were presented with plotted bar plots, and the frequencies of NAAA copy number alterations and mutations in all TCGA tumors were observed. The HM450 methylation data of each tumor were also obtained from the cBioPortal database. The connection between the NAAA expression levels and methylation levels in its promoter region was analyzed for each cancer and visualized using the R package “ggpubr”.
Tumor Mutation Burden and Microsatellite Instability
Tumor mutation burden (TMB) was defined as the total number of somatic coding mutations in a specific cancer, which were closely related to the effectiveness of immunotherapy across diverse types of human cancers. We downloaded somatic mutation data of all TCGA patients from the UCSC XENA database and calculated their TMB scores. Microsatellite instability (MSI) is a condition characterized by repetitive sequences of mono- and oligonucleotides (short tandem repeats) that reflect DNA mismatch repair (MMR) deficiency. Similarly, MSI is a marker for good response to immunotherapy. The microsatellite instability (MSI) data were obtained from a recent study (34). The telationship of NAAA expression with TMB or MSI was analyzed by utilizing Spearman’s correlation coefficient.
Tumor Microenvironment or Infiltration of Immune Cells
Estimation of Stromal and Immune Cells in Malignant Tumor Tissues Using Expression Data (ESTIMATE) is a method to calculate stromal or immune scores, which represent the abundance of immune and stromal components, respectively. The higher the score the larger the ratio of the corresponding component in TME. ESTIMATE score, the sum of stromal and immune scores, represents the integrated proportion of both components in TME. The NAAA expression and ImmuneScore and StromalScore of each cancer were obtained via the “estimate” R package and Spearman’s correlation analysis. Immune cell infiltration correlation analysis was performed using two databases, including TIMER2 database (http://timer.cistrome.org) and ImmuCellAI database (http://bioinfo.life.hust.edu.cn/ImmuCellAI) to perform the correlation analysis. For each TCGA tumor type, patients were divided into two groups (high and low NAAA expression based on the median NAAA expression level) to compare the extent of immune cell infiltration.
Gene Set Enrichment Analyses
Correlation analyses of NAAA with all genes were performed using TCGA data. Pearson’s correlation coefficients were calculated. Genes correlated with NAAA (p < 0.05) were selected for gene set enrichment analysis (GSEA). GSEA was performed using the R package “clusterProfiler” with the following parameters: nPerm = 1000, minGSSize = 10, maxGSSize = 1000, and p-value-Cutoff = 0.05. Gene sets from Reactome pathway database were selected for GSEA.
Statistical Analysis
NAAA gene expression level differences in cancer tissues and normal tissues were estimated using t-tests. Survival analysis was analyzed by Kaplan–Meier method and compared using log-rank test, and the results were presented as hazard ratios, 95% CI, and p-values of log-rank tests. The correlation analysis between the two variables used Spearman’s or Pearson’s test. All the statistical analyses were conducted using R software (version 4.0.2). A p-value < 0.05 was considered statistically significant.
Results
NAAA Expression Analysis in Pan-Cancer
First, we analyzed NAAA mRNA expression in normal tissues using the GTEx dataset. As shown in Figure 1A, the highest NAAA expression was observed in the spleen, prostate, and small intestine, while the lowest expression was detected in pancreas. For tumor tissues in TCGA, we found NAAA expression was the highest in prostate adenocarcinoma (PRAD) and lowest in uveal melanoma (UVM) (Figure 1B). In addition, we explored NAAA expression across different tumor cell lines in the CCLE database and found the gene was also the highest in PRAD (Figure 1C). To further compare NAAA expression between the tumor and normal tissues, we combined data from the GTEx and TCGA database to analyze the differences in NAAA expression. Results from databases revealed that NAAA was overexpressed in 10 of these cancers: breast invasive carcinoma (BRCA), lymphoid neoplasm, diffuse large B cell lymphoma (DLBC), glioblastoma multiforme (GBM), acute myeloid leukemia (LAML), ovarian cancer (OV), pancreatic adenocarcinoma (PAAD), pheochromocytoma and paraganglioma (PCPG), prostate adenocarcinoma (PRAD), stomach adenocarcinoma (STAD), testicular germ cell tumors (TGTC). In contrast, low NAAA expression was observed in 16 cancers: adrenocortical carcinoma (ACC), cervical squamous cell carcinoma (CESC), cholangiocarcinoma (CHOL), esophageal carcinoma (ESCA), head and neck squamous cell carcinoma (HNSC), kidney chromophobe (KICH), kidney renal clear cell carcinoma (KIRC), kidney renal papillary cell carcinoma (KIRP), liver hepatocellular carcinoma (LIHC), lung adenocarcinoma (LUAD), lung squamous cell carcinoma (LUSC), skin cutaneous melanoma (SKCM), thyroid carcinoma (THCA), thymoma (THYM), uterine corpus endometrial carcinoma (UCEC), uterine carcinosarcoma (UCS) (Figure 1D).
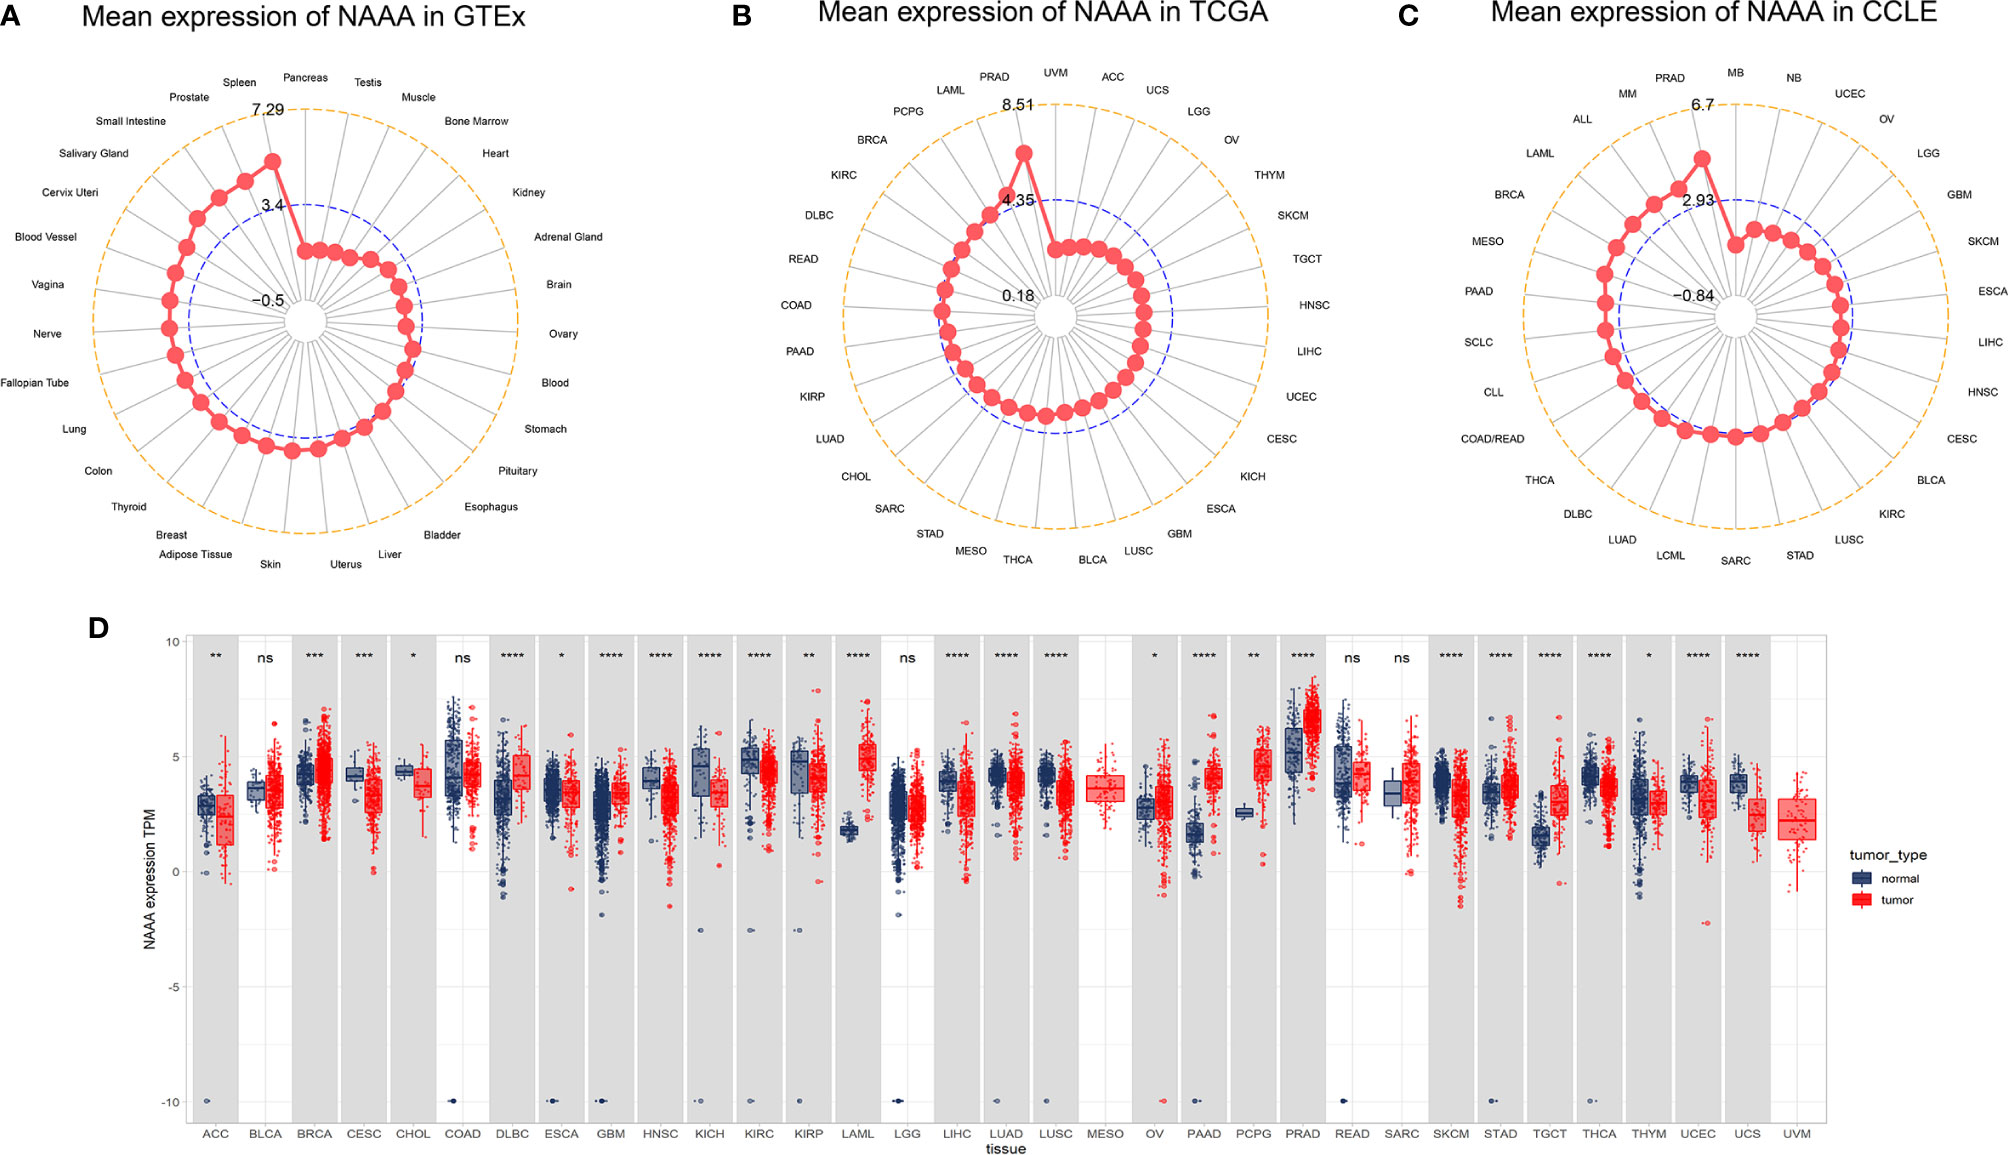
Figure 1 NAAA mRNA expression levels in pan-cancer. (A) NAAA expression levels in normal tissues from GTEx database. (B) NAAA expression levels in tumor tissues from TCGA database. (C) NAAA expression levels in tumor cell lines from CCLE database. (D) NAAA expression difference between tumor tissues from TCGA database and normal tissues from the GTEx database; ns, no significance; *p < 0.05, **p < 0.01, ***p < 0.001, and ****p < 0.0001.
We also assessed the relationship of NAAA mRNA expression in different pathological stages of multiple cancer types and found that it was lower in higher stages in three cancer types, including BRCA, PAAD, and UCEC. In contrast, higher NAAA expression in higher stages was observed in BLCA, MESO, READ, and UCS. However, a contradictory conclusion was observed in THCA; NAAA expression was downregulated in stage II when compared to stage I but upregulated in stage III (Supplementary Figure S1).
For paired tumors and normal tissues in TCGA, NAAA was expressed at low levels in COAD, HNSC, KICH, KIRC, KIRP, LIHC, LUAD, LUSC, READ, and THCA, while NAAA high expression was only observed in PRAD (Supplementary Figure S2).
Moreover, we further evaluated NAAA expression between normal and tumor tissues at protein level from HPA database. As shown in Figure 2, compared to weak IHC staining in normal stomach and breast, a much stronger staining of NAAA was detected in BRCA and STAD tissues. Normal ovary tissue samples had negative NAAA staining, while tumor tissues had weak staining. Normal prostate, liver, renal, colon, and endometrium had medium NAAA staining, while PRAD tissues had strong staining; and UCES, LIHC, KIRP, and COAD tissues had weak NAAA IHC staining. The data analysis results from the two databases were consistent with each other.
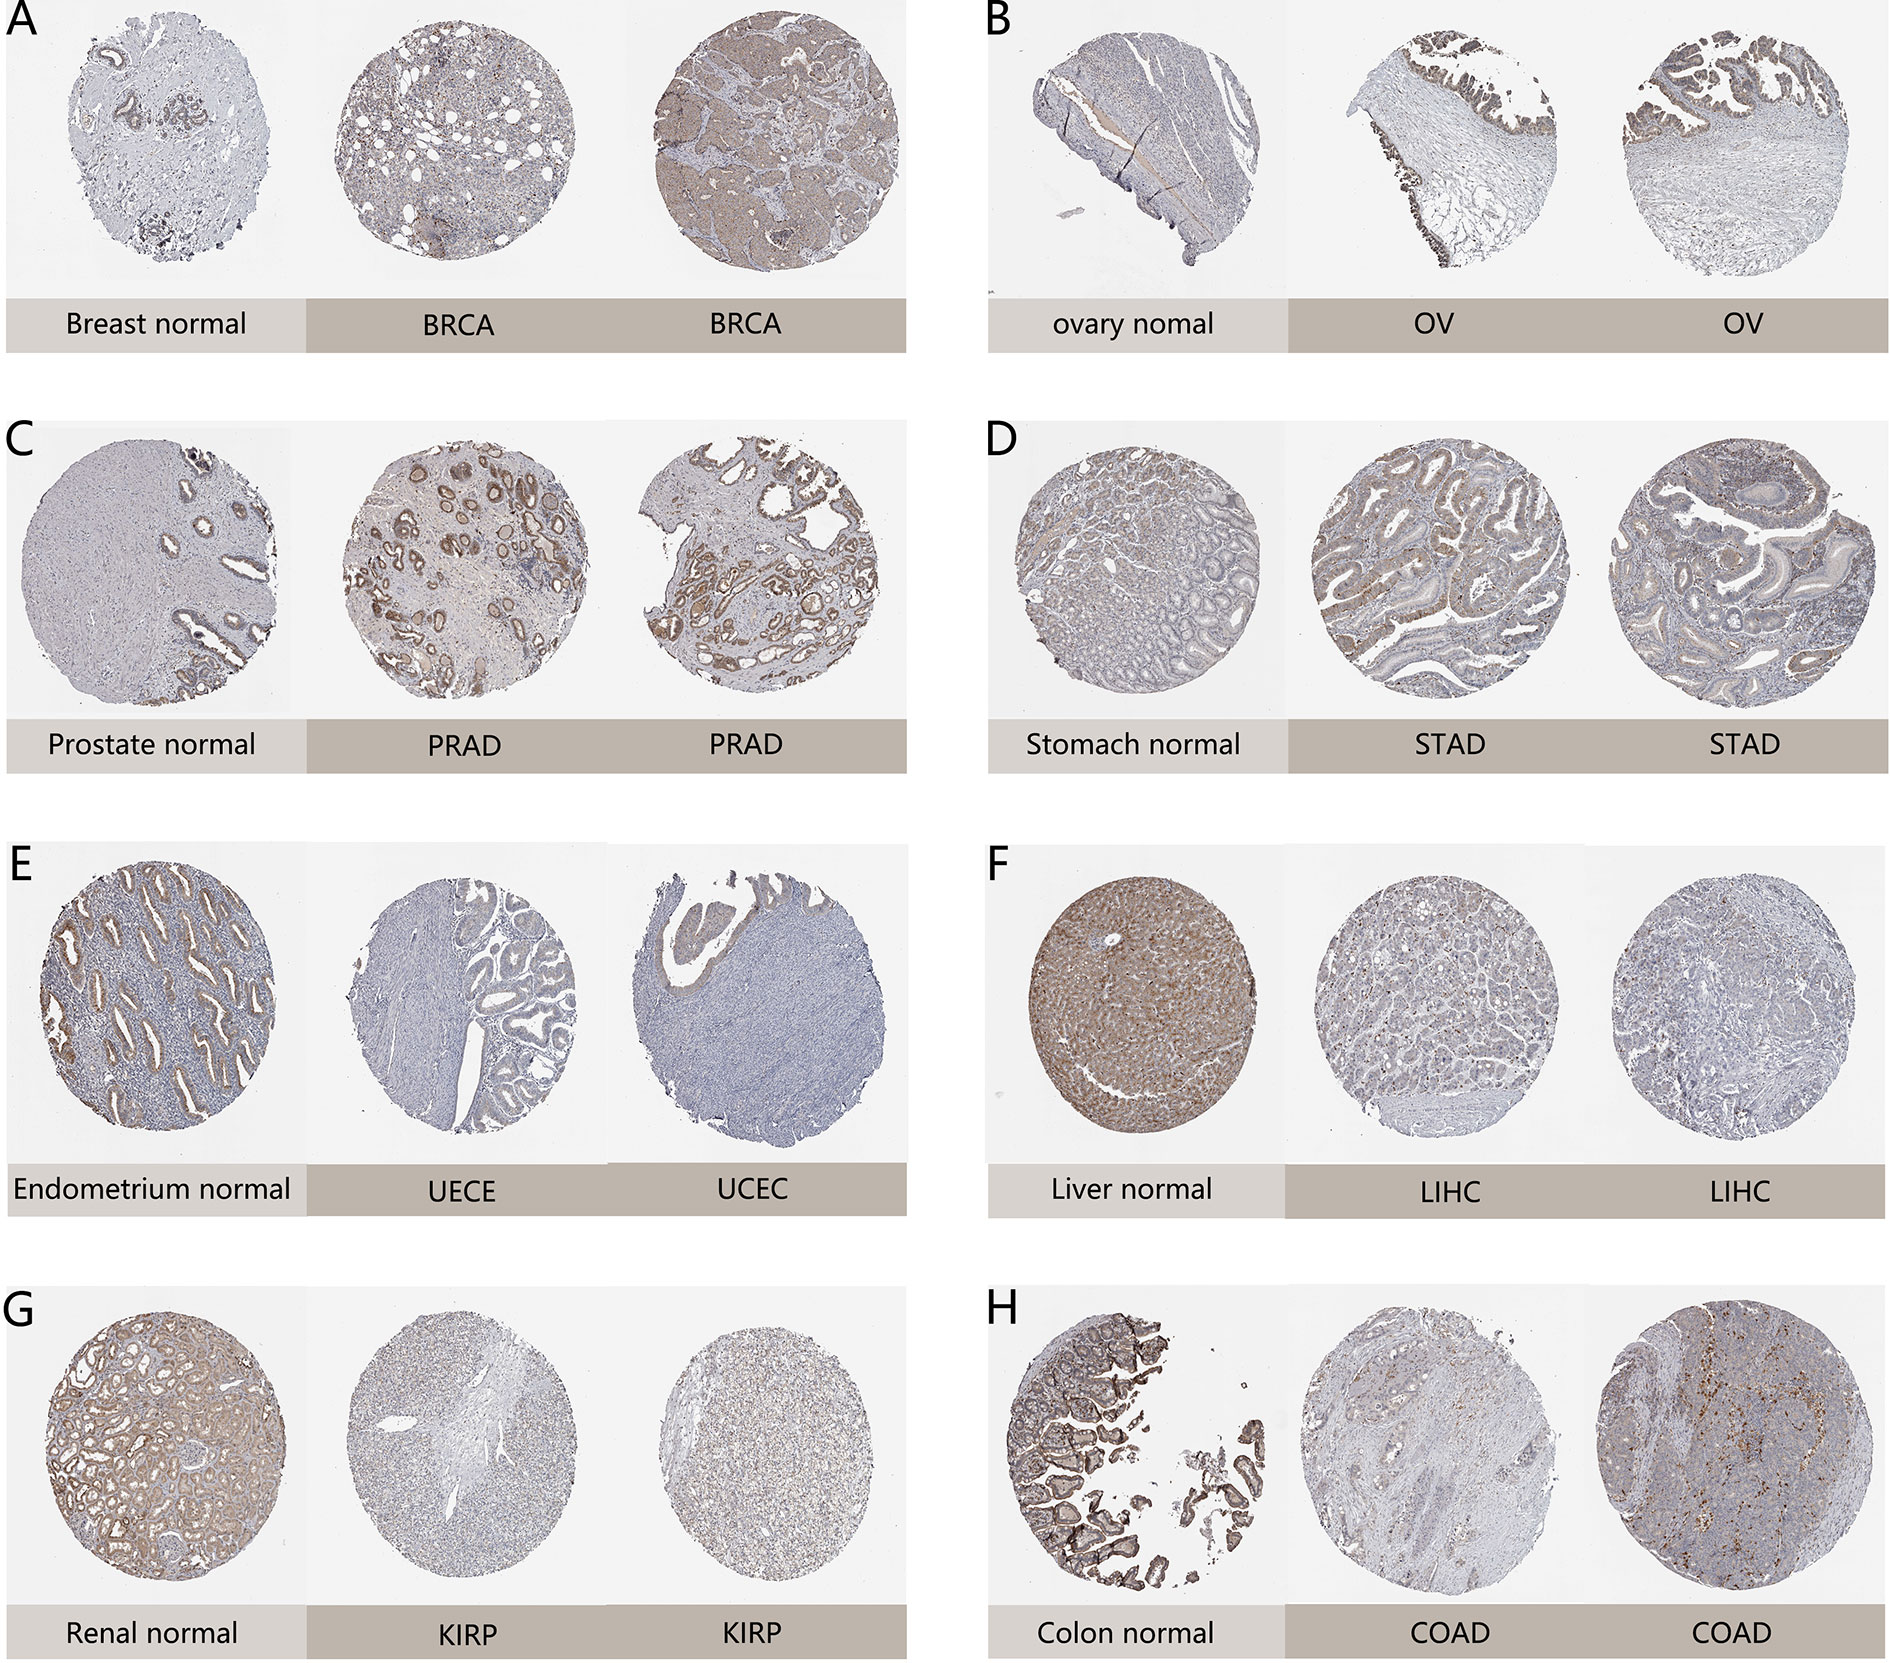
Figure 2 Representative immunohistochemical staining (IHC) in various normal (left) and tumor (right) tissues. The protein expression of NAAA in (A) lobular breast carcinoma, BRCA; (B) ovarian serous cystadenocarcinoma, OV; (C) prostate adenocarcinoma, PRAD; (D) stomach adenocarcinoma, STAD; (E) endometrial adenocarcinoma, UCEC; (F) liver hepatocellular carcinoma, LIHC; (G) kidney renal papillary cell carcinoma, KIRP; (H) colon adenocarcinoma, COAD.
Prognostic Value of NAAA
Next, we investigated the associations between NAAA expression and cancer survival outcomes, including OS, DSS, DFI, and PFI. As shown in Figure 3A, the results of univariate Cox regression analysis suggested that NAAA was a risk factor for OS in BRCA, LGG, THCA, and UVM patients, while it was a protective factor in PCPG and SKCM patients. The Kaplan-Meier OS analysis showed that high expression of NAAA was significantly correlated with poor prognosis of patients in BRCA, LGG, OV, UVM, TCGT, but better prognosis was found in SKCM Figures 3B–G. Then, Cox regression analysis of DSS identified that NAAA was a risk factor in BLCA, LGG, and UVM. However, it acted as a protective factor in KIRC, PCPG, and SKCM, as seen in Figure 4A. KM analysis showed that patients with higher NAAA expression had poorer DSS than those with lower NAAA expression in OV, LGG, UVM, and BRCA. Patients with increased NAAA levels showed superior DSS to those with decreased NAAA levels in KIRC and SKCM Figures 4B–G. Furthermore, Cox regression analysis of DFI analyses showed NAAA was a risk factor in HNSC (Figure 5A). And KM analysis showed that patients with higher NAAA expression had poorer DFI than those with lower NAAA expression in OV and HNSC, but contrasting result was shown in COAD, CHOL, and PRAD (Figure 5B–F). Finally, Cox regression analysis of PFI revealed that NAAA acts as risk factor for patients with BLCA, LGG, and UVM, while as a protective factor in COAD, PAAD, PCPG, and PRAD (Figure 6A). And KM analysis showed that patients with higher NAAA expression had poorer PFI than those with lower NAAA expression in UVM and reversely in COAD and PRAD, as seen in Figures 6B–D.
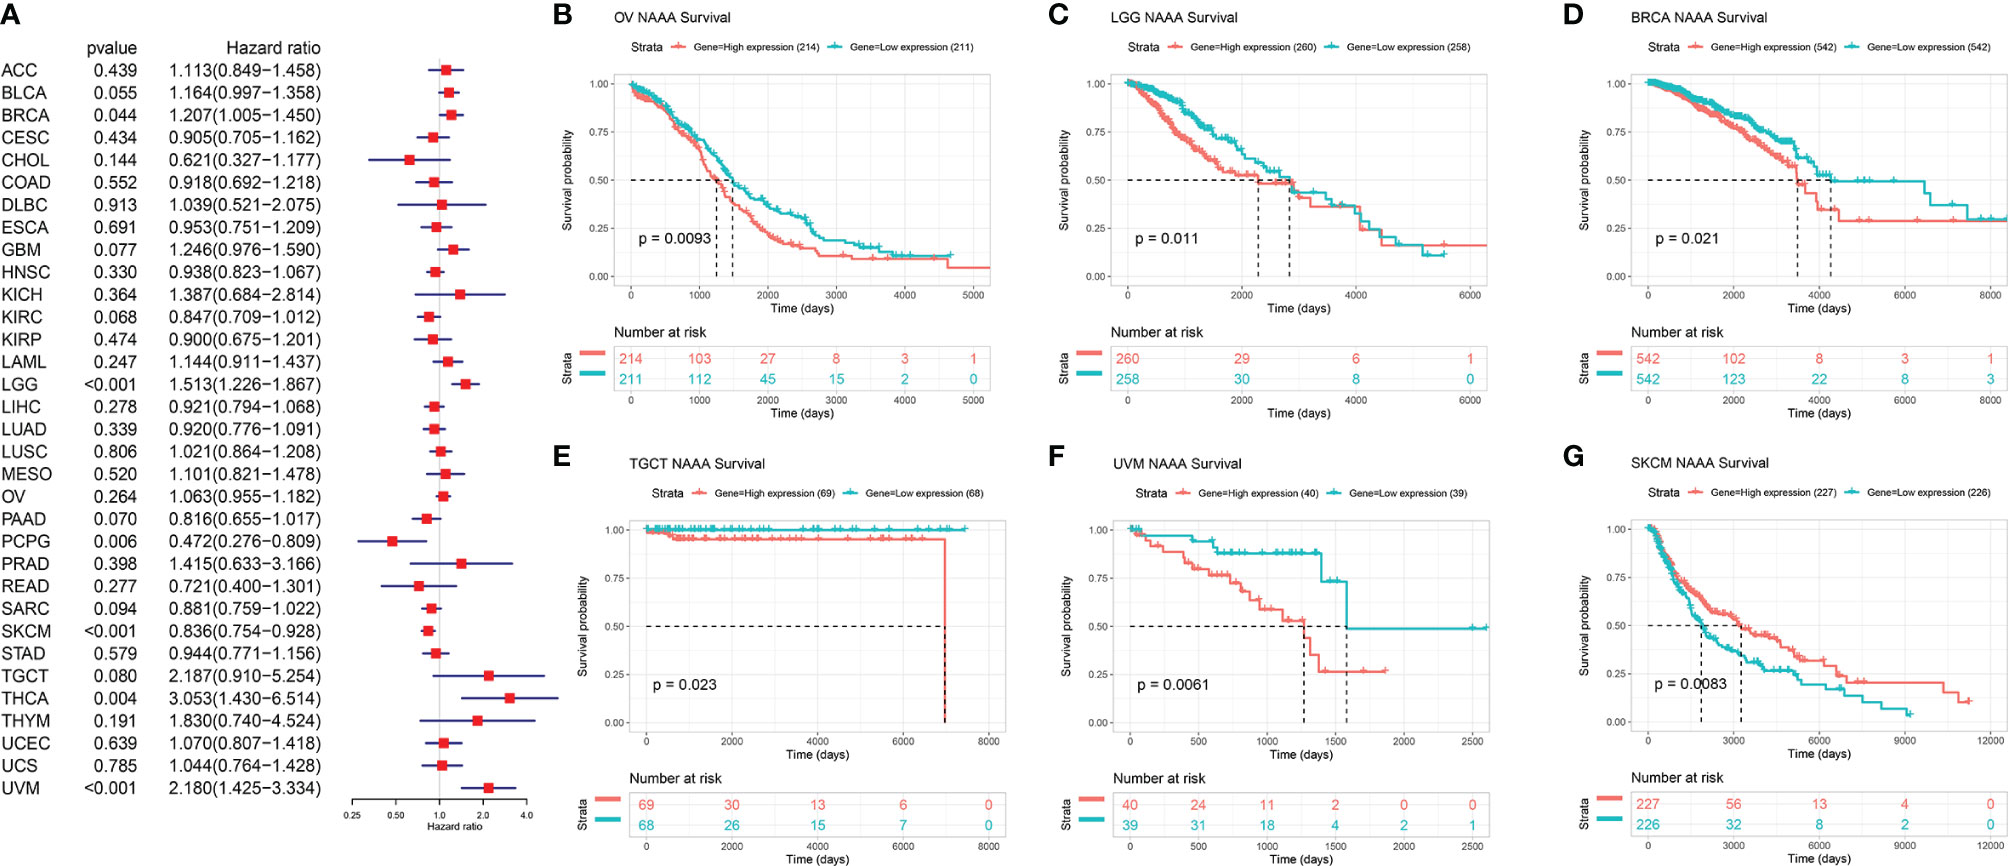
Figure 3 Relationship of NAAA expression with patient Overall Survival (OS). (A) Forest map shows the univariate Cox regression analysis results for NAAA in TCGA pan-cancer samples. (B–G) Kaplan–Meier OS curves of NAAA expression in the six most significantly associated tumors.
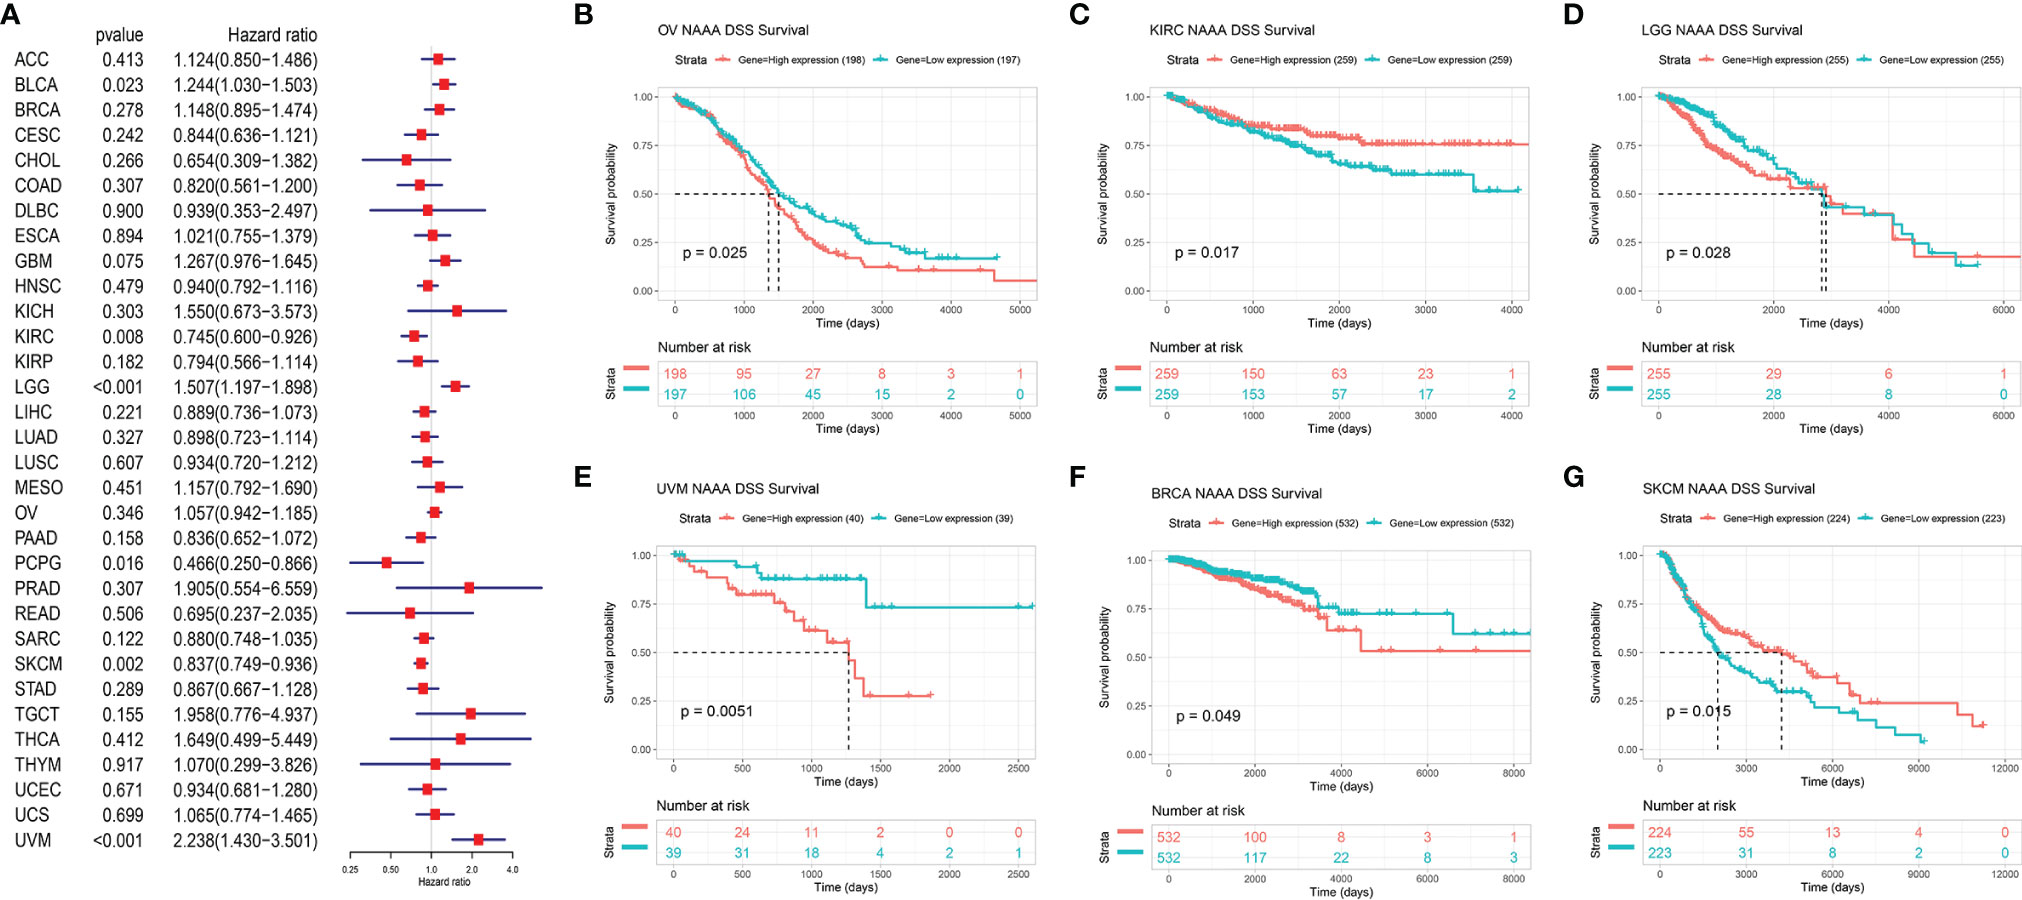
Figure 4 Relationship of NAAA expression with patient Disease-Specific Survival (DSS). (A) Forest map shows the univariate Cox regression analysis results for NAAA in TCGA pan-cancer samples. (B–G) Kaplan–Meier DSS curves of NAAA expression in the six most significantly associated tumors.
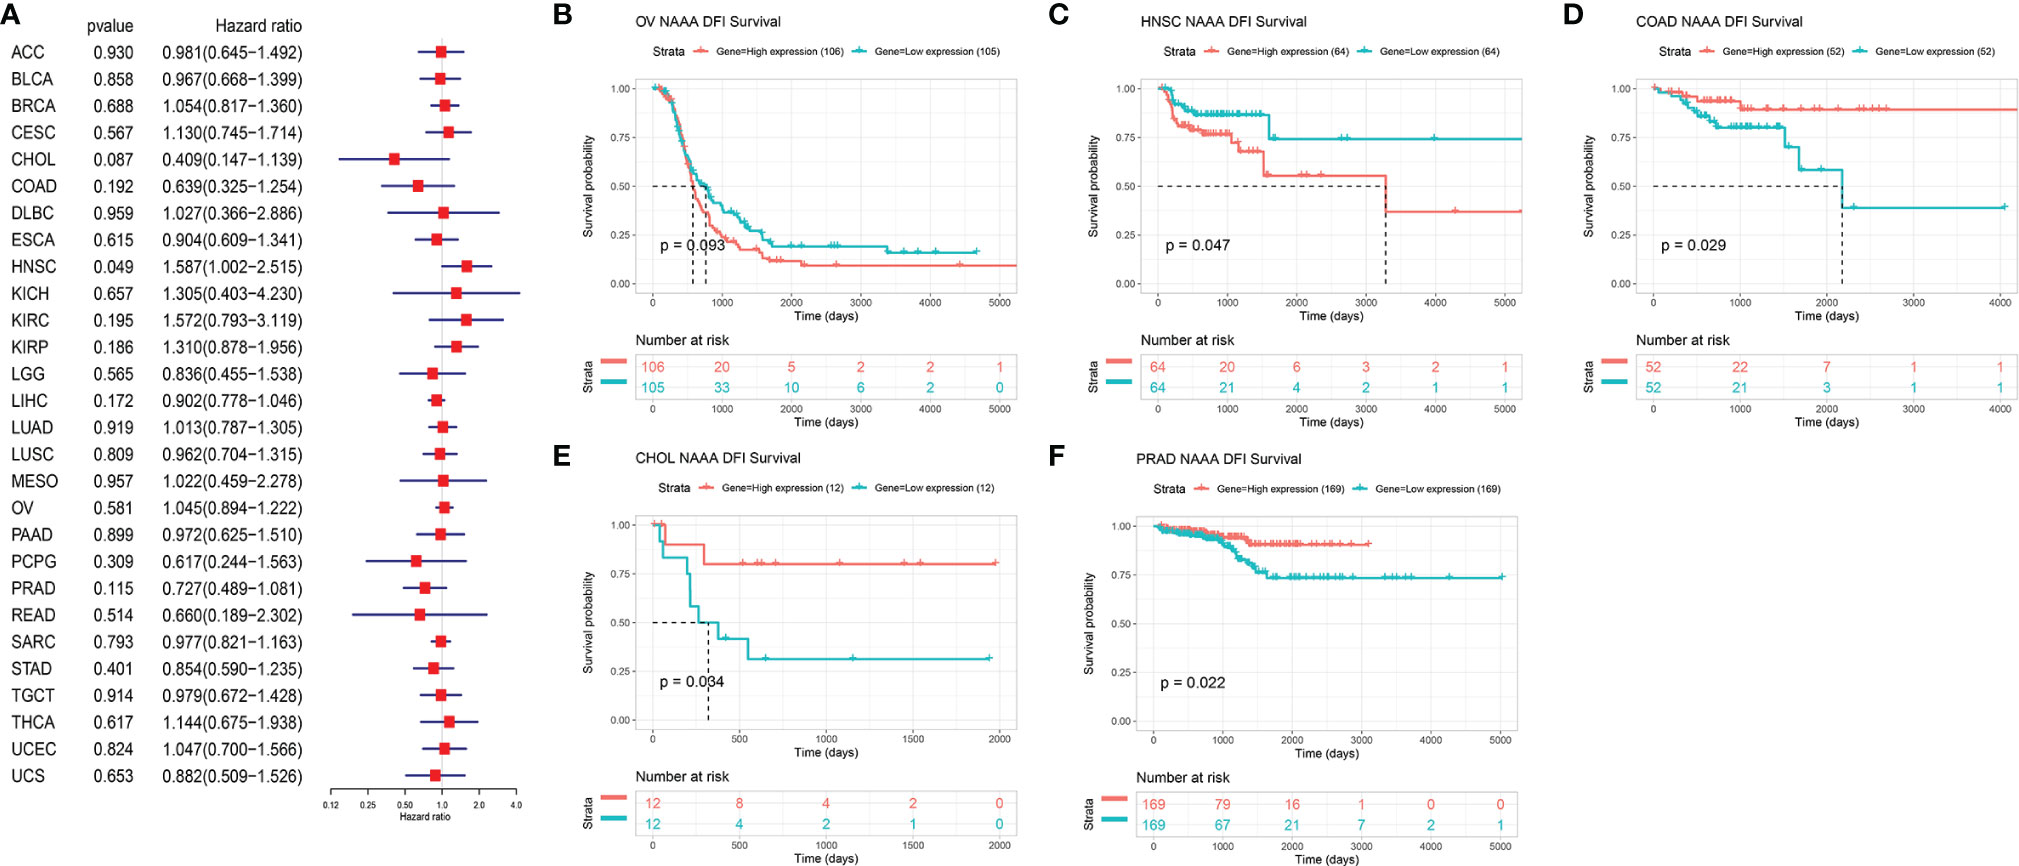
Figure 5 Relationship of NAAA expression with patient Disease-Free Interval (DFI). (A) Forest map shows the univariate Cox regression analysis results for NAAA in TCGA pan-cancer samples. (B–F) Kaplan–Meier DFI curves of NAAA expression in the five most significantly associated tumors.
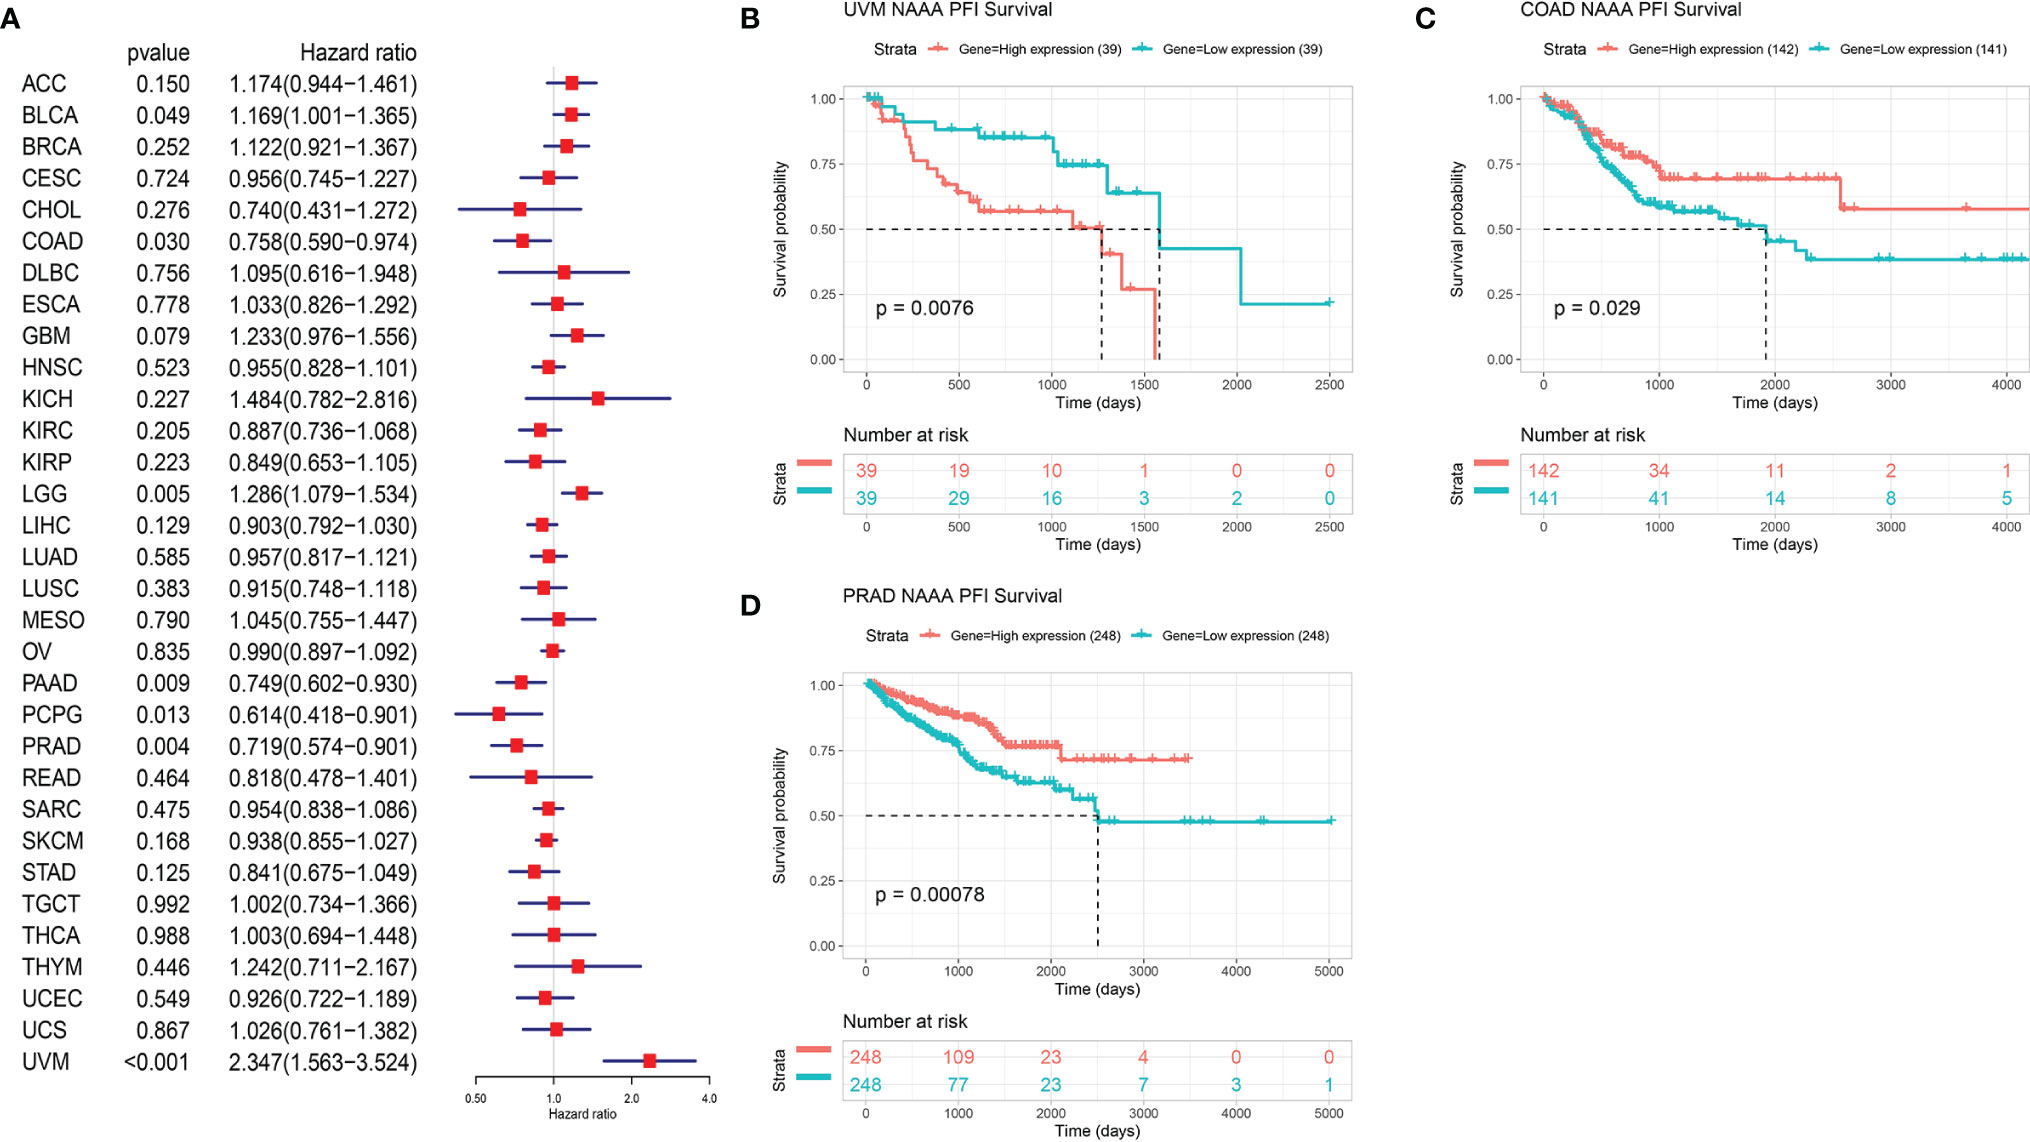
Figure 6 Relationship of NAAA expression with patient Progression-Free Interval (PFI). (A) Forest map shows the univariate Cox regression analysis results for NAAA in TCGA pan-cancer samples. (B–D) Kaplan–Meier PFI curves of NAAA expression in the three most significantly associated tumors.
Genetic Alteration of NAAA
DNA methylation and genetic alteration are closely associated with tumorigenesis and progression. We firstly assessed the NAAA alteration frequency and mutation count in cancer patients using cBioPortal database. Among all cancers, the highest alteration frequency of NAAA (> 4%) appears for patients in cervical cancer, with “mutation and deep deletion” as the primary types. The “amplification” type was the primary type in ESCA, CESC, pheochromocytoma, PAAD, and renal clear cell carcinoma, which show an alteration frequency of ~4% (Figure 7A). DNA methylation, as one of well-studied epigenetic modifications, often leads to the silencing or inactivation of tumor suppressor genes and thus contributes to initiation and proliferation of cancers (35, 36). We further calculated the levels of correlation between NAAA promoter methylation and identified significant correlations between gene expression and methylation in 22 tumors (Table 1). In ACC, BLCA, BRCA, CESC, COAD, ESCA, GBM, HNSC, KIRC, KIRP, LGG, LUAD, LUSC, PCPG, PRAD, SARC, SKCM, STAD, THCA, THYM, UCEC, and UVM, there were negative correlations between NAAA expression and promoter methylation levels. The six strongest negative correlations (BRCA, ESCA, HNSC, KIRP, LGG, and SKCM) are presented in Figure 7B. Further, the correlation analysis between NAAA and copy number variation (CNV), another commonly seen genetic mutation, was also performed in pan-cancer (37). The results revealed that the mRNA expressions of NAAA was mainly positively correlated with CNV (Table 1). In BLCA, BRCA, CESC, COAD, ESCA, GBM, HNSC, KIRC, KIRP, LGG, LIHC, LUAD, LUSC, MESO, OV, PAAD, SARC, STAD, TGCT, THCA, UCEC, and UCS, there were positive correlations between NAAA expression and promoter methylation levels; the six strongest positive correlations (BRCA, CESC, LIHC, LUSC, LUAD, and OV) are presented in Figure 7C.
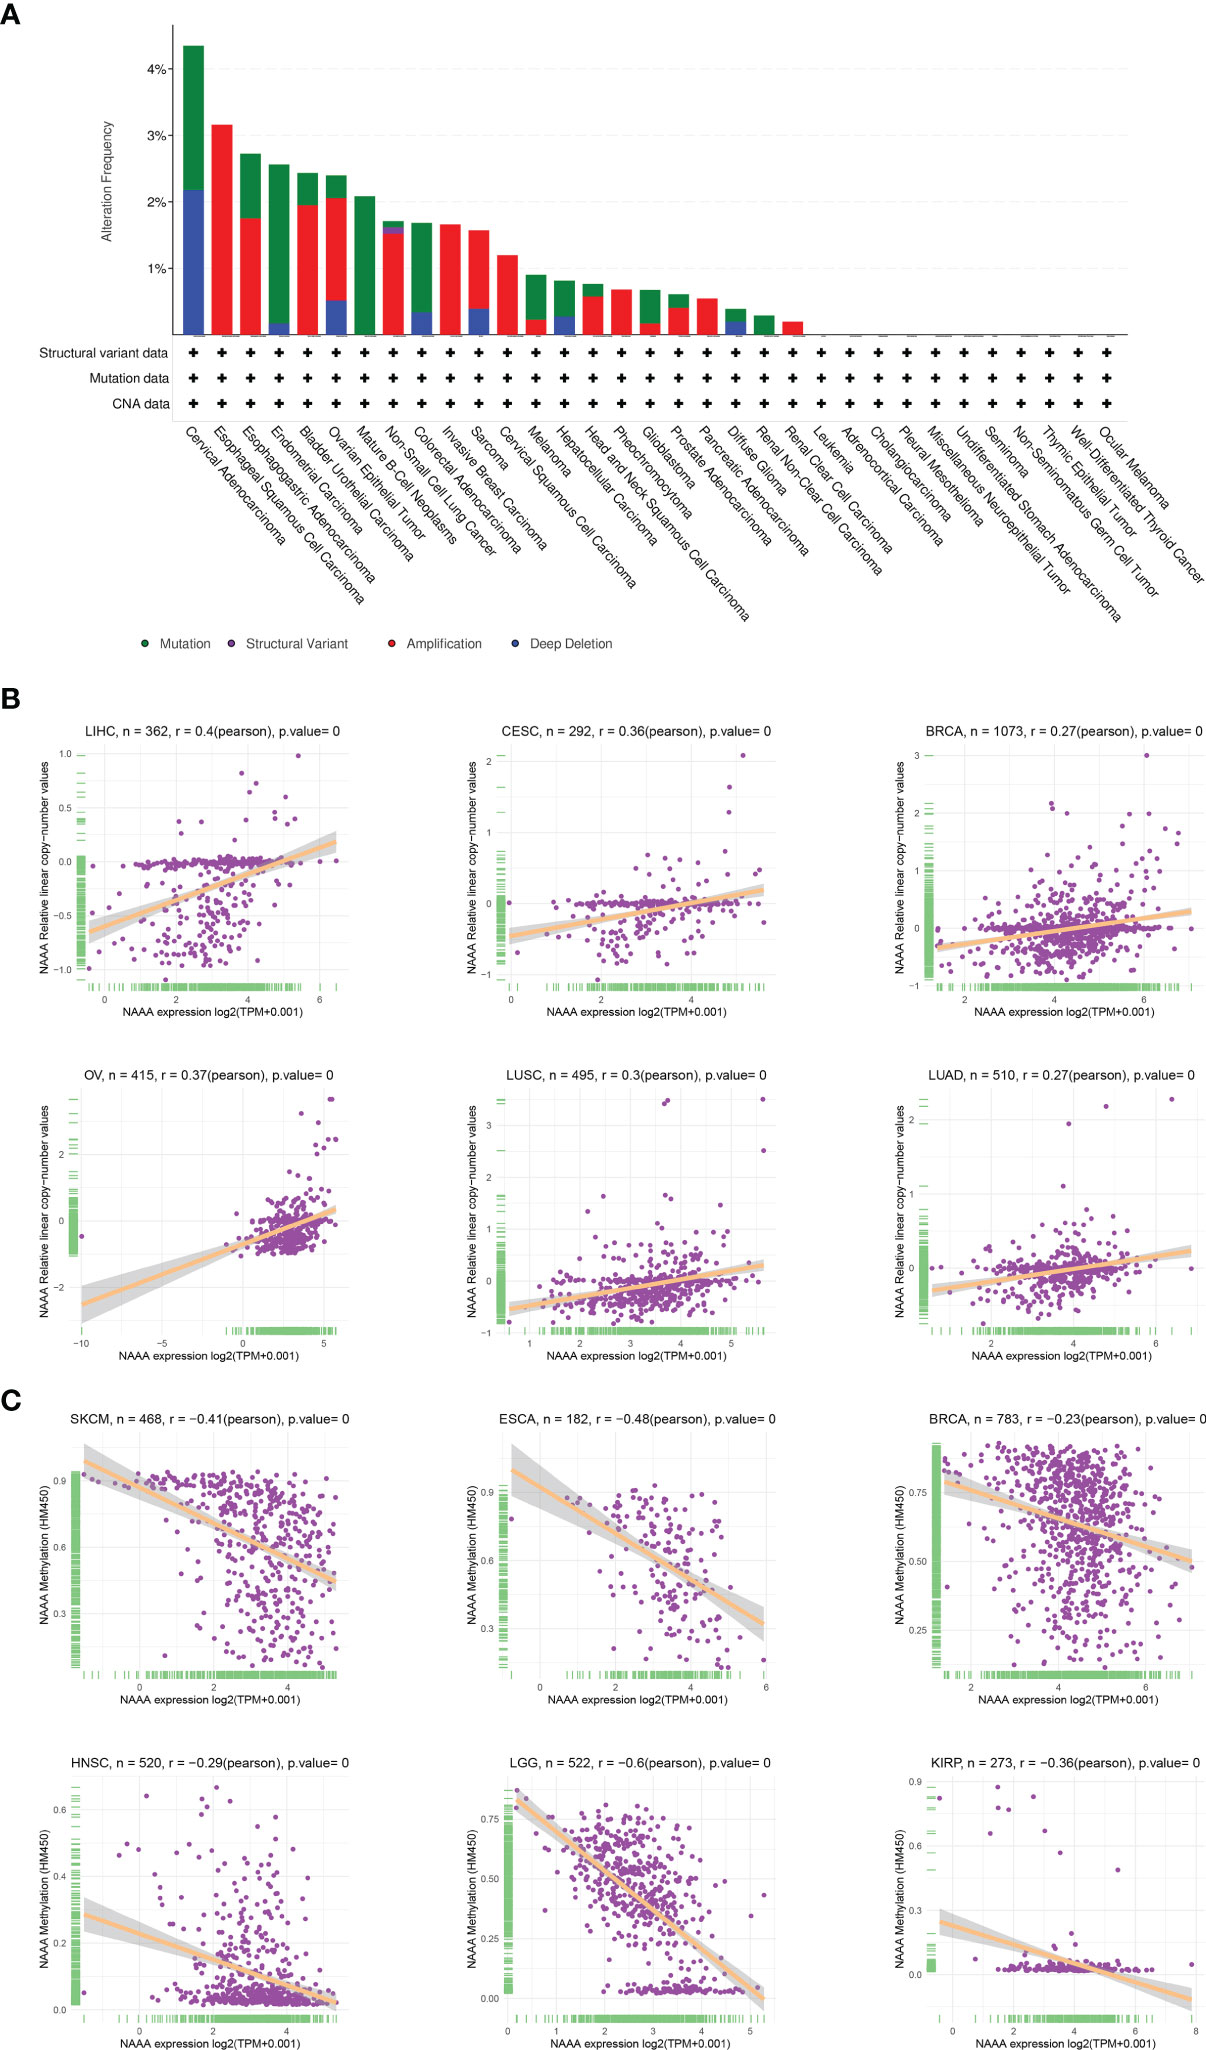
Figure 7 Relationship of NAAA expression with gene alterations. (A) The genetic alteration type and frequency of NAAA in various cancers. (B) Correlation between NAAA expression and gene promoter methylation in liver hepatocellular carcinoma (LIHC), cervical squamous cell carcinoma (CESC), breast invasive carcinoma (BRCA), ovarian cancer (OV), lung squamous cell carcinoma (LUSC), lung adenocarcinoma (LUAD). (C) Correlation between NAAA expression and copy number variation in skin cutaneous melanoma (SKCM), esophageal carcinoma (ESCA), breast invasive carcinoma (BRCA), head and neck squamous cell carcinoma (HNSC), brain lower grade glioma (LGG), kidney renal papillary cell carcinoma (KIRP).
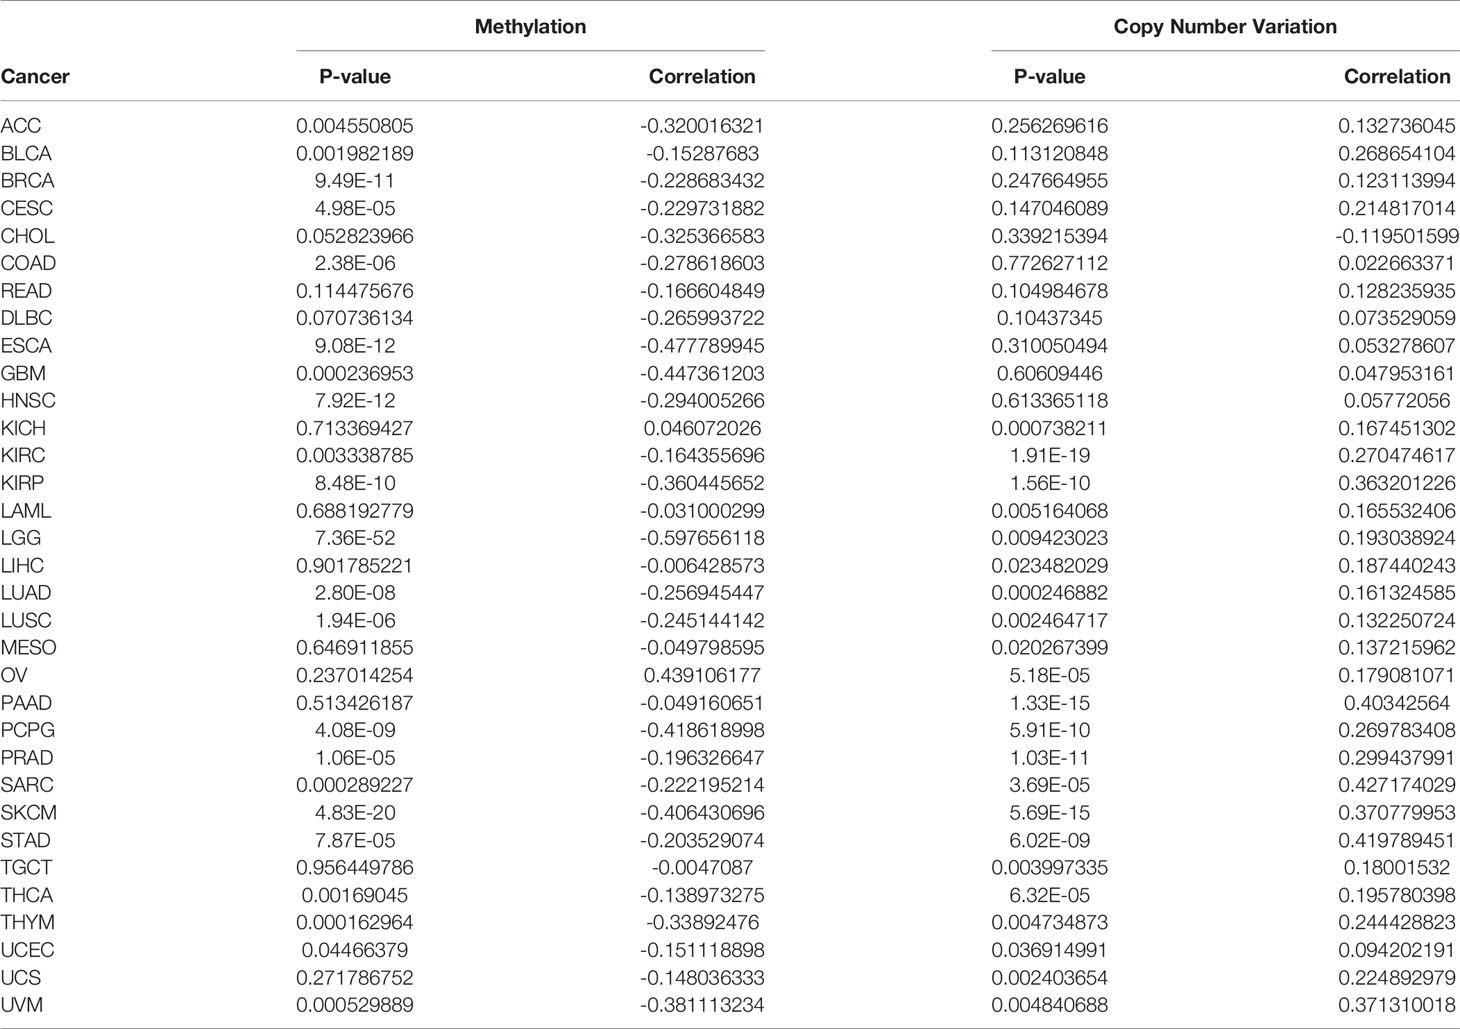
Table 1 Correlation of NAAA expression with methylation and copy number variation analysis.
GSEA of NAAA Analysis
To investigate the biological function of NAAA expression in different tumor tissues, we evaluated the pathway through which NAAA may involve using GSEA in 33 tumor types from TCGA. The results revealed that NAAA participates in immune regulation-related pathways in pan-cancer, especially for the adaptive immune system, the innate immune system, immunoregulatory interactions between lymphoid, neutrophil degranulation, and Toll-like receptor signaling pathways (TLRs) (Figures 8A–F). These results suggest that NAAA plays an important role in regulating the inflammatory response and the tumor immune microenvironment.
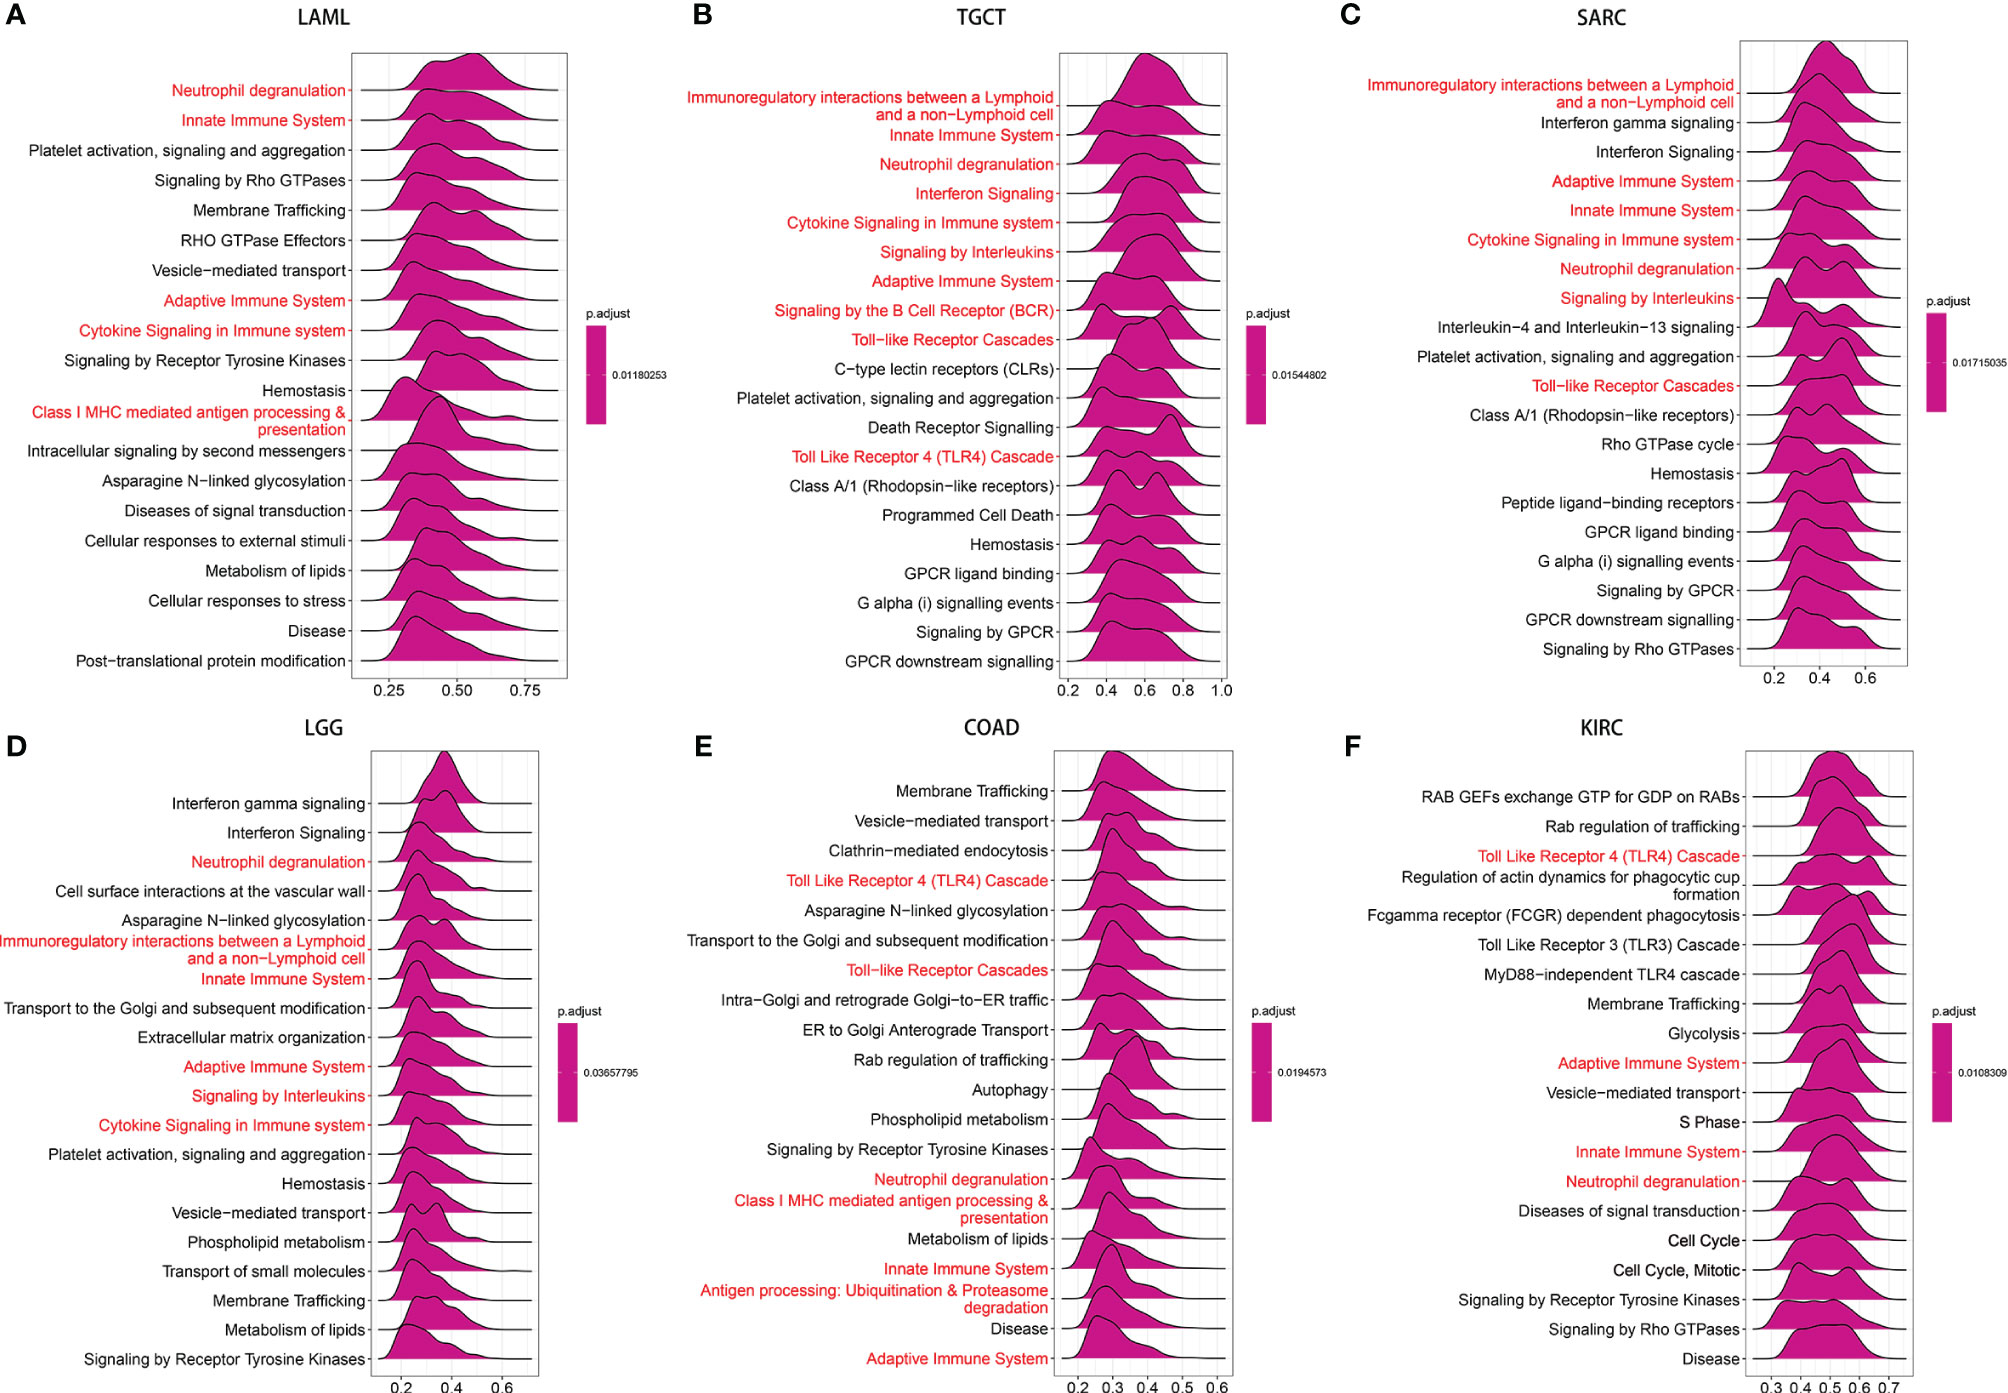
Figure 8 GSEA of NAAA in pan-cancer. (A–F) TOP20 GSEA terms in indicated tumor types. Red indicates immune regulation-related terms.
Tumor Microenvironment Analysis
As the survival places of tumor cells, the tumor microenvironment plays a crucial role in multidrug resistance and contribute to the development of cancer cell progression and metastasis. Therefore, we investigated the correlations of NAAA expression and the composition of tumor microenvironment by adopting ESTIMATE algorithm to calculate the immune and stromal scores, respectively. As shown in Table 2, NAAA expression was positively correlated with the immune scores in DLBC, TGCT, SARC, UVM, LUSC, LAML, GBM, SKCM, LUAD, MESO, OV, HNSC, BLCA, ESCA, KIRC, LGG, STAD, THCA, CESC, PAAD, LIHC, BRCA and negatively correlated with the Immune Score in PRAD. In addition, the expression of NAAA was positively correlated with the stromal scores in 11 cancer types, including SARC, GBM, LAML, TGCT, SKCM, LUSC, THYM, UVM, LUAD, MESO, DLBC, OV, LGG, HNSC, THCA, BLCA, PAAD, LIHC, KIRC, STAD, ESCA, BRCA, KIRP, and CESC, while negatively correlated in PARD and PCPG (Table 2). The five cancer types of poor OS (according to Kaplan-Meier and Cox survival analyses) with a positive correlation between TME and NAAA expression are presented in Figure 9.
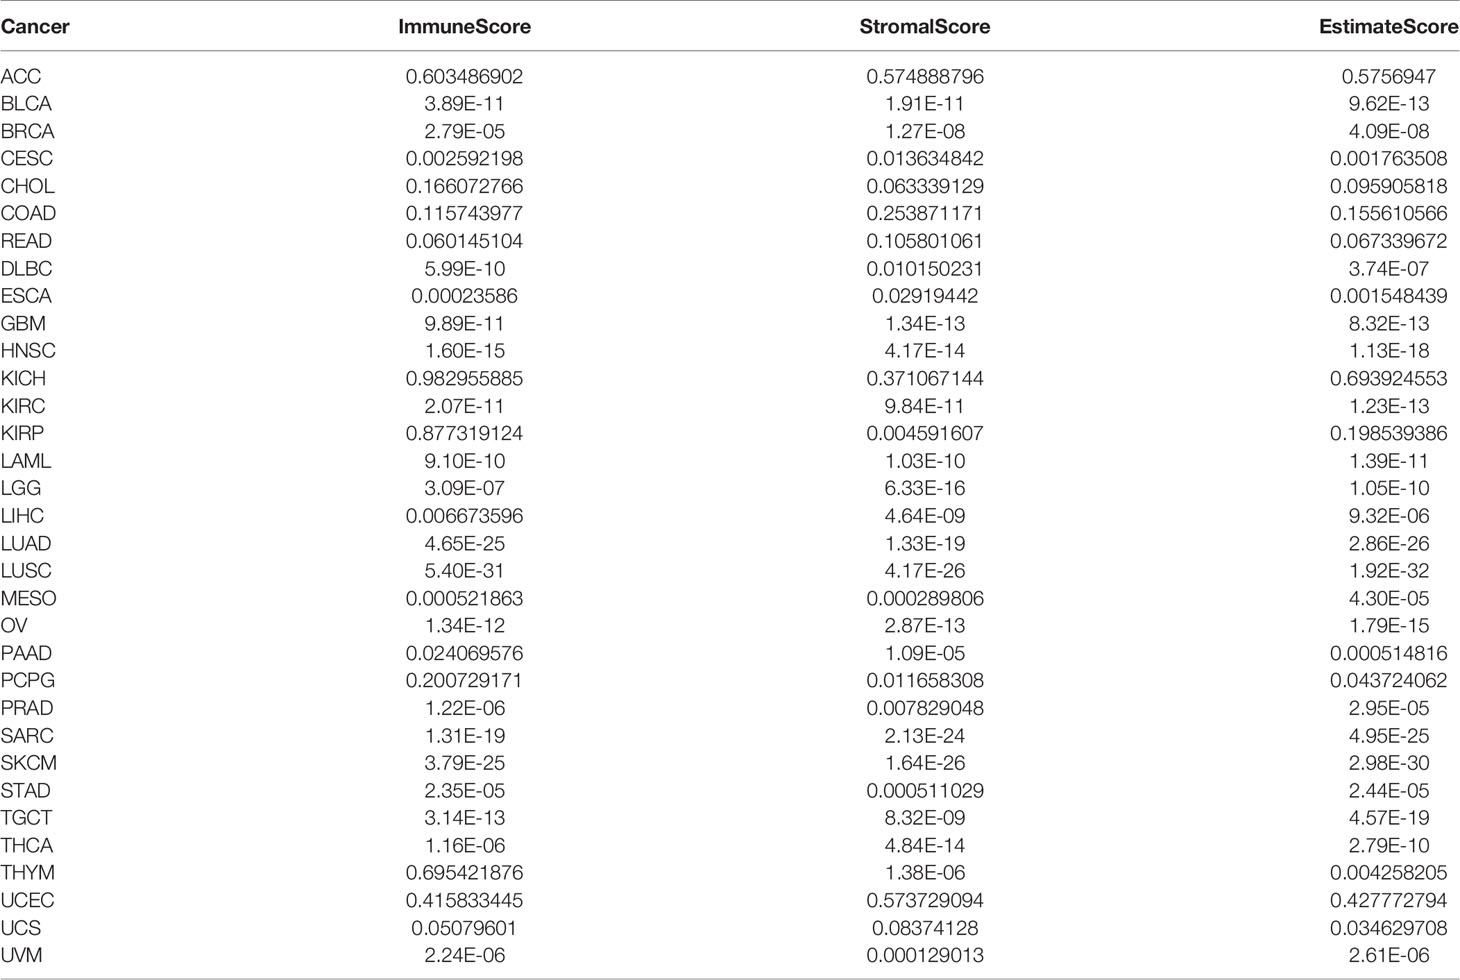
Table 2 Correlation of NAAA expression with ImmuneScore and StromalScore analysis.
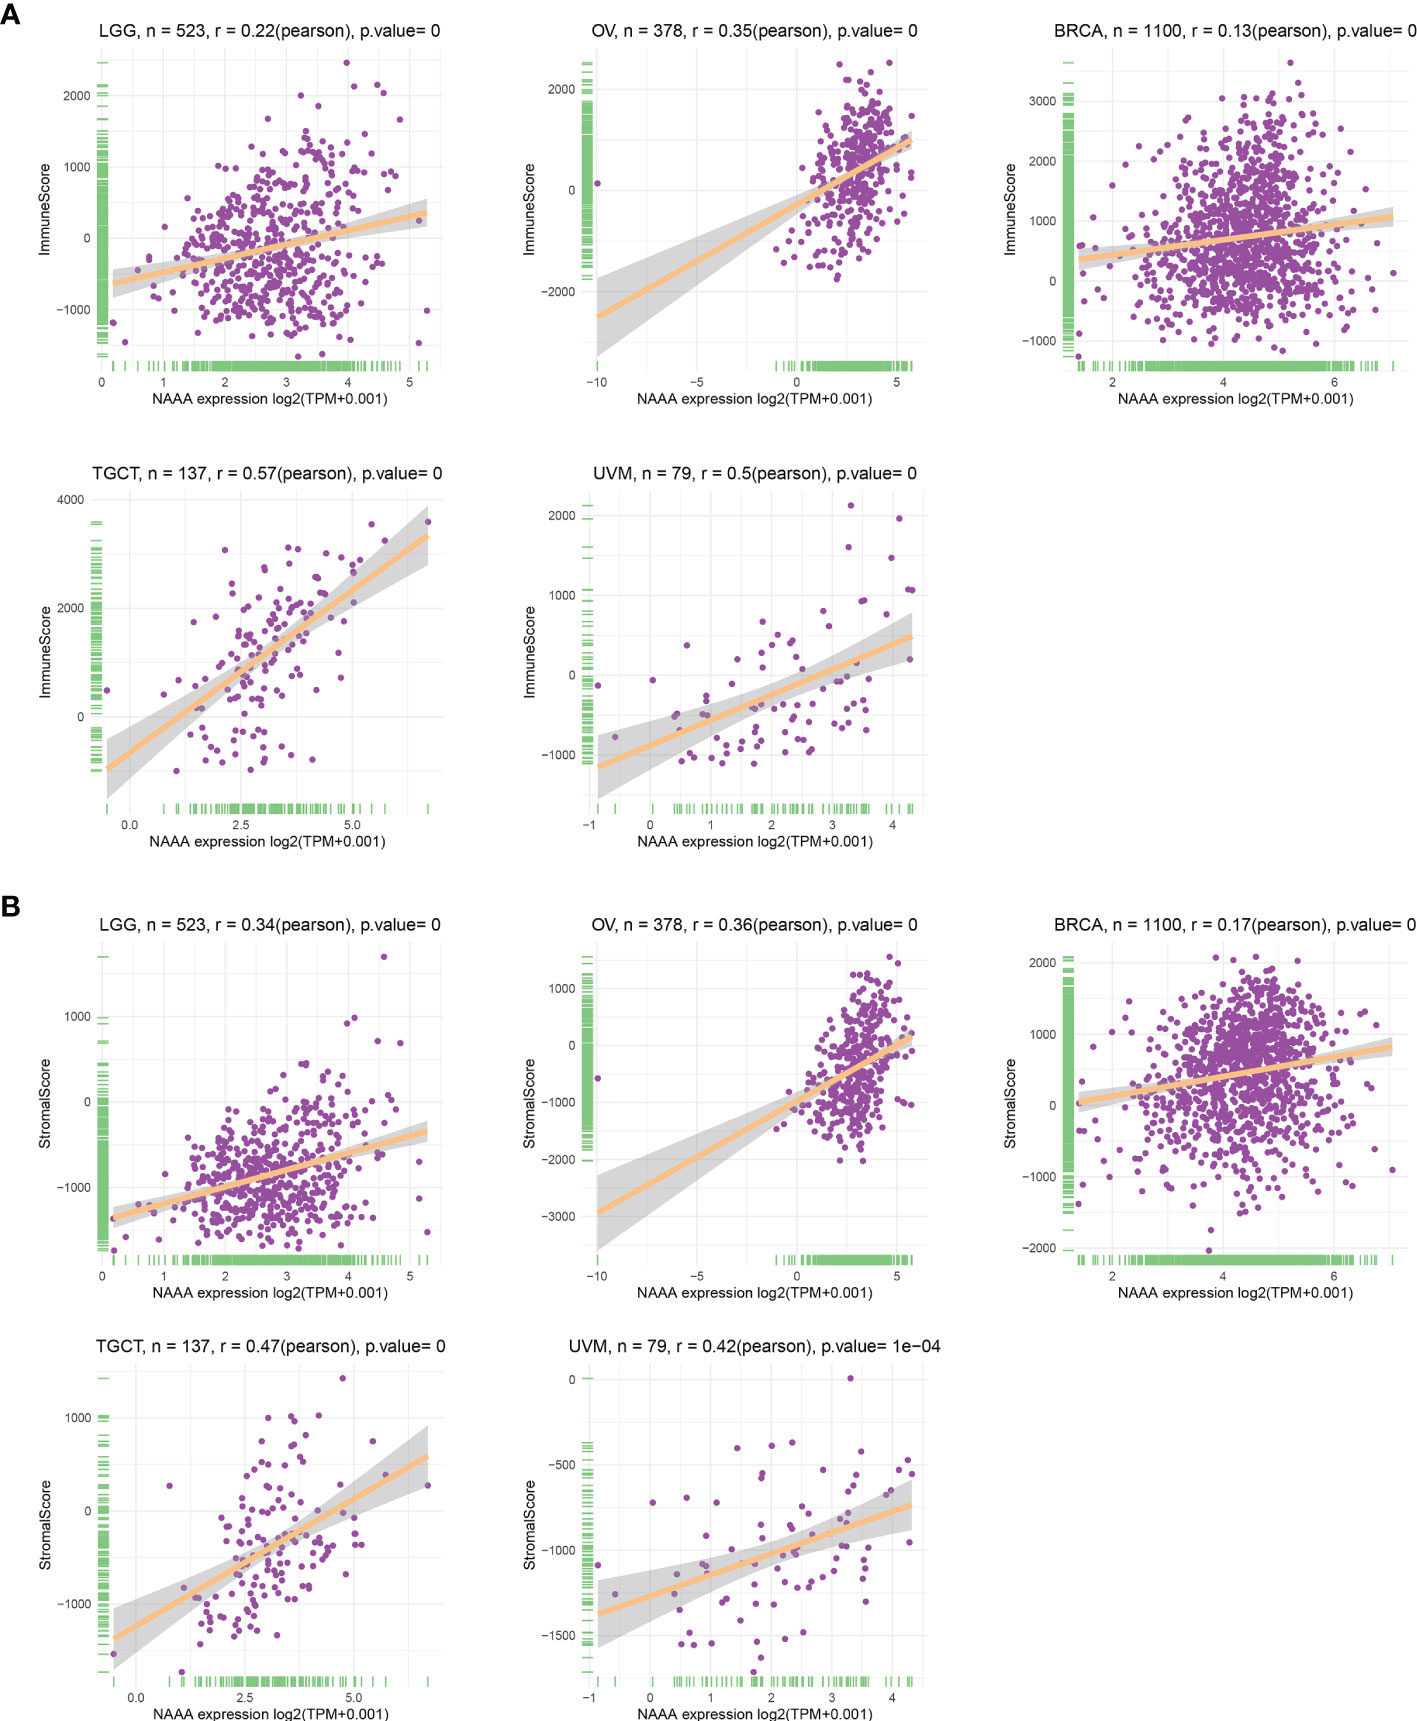
Figure 9 Relationship of NAAA expression with stromal score and immune score in five cancers. NAAA expression has a significantly positive correlation with the StromalScore (A) and ImmuneScore (B) in LGG, OV, BRCA, TGCT, UVM. BRCA, breast invasive carcinoma; LGG, brain lower grade glioma; UVM, uveal melanoma; OV, ovarian cancer; TGTC, testicular germ cell tumors.
Immune Cell Infiltration Analysis
To investigate the relationship of immune cell infiltration and NAAA expression at the pan-cancer level, we downloaded immune cell infiltration data from various database to conducted correlation analyses. According to published data, we evaluated the 26 immune cells using “CIBERSOFT” algorithm. Overall, NAAA expression was positively correlated with infiltrating levels of multiple immune cells including macrophages, CD4+ T cells, dendritic cells, and Tregs, whereas it was negatively correlated with memory B cells, naïve T cells, dendritic cells, plasma cells, and NK cells. Interestingly, the expression of NAAA had different relationships with different subgroups of infiltrating macrophages, which positively correlated with the levels of infiltrating M1 and M2 macrophages but negatively associated with M0 macrophages (Figure 10A). Furthermore, the results of the TIMER2 database also proved that NAAA expression positively correlated with the infiltration level of TAMs (Figure 10B). In line with above results, data from the ImmuCellAI database obtained the same result that NAAA expression was positively correlated with the level of TAMs in pan-cancer (Figure 10C). The results of immune cell infiltration data from the three different sources were consistent. These results indicate that NAAA may contribute to increase the infiltration levels of TAMs, which may explain its tumorigenicity role in most tumor types.
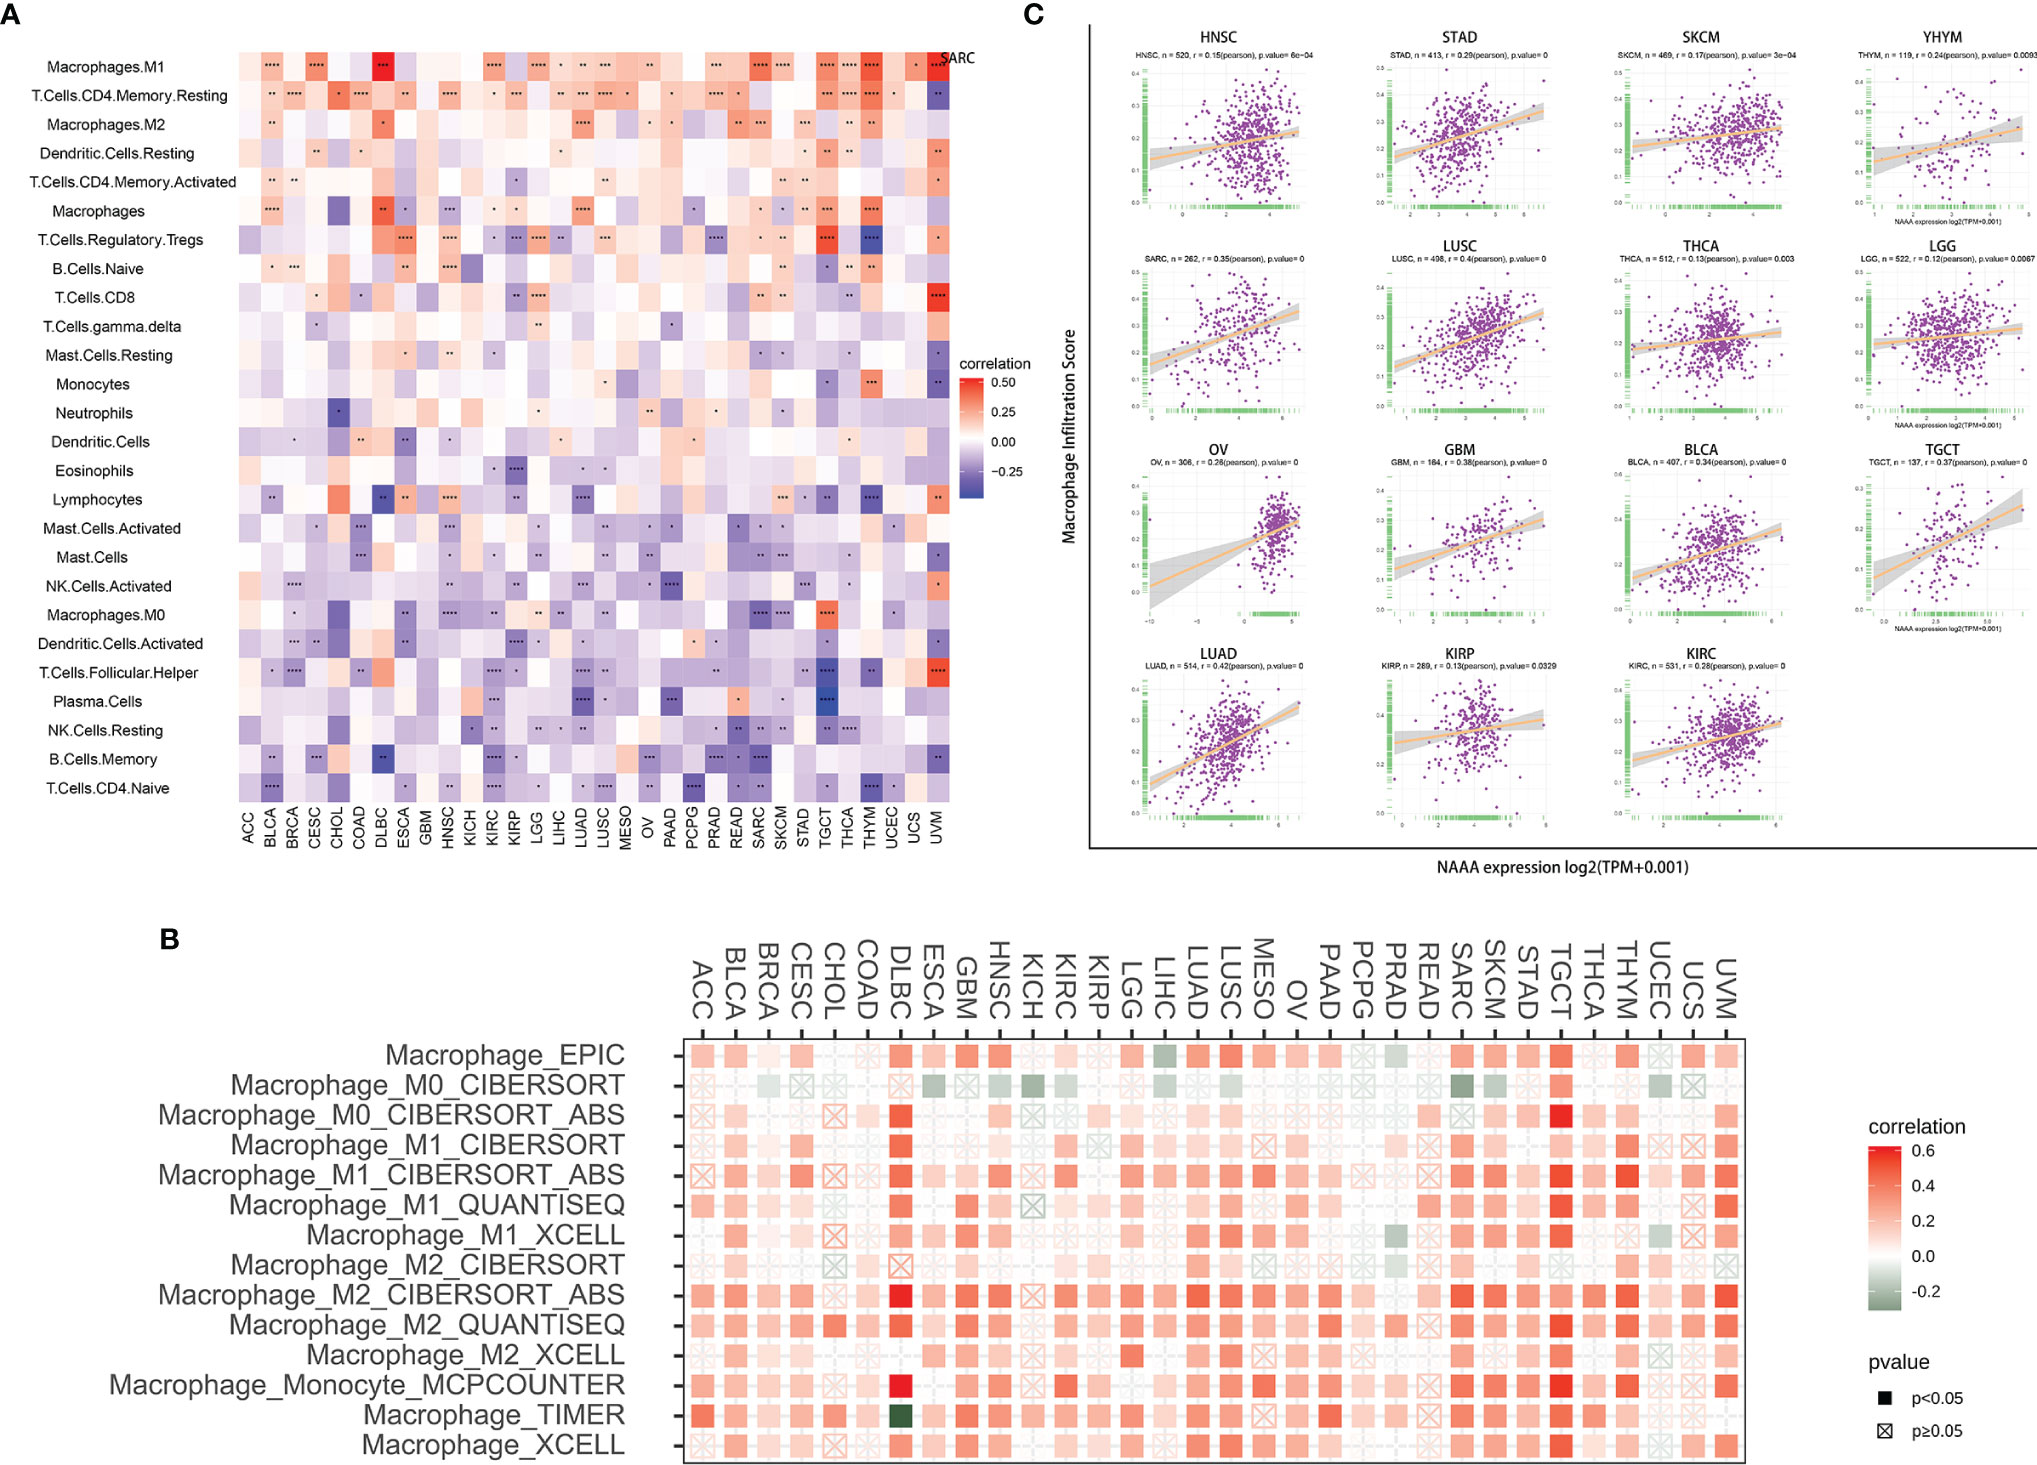
Figure 10 Relationship of NAAA expression with Immune cell infiltration analysis. (A) The relationship between NAAA expression levels and the levels of infiltration of 26 immune-related cells. (B) The correlation between NAAA expression and TAM infiltration levels by using TIMER2 database. (C) The correlation between NAAA expression and TAM infiltration by using ImmuCellAI database.
Tumor Mutational Burden and Microsatellite Instability Analysis
TMB and MSI have been well-known to predict immune therapy response across different tumor types. Many studies revealed that patients with high TMB/MSI-H increased response rates and showed better outcomes to treatment with immunotherapy. We then evaluated their respective relationships with NAAA expression in pan-cancer, as shown in Figure 11. The correlation between NAAA expression and TMB achieved significance (P< 0.05) in four types of cancer. In general, NAAA expression was negatively correlated with TBM in GBM, KIRC, and SKCM while positively correlated with TMB only in STAD (Figure 11A). Similarly, we further found that the expression of NAAA was negatively related to the MSI of nine cancers, including BRCA, DLBC, HNSC, LUSC, OV, PRAD, SKCM, TGCT, and THCA, but had a positive correlation with MSI only in LAML (Figure 11B).
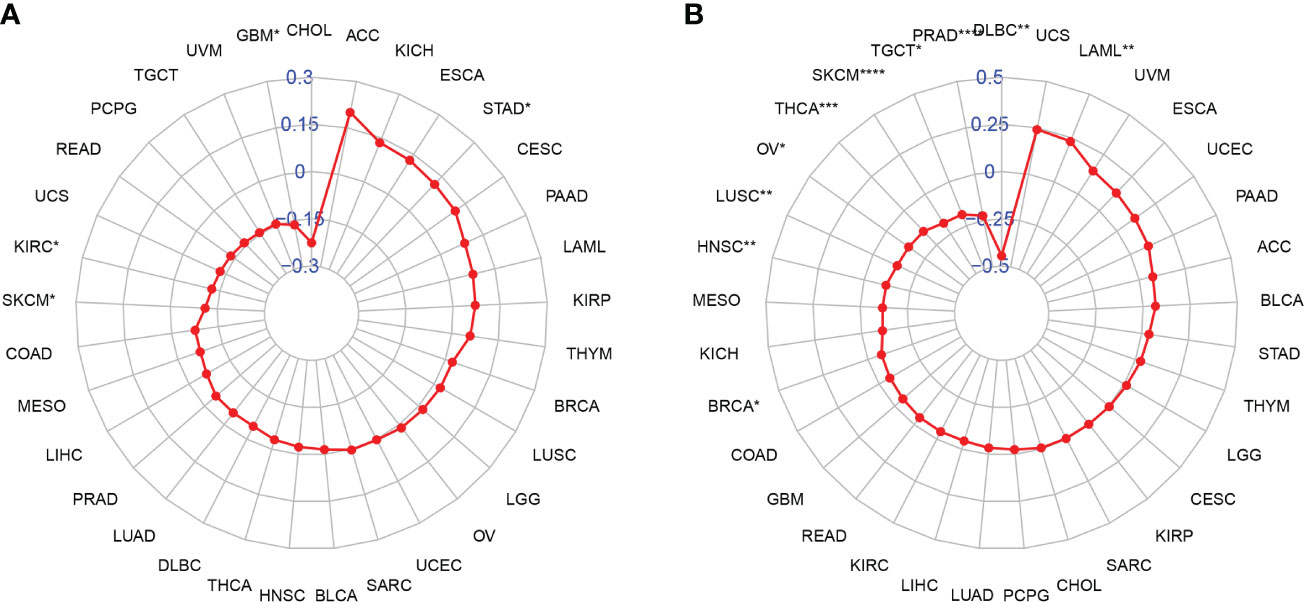
Figure 11 Relationship of NAAA expression and tumor mutational burden (TMB), microsatellite instability (MSI). (A) Radar map illustrating the relationship between NAAA expression and TMB. (B) Radar map illustrating the relationship between NAAA expression and MSI. The red lines represent correlation coefficients, and blue values represent ranges. Spearman correlation test, *p < 0.05, **p < 0.01, ***p < 0.001, and ****p < 0.0001.
Immune-Related Genes Analyses
Furthermore, we conducted gene co-expression analyses to explore the relationships between NAAA expression and immune-related genes in different cancer types. Genes encoding MHC, immune activation, immune suppression, chemokine, and chemokine receptor proteins were analyzed (Figure 12). According to the results, strong correlations were found between NAAA and most of the immune-related genes in specific cancer types, such as OV, UVM, DLBC, THYM, and TGCT. In detail, chemokine receptors such as CCR1, CCR5, and CCR2 and chemokines such as CXCL16, CXCL9, and CXCL10 were positively correlated with NAAA expression in various tumors. MHC genes had co-expression with NAAA in almost all cancer types, particularly in UVM, OV, THYM, TGCT, KIRC, SARC, and SKCM. In addition, immune activation genes and immunosuppressive genes were also closely correlated with NAAA expression in TCGA pan-cancer. To conclude, these results show that the expression of NAAA closely correlates with the biological function of various immune-related genes and cytokines.
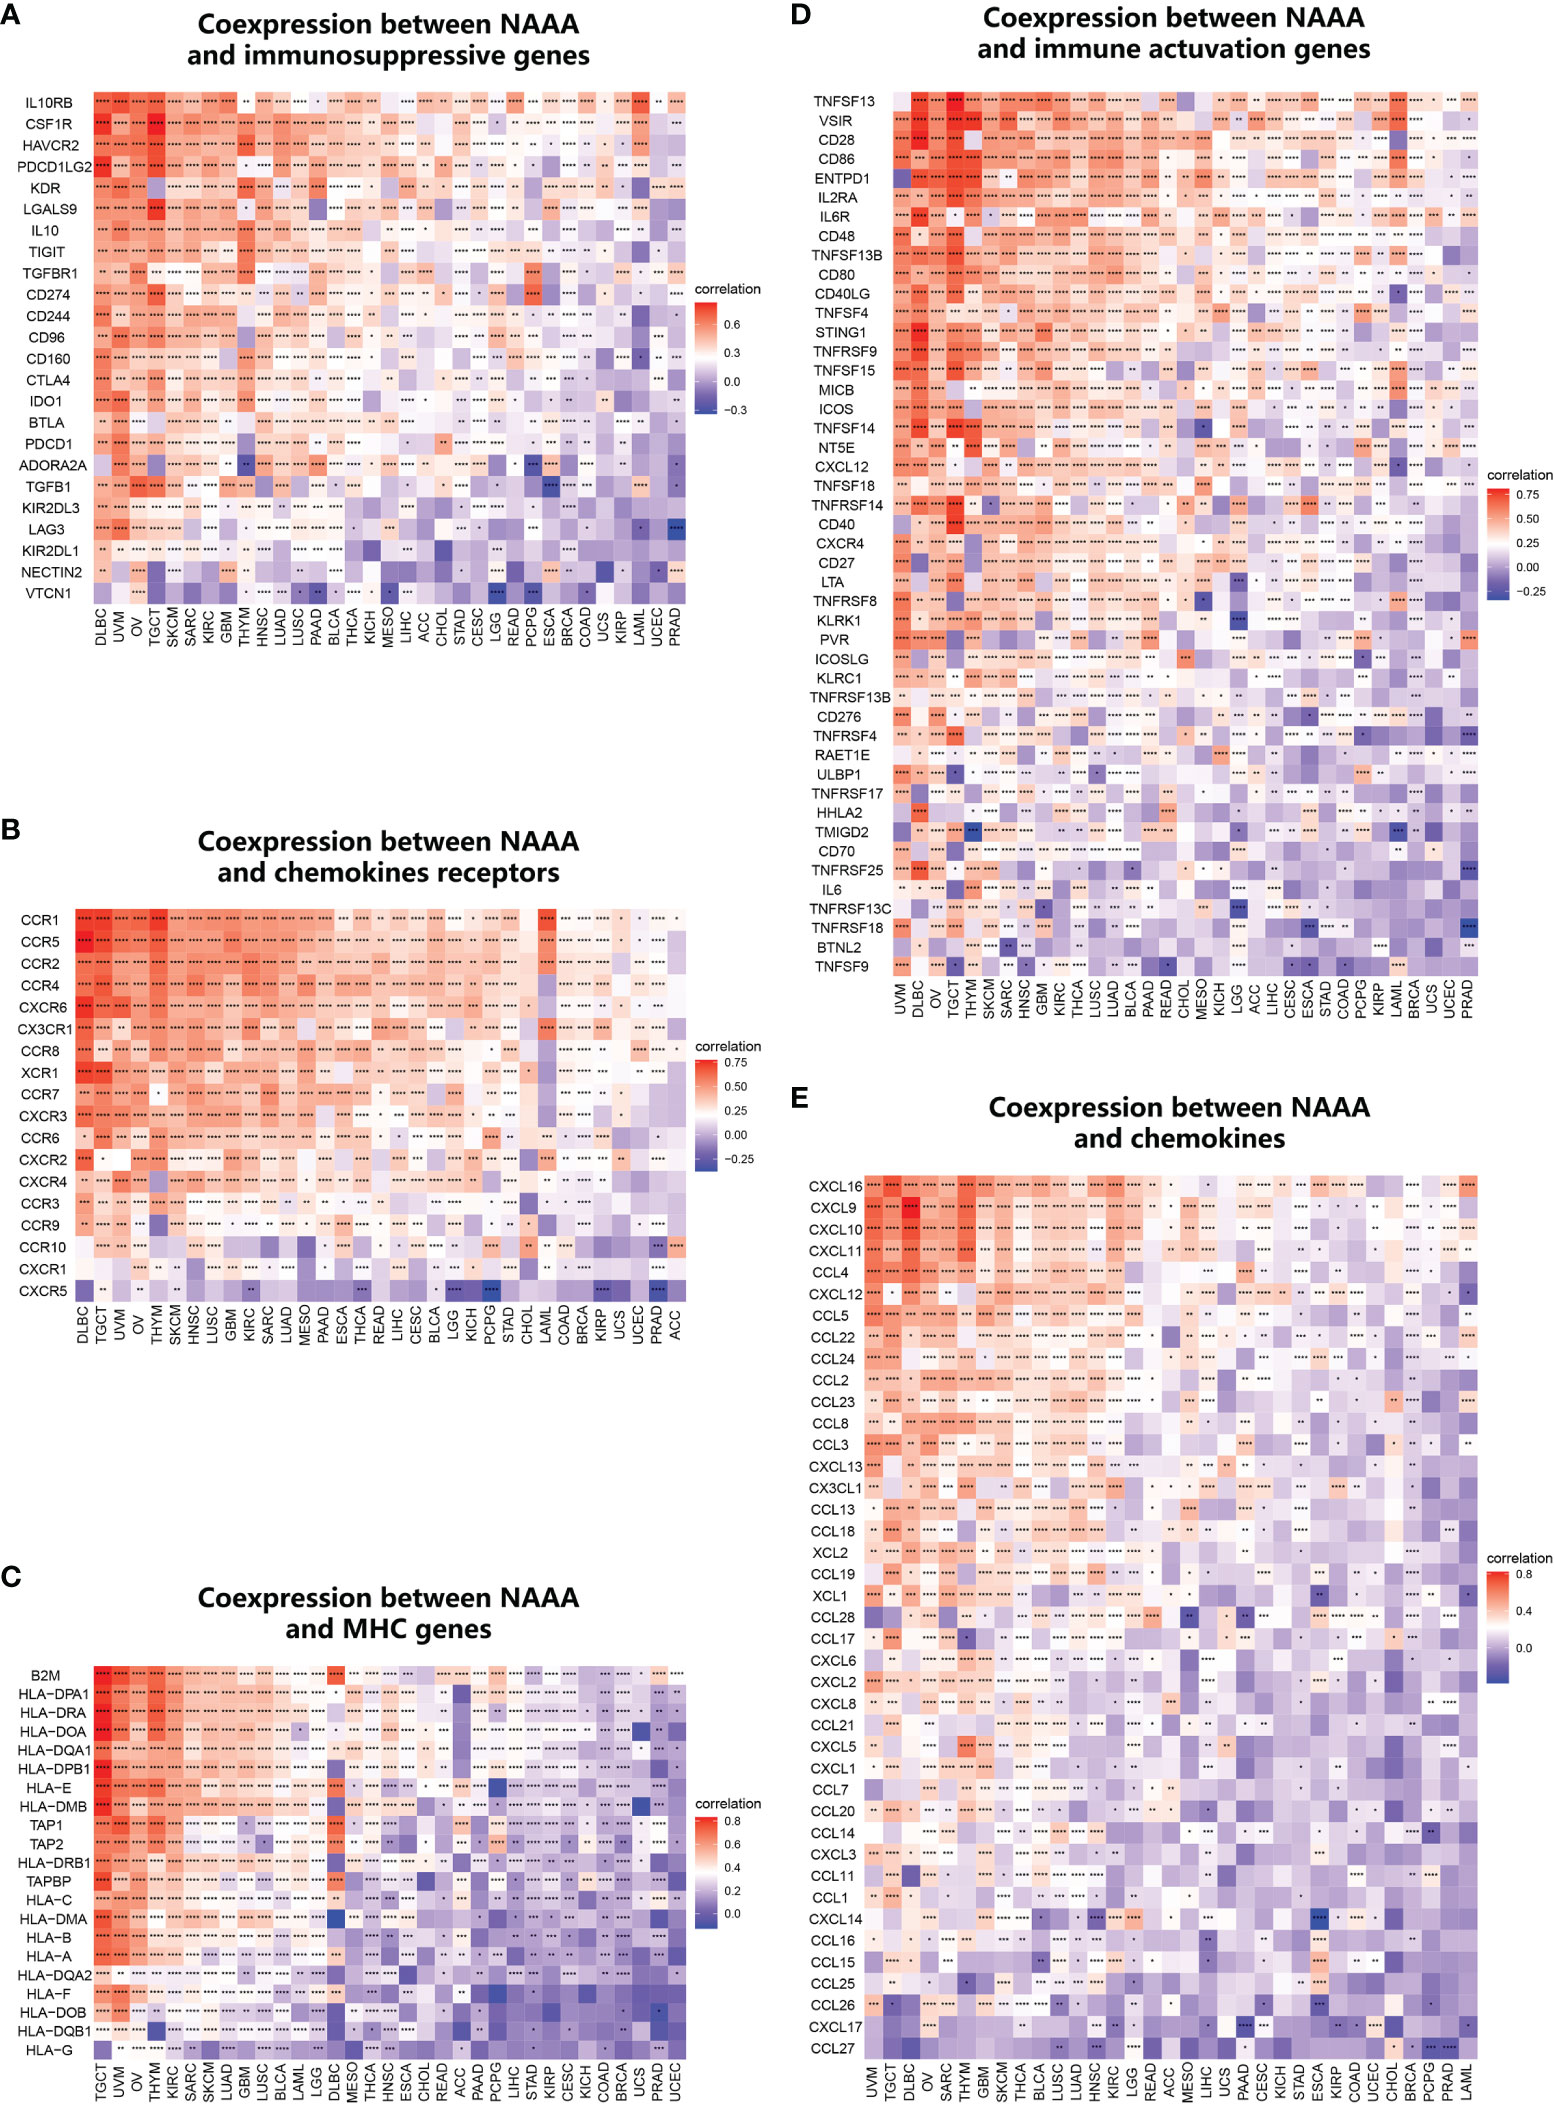
Figure 12 Co-expression of NAAA with immune-associated genes. Co-expression between NAAA and (A) MHC genes, (B) immune activated genes, (C) immunosuppressive genes, (D) chemokines, (E) chemokine receptors. *p < 0.05, **p < 0.01, ***p < 0.001, and ****p < 0.0001. Genes encoding MHC, immune activation, immune suppression, chemokine, and chemokine receptor proteins were analyzed.
Discussion
As an important hallmark of cancer, inflammation contributes to the development of cancer and promotes tumor progression (38). About 20% of human cancers are closely associated with chronic inflammation. A number of soluble and cellular pro-inflammatory mediators (for example, chemokines, cytokines, and prostaglandins) are found in TME, where they play pivotal roles in tumor initiation, progression, and metastasis (39–41). NAAA, a lysosomal enzyme, is abundantly distributed in macrophages (42). It is already known that the inhibition of NAAA expression can effectively control inflammation by restoring endogenous PEA capacity via PPAR-α. In spite of the important roles of NAAA in the immune system, the correlation of NAAA function in immuno-oncology is still unknown. Here, we conducted a pan-cancer bioinformatics analysis of the expression profile and prognostic value of NAAA and explore its potential role in tumor immunology (43).
We first assessed the expression and prognostic significance of NAAA in pan-cancer using the GTEx and TCGA datasets. The results showed that compared to paracancerous and normal tissues, NAAA gene mRNA was highly expressed in 10 types of cancers, namely, BRCA, DLBC, GBM, LAML, OV, PAAD, PCPG, PRAD, STAD, and TGTC, whereas low expression was observed in ACC, CESC, CHOL, ESCA, HNSC, KICH, KIRC, KIRP, LIHC, LUAD, LUSC, SKCM, THCA, THYM, UCEC, and UCS. IHC analysis from the HPA was consistent with the NAAA mRNA expression discrepancy and complemented our results. Previous studies only revealed there is a relationship between NAAA expression and tumor cell progression in bladder, prostate, and colon cancer cells (28, 44, 45). Unfortunately, NAAA has not been largely studied in the cancer field. In this study, based on Kaplan-Meier and univariate Cox regression analysis, we also found that upregulated expression of NAAA was associated with poor prognosis, especially in patients with OV, LGG, UVM and BRCA. However, the high expression of NAAA related to a better OS prognosis in patients with SKCM, which means the function of NAAA was orientated more like a protective role in this specific cancer. Meanwhile, previous studies reported that the expression levels of NAAA mRNA were higher in non-aggressive prostate cancer than aggressive cancer and are potentially useful as a tissue biomarker related to cancer aggressiveness (46). These findings clearly suggest that NAAA is a potential biomarker to predict the prognosis of tumor patients.
Another important finding of this study is that NAAA plays an essential role in cancer immunity. Over the past years, more and more studies have illustrated that the immune status of tumors closely depended on the composition and infiltrating concentration of cells in their corresponding environment (47–49). ESTIMATE algorithm was proven to be convenient and fast to predict tumor purity, which reflects the features of TME, and has proven to be a prognostic factor in human malignancies, especially in colon cancer patients (50). Using the TCGA cohort, we found that NAAA was significantly positively correlated with the immune component of TME in 22 cancers, including DLBC, TGCT, SARC, UVM, LUSC, LAML, GBM, SKCM, LUAD, MESO, OV, HNSC, BLCA, ESCA, KIRC, LGG, STAD, THCA, CESC, PAAD, LIHC, and BRCA, and negatively correlated with the stromal component of TME in 2 cancers, including PCPG and PRAD. In addition, GSEA analysis indicates that NAAA was significantly associated with immune-related pathways, especially Toll-like receptor signaling pathways (TLRs). TLRs are a well-characterized family of Pattern recognition receptors (PRRs), and the latter are a significant component of the innate immune system. Many studies have reported that TLRs could stimulate several downstream signaling pathways and thus are involved in the pathogenesis of immune diseases and cancer (51, 52). The current findings suggested that NAAA is strongly associated with regulating innate immunity in some cancers by activating Toll-like receptor pathways. In addition, we found that NAAA was positively correlated with infiltrating levels of multiple immune cells including macrophages, CD4+ T cells, dendritic cells, and Tregs via using TIMER2 database. More importantly, immune cell infiltration data from ImmuCellAI database and a published article, we observed that NAAA expression was significantly correlated with tumor-associated macrophages (TAMs). TAMs are the most abundant population of tumor-infiltrating immune cells in TME and generally polarize into two functionally contrasting subtypes, namely, classically activated M1 and alternatively activated M2 subtypes (53). Compared to the former, tumor-infiltrating M2 macrophages are closely correlated with worse clinical prognosis in many kinds of malignant tumors (54). Increasing preclinical and clinical studies suggest that TAMs-targeting strategies could decrease the number of suppressive macrophages within tumors, which can be leveraged to potentiate the efficacy of immune checkpoint blockade (55). Based on these data, we propose that NAAA may have direct or indirect effects on macrophage polarization and subsequent induction of an immunosuppressive response. Furthermore, we further found that NAAA is co-expressed with genes encoding MHC, immune activation, immune suppression, chemokines, and chemokine receptor proteins. All these findings suggest that NAAA expression is closely correlated with immune infiltration of tumor cells and therefore affects patient prognosis.
TMB reflects the overall neoantigen burden within a tumor and thus is closely related to the efficacy of immunotherapy. Previous research has shown that high TMB correlates with better clinical outcomes from ICIs in patients with melanoma (56, 57), head and neck cancer (NSCLC) (58, 59), and urothelial carcinoma (60, 61). Furthermore, TMB may be useful as prognostic and predictive biomarker for immunotherapy response in human cancer. MSI also is a key biological marker of ICI response. The Food and Drug Administration (FDA) has approved microsatellite instability-high (MSI-H) status or deficient mismatch repair (dMMR) as predictive biomarkers for guiding the clinical application of ICIs in certain cancers (62). In the present study, we demonstrated that NAAA expression is correlated with TMB in four cancer types and with MSI in nine cancer types. Therefore, NAAA may serve as a potential predictor for the efficacy of immunotherapy in these types of cancers.
However, we must acknowledge some limitations in the current study. First, although we integrated and analyzed information across multiple databases, these datasets are grouped together without assessing heterogeneity, which may reduce the reliability of our findings. Second, the conclusions of this study are all drawn through bioinformatic analysis. There were no in vitro/in vivo experiments to verify the results. Previous studies reported multiple variants of NAAA mRNA found in various human cells and suggested that the proteins from some variants are catalytically inactive (63). Next, we will complement relative experiments to clarify the mechanism of NAAA in different types of cancer at both cellular and molecular levels. Third, despite the finding that NAAA expression was correlated with immune cell infiltration and patient survival in cancers, we are unable to confirm whether NAAA may affect patient survival via immune pathway at present.
In summary, our study systematically demonstrated the expression and prognostic value of NAAA across a series of cancers. The aberrant expression of NAAA is related to the poor prognosis in multiple cancer types and correlated with immune infiltration in TME, particularly with TAMs. In addition, NAAA expression was associated with TMB and MSI in multiple cancer types, which indicates NAAA associated with current predictors for the efficacy of ICIs. Nevertheless, these results were based on diverse data analysis, and future prospective and experimental studies are needed to demonstrate the specific role of NAAA in malignancies.
Data Availability Statement
The datasets presented in this study can be found in online repositories. The names of the repository/repositories and accession number(s) can be found in the article/Supplementary Material.
Author Contributions
DH, JS, and LZ participated in the study design and wrote the manuscript. DH and HC performed the data analysis. JF, XZ and JZ helped the revision. All authors contributed to the article and approved the submitted version.
Funding
This study was supported by the National Nature Science Foundation of China (grant numbers 81902633) and the Natural Science Foundation of Zhejiang Province (grant number Y20H160278).
Conflict of Interest
The authors declare that the research was conducted in the absence of any commercial or financial relationships that could be construed as a potential conflict of interest.
Publisher’s Note
All claims expressed in this article are solely those of the authors and do not necessarily represent those of their affiliated organizations, or those of the publisher, the editors and the reviewers. Any product that may be evaluated in this article, or claim that may be made by its manufacturer, is not guaranteed or endorsed by the publisher.
Supplementary Material
The Supplementary Material for this article can be found online at: https://www.frontiersin.org/articles/10.3389/fimmu.2021.812713/full#supplementary-material
References
1. Srivastava S, Koay EJ, Borowsky AD, De Marzo AM, Ghosh S, Wagner PD, et al. Cancer Overdiagnosis: A Biological Challenge and Clinical Dilemma. Nat Rev Cancer (2019) 19(6):349–58. doi: 10.1038/s41568-019-0142-8
2. Tsai MJ, Chang WA, Huang MS, Kuo PL. Tumor Microenvironment: A New Treatment Target for Cancer. ISRN Biochem (2014) 2014:351959. doi: 10.1155/2014/351959
3. Bukowski K, Kciuk M, Kontek R. Mechanisms of Multidrug Resistance in Cancer Chemotherapy. Int J Mol Sci (2020) 21(9):3233. doi: 10.3390/ijms21093233
4. Gottesman MM. Mechanisms of Cancer Drug Resistance. Annu Rev Med (2002) 53:615–27. doi: 10.1146/annurev.med.53.082901.103929
5. Erin N, Grahovac J, Brozovic A, Efferth T. Tumor Microenvironment and Epithelial Mesenchymal Transition as Targets to Overcome Tumor Multidrug Resistance. Drug Resist Updates (2020) 53. doi: 10.1016/j.drup.2020.100715
6. Bunt SK, Ostrand-Rosenberg S. Inflammation Induces Myeloid-Derived Suppressor Cells That Facilitate Tumor Progression. Cancer Res (2006) 66(8):284–90. doi: 10.4049/jimmunol.176.1.284
7. Shaked Y. The Pro-Tumorigenic Host Response to Cancer Therapies. Nat Rev Cancer (2019) 19(12):667–85. doi: 10.1038/s41568-019-0209-6
8. Belli C, Trapani D, Viale G, D’Amico P, Duso BA, Della Vigna P, et al. Targeting the Microenvironment in Solid Tumors. Cancer Treat Rev (2018) 65:22–32. doi: 10.1016/j.ctrv.2018.02.004
9. Gun SY, Lee SWL, Sieow JL, Wong SC. Targeting Immune Cells for Cancer Therapy. Redox Biol (2019) 25:101174. doi: 10.1016/j.redox.2019.101174
10. Binnewies M, Roberts EW, Kersten K, Chan V, Fearon DF, Merad M, et al. Understanding the Tumor Immune Microenvironment (TIME) for Effective Therapy. Nat Med (2018) 24(5):541–50. doi: 10.1038/s41591-018-0014-x
11. Galluzzi L, Humeau J, Buque A, Zitvogel L, Kroemer G. Immunostimulation With Chemotherapy in the Era of Immune Checkpoint Inhibitors. Nat Rev Clin Oncol (2020) 17(12):725–41. doi: 10.1038/s41571-020-0413-z
12. Zhang YY, Zhang ZM. The History and Advances in Cancer Immunotherapy: Understanding the Characteristics of Tumor-Infiltrating Immune Cells and Their Therapeutic Implications. Cell Mol Immunol (2020) 17(8):807–21. doi: 10.1038/s41423-020-0488-6
13. Wilky BA. Immune Checkpoint Inhibitors: The Linchpins of Modern Immunotherapy. Immunol Rev (2019) 290(1):6–23. doi: 10.1111/imr.12766
14. Borghaei H, Paz-Ares L, Horn L, Spigel DR, Steins M, Ready NE, et al. Nivolumab Versus Docetaxel in Advanced Nonsquamous Non-Small-Cell Lung Cancer. N Engl J Med (2015) 373(17):1627–39. doi: 10.1056/NEJMoa1507643
15. Duan JC, Cui LG, Zhao XC, Bai H, Cai SL, Wang GQ, et al. Use of Immunotherapy With Programmed Cell Death 1 vs Programmed Cell Death Ligand 1 Inhibitors in Patients With Cancer A Systematic Review and Meta-Analysis. JAMA Oncol (2020) 6(3):375–84. doi: 10.1001/jamaoncol.2019.5367
16. Kalbasi A, Ribas A. Tumour-Intrinsic Resistance to Immune Checkpoint Blockade. Nat Rev Immunol (2020) 20(1):25–39. doi: 10.1038/s41577-019-0218-4
17. He X, Xu CQ. Immune Checkpoint Signaling and Cancer Immunotherapy. Cell Res (2020) 30(8):660–9. doi: 10.1038/s41422-020-0343-4
18. Piomelli D, Scalvini L, Fotio Y, Lodola A, Spadoni G, Tarzia G, et al. N-Acylethanolamine Acid Amidase (NAAA): Structure, Function, and Inhibition. J Med Chem (2020) 63(14):7475–90. doi: 10.1021/acs.jmedchem.0c00191
19. Zhou P, Xiang L, Yang Y, Wu Y, Hu T, Liu X, et al. N-Acylethanolamine Acid Amidase (NAAA) Inhibitor F215 as a Novel Therapeutic Agent for Osteoarthritis. Pharmacol Res (2019) 145:104264. doi: 10.1016/j.phrs.2019.104264
20. Tsuboi K, Sun YX, Okamoto Y, Araki N, Tonai T, Ueda N. Molecular Characterization of N-Acylethanolamine-Hydrolyzing Acid Amidase, a Novel Member of the Choloylglycine Hydrolase Family With Structural and Functional Similarity to Acid Ceramidase. J Biol Chem (2005) 280(12):11082–92. doi: 10.1074/jbc.M413473200
21. Alhouayek M, Muccioli GG. Harnessing the Anti-Inflammatory Potential of Palmitoylethanolamide. Drug Discov Today (2014) 19(10):1632–9. doi: 10.1016/j.drudis.2014.06.007
22. LoVerme J, Russo R, La Rana G, Fu J, Farthing J, Mattace-Raso G, et al. Rapid Broad-Spectrum Analgesia Through Activation of Peroxisome Proliferator-Activated Receptor-Alpha. J Pharmacol Exp Ther (2006) 319(3):1051–61. doi: 10.1124/jpet.106.111385
23. Devchand PR, Keller H, Peters JM, Vazquez M, Gonzalez FJ, Wahli W. The PPARalpha-Leukotriene B4 Pathway to Inflammation Control. Nature (1996) 384(6604):39–43. doi: 10.1038/384039a0
24. Bonezzi FT, Sasso O, Pontis S, Realini N, Romeo E, Ponzano S, et al. An Important Role for N-Acylethanolamine Acid Amidase in the Complete Freund’s Adjuvant Rat Model of Arthritis. J Pharmacol Exp Ther (2016) 356(3):656–63. doi: 10.1124/jpet.115.230516
25. Wu K, Xiu Y, Zhou P, Qiu Y, Li Y. A New Use for an Old Drug: Carmofur Attenuates Lipopolysaccharide (LPS)-Induced Acute Lung Injury via Inhibition of FAAH and NAAA Activities. Front Pharmacol (2019) 10:818. doi: 10.3389/fphar.2019.00818
26. Alhouayek M, Bottemanne P, Subramanian KV, Lambert DM, Makriyannis A, Cani PD, et al. N-Acylethanolamine-Hydrolyzing Acid Amidase Inhibition Increases Colon N-Palmitoylethanolamine Levels and Counteracts Murine Colitis. FASEB J (2015) 29(2):650–61. doi: 10.1096/fj.14-255208
27. Sasso O, Summa M, Armirotti A, Pontis S, De Mei C, Piomelli D. The N-Acylethanolamine Acid Amidase Inhibitor ARN077 Suppresses Inflammation and Pruritus in a Mouse Model of Allergic Dermatitis. J Invest Dermatol (2018) 138(3):562–9. doi: 10.1016/j.jid.2017.07.853
28. Romano B, Pagano E, Iannotti FA, Piscitelli F, Brancaleone V, Lucariello G, et al. NAAA Is Dysregulated in Colorectal Cancer Patients and Its Inhibition Reduces Experimental Cancer Growth. Br J Pharmacol (2021). doi: 10.1111/bph.15737
29. I. T. P.-C. A. o. W. G. Consortium. Pan-Cancer Analysis of Whole Genomes. Nature (2020) 578(7793):82–93. doi: 10.1038/s41586-020-1969-6
30. PCAWG Transcriptome Core Group, Calabrese C, Davidson NR, Demircioglu D, Fonseca NA, He Y, et al. Genomic Basis for RNA Alterations in Cancer. Nature (2020) 578(7793):129–36. doi: 10.1038/s41586-020-1970-0
31. Bailey MH, Tokheim C, Porta-Pardo E, Sengupta S, Bertrand D, Weerasinghe A, et al. Comprehensive Characterization of Cancer Driver Genes and Mutations. Cell (2018) 173(2):371–85.e18. doi: 10.1016/j.cell.2018.02.060
32. Korenjak M, Zavadil J. Experimental Identification of Cancer Driver Alterations in the Era of Pan-Cancer Genomics. Cancer Sci (2019) 110(12):3622–9. doi: 10.1111/cas.14210
33. Cerami E, Gao J, Dogrusoz U, Gross BE, Sumer SO, Aksoy BA, et al. The Cbio Cancer Genomics Portal: An Open Platform for Exploring Multidimensional Cancer Genomics Data. Cancer Discov (2012) 2(5):401–4. doi: 10.1158/2159-8290.CD-12-0095
34. Bonneville R, Krook MA, Kautto EA, Miya J, Wing MR, Chen HZ, et al. Landscape of Microsatellite Instability Across 39 Cancer Types. JCO Precis Oncol (2017) 2017. doi: 10.1200/PO.17.00073
35. Rodriguez-Paredes M, Esteller M. Cancer Epigenetics Reaches Mainstream Oncology. Nat Med (2011) 17(3):330–9. doi: 10.1038/nm.2305
36. Koch A, Joosten SC, Feng Z, de Ruijter TC, Draht MX, Melotte V, et al. Author Correction: Analysis of DNA Methylation in Cancer: Location Revisited. Nat Rev Clin Oncol (2018) 15(7):467. doi: 10.1038/s41571-018-0028-9
37. Martincorena I, Campbell PJ. Somatic Mutation in Cancer and Normal Cells. Science (2015) 349(6255):1483–9. doi: 10.1126/science.aab4082
38. Greten FR, Grivennikov SI. Inflammation and Cancer: Triggers, Mechanisms, and Consequences. Immunity (2019) 51(1):27–41. doi: 10.1016/j.immuni.2019.06.025
39. Galdiero MR, Marone G, Mantovani A. Cancer Inflammation and Cytokines. Cold Spring Harb Perspect Biol (2018) 10(8). doi: 10.1101/cshperspect.a028662
40. Mantovani A, Allavena P, Sica A, Balkwill F. Cancer-Related Inflammation. Nature (2008) 454(7203):436–44. doi: 10.1038/nature07205
41. Crusz SM, Balkwill FR. Inflammation and Cancer: Advances and New Agents. Nat Rev Clin Oncol (2015) 12(10):584–96. doi: 10.1038/nrclinonc.2015.105
42. Sun YX, Tsuboi KU, Zhao LY, Okamoto Y, Lambert DM, Ueda N. Involvement of N-Acylethanolamine-Hydrolyzing Acid Amidase in the Degradation of Anandamide and Other N-Acylethanolamines in Macrophages. Biochim Et Biophys Acta-Mol Cell Biol Lipids (2005) 1736(3):211–20. doi: 10.1016/j.bbalip.2005.08.010
43. Ge Q, Li G, Chen J, Song J, Cai G, He Y, et al. Immunological Role and Prognostic Value of APBB1IP in Pan-Cancer Analysis. J Cancer (2021) 12(2):595–610. doi: 10.7150/jca.50785
44. Wang J, Zhao LY, Uyama T, Tsuboi K, Wu XX, Kakehi Y, et al. Expression and Secretion of N-Acylethanolamine-Hydrolysing Acid Amidase in Human Prostate Cancer Cells. J Biochem (2008) 144(5):685–90. doi: 10.1093/jb/mvn122
45. Vago R, Bettiga A, Salonia A, Ciuffreda P, Ottria R. Development of New Inhibitors for N-Acylethanolamine-Hydrolyzing Acid Amidase as Promising Tool Against Bladder Cancer. Bioorg Med Chem (2017) 25(3):1242–9. doi: 10.1016/j.bmc.2016.12.042
46. Liu YS, Chen J, Sethi A, Li QK, Chen LJ, Collins B, et al. Glycoproteomic Analysis of Prostate Cancer Tissues by SWATH Mass Spectrometry Discovers N-Acylethanolamine Acid Amidase and Protein Tyrosine Kinase 7 as Signatures for Tumor Aggressiveness. Mol Cell Proteomics (2014) 13(7):1753–68. doi: 10.1074/mcp.M114.038273
47. Gong Z, Zhang JY, Guo WJ. Tumor Purity as a Prognosis and Immunotherapy Relevant Feature in Gastric Cancer. Cancer Med (2020) 9(23):9052–63. doi: 10.1002/cam4.3505
48. Chen M, Ren R, Lin W, Xiang L, Zhao Z, Shao B. Exploring the Oncostatin M (OSM) Feed-Forward Signaling of Glioblastoma via STAT3 in Pan-Cancer Analysis. Cancer Cell Int (2021) 21(1):565. doi: 10.1186/s12935-021-02260-9
49. Shiao SL, Chu GC, Chung LW. Regulation of Prostate Cancer Progression by the Tumor Microenvironment. Cancer Lett (2016) 380(1):340–8. doi: 10.1016/j.canlet.2015.12.022
50. Galon J, Bruni D. Approaches to Treat Immune Hot, Altered and Cold Tumours With Combination Immunotherapies. Nat Rev Drug Discov (2019) 18(3):197–218. doi: 10.1038/s41573-018-0007-y
51. Rakoff-Nahoum S, Medzhitov R. Toll-Like Receptors and Cancer. Nat Rev Cancer (2009) 9(1):57–63. doi: 10.1038/nrc2541
52. Tsan MF. Toll-Like Receptors, Inflammation and Cancer. Semin Cancer Biol (2006) 16(1):32–7. doi: 10.1016/j.semcancer.2005.07.004
53. Dehnel N, Moral J, Namgaladzel D, Weigertl A, Brunet B. Cancer Cell and Macrophage Cross-Talk in the Tumor Microenvironment. Curr Opin Pharmacol (2017) 35:12–9. doi: 10.1016/j.coph.2017.04.007
54. Chen YB, Song YC, Du W, Gong LL, Chang HC, Zou ZZ. Tumor-Associated Macrophages: An Accomplice in Solid Tumor Progression. J Biomed Sci (2019) 26(1):78. doi: 10.1186/s12929-019-0568-z
55. Li XL, Liu R, Su X, Pan YS, Han XF, Shao CS, et al. Harnessing Tumor-Associated Macrophages as Aids for Cancer Immunotherapy. Mol Cancer (2019) 18(1):177. doi: 10.1186/s12943-019-1102-3
56. Riaz N, Havel JJ, Makarov V, Desrichard A, Urba WJ, Sims JS, et al. Tumor and Microenvironment Evolution During Immunotherapy With Nivolumab. Cell (2017) 171(4):934. doi: 10.1016/j.cell.2017.09.028
57. Snyder A, Makarov V, Merghoub T, Yuan J, Zaretsky JM, Desrichard A, et al. Genetic Basis for Clinical Response to CTLA-4 Blockade in Melanoma. N Engl J Med (2014) 371(23):2189–99. doi: 10.1056/NEJMoa1406498
58. Seiwert TY, Haddad R, Bauml J, Weiss J, Pfister DG, Gupta S, et al. Biomarkers Predictive of Response to Pembrolizumab in Head and Neck Cancer (HNSCC). Cancer Res (2018) 78(13). doi: 10.1158/1538-7445.AM2018-LB-339
59. Griesinger F, Kowanetz M, Zou W, Shames DS, Cummings CA, Rizvi NA, et al. Tumor Mutation Burden (TMB) Is Associated With Improved Efficacy of Atezolizumab in 1L and 2L+NSCLC Patients. Oncol Res Treat (2017) 40:220. doi: 10.1016/j.jtho.2016.11.343
60. Balar AV, Balar AV, Rosenberg JE, Powles T, Petrylak DP, Bellmunt J, et al. Atezolizumab as First-Line Treatment in Cisplatin-Ineligible Patients With Locally Advanced and Metastatic Urothelial Carcinoma: A Single-Arm, Multicentre, Phase 2 Trial. Lancet (2017) 389(10064):67–76. doi: 10.1016/S0140-6736(16)32455-2
61. Snyder A, Nathanson T, Funt SA, Ahuja A, Novik JB, Hellmann MD, et al. Contribution of Systemic and Somatic Factors to Clinical Response and Resistance to PD-L1 Blockade in Urothelial Cancer: An Exploratory Multi-Omic Analysis. PloS Med (2017) 14(5):e1002309. doi: 10.1371/journal.pmed.1002309
62. Li R, Han DS, Shi JP, Han YX, Tan P, Zhang R, et al. Choosing Tumor Mutational Burden Wisely for Immunotherapy: A Hard Road to Explore. Biochim Et Biophys Acta-Rev Cancer (2020) 1874(2):188420. doi: 10.1016/j.bbcan.2020.188420
Keywords: N-Acylethanolamine Acid Amidase (NAAA), pan-cancer, prognosis, immune infiltration, tumor immunosuppressive status
Citation: Huang D, Shen J, Zhai L, Chen H, Fei J, Zhu X and Zhou J (2022) Insights Into the Prognostic Value and Immunological Role of NAAA in Pan-Cancer. Front. Immunol. 12:812713. doi: 10.3389/fimmu.2021.812713
Received: 10 November 2021; Accepted: 06 December 2021;
Published: 06 January 2022.
Edited by:
Michel Salzet, Lille University of Science and Technology, FranceReviewed by:
Nawale Hajjaji, Centre Oscar Lambret, FranceMarco Trerotola, University of Studies G. d’Annunzio Chieti and Pescara, Italy
Copyright © 2022 Huang, Shen, Zhai, Chen, Fei, Zhu and Zhou. This is an open-access article distributed under the terms of the Creative Commons Attribution License (CC BY). The use, distribution or reproduction in other forums is permitted, provided the original author(s) and the copyright owner(s) are credited and that the original publication in this journal is cited, in accordance with accepted academic practice. No use, distribution or reproduction is permitted which does not comply with these terms.
*Correspondence: Jianwei Zhou, 2195045@zju.edu.cn