 Daniel J. Browne
 Jamie L. Brady
 Ashley J. Waardenberg
 Claire Loiseau
 Denise L. Doolan
- 1Centre for Molecular Therapeutics, Australian Institute of Tropical Health & Medicine, James Cook University, Cairns, QLD, Australia
- 2Centre for Tropical Bioinformatics and Molecular Biology, Australian Institute of Tropical Health & Medicine, James Cook University, Cairns, QLD, Australia
Reliable extraction and sensitive detection of RNA from human peripheral blood mononuclear cells (PBMCs) is critical for a broad spectrum of immunology research and clinical diagnostics. RNA analysis platforms are dependent upon high-quality and high-quantity RNA; however, sensitive detection of specific responses associated with high-quality RNA extractions from human samples with limited PBMCs can be challenging. Furthermore, the comparative sensitivity between RNA quantification and best-practice protein quantification is poorly defined. Therefore, we provide herein a critical evaluation of the wide variety of current generation of RNA-based kits for PBMCs, representative of several strategies designed to maximize sensitivity. We assess these kits with a reverse transcription quantitative PCR (RT-qPCR) assay optimized for both analytically and diagnostically sensitive cell-based RNA-based applications. Specifically, three RNA extraction kits, one post-extraction RNA purification/concentration kit, four SYBR master-mix kits, and four reverse transcription kits were tested. RNA extraction and RT-qPCR reaction efficiency were evaluated with commonly used reference and cytokine genes. Significant variation in RNA expression of reference genes was apparent, and absolute quantification based on cell number was established as an effective RT-qPCR normalization strategy. We defined an optimized RNA extraction and RT-qPCR protocol with an analytical sensitivity capable of single cell RNA detection. The diagnostic sensitivity of this assay was sufficient to show a CD8+ T cell peptide epitope hierarchy with as few as 1 × 10⁴ cells. Finally, we compared our optimized RNA extraction and RT-qPCR protocol with current best-practice immune assays and demonstrated that our assay is a sensitive alternative to protein-based assays for peptide-specific responses, especially with limited PBMCs number. This protocol with high analytical and diagnostic sensitivity has broad applicability for both primary research and clinical practice.
Introduction
Reliable isolation of high quality and high quantity RNA from peripheral blood mononuclear cells (PBMCs) and other cells is critical for a broad range of basic, preclinical, and clinical applications (1, 2). RNA-based assays enable analysis of basal expression profiles and responses to antigen or mitogen stimulation (3, 4). Human PBMCs are a common source of RNA as collection of blood is less invasive and allows in-depth monitoring of many aspects of immunobiology (1, 5) including identification, classification and prognosis of cancers (6–11) monitoring inflammation (12, 13), and evaluating therapeutic efficacy (14–17).
A range of RNA-based platforms are now available, all dependent upon high quality and high quantity RNA (1). However, an important requirement for many applications is both excellent analytical sensitivity (i.e., smallest number of cells detectable) and diagnostic sensitivity (i.e., smallest detectable response to stimulation) (18). Protein-level immunoassays (e.g., flow cytometry, cytokine bead-based arrays, ELIspot) (19–22) are routinely used to detect PBMCs response to stimulation (23–25). Indeed, ELIspot has been used extensively as the “gold standard” immune assay given its sensitivity and has been optimized and validated as part of the global HIV/AIDS Comprehensive T Cell Vaccine Immune Monitoring Consortium (26–28). However, these protocols are limited by the relatively high number of cells required, especially when considering targets with low frequencies (24), when collection of large blood volumes is challenging (29, 30), or when there are many experimental variables [e.g., vaccine/peptide (14, 17, 31, 32) or epitope testing (33–35)]. Therefore, there is an unmet need for a robust RNA extraction and transcriptomic analysis protocol from limited input cell numbers (e.g., PBMCs) with high analytical and diagnostic sensitivity that meets or exceeds that of protein-level immuno-assays.
Reverse transcription quantitative PCR (RT-qPCR) remains the “Gold Standard” for assay of gene expression as an alternate readout to protein expression (36, 37). RT-qPCR is more sensitive than traditional RNA quantification technologies (i.e., Northern blotting, nuclease protection assays, in-situ hybridization, RNA microarrays etc.) (38–40). More recent technologies such as Sanger and next-generation sequencing (i.e., RNA-Seq, single cell RNA-seq, NanoString) and advanced PCR methods (i.e., digital PCR) are similarly sensitive (41, 42) but are relatively expensive or further require complex bioinformatical analysis (43, 44). In contrast, our optimized RT-qPCR assay is designed specifically for cheap, robust, reproducible and sensitive analysis of gene expression, is available to almost any laboratory, and serves as a sensitive and specific alternative to protein expression. Additionally, by focusing on a limited number of genes, RT-qPCR is ideal for validation of genes of interest identified from more untargeted methods such as RNAseq.
However, there is an unmet need for a robust RNA extraction and RT-qPCR protocol with excellent analytical and diagnostic sensitivity, ideally to the single cell level. An important consideration for such a protocol is that RT-qPCR normalization can be achieved by either absolute quantification of copies per reaction using a standard curve, or by semi-quantitative fold-change of relative expression normalized to reference genes (39, 45). However, in vitro stimulation has been shown to modulate the expression of many commonly used reference genes (46, 47), and key assumptions underlying semi-quantitative analysis require consistent reference gene expression across experimental conditions within and amongst cell populations. An alternative is absolute quantification normalized to cell number, which minimizes this potential analytical bias (48–50).
To address this need, we developed a highly sensitive RNA extraction and RT-qPCR quantification strategy for analysis of gene expression from human PBMCs. We compared the efficiency of the latest generation of SYBR master-mixes and RNA extraction and reverse transcription kits, taking into consideration both total RNA yield and RNA concentration. We determined that ssoAdvanced™ Universal SYBR® Green Master-Mix provided optimal reaction efficiency, whilst SuperScript™ IV Reverse Transcriptase had the highest cDNA yields. We demonstrated significantly increased PBMC RNA recovery following extraction with the magnetic bead-based MagMAX™ mirVana™ kit, with no further enhancement of analytical sensitivity by including an additional step of RNA concentration. When testing the analytical sensitivity of our optimized protocol, we could detect RNA to the single cell level of highly expressed genes. Furthermore, by evaluating a hierarchy of CD8+ T cell epitope responses, we demonstrated diagnostic sensitivity with as few as 1 × 10⁴ PBMCs. This optimized RNA extraction and RT-qPCR protocol, with high analytical and diagnostic sensitivity, provides a robust alternative to protein-based immune assays.
Materials and Equipment
PBMC Stimulatory Reagents
- Phorbol 12-Myristate 13-Acetate (PMA), (Sigma-Aldrich)
- Ionomycin (Iono), (Sigma-Aldrich)
- Phytohemagglutinin-L (PHA), (Sigma-Aldrich)
- Human Cytomegalovirus, Epstein Barr Virus and Influenza virus Synthetic peptides (Table 1).
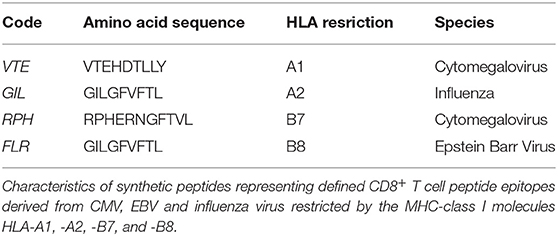
Table 1. Synthetic peptides.
SYBR Mastermix Kits:
- ssoAdvanced™ Universal SYBR® Green Master-Mix (Bio-Rad)
- QuantiNova SYBR® Green PCR Kit (QIAGEN).
- PowerUp SYBR® Green Master-Mix (Applied Biosystems)
- RT2 SYBR® Green qPCR Master-Mix (QIAGEN).
RNA Extraction Kits
- RNeasy® Mini Kit (QIAGEN)
- RNeasy® MiniElute Cleanup Kit (QIAGEN)
- RNeasy® Micro Kit (QIAGEN)
- MagMAX™ mirVana™ Total RNA Isolation Kit (Applied Biosystems).
RNA to cDNA Synthesis Kits
- SuperScript™ III First-Strand Synthesis System (ThermoFisher)
- SuperScript™ IV First-Strand Synthesis System (ThermoFisher)
- iScript™ Advanced cDNA Synthesis Kit (Bio-Rad)
- High-Capacity RNA-cDNA Kit™ (Applied Biosystems).
Quantitative PCR Primers
- PrimerBank™ primers (Table 2).
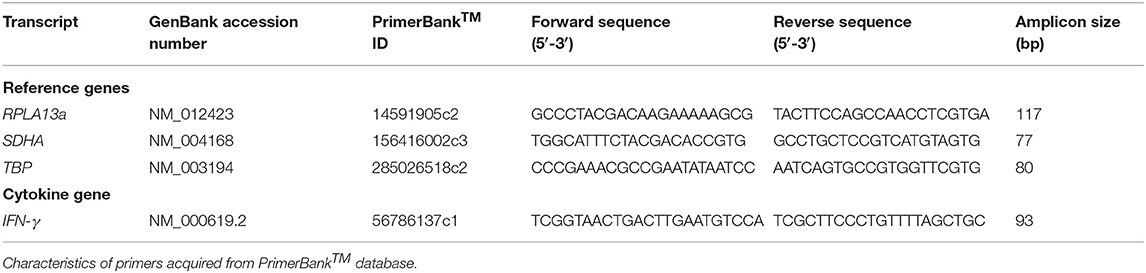
Table 2. Primer list.
Antibodies
- anti-human IFN-γ monoclonal antibody (mAb) (Clone 1-D1K, MABTECH)
- anti-human IFN-γ biotinylated mAb (Clone 7-B6-1, MABTECH)
- anti-human IFN-γ-FITC mAb (Clone 4S.B3, BD Biosciences).
Equipment
- QuantStudio 3 Real-Time PCR system (Applied Biosystems)
- NanoDrop 2000 Spectrophotometer (ThermoFisher)
- 2100 Bioanalyzer (Agilent Technologies)
- AID ELIspot reader system (Autoimmun Diagnostika GmbH, Germany)
- LSRFortessa X-20 (BD Biosciences).
Software
- QuantStudio Design and Analysis Software (v1.4.3, Applied Biosystems)
- ProcartaPlex Analyst Software (v1.0, ThermoFisher)
- FlowJo Software (v10.4, BD Biosciences)
- GraphPad Prism (v7, GraphPad).
Methods
Samples
PBMCs
Blood was collected from healthy donors or buffy coats (n = 12) provided by the Australian Red Cross Blood Service, under a protocol approved by the James Cook University Human Research Ethics Committee (#H6702). PBMCs were isolated by density gradient centrifugation and cryopreserved in FBS 10% DMSO. Prior to use, samples were thawed rapidly at 37°C, treated with DNAase I (1 μg/mL; StemCell), and rested for 18 h at 2 × 10⁶ cells/mL in media (RPMI-1640, 10% FBS, 100 U/mL penicillin/streptomycin) at 37°C and 5% CO2. Viable PBMCs were counted prior to downstream analysis.
HLA Typing
Genomic DNA was isolated from PBMCs using the QIAamp DNA Mini Kit (QIAGEN) according to manufacturer's instructions. High-resolution class I and class II HLA typing was performed by the Australian Red Cross Transplant and Immunological Services (Melbourne, Australia) using the MIA FORA NGS FLEX HLA typing kit (Immunocor) and Illumina MiSeq and MiniSeq platforms.
Cell Stimulation
PBMCs were resuspended in RPMI-1640 supplemented with 10% human serum, 100 U/mL penicillin/streptomycin, 2 mM glutaMAX (ThermoFisher Scientific), 10 mM HEPES (ThermoFisher Scientific), and 5 × 10⁻⁵ M β-Mercaptoethanol (Sigma-Aldrich) (complete media). Synthetic peptides (10 μg/mL) representing defined CD8+ T cell epitopes from human Cytomegalovirus, Epstein Barr Virus or Influenza virus (Table 1) were tested alongside PMA/Iono (50 ng/mL PMA, 1,000 ng/mL Iono) and PHA (PHA; 1 μg/mL) mitogen controls as well as media-only negative control. PBMCs were stimulated for 6, 12, 16, 24, or 48 h at 2 × 10⁶ cells/mL in 200 μL in 96-well U-bottom plates (qPCR, ELIspot and multiplexed bead array) or at 1 × 10⁶ cells/mL in 3 mL in 12-well flat-bottom plates (flow cytometry).
Quantitative PCR
Assay Setup
qPCR was conducted using the QuantStudio 3 Real-Time PCR system running QuantStudio Design and Analysis Software (v1.4.3, Applied Biosystems). A standard curve, combined calibration sample, and no template negative controls were included on each plate. All samples were run in technical triplicate in accordance with MIQE guidelines (45). cDNA synthesis was conducted on a SimpliAmp™ thermocycler (ThermoFisher Scientific). Unless specifically noted, all reaction conditions and protocols were performed as recommended by the manufacturer. Copies/reaction were determined by absolute quantification.
SYBR Master-Mix Testing: Amplicon Standard
Four SYBR master-mix kits were evaluated: ssoAdvanced™ Universal SYBR® Green Master-Mix (Bio-Rad), QuantiNova SYBR® Green PCR Kit (QIAGEN), PowerUp SYBR® Green Master-Mix (Applied Biosystems) and RT2 SYBR® Green qPCR Master-Mix (QIAGEN). RPL13a, SDHA, TBP, and IFN-γ primer (Table 2) amplicons were purified by Wizard SV Gel & PCR CleanUp System (Promega) and quantified by NanoDrop 2000 Spectrophotometer (ThermoFisher). Master-mix reaction efficiency was calculated by amplification of amplicons titrated from 107 to 101 copies/reaction, with primers at 250, 500, or 750 nM (45).
SYBR Master-Mix Testing: cDNA Standard
The four SYBR master-mix kits were further evaluated with efficiency titrations of cDNA standards. Briefly, RNA was extracted from 1 × 10⁶ unstimulated PBMCs using the RNeasy® Mini Kit (QIAGEN). Seven microliters of extracted RNA was converted to cDNA using the SuperScript™ III First-Strand Synthesis System kit (Invitrogen). Master-mix reaction efficiency was calculated from log10 diluted cDNA (104-101 cells/reaction) with RPL13a, SDHA, TBP, and IFN-γ primers at 500 nM.
Reference Gene Stability Testing
1 × 10⁶ PBMCs were stimulated for 6, 12, 16, 24, or 48 h with or without PMA/Iono as described above. RNA was extracted with RNeasy® Mini Kit (QIAGEN). Seven microliters of extracted RNA was reverse transcribed with SuperScript™ III First-Strand Synthesis System kit (Invitrogen). qPCR was run with ssoAdvanced™ master-mix, RPL13a, SDHA, TBP and IFN-γ primers at 500 nM and samples at 102 cells/reaction.
Evaluation of RNA Extraction Kits
To evaluate RNA yield and quality, three RNA extraction kits: RNeasy® Mini Kit (QIAGEN), RNeasy® Micro Kit (QIAGEN), and MagMAX™ mirVana™ Total RNA Isolation Kit (Applied Biosystems); and one post-extraction RNA purification and concentration kit, RNeasy® MiniElute Cleanup Kit (QIAGEN), were evaluated. All extractions included genomic DNA removal. RNA was extracted from 1 × 10⁶ PBMCs incubated for 6 h with or without PMA/Iono, with the exception of the RNeasy® Micro Kit where 0.5 × 10⁶ PBMCs was used (per manufacturer's recommendation). To evaluate concentration, kit eluates were concentrated using the RNeasy® MiniElute. All elutions were performed in the smallest recommended volume. The yield of extracted RNA was quantified using a NanoDrop 2000 Spectrophotometer (ThermoFisher). RNA yield (i.e., total RNA extracted), calculated RNA quality was assessed by RNA integrity number (RIN) by the Australian Genome Research Facility (Brisbane, Australia) using a 2100 Bioanalyzer (Agilent Technologies). Subsequently, 7 μL of RNA was converted to cDNA using the SuperScript™ III First-Strand Synthesis System kit (Invitrogen) alongside negative reverse transcriptase controls. qPCR was run with ssoAdvanced™ master-mix, RPL13a, SDHA, TBP, and IFN-γ primers at 500nM and sampled at 102 cells/reaction.
Evaluation of Reverse Transcription Kits
Four reverse transcription kits were evaluated: SuperScript™ III First-Strand Synthesis System (ThermoFisher Scientific), SuperScript™ IV First-Strand Synthesis System (ThermoFisher), iScript™ Advanced cDNA Synthesis Kit (Bio-Rad) or High-Capacity RNA-cDNA Kit™ (Applied Biosystems). Kits were evaluated using RNA extracted using the MagMAX™ mirVana™ Total RNA Isolation Kit (MagMAX) with or without the RNeasy® MiniElute Cleanup Kit. Briefly, 1 × 10⁶ PBMCs were incubated for 6 h with or without PMA/Iono as described above. Seven microliter of RNA extracted by MagMAX was used for each cDNA synthesis kit. Alternatively, the maximum recommended input of RNA extracted by MagMAX in association with the RNeasy® MiniElute Cleanup Kit was used (i.e., Superscript™ III 7 μL, Superscript™ IV 10 μL, iScript™ 14 μL, and High-Capacity 9 μL). qPCR was run with ssoAdvanced™ master-mix, RPL13a, SDHA, TBP, and IFN-γ primers at 500 nM and sample diluted to 102 cells/reaction; except when considering concentration, when the samples were run undiluted.
Analytical and Diagnostic Sensitivity
For determination of analytical sensitivity, RNA was extracted from a log10 serial dilution of unstimulated PBMCs (106-100 cells/extraction), using the MagMAX kit with or without the RNeasy® MiniElute Cleanup Kit. A media-only extraction control was processed in parallel. For determination of diagnostic sensitivity, RNA was extracted using the MagMAX kit from titrated PBMCs (4 × 10⁵, 1 × 10⁵, 2.5 × 10⁴, and 1 × 10⁴) incubated for 6 h with or without PMA/Iono or HLA-matched peptide. For sensitivity evaluations, 10 μL of RNA was converted to cDNA using the SuperScript™ IV First-Strand Synthesis System (Invitrogen). qPCR used undiluted sample with ssoAdvanced™ master-mix, RPL13a, SDHA, TBP, and IFN-γ primers at 500 nM.
Protein Quantification Assays
Enzyme-Linked Immunospot (ELIspot) Assay
IFN-γ ELIspot assays were performed as previously described (51, 52). Briefly, 4 × 10⁵ PBMCs were plated in triplicate onto 96-well multi-screen filtration plates (#MAIP S45-10, Merck) pre-coated with anti-human IFN-γ monoclonal antibody (mAb) (Clone 1-D1K, MABTECH) and stimulated for 24 h with or without peptide, PMA/Iono, PHA or media. After washing, IFN-γ secreting cells were stained with 1 μg/mL of anti-human IFN-γ biotinylated mAb (Clone 7-B6-1, MABTECH) followed by streptavidin alkaline phosphatase (MABTECH). The assay was developed using the AP Conjugate Substrate Kit (BioRad). IFN-γ-spot-forming cells were counted using AID ELIspot reader system (Autoimmun Diagnostika GmbH, Germany).
Multiplex Cytokine Bead Array
Supernatant was collected from 4 × 10⁵ PBMCs incubated for 6 h with or without peptide, PMA/Iono or media. Fifty microliter supernatant was analyzed using the ProcartaPlex Immunoassay (ThermoFisher) per manufacturer's protocol. Cytokine concentration was calculated from a standard curve using the ProcartaPlex Analyst 1.0 Software (ThermoFisher).
Flow Cytometry
3 × 10⁶ PBMCs were incubated for 6 h with or without peptide, PMA/Iono or media. 5 μg/mL brefeldin A (BD Biosciences) was added after 1 h. Cells were then stained with Fixable Viability Stain 510 (BD Bioscience) and permeabilizated with the Cytofix/Cytoperm kit (BD Biosciences) before staining with anti-human IFN-γ-FITC (Clone 4S.B3, BD Biosciences) mAb. Data were acquired on a LSRFortessa X-20 driven by FACSDiva software (BD Biosciences) and analyzed using FlowJo software (version 10.4).
Data Analysis
RT-qPCR, Bioanalyzer and NanoDrop data were analyzed using a repeated-measures two-way ANOVA with Bonferroni-corrected multiple comparisons test comparing test to control mean. Correlation between RT-qPCR and protein quantification was test with linear regression analysis. Analysis was conducted using GraphPad Prism version 7.0 (GraphPad). In all cases, P < 0.05 were considered significant.
Results
ssoAdvanced™ Universal SYBR® Green Master-Mix Provided the Highest Reaction Efficiency
Four master-mixes—ssoAdvanced™ Universal SYBR® Green Master-Mix (Bio-Rad), QuantiNova SYBR® Green PCR Kit (QIAGEN), PowerUp SYBR® Green Master-Mix (Applied Biosystems) and RT2 SYBR® Green qPCR Master-Mix (QIAGEN)—were evaluated using two methods of preparing reference standards: (i) standards derived from log10 diluted amplicon; and (ii) standards generated from log10 diluted cDNA (Figure 1A). Reaction efficiency was quantified using four primer sets: three sets targeted reference genes known to have high (60S ribosomal protein L13a; RPL13a), moderate (Succinate dehydrogenase complex, subunit A; SDHA) and low (TATA-binding protein; TBP) expression; and one set targeted a cytokine gene (interferon gamma; IFN-γ) (47). When considering an acceptable reaction efficiency range (90–110%), 35.4% of the amplicon-derived standards (Table 3) and 43.8% of the diluted cDNA standards (Table 4) failed. Primer concentration did not significantly affect mean deviation from 100% reaction efficiency. Strikingly, when comparing SYBR master-mix kits with cDNA standards, the use of ssoAdvanced™ had 0% failure (efficiency: RPL13a 93.7%, SDHA 98.3%, TBP 95.9%, and IFN-γ 96.1%), the largest dynamic range (100−4 copies/reaction), and the lowest mean deviation from 100% (Table 4). The coefficient of determination of the standards (R2 ≥ 0.97) were consistent for all primers tested, at all concentrations. Together, these data identify ssoAdvanced™ master-mix as providing the highest reaction efficiency for qPCR from PBMC cDNA.
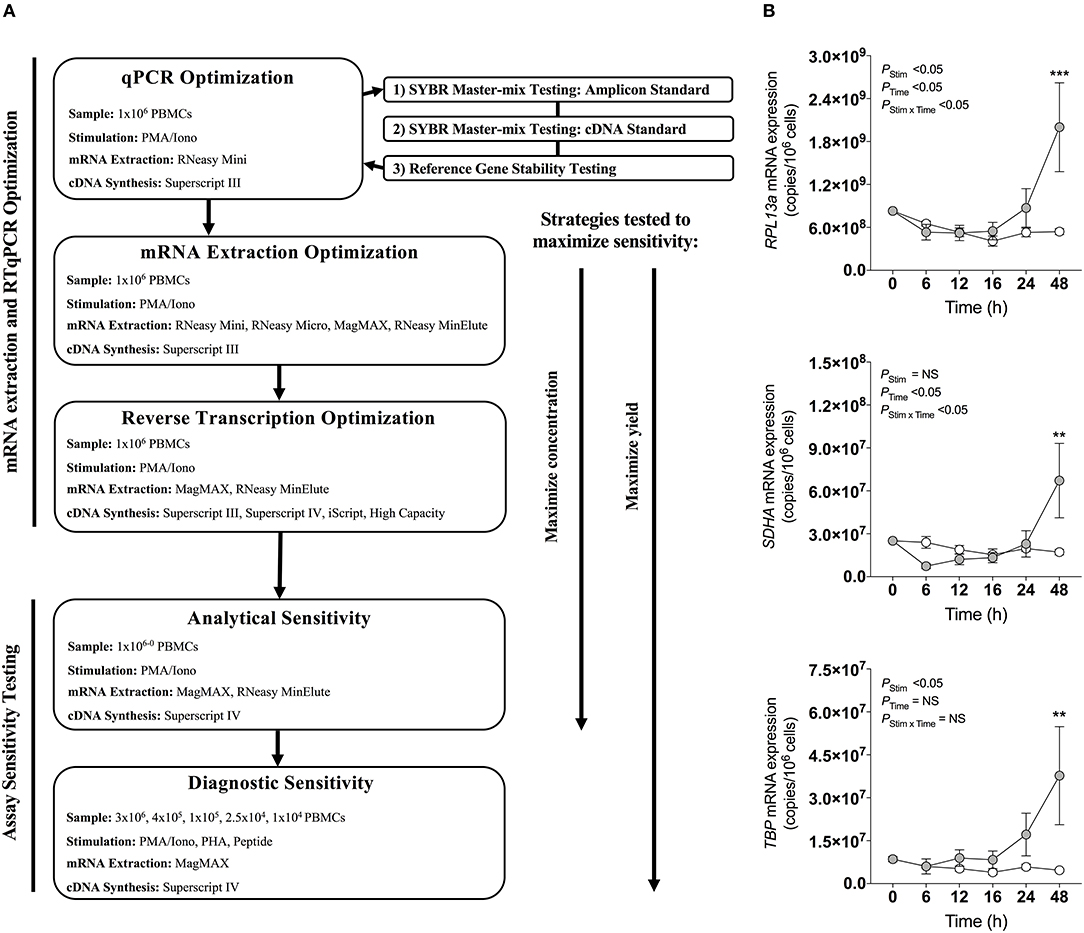
Figure 1. qPCR optimization. (A) Experimental workflow for qPCR optimization. (B) Effect of stimulation on mRNA expression of reference genes RPL13a, SDHA, and TBP. 1 × 10⁶ PBMCs paired samples were cultured with complete media (white), or stimulated with PMA/Iono control (gray) for 0, 6, 12, 16, 24, or 48 h. RNA was extracted using the RNeasy® Mini (Mini) Kit, and reverse transcribed with Superscript™ III (Invitrogen). RNA expression was determined by absolute quantitative RT-qPCR wherein number of gene copies per reaction was quantified by standard curve and normalized to cell number. Data were compared with a two-way ANOVA with post-hoc Bonferroni's multiple-comparisons test (**P ≤ 0.01; ***P ≤ 0.001). Biological replicate (n = 3) single RNA extractions with single reverse transcription reactions per extraction were performed. Sample mean calculated from technical triplicate qPCR. Biological mean ± biological SEM are shown.
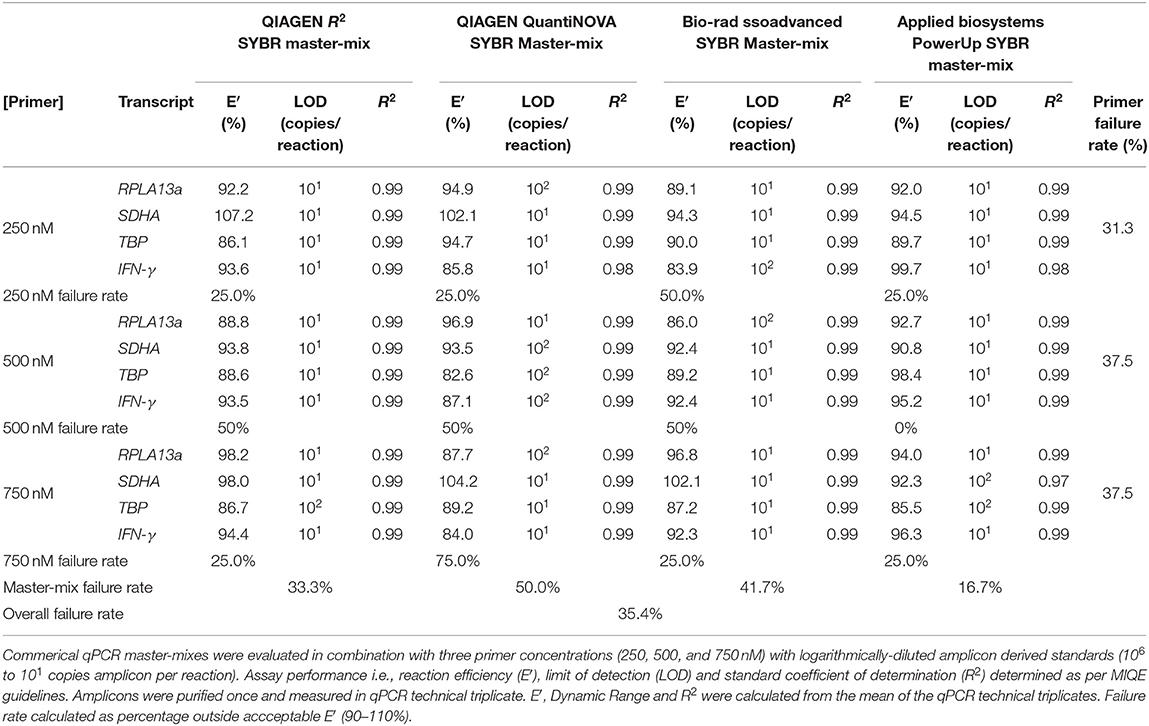
Table 3. Evaluation of commercial qPCR master-mixes by amplicon derived standards.
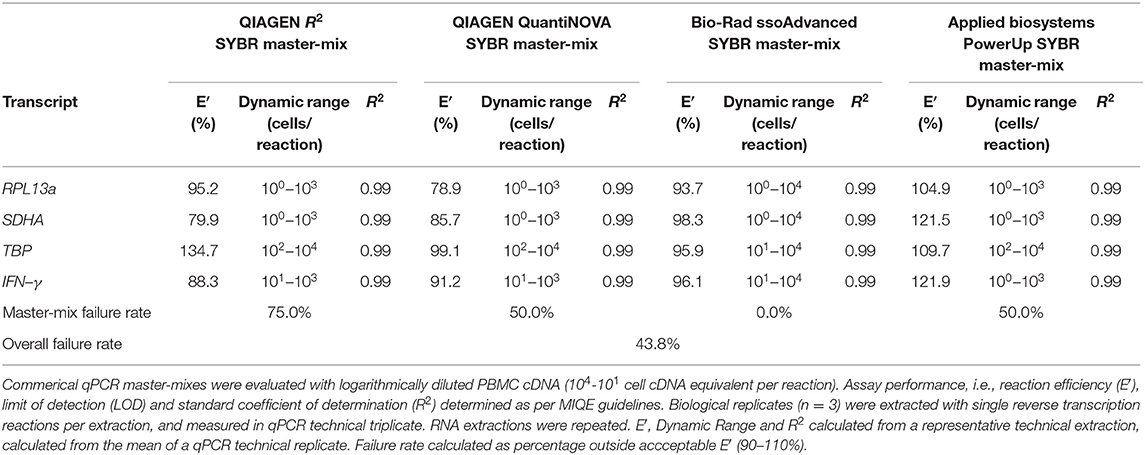
Table 4. Evaluation of commercial qPCR master-mixes by cDNA derived standards.
Mitogen Stimulation Induced Changes in RPL13a, SDHA, and TBP Gene Expression
The expression stability of three commonly used reference genes (47, 53, 54), RPL13a, SDHA, and TBP, previously reported as stable in PBMCs following stimulation (47), were evaluated by RT-qPCR within PBMCs stimulated with PMA/Iono for 6, 12, 18, 24, or 48 h. Expression of all three genes changed over time with cell culture, and significantly increased at 48 h post-stimulation as compared to baseline (P < 0.001, P < 0.01, and P < 0.01, respectively; Figure 1B). These data establish that the expression of common reference genes is significantly affected by stimulation, emphasizing the importance of absolute quantification normalized to cell numbers, rather than relative quantification.
Magnetic Bead-Based Extraction Significantly Increased RNA Yield and Concentration
Next, RNeasy® Mini and Micro silica columns (both QIAGEN) and MagMAX™ mirVana™ (MagMAX) Total RNA Isolation (Applied Biosystems) kits were tested for 1) RNA yield and 2) concentration with or without a post-extraction RNA concentration step using the RNeasy® MiniElute Cleanup Kit (QIAGEN). In each case, PBMCs were incubated with or without PMA/Iono for 6 h. RIN assessment demonstrated that RNA integrity was high (>7) and consistent across all kits (Figure 2A, left panel). RNA yield was significantly increased using MagMAX as compared to the RNeasy® Mini silica column extraction kit, for both stimulated and unstimulated PBMCs (mean yield (μg/106 cells): 0.87 vs. 1.36, P < 0.05 and 0.82 vs. 1.42, P < 0.01, respectively) (Figure 2A, middle panel). Moreover, the concentration of RNA extracted from both stimulated and unstimulated PBMCs significantly increased with the MagMAX-RNeasy® MiniElute combination (mean RNA concentration (ng/μL): 23.5 vs. 83.9, P < 0.0001 and 24.8 vs. 76.6, P < 0.0001, respectively) (Figure 2A, right panel). The RNeasy® Micro extraction kit had no impact on RIN, RNA yield or concentration.
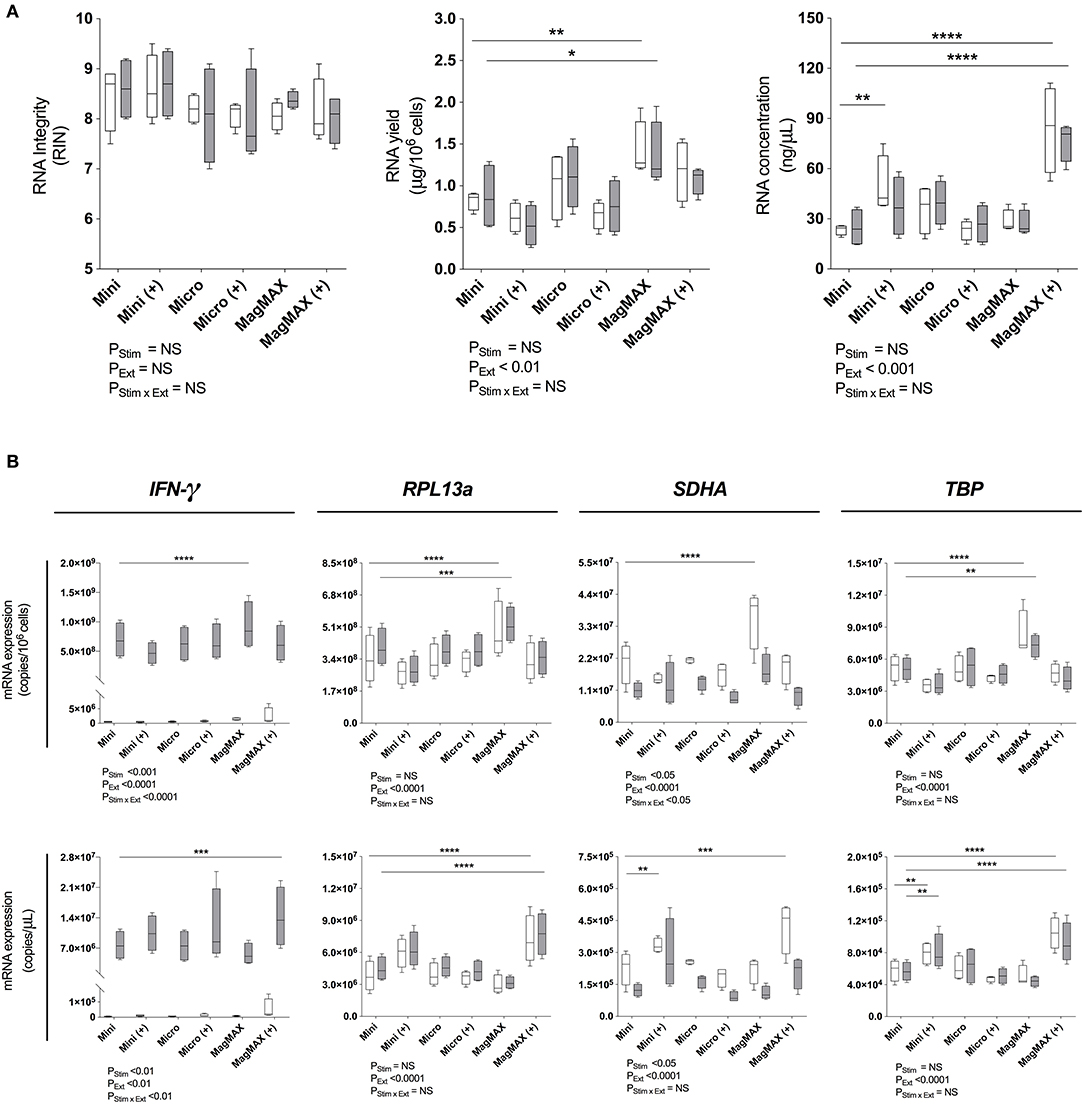
Figure 2. RNA extraction evaluation. (A) Bioanalyser analysis of RNA Integritry Number (RIN), and nanospectrophotometer analysis of yield and concentration were obtained using three commercially-available extraction kits with (+) or without post-extraction RNA purification and concentration. (B) RT-qPCR analysis of IFN-γ, RPL13a, SDHA, and TBP expression normalized to cell number (copies/106 cells) or cDNA concentration (copies/μL). 1 × 10⁶ PBMCs paired samples were cultured with complete media (white) or PMA/Iono (gray) for 6 h. RNA was extracted using the RNeasy® Mini (Mini) Kit, RNeasy® Micro (Micro) Kit (both QIAGEN), or MagMAX™ mirVana™ (MagMAX) Total RNA Isolation Kit (Applied Biosystems), with concentration step performed using the RNeasy® MiniElute Cleanup Kit (QIAGEN). All samples were reverse transcribed with Superscript™ III (Invitrogen). Data were analyzed using a two-way ANOVA with post-hoc Bonferroni's multiple-comparisons test (*P ≤ 0.05; **P ≤ 0.01; ***P ≤ 0.001; ****P ≤ 0.0001). Biological replicate (n = 4), triplicate RNA extractions, with single reverse transcription reactions per extraction were performed. Sample mean calculated from the mean of the technical RNA extractions which were in turn calculated from the mean of the technical triplicate qPCR reactions. Biological mean ± biological SEM are shown.
Magnetic Bead-Based Extraction Significantly Increased RT-qPCR Gene Expression Signal Measurements
RNA extraction kit eluates were subsequently reverse transcribed using Superscript™ III (ThermoFisher) and RPL13a, SDHA, TBP as well as IFN-γ quantified by RT-qPCR. Data were normalized to either RNA yield (copies/106 cells) or concentration (copies/μL). When considering both yield and concentration, RT-qPCR signal was significantly affected by extraction technique (PExt < 0.01 for all tested genes; Figure 2B). Consistent with our findings that SDHA expression was reduced following 6 h of exposure to PMA/Iono (Figure 1B), stimulation significantly reduced SDHA expression (P < 0.05; Figure 2B). Similarly, consistent with our findings that RNA yield was optimal with MagMAX (Figure 2A), we found significantly increased gene expression using MagMAX when compared to RNeasy® Mini, for both unstimulated (mean copies/106 cells: 3.4 × 10⁸ vs. 4.9 × 10⁸, P < 0.0001 RPL3a; 2.1 × 10⁷ vs. 3.6 × 10⁷, P < 0.0001 SDHA; 5.2 × 10⁶ vs. 8.3 × 10⁶, P < 0.001 TBP; Figure 2B) and stimulated (mean copies/106 cells: 6.9 × 10⁸ vs. 9.3 × 10⁸, P < 0.0001 IFN-γ; 4.0 × 10⁸ vs. 5.2 × 10⁸ P < 0.001 RPL13a; 5.1 × 10⁶ vs. 7.3 × 10⁶, P < 0.01 TBP; Figure 2B) PBMCs. Likewise, there was a significant increase in RNA concentration following RT-qPCR using the MagMAX-RNeasy® MiniElute combination when compared to RNeasy® Mini, for both unstimulated (mean copies/μLRT: 3.8 × 10⁶ vs. 7.2 × 10⁶, P < 0.0001 RPL13a; 2.3 × 10⁵ vs. 4.2 × 10⁵, P < 0.001 SDHA; 5.8 × 10⁴ vs. 1.0 × 10⁵, P < 0.001 TBP; Figure 2B) and stimulated (mean copies/μLRT: 7.7 × 10⁶ vs. 1.4 × 10⁷, P < 0.001 IFN-γ; 4.5 × 10⁶ vs. 7.7 × 10⁶, P < 0.0001 RPL13a; 5.7 × 10⁴ vs. 9.2 × 10⁴, P < 0.0001 TBP; Figure 2B) PBMCs. RNA yield and concentration were not significantly affected by the RNeasy® Micro extraction kit. When assessing technical reproducibility, extraction method also did not significantly affect standard deviation amongst replicate extractions (Supplementary Table 1). These data establish that magnetic bead-based extraction significantly enhanced RT-qPCR signal, as compared to silica column extractions.
Superscript™ IV Significantly Increased RT-qPCR Gene Expression Signal Measurements
To identify the optimal reverse transcription kit, Superscript™ III, Superscript™ IV (both ThermoFisher), iScript™ Advanced (Bio-Rad) and High-Capacity (Applied Biosystems) kits were tested in conjunction with MagMAX (Figure 3A) and MagMAX-RNeasy® MiniElute (Figure 3B). A statistically significant enhancement of RT-qPCR signal was observed with Superscript™ IV as compared to Superscript™ III for both unstimulated (mean copies/106 cells: 1.1 × 10⁷ vs. 1.3 × 10⁷ P < 0.05 SDHA; 4.1 × 10⁶ vs. 5.6 × 10⁶, P < 0.001 TBP; Figure 3A) and stimulated (mean copies/106 cells: 5.8 × 10⁸ vs. 6.9 × 10⁸, P < 0.001 IFN-γ; 5.9 × 10⁸ vs. 6.8 × 10⁸, P < 0.05 RPL13a; 3.5 × 10⁶ vs. 4.5 × 10⁶, P < 0.05 TBP; Figure 3A) PBMCs. Similarly, Superscript™ IV produced the highest RT-qPCR signal following MagMAX-RNeasy® MiniElute extraction-concentration for both unstimulated (mean copies/μL: 1.3 × 10⁷ vs. 2.5 × 10⁷, P < 0.05 RPL13a; Figure 3B) and stimulated (mean copies/μL: 1.7 × 10⁷ vs. 3.4 × 10⁷, P < 0.05 IFN-γ; 1.1 × 10⁷ vs. 2.2 × 10⁷, P < 0.001 RPL13a; Figure 3B) PBMCs. When assessing technical reproducibility, extraction had no statistically significant effect on variation between replicate extractions (Supplementary Table 2). These data identify Superscript™ IV as the superior reverse transcriptase kit irrespective of yield or concentration strategy.
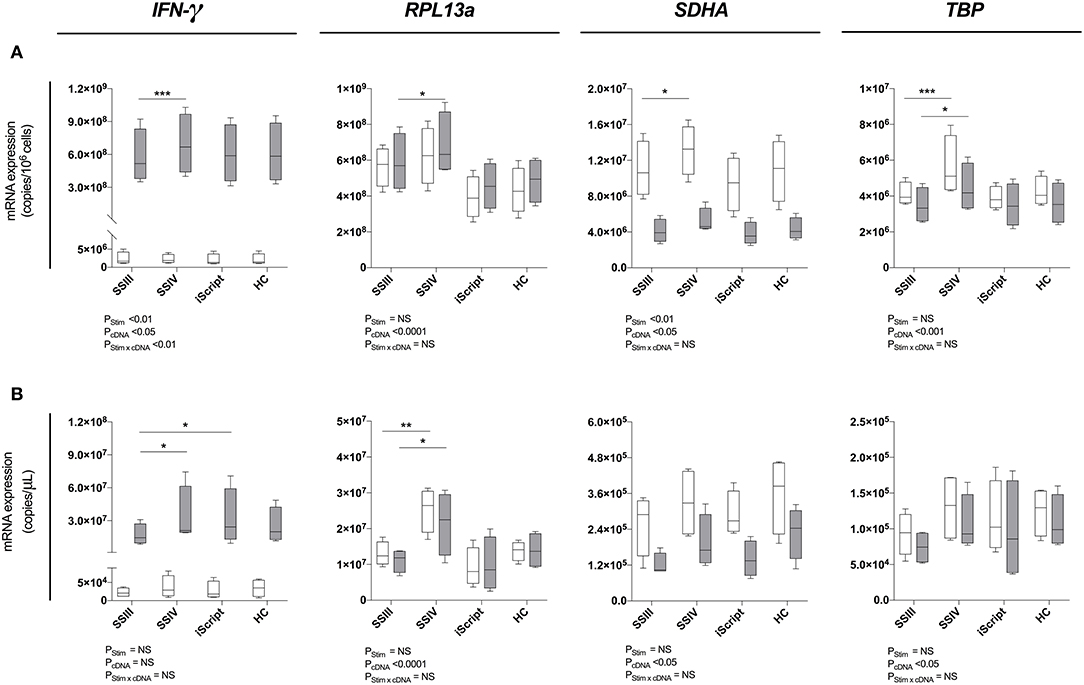
Figure 3. Reverse transcription evaluation. Four reverse transcription kits were evalued for relative qPCR signal for (A) maximal RNA yield, or (B) maximal RNA concentration. When maximizing RNA yield, RNA was extracted with MagMAX™ mirVana™ (MagMAX) Total RNA Isolation Kit (Applied Biosystems); when maximizing concentration, RNA was concentrated with RNeasy® MiniElute Cleanup Kit (QIAGEN). RNA was reverse transcribed with either Superscript™ III (SSIII), Superscript™ IV (SSIV) (both Invitrogen), iScript™ Advanced (iScript) (BioRad) or High-Capacity (HC) (ThermoFisher) reverse transcription kits. RNA was extracted from 1 × 10⁶ PBMCs pared samples, cultured with complete media (white) or PMA/Iono (gray) for 6 h, then IFN-γ, RPL13a, SDHA, and TBP mRNA expression was quantified. Data were compared with a two-way ANOVA (*P ≤ 0.05; **P ≤ 0.01; ***P ≤ 0.001 for post-hoc Bonferroni's multiple-comparisons test). Biological replicate (n = 4), single RNA extractions, with triplicate reverse transcription reactions per extraction were performed. Sample mean calculated from the mean of the reverse transcription reactions calculated from the mean of the technical triplicate qPCR reactions. Biological mean ± biological SEM are shown.
Single Cell Analytical Sensitivity Was Observed Following Magnetic Bead-Based RNA Extraction
We next evaluated the analytical sensitivity of our optimized protocol using MagMAX extraction kit (Figure 4A) and MagMAX-RNeasy® MiniElute extraction-concentration kit (Figure 4B). RNA was extracted from a log10 serial dilution of unstimulated PBMCs and expression of IFN-γ, RPL13a, SDHA, and TBP determined by absolute quantification. The highly expressed RPL13a gene was detected at single-cell level from both MagMAX (0.88 log10 copies/reaction; Figure 4A) and MagMAX-RNeasy® MiniElute combination (0.90 log10 copies/reaction; Figure 4B) extractions. Extraction technique did not influence IFN-γ, RPL13a, or TBP expression; whilst variability in SDHA expression (PExt < 0.05) was driven by increased RT-qPCR signal at 105 and 104 PBMCs per extraction. These data establish that our optimized protocol is capable of extracting and quantifying RNA of a highly expressed gene from a single cell. Importantly, the additional step of RNeasy® MiniElute Cleanup did not further enhance analytical sensitivity.
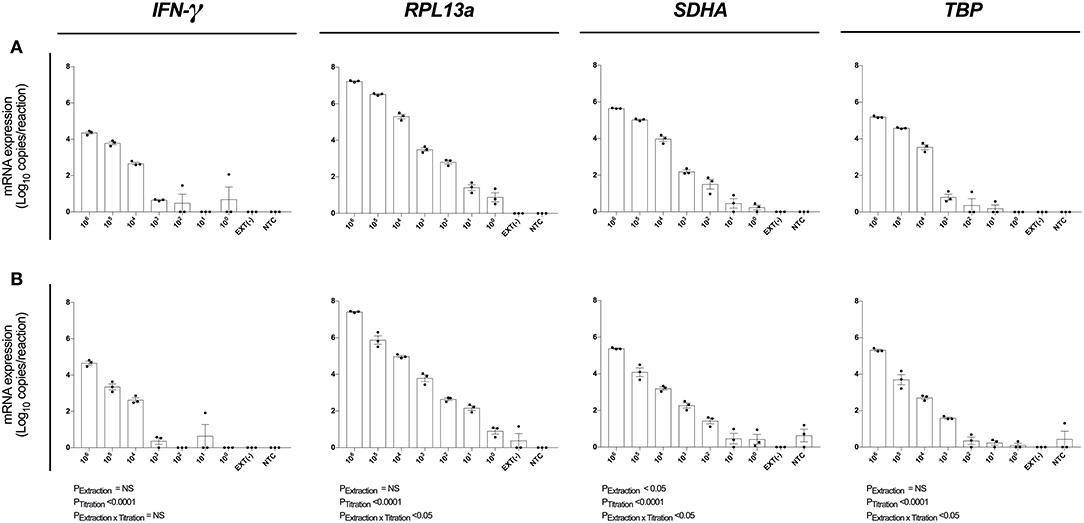
Figure 4. Assay analytical sensitivity. Relative RT-qPCR signal for IFN-γ, RPL13a, SDHA, and TBP mRNA expression from log10 dilutions of unstimulated PBMCs when (A) maximizing RNA yield, or (B) maximizing RNA concentration. When maximizing RNA yield, RNA was extracted with MagMAX™ mirVana™ (MagMAX) Total RNA Isolation Kit (Applied Biosystems); when maximizing concentration, RNA was concentrated with RNeasy® MiniElute Cleanup Kit (QIAGEN). All samples were reverse transcribed with Superscript™ IV (Invitrogen). mRNA expression was determined by absolute-quantitative RT-qPCR and gene copy number per reaction was normalized to log10 copies per reaction. Biological replicate (n = 3), single RNA extractions, with single reverse transcription reactions per extraction were performed. Sample mean calculated from the mean of the technical triplicate qPCR reactions. Biological mean ± biological SEM are shown.
RT-qPCR Protocol Diagnostic Sensitivity Correlates Significantly With Protein Level Quantification of Epitope-Specific Stimulation From as Few as 1 × 10⁴ PBMCs
Next, we determined the diagnostic sensitivity of our optimized RNA extraction and RT-qPCR protocol to confirm that it accurately reflected data generated using protein-level assays. We evaluated the epitope-specific stimulatory response for four CD8+ T cell epitopes restricted by different MHC molecules, quantifying IFN-γ production by flow cytometry, cytokine bead array and ELIspot; and IFN-γ mRNA by our optimized protocol. A limited epitope-specific IFN-γ response was demonstrated by flow cytometry (Figure 5A) and bead arrays (Figure 5B) whereas all samples were observed to respond to stimulation by ELIspot (Figure 5C). Importantly, our RT-qPCR protocol (Figure 6), was able to replicate the ELIspot results but with significantly reduced cell numbers (HLA-A1 2.5 × 10⁴, -A2 1 × 10⁵, -B7 1 × 10⁴, -B8 1 × 10⁵; 48-fold, 12-fold, and 48-fold and 12-fold, respectively; Figure 5D).
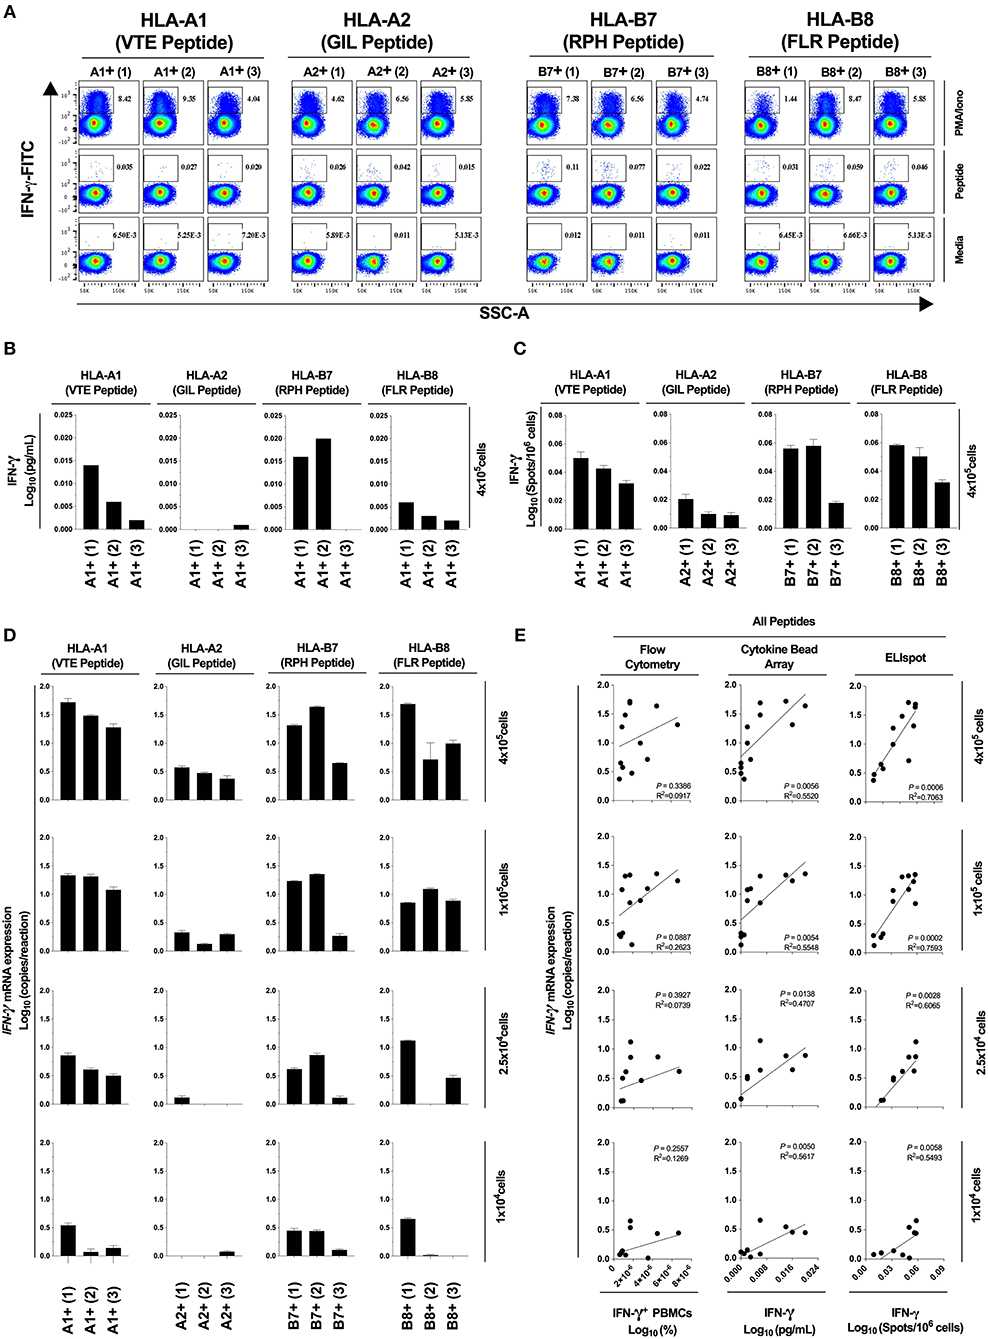
Figure 5. Assay diagnostic sensitivity. Production of IFN-γ protein was determined by flow cytometry (A), bead-based multiplex assay (MagPIX) (B), IFN-γ ELIspot (C); or IFN-γ mRNA expression by absolute RT-qPCR (D). IFN-γ mRNA expression was correlated to measurements of protein production by flow cytometry, MagPIX or IFN-γ ELIspot (E; left, middle and right panel, respectively). Biological replicate (n = 3) per HLA-A1, HLA-A2, HLA-B7, or HLA-B8 positive PBMCs (i.e., n = 12 total) were stimulated with synthetic HLA-matched peptides representing CMV, Influenza or EBV CD8+ T cell epitopes “VTE,” “GIL,” “RPH,” or “FLR” (black), respectively. All samples were cultured with media negative control or PMA/Iono positive control. IFN-γ mRNA expression was determined by absolute quantification RT-qPCR of titrated PBMCs (4 × 10⁵, 1 × 10⁵, 2.5 × 10⁴, and 1 × 10⁴); gene copy number per reaction was quantified by standard curve and log10 transformed. Single RNA extractions, with single reverse transcription reactions per n, were performed. qPCR performed in technical triplicate replicates. Flow cytometry and MagPIX performed in single wells. ELIspot performed in technical triplicate replicates. Sample mean calculated from the mean of the technical single or triplicates. Biological mean ± technical SEM above background shown.
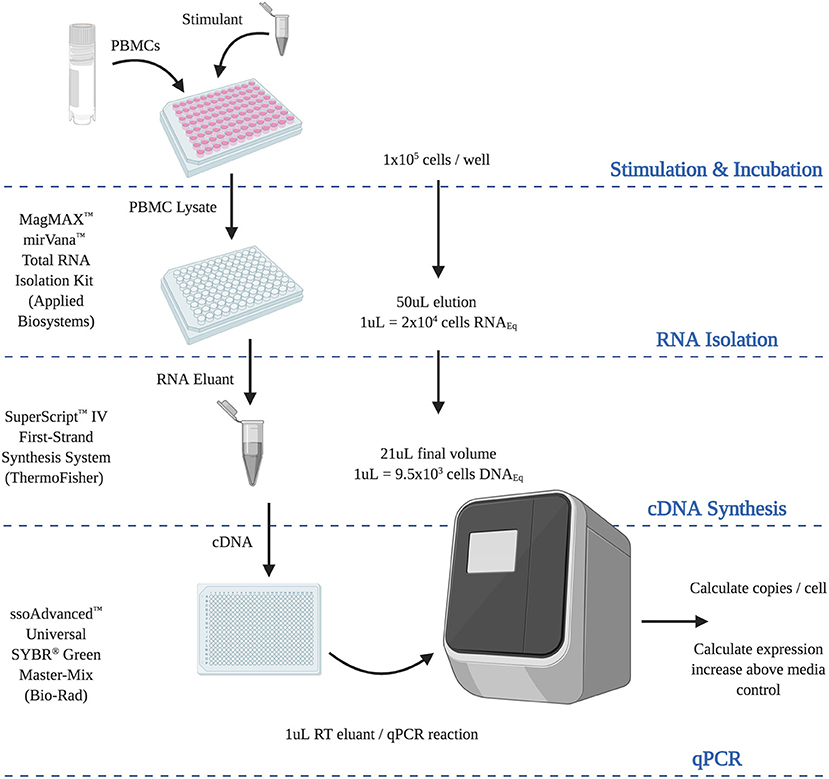
Figure 6. Final optimized RT-qPCR assay. Steps and calculations required for the use of the optimized analytically and diagnostically sensitive RNA extraction and RT-qPCR protocol, from peripheral blood mononuclear cells. (RNAEQ, RNA equivalent; DNAEQ, DNA equivalent).
Optimized RT-qPCR Assay Correlated With Best-Practice Protein-Based Immunoassays
Next, we assessed correlation between results obtained using our optimized RT-qPCR protocol and current best-practice immunoassays. The correlation between our RT-qPCR protocol and ELIspot was significant at all cell numbers tested [P = 0.0006, R2 = 0.7063 (4 × 10⁵); P = 0.0002, R2 = 0.7593 (1 × 10⁵); P = 0.0028, R2 = 0.6065 (2.5 × 10⁴); P = 0.0058, R2 = 0.5493 (1 × 10⁴); Figure 5E, right panel]. The correlation was also significant with MagPIX multiplex bead-based array [P = 0.0056, R2 = 0.5520 (4 × 10⁵); P = 0.0054, R2 = 0.5548 (1 × 10⁵); P = 0.0138, R2 = 0.4707 (2.5 × 10⁴); P = 0.0050, R2 = 0.5617 (1 × 10⁴); Figure 5E, middle panel], but non-significant (albeit with a similar trend) with flow cytometry (Figure 5E, left panel). Thus, data generated using our optimized RT-qPCR assay are consistent with best practice protein-based immunoassays. Furthermore, our assay is capable of defining an epitope-specific response hierarchy from as few as 1 × 10⁴ cells, representing a clinically and diagnostically meaningful reduction in cell number.
Taken together, we report here a highly sensitive RNA extraction and RT-qPCR quantification strategy using the MagMAX RNA extraction kit, Superscript™ IV reverse-transcription kit and ssoAdvanced™ SYBR master-mix (Supplementary Table 3). This assay is sensitive to the single cell level, can define an epitope hierarchy of response from as few as 1 × 10⁴ cells, and represents a sensitive and robust alternative to protein quantification for research, diagnostic and clinical applications.
Discussion
Herein, we describe an optimized RNA extraction and RT-qPCR protocol requiring low PBMC numbers, with high analytical and diagnostic sensitivity, whilst maintaining high correlation to protein-level quantification that is typically reliant on much larger cell numbers for detection.
Precise RT-qPCR results are typically dependent on reactions maintaining efficiency close to 100% (45). Both assay design (e.g., primer concentration, master-mix) and sample (e.g., co-extracted inhibitors) may influence PCR efficiency. We made use of the open-access database PrimerBank™ since those primers have been designed for use under consistent conditions (i.e., optimal Tm 60°C) and cover most known human and mouse genes (55). We found primer concentration titrations did not impact reaction efficiency, whereas the SYBR master-mix had a significant impact. PCR inhibitors, including hemoglobin, lactoferrin, anticoagulants, IgG, polysaccharides, and proteases, can be co-extracted in PBMC preparations (56, 57). It is known that some DNA-polymerase variants and PCR buffer “enhancers” have improved reaction efficiency in the presence of such inhibitors (56, 58). The ssoAdvanced™ master-mix, identified herein as optimal of those tested, appears to be one such master-mix facilitating PCR efficiency in the presence of co-extracted inhibitors. Optimization of master-mix reagents will likely continue to be important in improving blood-based PCR analysis and diagnostics (59, 60); especially for accurate amplification of relatively low abundant targets, comparisons between populations with high variability, or amplification from inhibitor-enriched mediums (i.e., whole blood extractions) (10, 59).
We tested three RNA extraction kits by evaluating extraction quality and efficiency: RNeasy® Mini Kit, RNeasy® Micro Kit, and MagMAX™ mirVana™ Kit; in combination with the RNA purification and concentration kit: RNeasy® MiniElute Cleanup Kit. When extracting identically controlled samples, all kits yielded RNA with equivalent RIN scores and low technical variability between replicates. Importantly, RNA yield from PBMCs was significantly increased using MagMAX as compared to silica-column technologies. Additionally, when compared to silica-column extractions, we found MagMAX was more cost and time efficient when running larger number of samples (e.g., 96 samples in ~2 h). We therefore expect magnetic bead-based extractions will become increasingly common within blood-based nucleic acid isolations (59, 61, 62). In addition to extraction techniques (e.g., silica column, phase separation), other factors that could impact RNA quality, yield and concentration include sample collection, storage, and transportation.
Four reverse transcriptase (RT) kits were also evaluated: SuperScript™ III First-Strand Synthesis System, SuperScript™ IV First-Strand Synthesis System, iScript™ Advanced cDNA Synthesis Kit and High-Capacity RNA-cDNA Kit™. Of those, Superscript™ IV was associated with the highest qPCR signal. A previous study evaluating RNA extracted from PBMCs using earlier-generation RT kits reported >128-fold increased qPCR signal between kits (1). We speculate that the reduced variability that we observed between RT kits tested in our study reflects consistent kit quality, purity of the RNA extracted by MagMAX, or a combination thereof.
Both analytical sensitivity and diagnostic sensitivity are key criteria for any RT-qPCR protocol. We show that the analytical sensitivity of our assay is to the level of single cell RNA detection for relatively highly expressed RPL13a. Sample concentration and clean-up has been suggested to remove inhibitors and increase sensitivity (63, 64). Unexpectedly, we found this step did not improve our analytical sensitivity, and was time-consuming, expensive and reduced sample volume. Nevertheless, if concentration is warranted under specific experimental situations, our data suggest that it is technically feasible while retaining high analytical sensitivity. Diagnostic sensitivity determined using MagMAX showed that an epitope response hierarchy could be detected with as few as 1 × 10⁴ PBMCs. It is well-known that there is no absolute correlation between RNA expression and protein translation. Indeed, correlations between transcript and protein expression would be markedly reduced under situations of epigenetic, post-transcriptional or post-translational modification of the gene of interest (65). Nevertheless, we correlated our optimized RT-qPCR assay with commonly used protein-level immunoassays (flow cytometry, cytokine bead arrays, and ELIspot) and showed a very high correlation with the gold-standard protein-level assay, ELIspot, as well as the commonly used MagPIX bead-based cytokine assay, at all tested PBMC concentrations. This highlights that our protocol represents a robust alternative to protein-based assays (e.g., when measuring changes in cytokine mRNA expression in PBMCs in response to specific in vitro stimulation). This work will significantly improve analytical capacity of studies relying on irreplaceable, relatively small or costly human samples (e.g., neonatal PBMCs) (66, 67).
Another important outcome of our work is the finding that absolute quantification of transcripts and subsequent normalization to cell numbers is the most appropriate analysis strategy for RNA/RT-qPCR quantification from PBMCs (45, 48). We observed significant alterations in gene expression of commonly used reference genes RPL13a, SDHA and TBP following stimulation. This is not unexpected as reference genes have been described as variable across cell types, tissues, and experimental and stimulatory conditions (25, 47, 68, 69).
In summary, we report herein the development of an optimized PBMC RNA extraction and RT-qPCR protocol. We employed a qPCR strategy of absolute quantification utilizing PrimerBank™ primers and ssoAdvanced™ Universal SYBR® Green Master-Mix. PBMC RNA was isolated with MagMAX™ mirVana™ Total RNA Isolation Kit and reverse transcribed with SuperScript™ IV First-Strand Synthesis System. Our assay provided single cell analytical sensitivity and a diagnostic sensitivity that could define response hierarchy from 1 × 10⁴ cells. This assay offers an alternative to current best practice protein-based immunoassays, especially for limited PBMC numbers. This work has broad applicability for both clinical and primary research practice.
Data Availability Statement
The raw data supporting the conclusions of this article will be made available by the authors, without undue reservation, to any qualified researcher.
Ethics Statement
The studies involving human participants were reviewed and approved by James Cook University Human Research Ethics Committee. The patients/participants provided their written informed consent to participate in this study.
Author Contributions
DB and CL performed experiments. DB, JB, CL, and DD designed experiments. DB, JB, AW, CL, and DD analyzed and interpreted the data. DB, CL, and DD wrote the manuscript, with input from JB and AW.
Funding
This work was supported by a National Health and Medical Research Council of Australia Project grant (#1069466). DD was supported by a NHMRC Principal Research Fellowship (#1137285).
Conflict of Interest
The authors declare that the research was conducted in the absence of any commercial or financial relationships that could be construed as a potential conflict of interest.
Acknowledgments
We are grateful to all of the donors who kindly provided samples in support of this study. Figure 6 was created using BioRender.com.
Supplementary Material
The Supplementary Material for this article can be found online at: https://www.frontiersin.org/articles/10.3389/fimmu.2020.00402/full#supplementary-material
References
1. Eikmans M, Rekers NV, Anholts JD, Heidt S, Claas FH. Blood cell mRNAs and microRNAs: optimized protocols for extraction and preservation. Blood. (2013) 121:e81–9. doi: 10.1182/blood-2012-06-438887
2. Monleau M, Bonnel S, Gostan T, Blanchard D, Courgnaud V, Lecellier CH. Comparison of different extraction techniques to profile microRNAs from human sera and peripheral blood mononuclear cells. BMC Genomics. (2014) 15:395. doi: 10.1186/1471-2164-15-395
3. Yeomans A, Thirdborough SM, Valle-Argos B, Linley A, Krysov S, Hidalgo MS, et al. Engagement of the B-cell receptor of chronic lymphocytic leukemia cells drives global and MYC-specific mRNA translation. Blood. (2016) 127:449–57. doi: 10.1182/blood-2015-07-660969
4. de Weerdt I, Hofland T, Lameris R, Endstra S, Jongejan A, Moerland PD, et al. Improving CLL Vgamma9Vdelta2-T-cell fitness for cellular therapy by ex vivo activation and ibrutinib. Blood. (2018) 132:2260–72. doi: 10.1182/blood-2017-12-822569
5. Eikmans M, Roelen DL, Claas FH. Molecular monitoring for rejection and graft outcome in kidney transplantation. Expert Opin Med Diagn. (2008) 2:1365–79. doi: 10.1517/17530050802600683
6. van 't Veer LJ, Dai HMJ, van de Vijver, He YD, Hart AA, Mao M, Peterse HL, et al. Gene expression profiling predicts clinical outcome of breast cancer. Nature. (2002) 415:530–6. doi: 10.1038/415530a
7. Ebert BL, Golub TR. Genomic approaches to hematologic malignancies. Blood. (2004) 104:923–32. doi: 10.1182/blood-2004-01-0274
8. Burczynski ME, Twine NC, Dukart G, Marshall B, Hidalgo M, Stadler WM, et al. Transcriptional profiles in peripheral blood mononuclear cells prognostic of clinical outcomes in patients with advanced renal cell carcinoma. Clin Cancer Res. (2005) 11:1181–9.
9. Carrera Silva EA, Nowak W, Tessone L, Olexen CM, Ortiz Wilczynski JM, Estecho IG, et al. CD207(+)CD1a(+) cells circulate in pediatric patients with active Langerhans cell histiocytosis. Blood. (2017) 130:1898–902. doi: 10.1182/blood-2017-05-782730
10. Ries J, Baran C, Wehrhan F, Weber M, Neukam FW, Krautheim-Zenk A, et al. Prognostic significance of altered miRNA expression in whole blood of OSCC patients. Oncol Rep. (2017) 37:3467–74. doi: 10.3892/or.2017.5639
11. Yang J, LeBlanc FR, Dighe SA, Hamele CE, Olson TL, Feith DJ, et al. TRAIL mediates and sustains constitutive NF-kappaB activation in LGL leukemia. Blood. (2018) 131:2803–15. doi: 10.1182/blood-2017-09-808816
12. Chen H, Zhang X, Liao N, Mi L, Peng Y, Liu B, et al. Enhanced expression of NLRP3 inflammasome-related inflammation in diabetic retinopathy. Invest Ophthalmol Vis Sci. (2018) 59:978–85. doi: 10.1167/iovs.17-22816
13. Qu X, Dang X, Wang W, Li Y, Xu D, Shang D, et al. Long noncoding RNAs and mRNA regulation in peripheral blood mononuclear cells of patients with chronic obstructive pulmonary disease. Med Inflamm. (2018) 2018:7501851. doi: 10.1155/2018/7501851
14. Higbee RG, Byers AM, Dhir V, Drake D, Fahlenkamp HG, Gangur J, et al. An immunologic model for rapid vaccine assessment – a clinical trial in a test tube. Altern Lab Anim. (2009) 37 (Suppl. 1):19–27. doi: 10.1177/026119290903701S05
15. Laird GM, Rosenbloom DI, Lai J, Siliciano RF, Siliciano JD. Measuring the frequency of latent HIV-1 in resting CD4(+) T cells using a limiting dilution coculture assay. Methods Mol Biol. (2016) 1354:239–53. doi: 10.1007/978-1-4939-3046-3_16
16. Contreras X, Salifou K, Sanchez G, Helsmoortel M, Beyne E, Bluy L, et al. Nuclear RNA surveillance complexes silence HIV-1 transcription. PLoS Pathog. (2018) 14:e1006950. doi: 10.1371/journal.ppat.1006950
17. Ming M, Bernardo L, Williams K, Kolattukudy P, Kapoor N, Chan LG, et al. An in vitro functional assay to measure the biological activity of TB vaccine candidate H4-IC31. Vaccine. (2019) 37:2960–6. doi: 10.1016/j.vaccine.2019.04.035
18. Saah AJ, Hoover DR. Sensitivity and specificity reconsidered: the meaning of these terms in analytical and diagnostic settings. Ann Intern Med. (1997) 126:91–4. doi: 10.7326/0003-4819-126-1-199701010-00026
19. Kingsmore SF. Multiplexed protein measurement: technologies and applications of protein and antibody arrays. Nat Rev Drug Discov. (2006) 5:310–20. doi: 10.1038/nrd2006
20. Lamoreaux L, Roederer M, Koup R. Intracellular cytokine optimization and standard operating procedure. Nat Protoc. (2006) 1:1507–16. doi: 10.1038/nprot.2006.268
21. Romer PS, Berr S, Avota E, Na SY, Battaglia M, Ten Berge I, et al. Preculture of PBMCs at high cell density increases sensitivity of T-cell responses, revealing cytokine release by CD28 superagonist TGN1412. Blood. (2011) 118:6772–82. doi: 10.1182/blood-2010-12-319780
22. Kutscher S, Dembek CJ, Deckert S, Russo C, Korber N, Bogner JR, et al. Overnight resting of PBMC changes functional signatures of antigen specific T- cell responses: impact for immune monitoring within clinical trials. PLoS ONE. (2013) 8:e76215. doi: 10.1371/journal.pone.0076215
23. Lin Y, Gallardo HF, Ku GY, Li H, Manukian G, Rasalan TS, et al. Optimization and validation of a robust human T-cell culture method for monitoring phenotypic and polyfunctional antigen-specific CD4 and CD8 T-cell responses. Cytotherapy. (2009) 11:912–22. doi: 10.3109/14653240903136987
24. Barabas S, Spindler T, Kiener R, Tonar C, Lugner T, Batzilla J, et al. An optimized IFN-gamma ELISpot assay for the sensitive and standardized monitoring of CMV protein-reactive effector cells of cell-mediated immunity. BMC Immunol. (2017) 18:14. doi: 10.1186/s12865-017-0195-y
25. Sharma S, Malmestrom C, Lindberg C, Meisel S, Schon K, Verolin M, et al. A sensitive method for detecting peptide-specific CD4(+) T cell responses in peripheral blood from patients with myasthenia gravis. Front Immunol. (2017) 8:1370. doi: 10.3389/fimmu.2017.01370
26. Gill DK, Huang Y, Levine GL, Sambor A, Carter DK, Sato A, et al. Equivalence of ELISpot assays demonstrated between major HIV network laboratories. PLoS ONE. (2010) 5:e14330. doi: 10.1371/journal.pone.0014330
27. Ashoor I, Najafian N, Korin Y, Reed EF, Mohanakumar T, Ikle D, et al. Standardization and cross validation of alloreactive IFNgamma ELISPOT assays within the clinical trials in organ transplantation consortium. Am J Transplant. (2013) 13:1871–9. doi: 10.1111/ajt.12286
28. Walsh PN, Friedrich DP, Williams JA, Smith RJ, Stewart TL, Carter DK, et al. Optimization and qualification of a memory B-cell ELISpot for the detection of vaccine-induced memory responses in HIV vaccine trials. J. Immunol. Methods. (2013) 394:84–93. doi: 10.1016/j.jim.2013.05.007
29. Keller CC, Kremsner PG, Hittner JB, Misukonis MA, Weinberg JB, Perkins DJ. Elevated nitric oxide production in children with malarial anemia: hemozoin-induced nitric oxide synthase type 2 transcripts and nitric oxide in blood mononuclear cells. Infect Immun. (2004) 72:4868–73. doi: 10.1128/IAI.72.8.4868-4873.2004
30. Posevitz-Fejfar A, Posevitz V, Gross CC, Bhatia U, Kurth F, Schutte V, et al. Effects of blood transportation on human peripheral mononuclear cell yield, phenotype and function: implications for immune cell biobanking. PLoS ONE. (2014) 9:e115920. doi: 10.1371/journal.pone.0115920
31. Azizi A. Protective efficacy of candidate vaccines prior to human clinical trials. J Pharm Sci. (2018) 107:2992–4. doi: 10.1016/j.xphs.2018.08.005
32. Tourdot S, Hickling TP. Nonclinical immunogenicity risk assessment of therapeutic proteins. Bioanalysis. (2019) 11:1631–43. doi: 10.4155/bio-2018-0246
33. Cioni M, Leboeuf C, Comoli P, Ginevri F, Hirsch HH. Characterization of immunodominant BK polyomavirus 9mer epitope T cell responses. Am J Transplant. (2016) 16:1193–206. doi: 10.1111/ajt.13598
34. Masilamani M, Pascal M, Sampson HA. T-cell proliferation assay: determination of immunodominant T-cell epitopes of food allergens. Methods Mol Biol. (2017) 1592:189–98. doi: 10.1007/978-1-4939-6925-8_15
35. Zhang J, Fang H, Shen S, Dang E, Li Q, Qiao P, et al. Identification of immunodominant Th2-cell epitopes in chinese patients with bullous pemphigoid. J Invest Dermatol. (2018) 138:1917–24. doi: 10.1016/j.jid.2018.03.1515
36. Prokopec SD, Watson JD, Waggott DM, Smith AB, Wu AH, Okey AB, et al. Systematic evaluation of medium-throughput mRNA abundance platforms. RNA. (2013) 19:51–62. doi: 10.1261/rna.034710.112
37. Pescarmona R, Belot A, Villard M, Besson L, Lopez J, Mosnier I, et al. Comparison of RT-qPCR and Nanostring in the measurement of blood interferon response for the diagnosis of type I interferonopathies. Cytokine. (2019) 113:446–52. doi: 10.1016/j.cyto.2018.10.023
38. Bhatia P, Taylor WR, Greenberg AH, Wright JA. Comparison of glyceraldehyde-3-phosphate dehydrogenase and 28S-ribosomal RNA gene expression as RNA loading controls for northern blot analysis of cell lines of varying malignant potential. Anal Biochem. (1994) 216:223–6. doi: 10.1006/abio.1994.1028
39. Bustin SA. Quantification of mRNA using real-time reverse transcription PCR. (RT-PCR): trends and problems. J Mol Endocrinol. (2002) 29:23–39. doi: 10.1677/jme.0.0290023
40. Lowe R, Shirley N, Bleackley M, Dolan S, Shafee T. Transcriptomics technologies. PLoS Comput Biol. (2017) 13:e1005457. doi: 10.1371/journal.pcbi.1005457
41. Chin EL, da Silva C, Hegde M. Assessment of clinical analytical sensitivity and specificity of next-generation sequencing for detection of simple and complex mutations. BMC Genet. (2013) 14:6. doi: 10.1186/1471-2156-14-6
42. Taylor SC, Laperriere G, Germain H. Droplet Digital PCR versus qPCR for gene expression analysis with low abundant targets: from variable nonsense to publication quality data. Sci Rep. (2017) 7:2409. doi: 10.1038/s41598-017-02217-x
43. Escobar-Escamilla N, Ramirez-Gonzalez JE, Castro-Escarpulli G, Diaz-Quinonez JA. Utility of high-throughput DNA sequencing in the study of the human papillomaviruses. Virus Genes. (2018) 54:17–24. doi: 10.1007/s11262-017-1530-3
44. Nfonsam L, Ordorica S, Ghani M, Potter R, Schaffer A, Daoud H, et al. Leveraging the power of new molecular technologies in the clinical setting requires unprecedented awareness of limitations and drawbacks: experience of one diagnostic laboratory. J Med Genet. (2019) 56:408–12. doi: 10.1136/jmedgenet-2018-105443
45. Bustin SA, Benes V, Garson JA, Hellemans J, Huggett J, Kubista M, et al. The MIQE guidelines: minimum information for publication of quantitative real-time PCR experiments. Clin Chem. (2009) 55:611–22. doi: 10.1373/clinchem.2008.112797
46. Bas A, Forsberg G, Hammarstrom S, Hammarstrom ML. Utility of the housekeeping genes 18S rRNA, beta-actin and glyceraldehyde-3-phosphate-dehydrogenase for normalization in real-time quantitative reverse transcriptase-polymerase chain reaction analysis of gene expression in human T lymphocytes. Scand J Immunol. (2004) 59:566–73. doi: 10.1111/j.0300-9475.2004.01440.x
47. Ledderose C, Heyn J, Limbeck E, Kreth S. Selection of reliable reference genes for quantitative real-time PCR in human T cells and neutrophils. BMC Res Notes. (2011) 4:427. doi: 10.1186/1756-0500-4-427
48. Nolan T, Hands RE, Bustin SA. Quantification of mRNA using real-time RT-PCR. Nat Protoc. (2006) 1:1559–82. doi: 10.1038/nprot.2006.236
49. Ruijter JM, Ramakers C, Hoogaars WM, Karlen Y, Bakker OMJ, van den Hoff, et al. Amplification efficiency: linking baseline and bias in the analysis of quantitative PCR data. Nucleic Acids Res. (2009) 37:e45. doi: 10.1093/nar/gkp045
50. Stahlberg A, Kubista M. The workflow of single-cell expression profiling using quantitative real-time PCR. Expert Rev Mol Diagn. (2014) 14:323–31. doi: 10.1586/14737159.2014.901154
51. Wang R, Epstein J, Baraceros FM, Gorak EJ, Charoenvit Y, Carucci DJ, et al. Induction of CD4(+) T cell-dependent CD8(+) type 1 responses in humans by a malaria DNA vaccine. Proc Natl Acad Sci USA. (2001) 98:10817–22. doi: 10.1073/pnas.181123498
52. Pattinson DJ, Apte SH, Wibowo N, Chuan YP, Rivera-Hernandez T, Groves PL, et al. Chimeric murine polyomavirus virus-like particles induce plasmodium antigen-specific CD8(+) T cell and antibody responses. Front Cell Infect Microbiol. (2019) 9:215. doi: 10.3389/fcimb.2019.00215
53. Luchting B, Rachinger-Adam B, Zeitler J, Egenberger L, Mohnle P, Kreth S, et al. Disrupted TH17/Treg balance in patients with chronic low back pain. PLoS ONE. (2014) 9:e104883. doi: 10.1371/journal.pone.0104883
54. Trinite B, Chan CN, Lee CS, Mahajan S, Luo Y, Muesing MA, et al. Suppression of Foxo1 activity and down-modulation of CD62L (L-selectin) in HIV-1 infected resting CD4 T cells. PLoS ONE. (2014) 9:e110719. doi: 10.1371/journal.pone.0110719
55. Spandidos A, Wang X, Wang H, Seed B. PrimerBank: a resource of human and mouse PCR primer pairs for gene expression detection and quantification. Nucleic Acids Res. (2010) 38:D792–9. doi: 10.1093/nar/gkp1005
56. Al-Soud WA, Radstrom P. Purification and characterization of PCR-inhibitory components in blood cells. J Clin Microbiol. (2001) 39:485–93. doi: 10.1128/JCM.39.2.485-493.2001
57. Schrader C, Schielke A, Ellerbroek L, Johne R. PCR inhibitors - occurrence, properties and removal. J Appl Microbiol. (2012) 113:1014–26. doi: 10.1111/j.1365-2672.2012.05384.x
58. Kermekchiev MB, Kirilova LI, Vail EE, Barnes WM. Mutants of Taq DNA polymerase resistant to PCR inhibitors allow DNA amplification from whole blood and crude soil samples. Nucleic Acids Res. (2009) 37:e40. doi: 10.1093/nar/gkn1055
59. Liang F, Browne DJ, Gray MJ, Gartlan KH, Smith DD, Barnard RT, et al. Development of a multiplexed microsphere PCR for culture-free detection and gram-typing of bacteria in human blood samples. ACS Infect Dis. (2018) 4:837–44. doi: 10.1021/acsinfecdis.7b00277
60. Gutierrez-Loli R, Ferradas C, Diestra A, Traianou A, Bowman N, Bok JM, et al. Development of a novel protocol based on blood clot to improve the sensitivity of qpcr detection of toxoplasma gondii in peripheral blood specimens. Am J Trop Med Hyg. (2019) 100:83–9. doi: 10.4269/ajtmh.17-0920
61. Archin NM, Bateson R, Tripathy MK, Crooks AM, Yang KH, Dahl NP, et al. HIV-1 expression within resting CD4+ T cells after multiple doses of vorinostat. J Infect Dis. (2014) 210:728–35. doi: 10.1093/infdis/jiu155
62. Oliver-Ferrando S, Segales J, Sibila M, Diaz I. Comparison of cytokine profiles in peripheral blood mononuclear cells between piglets born from Porcine circovirus 2 vaccinated and non-vaccinated sows. Vet Microbiol. (2018) 214:148–53. doi: 10.1016/j.vetmic.2017.12.011
63. Williams WV, Rosenbaum H, Weiner DB. Effect of RNA concentration on cDNA synthesis for DNA amplification. PCR Methods Appl. (1992) 2:86–8. doi: 10.1101/gr.2.1.86
64. Bustin S, Nolan T. Talking the talk, but not walking the walk: RT-qPCR as a paradigm for the lack of reproducibility in molecular research. Eur J Clin Invest. (2017) 47:756–74. doi: 10.1111/eci.12801
65. Liu Y, Beyer A, Aebersold R. On the dependency of cellular protein levels on mRNA abundance. Cell. (2016) 165:535–50. doi: 10.1016/j.cell.2016.03.014
66. Misra RS, Bhattacharya S, Huyck HL, Wang JC, Slaunwhite CG, Slaunwhite SL, et al. Flow-based sorting of neonatal lymphocyte populations for transcriptomics analysis. J Immunol Methods. (2016) 437:13–20. doi: 10.1016/j.jim.2016.07.001
67. Brennan K, O'Leary BD, Mc Laughlin D, Breen EP, Connolly E, Ali N, et al. Type 1 IFN induction by cytosolic nucleic acid is intact in neonatal mononuclear cells, contrasting starkly with neonatal hyporesponsiveness to TLR ligation due to independence from endosome-mediated IRF3 activation. J Immunol. (2018) 201:1131–43. doi: 10.4049/jimmunol.1700956
68. Sellin Jeffries MK, Kiss AJ, Smith AW, Oris JT. A comparison of commercially-available automated and manual extraction kits for the isolation of total RNA from small tissue samples. BMC Biotechnol. (2014) 14:94. doi: 10.1186/s12896-014-0094-8
Keywords: PBMC, RNA, RT-qPCR, extraction, analytical-sensitivity, diagnostic-sensitivity
Citation: Browne DJ, Brady JL, Waardenberg AJ, Loiseau C and Doolan DL (2020) An Analytically and Diagnostically Sensitive RNA Extraction and RT-qPCR Protocol for Peripheral Blood Mononuclear Cells. Front. Immunol. 11:402. doi: 10.3389/fimmu.2020.00402
Received: 16 November 2019; Accepted: 20 February 2020;
Published: 20 March 2020.
Edited by:
Urszula Krzych, Walter Reed Army Institute of Research, United StatesReviewed by:
Irfan Zaidi, National Institutes of Health (NIH), United StatesAnn M. Moormann, University of Massachusetts Medical School, United States
Copyright © 2020 Browne, Brady, Waardenberg, Loiseau and Doolan. This is an open-access article distributed under the terms of the Creative Commons Attribution License (CC BY). The use, distribution or reproduction in other forums is permitted, provided the original author(s) and the copyright owner(s) are credited and that the original publication in this journal is cited, in accordance with accepted academic practice. No use, distribution or reproduction is permitted which does not comply with these terms.
*Correspondence: Denise L. Doolan, denise.doolan@jcu.edu.au
†These authors have contributed equally to this work and share last authorship