Ratings are overrated!
 Georgios N. Yannakakis
 Héctor P. Martínez
- Institute of Digital Games, University of Malta, Msida, Malta
Are ratings of any use in human–computer interaction and user studies at large? If ratings are of limited use, is there a better alternative for quantitative subjective assessment? Beyond the intrinsic shortcomings of human reporting, there are a number of supplementary limitations and fundamental methodological flaws associated with rating-based questionnaires – i.e., questionnaires that ask participants to rate their level of agreement with a given statement, such as a Likert item. While the effect of these pitfalls has been largely downplayed, recent findings from diverse areas of study question the reliability of using ratings. Rank-based questionnaires – i.e., questionnaires that ask participants to rank two or more options – appear as the evident alternative that not only eliminates the core limitations of ratings but also simplifies the use of sound methodologies that yield more reliable models of the underlying reported construct: user emotion, preference, or opinion. This paper solicits recent findings from various disciplines interlinked with psychometrics and offers a quick guide for the use, processing, and analysis of rank-based questionnaires for the unique advantages they offer. The paper challenges the traditional state-of-practice in human–computer interaction and psychometrics directly contributing toward a paradigm shift in subjective reporting.
Introduction
The key research question within psychometrics and user studies is how to best approximate a user’s notion of a subjective construct, such as an experience, a cognitive state, an emotion, or a preference. Even though the ground truth of a user’s internal state can be manifested via numerous cognitive processes or bodily alterations, it is still far from trivial how to best assess and process those manifestations; entire research areas, such as user experience, user modeling, and affective computing, are long dedicated to this task. Although subjective reporting (first- or third-person) comes with several limitations, such as self-deception and memory-biases, it offers the most direct and popular approach to the annotation of subjective constructs. Thus, quantitative reports via questionnaires provide unique properties for evaluating the capacity of interactive systems (Bardram et al., 2013; Chen et al., 2014) and for constructing computational models of reported user states (Hernandez et al., 2014).
The dominant practice within human–computer interaction (HCI) for quantitatively assessing aspects of a user’s behavior, experience, opinion, or emotion relies on subjective assessment via rating-based questionnaires – see Bardram et al. (2013), Bryan et al. (2014), Chen et al. (2014), Goyal et al. (2014), Hernandez et al. (2014), Mauderer et al. (2014), Schild et al. (2014), and Sonderegger et al. (2014) among many. Indicatively, a thorough analysis of the papers published in the most prestigious HCI conference last year (Proceedings of CHI’14) reveals that the majority of accepted papers use some form of quantitative assessment approach and more than 80% of these rely on rating-based questionnaires. Popular rating-based questionnaires (see Figure 1A for an example) include the Likert-scale (Likert, 1932), the Geneva Wheel model (Scherer, 2005), the Self-Assessment Manikin (Morris, 1995), the Positive and Negative Affect Schedule (Sonderegger et al., 2014), and the Game Experience Questionnaire (IJsselsteijn et al., 2008). The obtained answers are either used as a means to evaluate an interactive system via the experience of its users – see Bryan et al. (2014), Chen et al. (2014), and Mauderer et al. (2014) – or as data for building predictive models of user reports – i.e., user modeling (Martínez et al., 2014; Hernandez et al., 2014). On the other hand, rank-based questionnaires – which ask the participant to rank a preference between two (or among more than two) options – still remain a rarely used instrument of subjective assessment and modeling, even though there is already significant evidence for their advantages over rating-based questionnaires (Yannakakis and Hallam, 2011; Metallinou and Narayanan, 2013; Čopič Pucihar et al., 2014). An example of a rank-based questionnaire (4-alternative forced choice) is illustrated in Figure 1B.
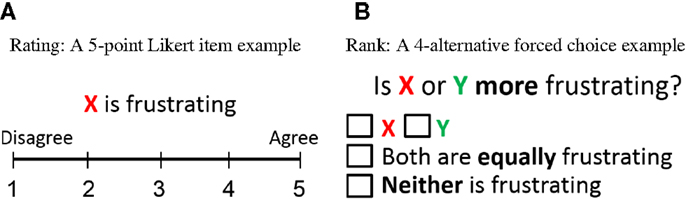
Figure 1. Examples of rating-based (A) vs. rank-based (B) questionnaires.
This paper contributes toward a shift of the current state-of-practice in user experience, HCI, and psychometrics research at large. For that purpose, the paper provides clear evidence that rating-based evaluation (and modeling) is detrimental to psychometrics and HCI research efforts as it points to biased representations of a user’s subjective report. As a result, rating-based instruments are not only of questionable use for the analysis of a subject’s report but also evidently lead to unreliable models of those subjects and their reports.
The paper is novel in that it collectively solicits empirical evidence from various research fields, such as marketing research, applied statistics, affective computing, user modeling, and user experience to draw the multiple advantages of rank-based questionnaires for psychometrics and HCI research. At the same time, it provides a comprehensive guide on the use, processing, and analysis of rank-based questionnaires. Toward that aim, we object the use of ratings for HCI based on a number of fundamental limitations and practice flaws (see next section) and we provide empirical evidence for the advantages of ranks (compared to ratings) with respect to subjectivity, order, and inconsistency effects. Furthermore, we suggest appropriate data processing techniques on how to treat ratings – when those are available – and we introduce an open-source toolbox that supports those techniques.
Ratings: Limitations and Fundamental Flaws
The vast majority of user and psychometric studies have adopted rating questionnaires to capture the opinions, preferences, and perceived experiences of experiment participants – see Bryan et al. (2014), Chen et al. (2014), and Mauderer et al. (2014) among many. The most popular rating-based questionnaire follows the principles of a Likert-scale (Likert, 1932) in which users are asked to specify their level of agreement with (or disagreement against) a given statement. Ratings have been used, for instance, to report the level of comfort and ease of use of new interfaces or devices (Chen et al., 2014; Weigel et al., 2014) or the stress level during a given task – e.g., in Bardram et al. (2013) and Hernandez et al. (2014). Rating-based reporting, however, has notable inherent limitations that are often overlooked, resulting in fundamentally flawed analyses (Jamieson, 2004). This section sheds some light on the most critical of these limitations and flaws.
Inherent Limitation: Inter-Personal Differences
Traditionally, HCI studies analyze ratings by comparing their values across participants – see Goyal et al. (2014) and Mark et al. (2014) among many. This is a generally accepted and dominant practice in the community but it neglects the existence of inter-personal differences on the rating process as the meaning of each level on a rating scale may differ across experiment participants. For example, two participants may assess the exact same level of “ease to use” for a new device but then one rates it as “very easy to use” and the other as “extremely easy to use.” There are numerous factors that contribute to the different internal rating scales existent across participants (Metallinou and Narayanan, 2013), such as differences in personality, culture (Sneddon et al., 2011), temperament, and interests (Viswanathan, 1993). As these factors are documented extensively in the literature, the appropriateness of the dominant HCI state-of-practice is directly questioned.
A large volume of studies have also identified the presence of primacy and recency order effects in rating-based questionnaires e.g., Chan (1991) and Yannakakis and Hallam (2011), seen as systematic biases toward parts of the scale (Linn and Gronlund, 2000) (e.g., right handed participants may tend to use the right side of the scale) or a fixed tendency over time (e.g., on a series of experimental conditions, the last ones are rated higher). Indicatively, the comparative study of Yannakakis and Hallam (2011) between ratings and ranks showcases higher inconsistency effects and significant order (recency) effects existent in ratings across two different datasets, which contain both rank and rating annotations obtained from the same participants. Although these are systematic biases (opposed to personal), they pose additional challenges on the comparison of ratings among participants, as participants are affected to different extents. Even though experiments on quantifying human perception through rating questionnaires have led to interesting findings on the relationship between perception and reporting, biases of the use of ratings as an assessment tool have not been examined (Jay et al., 2007).
Ratings are Not Numbers
In addition to inter-personal differences, a critical limitation arises when ratings are treated as interval values since ratings are by nature ordinal values (Stevens, 1946; Jamieson, 2004). As a result, any method that treats them as numbers (e.g., average values, t-tests, linear models) is fundamentally flawed. In most questionnaires, Likert items are represented as pictures [e.g., different representations of arousal in the Self-Assessment Manikin (Morris, 1995)] or as adjectives (e.g., “moderately,” “fairly,” and “extremely”). These labels (images or adjectives) are often erroneously converted to integer numbers violating basic axioms of statistics, which suggest that ordinal values cannot be treated as interval values (Stevens, 1946) since the underlying numerical scale is unknown. Note that even when a questionnaire features ratings as numbers (e.g., see Figure 1A), the scale is still ordinal as the numbers in the instrument are only labels; thus, the underlying numerical scale is still unknown and dependent on the participant (Stevens, 1946; Langley and Sheppeard, 1985; Ovadia, 2004). Moreover, when treated as numbers, equal ratings are considered of equal value. This is another invalid assumption to make as questionnaires do not always provide sufficient granularity. By treating ratings as ordinal values, this issue is avoided as only the relations among unequal values are considered.
The Non-Linearity of Ratings
Treating ratings as interval values is grounded in the assumption that the difference between consecutive ratings is fixed (i.e., ratings follow a linear scale). However, there is no valid assumption suggesting that a subjective rating scale is linear (Jamieson, 2004). For instance, the difference between “fairly (4)” and “extremely (5)” may be larger than the distance between “moderately (3)” and “fairly (4)” as some experiment participants rarely use the extremes of the scale or tend to use one extreme more than the other (Langley and Sheppeard, 1985). If, instead, ratings are treated naturally as ordinal data no assumptions are made about the distance between rating labels, which eliminates introducing flawed information and data noise to the analysis.
Why Should I Use Ranks Instead?
A rank-based questionnaire scheme asks experiment participants to compare and sort a number of options. On its simplest form, the participants compare two options and specify which one is the preferred under a given statement (pairwise preference). For instance, participants could select which of two devices is easier to use. With more than two options, the participants are asked to provide a ranking of some or all the options. At a remote observation, one may argue that ranks provide less information than ratings as they do not express a quantity explicitly and only provide ordinal relations. As argued in the previous section, however, any additional information obtained by ratings when treated as numbers violates basic axioms of applied statistics. Thus, ratings do not provide data for a richer analysis if appropriately treated as ordinal values.
Being a form of subjective reporting rank-based questionnaires (as much as rating-based questionnaires) is associated with well known limitations, such as memory effects and self-deception. Reporting about subjective constructs, such as experience, preference, or emotion via rank-based questionnaires, however, has recently attracted the interest of researchers in marketing (Dhar and Simonson, 2003), psychology (Brown and Maydeu-Olivares, 2013), user modeling (Yang and Chen, 2011; Baveye et al., 2013), and affective computing (Tognetti et al., 2010; Martínez et al., 2014) among other fields. This gradual paradigm shift is driven by both the reported benefits of ranks minimizing the effects of self-reporting subjectivity and recent findings demonstrating the advantages of ranks over ratings. Inspired by the seminal work of Scheffe (1952) and Agresti (1992) for the analysis of paired comparisons Yannakakis and Hallam (2011) compared data from rating and rank-based questionnaires across a number of domains and identified increased order and inconsistency effects when ratings are used. Evidence from findings by Metallinou and Narayanan (2013) also suggest that rank-based annotation of emotion should be preferred to rating-based annotation for its ability to eliminate annotation biases (cultural, subjective, inconsistency, inter-rater, etc.).
In summary, results across different domains investigating subjective assessment suggest that rank-based reports minimize the assumptions made about experiment participants’ notions of highly subjective constructs, such as experience and emotions, and allow a fair comparison among the answers of different participants. Moreover, artifacts, such as the subjective notion of scaling, are eliminated. Finally, all these advantages also lead to the construction of generalizable and accurate computational models of users or their experience (Martínez et al., 2014).
What if Ratings is all I have?
The core findings from the areas of applied statistics, user modeling, affective computing, machine learning, and marketing research discussed already not only suggest that ranks define a superior instrument for subjective assessment but they also question the very use of ratings at the first place. One could, however, still claim that the use of ratings in some particular experimental protocols is unavoidable. For instance, in experimental protocols, subjects can only be asked to assess their experience on solely one version of an interactive system (e.g., a game, a web-browser).
When faced with such a condition ratings could provide a viable assessment instrument if they are naturally treated as ordinal data. A recent study by Martínez et al. (2014) investigates the effect of using ratings as nominal or ordinal scales when studying the relation between physiological attributes and emotional states. Both approaches are tested on synthetic (testing “in vitro”) and human (testing “in vivo”) ratings. The core findings of the study across all datasets examined provide clear evidence that ratings (when used) should be naturally transformed to ordinal representations (ranks). This practice has clear benefits: any data analysis followed yields more reliable and generalizable outcomes as those better approximate the underlying ground truth of the reported subjective construct. The transformation from ratings to ranks is straightforward. Ratings are compared to one another and a pairwise preference/ranking is created for every pair/tuple; higher ratings take the top positions of the ranking and lower ratings the positions in the bottom of the ranking. Comparisons of ratings from different experiment participants must be avoided. In addition, if the time window between reported ratings is sufficiently large for the examined task (e.g., in the magnitude of hours or more) one can also consider removing particular rating pairs to reduce artifacts connected to participants’ episodic memory.
In general, approaches for analyzing ordinal ratings should rely on non-parametric statistics: from simple statistical explorations via Spearman’s correlation, to significance tests via the Mann–Whitney test and the Wilcoxon signed-rank test for paired samples (Wilcoxon, 1945), to the Kruskal–Wallis (Kruskal and Wallis, 1952) and Friedman’s (Friedman, 1940) tests for three (or more) groups of ranks. Clearly, statistical models, such as artificial neural networks and support vector machines, are also suitable for the analysis of ordinal data (Martínez et al., 2014).
Norman (2010) showed empirically in one dataset that Pearson’s correlation (which treats ratings as intervals) is robust enough when compared against Spearman’s rank correlation (which treats ratings as ordinal values). Such evidence could support the validity of using standard parametric correlation tests that treat ratings as interval values but does not question the very use of ratings due to their inherent limitations. On the contrary, a number of studies have demonstrated the supremacy of ranks in eliminating various forms of reporting biases [e.g., Yannakakis and Hallam (2011)]. Finally, significant improvements have been reported in accuracies of non-linear statistical models when ratings are treated as ordinal values (Martínez et al., 2014).
How to Analyze Ranks
Standard data visualization methods based on averages or SDs are strictly not applicable on ordinal data – obtained directly as ranks or transformed from ratings. Instead, to explore the relationships between ranks and a number of considered factors, a stacked bar chart can be used to visualize how many observations were assigned to each rank for each value of the factor.
For a statistical factor analysis, a common choice is the Wilcoxon signed-rank test (Wilcoxon, 1945), sometimes also used to evaluate the effect of ratings as, for instance, in Mauderer et al. (2014). This is a paired-samples test and, therefore, guarantees that only within-participant ranks are compared, bypassing inter-personal differences. A common alternative is Kendall’s Tau (Kendall, 1938) that can be used to calculate the correlation between the hypothesized order (e.g., device A is easier to use than device B) and the observed ranks – see, e.g., Martínez et al. (2014). The non-parametric Kruskal–Wallis and Friedman’s tests mentioned earlier are also applicable.
Furthermore, if an HCI researcher is interested in using the reported ranks to build computational models that predict those ranks (e.g., constructing models of users) a large palette of algorithms is currently available. Linear statistical models, such as linear discriminant analysis and large margins, and non-linear approaches, such as Gaussian processes, artificial neural networks, and support vector machines, are applicable for learning to predict ranks. These methods are derived from the sub-area of machine learning named preference learning (Fürnkranz and Hüllermeier, 2010). A number of such preference learning methods as well as data preprocessing and feature selection algorithms are currently included in the preference learning toolbox (PLT) (Farrugia et al., 2015). PLT is an open-access, user-friendly, and accessible toolkit1 built and constantly updated for the purpose of easing the processing of (and promoting the use of) ranks.
Summary of Conclusions
This paper directly objects to the use and analysis of subjective assessment via ratings within quantitative user studies, HCI and psychometrics research contributing to a shift from the dominant state of practice in those fields. Beyond any well-reported limitations of subjective reporting (e.g., memory effects, self-deception) ratings come with inherited limitations as an instrument of reporting. These are derived from inter-personal differences and include, among many, high-inconsistency effects and subjectivity of scaling. Those effects question the very use of ratings for obtaining valid data for any further analysis. Most importantly, the traditional analysis of ratings within HCI and psychometrics – i.e., deriving statistical properties from ratings, such as average and variance values – violates two fundamental assumptions. The first common flaw is the violation of the assumption that ratings are ordinal data. The second assumption violated is that ratings evidently are not linear (even if they could be represented as numbers). In response to the above mathematical violations, in principle, ratings should not be converted to numerical scales and analyzed as numbers.
Rank-based questionnaires are the alternative instrument for subjective quantitative assessment proposed in this paper. Recent findings from a number of fields including applied statistics, affective computing, user modeling, and machine learning provide clear evidence for the supremacy of ranks, when compared to ratings, on minimizing subjectivity biases as well as order, inter-rater, and inconsistency effects (Yannakakis and Hallam, 2011; Metallinou and Narayanan, 2013). More so, recent evidence suggests that we can construct more accurate and reliable statistical models of reported ratings – that better approximate the underlying ground truth of the subjective construct we attempt to measure – only when ratings are naturally treated as ordinal data (Martínez et al., 2014).
Given the supremacy or rank-based subjective assessment for both evaluating interactive systems (through the experience of their users) and as the ground truth for deriving computational models of subjective reports, this paper serves as a guide for both rank-based evaluation and rank-based computational modeling. For the former, it provides methods for the conversion of ratings to ranks – when ratings are available – and an overview of statistical processes for rank reports. For the latter, it proposes preference learning methods and algorithms – incorporated to an open-source, accessible toolbox – for the construction of predictive models of ranks.
It is important to stress that this paper did not intend to present yet another case study to further prove empirically the advantages of ranks over ratings or demonstrate the general flaws of processing ratings. Our claims are not based on the popularity of ranks in other fields outside HCI, but on empirical findings as surveyed in the paper. While the limitations of ratings and ranks have been identified and discussed extensively, no other study within the HCI community both solicits evidence for the comparative advantages of ranks (as demonstrated in other fields) and offers a short guidebook on how to process ranks statistically. We hope that this paper highlights the obvious fundamental issues of ratings as a subjective assessment tool and introduces ranks as the alternative reporting approach toward altering a dominant, yet falsified, community practice.
Conflict of Interest Statement
The authors declare that the research was conducted in the absence of any commercial or financial relationships that could be construed as a potential conflict of interest.
Acknowledgments
The work is supported, in part, by the EU-funded FP7 ICT ILearnRW project (project no: 318803).
Footnote
References
Agresti, A. (1992). Analysis of ordinal paired comparison data. J. R. Stat. Soc. Ser. C Appl. Stat. 41, 287–297.
Bardram, J. E., Frost, M., Szántó, K., Faurholt-Jepsen, M., Vinberg, M., and Kessing, L. V. (2013). Designing mobile health technology for bipolar disorder: a field trial of the monarca system. Proc. SIGCHI Conf. Hum. Factor. Comput. Syst. 2627–2636. doi: 10.1145/2470654.2481364
Baveye, Y., Bettinelli, J. N., Dellandrea, E., Chen, L., and Chamaret, C. (2013). A large video database for computational models of induced emotion. Proc. of Affect. Comput. Intell. Int. 13–18. doi:10.1109/ACII.2013.9
Brown, A., and Maydeu-Olivares, A. (2013). How irt can solve problems of ipsative data in forced-choice questionnaires. Psychol. Methods 18, 36. doi:10.1037/a0030641
Bryan, N. J., Mysore, G. J., and Wang, G. (2014). Isse: an interactive source separation editor. Proc. SIGCHI Conf. Hum. Factor. Comput. Syst. 257–266. doi:10.1145/2556288.2557253
Chan, J. C. (1991). Response-order effects in Likert-type scales. Educ. Psychol. Meas. 51, 531–540. doi:10.1177/0013164491513002
Chen, X. A., Grossman, T., Wigdor, D. J., and Fitzmaurice, G. (2014). Duet: exploring joint interactions on a smart phone and a smart watch. Proc. SIGCHI Conf. Hum. Factor. Comput. Syst. 159–168. doi:10.1145/2556288.2556955
Čopič Pucihar, K., Coulton, P., and Alexander, J. (2014). The use of surrounding visual context in handheld ar: device vs. user perspective rendering. Proc. SIGCHI Conf. Hum. Factor. Comput. Syst. 197–206. doi:10.1145/2556288.2557125
Dhar, R., and Simonson, I. (2003). The effect of forced choice on choice. J. Market. Res. 40, 146–160. doi:10.1509/jmkr.40.2.146.19229
Farrugia, V. E., Martínez, H. P., and Yannakakis, G. N. (2015). The preference learning toolbox. [arXiv:1506.01709].
Friedman, M. (1940). A comparison of alternative tests of significance for the problem of m rankings. Ann. Math. Stat. 11, 86–92. doi:10.1214/aoms/1177731944
Goyal, N., Leshed, G., Cosley, D., and Fussell, S. R. (2014). Effects of implicit sharing in collaborative analysis. Proc. SIGCHI Conf. Hum. Factor. Comput. Syst. 129–138. doi:10.1145/2556288.2557229
Hernandez, J., Paredes, P., Roseway, A., and Czerwinski, M. (2014). Under pressure: sensing stress of computer users. Proc. SIGCHI Conf. Hum. Factor. Comput. Syst. 51–60. doi:10.1145/2556288.2557165
IJsselsteijn, W., Poels, K., and De Kort, Y. (2008). The Game Experience Questionnaire: Development of a Self-Report Measure to Assess Player Experiences of Digital Games. Eindhoven: TU Eindhoven.
Jamieson, S. (2004). Likert scales: how to (ab) use them. Med. Educ. 38, 1217–1218. doi:10.1111/j.1365-2929.2004.02012.x
Jay, C., Glencross, M., and Hubbold, R. (2007). Modeling the effects of delayed haptic and visual feedback in a collaborative virtual environment. ACM Trans. Comput. Hum. Interact. 14, 1275514. doi:10.1145/1275511
Kendall, M. G. (1938). A new measure of rank correlation. Biometrika 81–93. doi:10.1093/biomet/30.1-2.81
Kruskal, W. H., and Wallis, W. A. (1952). Use of ranks in one-criterion variance analysis. J. Am. Stat. Assoc. 47, 583–621. doi:10.1080/01621459.1952.10483441
Langley, G., and Sheppeard, H. (1985). The visual analogue scale: its use in pain measurement. Rheumatol. Int. 5, 145–148. doi:10.1007/BF00541514
Linn, R., and Gronlund, N. (2000). Measurement and Assessment in Teaching. Upper Saddle River, NJ: Prentice-Hall.
Mark, G., Wang, Y., and Niiya, M. (2014). Stress and multitasking in everyday college life: an empirical study of online activity. Proc. SIGCHI Conf. Hum. Factor. Comput. Syst. 41–50. doi:10.1145/2556288.2557361
Martínez, H. P., Yannakakis, G. N., and Hallam, J. (2014). Don’t classify ratings of affect; rank them! IEEE Trans. Affect. Comput. 5, 314–326. doi:10.1109/TAFFC.2014.2352268
Mauderer, M., Conte, S., Nacenta, M. A., and Vishwanath, D. (2014). Depth perception with gaze-contingent depth of field. Proc. SIGCHI Conf. Hum. Factor. Comput. Syst. 217–226. doi:10.1145/2556288.2557089
Metallinou, A., and Narayanan, S. (2013). “Annotation and processing of continuous emotional attributes: challenges and opportunities,” in Automatic Face and Gesture Recognition (FG), 2013 10th IEEE International Conference and Workshops on (Shanghai: IEEE), 1–8.
Morris, J. (1995). Observations: sam: the self-assessment Manikinan efficient cross-cultural measurement of emotional response. J. Advert. Res. 35, 63–68.
Norman, G. (2010). Likert scales, levels of measurement and the laws of statistics. Adv. Health Sci. Educ. 15, 625–632. doi:10.1007/s10459-010-9222-y
Ovadia, S. (2004). Ratings and rankings: reconsidering the structure of values and their measurement. Int. J. Soc. Res. Method. 7, 403–414. doi:10.1080/1364557032000081654
Scheffe, H. (1952). An analysis of variance for paired comparisons. J. Am. Stat. Assoc. 47, 381–400. doi:10.2307/2281310
Scherer, K. (2005). What are emotions? and how can they be measured? Soc. Sci. Inform. 44, 695–729. doi:10.1177/0539018405058216
Schild, J., La Viola, J. J. Jr., and Masuch, M. (2014). Altering gameplay behavior using stereoscopic 3d vision-based video game design. Proc. SIGCHI Conf. Hum. Factor. Comput. Syst. 207–216. doi:10.1145/2556288.2557283
Sneddon, I., McKeown, G., McRorie, M., and Vukicevic, T. (2011). Cross-cultural patterns in dynamic ratings of positive and negative natural emotional behaviour. PLoS ONE 6:e14679. doi:10.1371/journal.pone.0014679
Sonderegger, A., Uebelbacher, A., Pugliese, M., and Sauer, J. (2014). “The influence of aesthetics in usability testing: the case of dual-domain products,” in Proceedings of the SIGCHI Conference on Human Factors in Computing Systems (New York, NY: ACM), 21–30.
Stevens, S. S. (1946). On the theory of scales of measurement. Science 103, 677–680. doi:10.1126/science.103.2684.677
Tognetti, S., Garbarino, M., Bonarini, A., and Matteucci, M. (2010). “Modeling enjoyment preference from physiological responses in a car racing game,” Computational Intelligence and Games (CIG), 2010 IEEE Symposium on (Copenhagen: IEEE), 321–328.
Viswanathan, M. (1993). Measurement of individual differences in preference for numerical information. J. Appl. Psychol. 78, 741–752. doi:10.1037/0021-9010.78.5.741
Weigel, M., Mehta, V., and Steimle, J. (2014). More than touch: understanding how people use skin as an input surface for mobile computing. Proc. SIGCHI Conf. Hum. Factor. Comput. Syst. 179–188. doi:10.1145/2556288.2557239
Wilcoxon, F. (1945). Individual comparisons by ranking methods. Biometrics Bull. 80–83. doi:10.2307/3001968
Yang, Y. H., and Chen, H. H. (2011). Ranking-based emotion recognition for music organization and retrieval. IEEE Trans. Audio Speech Lang. Process. 19, 762–774. doi:10.1109/TASL.2010.2064164
Keywords: ratings, Likert-scale, ranks, psychometrics, subjective reporting, questionnaires
Citation: Yannakakis GN and Martínez HP (2015) Ratings are overrated! Front. ICT 2:13. doi: 10.3389/fict.2015.00013
Received: 01 April 2015; Accepted: 09 July 2015;
Published: 30 July 2015
Edited by:
Javier Jaen, Universitat Politecnica de Valencia, SpainReviewed by:
Andreas Duenser, Commonwealth Scientific and Industrial Research Organisation, AustraliaEran Toch, Tel Aviv University, Israel
Donald Glowinski, University of Geneva, Switzerland
Copyright: © 2015 Yannakakis and Martínez. This is an open-access article distributed under the terms of the Creative Commons Attribution License (CC BY). The use, distribution or reproduction in other forums is permitted, provided the original author(s) or licensor are credited and that the original publication in this journal is cited, in accordance with accepted academic practice. No use, distribution or reproduction is permitted which does not comply with these terms.
*Correspondence: Georgios N. Yannakakis, Institute of Digital Games, University of Malta, Msida 2080, Malta, georgios.yannakakis@um.edu.mt