 Fazhan Li1,2#
 Huijuan Wen1,2#
 Ihtisham Bukhari1#
 Bin Liu1,2
 Chenxu Guo1,2FeiFei Ren1,2Youcai Tang3
 Yang Mi1,2,4*Pengyuan Zheng1,2,4*
- 1Henan Key Laboratory of Helicobacter Pylori, Microbiota and Gastrointestinal Cancer, Marshall Medical Research Center, The Fifth Affiliated Hospital of Zhengzhou University, Zhengzhou, China
- 2Academy of Medical Science, Zhengzhou University, Zhengzhou, China
- 3Department of Pediatrics, The Fifth Affiliated Hospital of Zhengzhou University, Zhengzhou, China
- 4Department of Gastroenterology, The Fifth Affiliated Hospital of Zhengzhou University, Zhengzhou, China
Gastric cancer (GC) is a highly fatal and common malignancy of the digestive system. Recent therapeutic advancements have significantly improved the clinical outcomes in GC, but due to the unavailability of suitable molecular targets, a large number of patients do not respond to the immune checkpoint inhibitors (ICI) therapy. To identify and validate potential therapeutic and prognostic targets of gastric cancer, we used the “inferCNV” R package for analyzing single-cell sequencing data (GSE112302) of GC and normal epithelial cells. First, by using LASSO, we screened genes that were highly correlated with copy number variations (CNVs). Therefrom, five gene signature (CPVL, DDC, GRTP1, ONECUT2, and PRSS21) was selected by cross-validating the prognosis and risk management with the GC RNA-seq data obtained from GEO and TCGA. Moreover, the correlation analyses between CNVs of these genes and immune cell infiltration in gastric cancer identified CPVL as a potential prognostic marker. Finally, CPVL showed high expression in gastric cancer samples and cell lines, then siRNA-mediated silencing of CPVL expression in gastric cancer cells showed significant proliferation arrest in MGC803 cells. Here, we conclude that CNVs are key regulators of the immune cells infiltration in gastric TME as well as cancer development, and CPVL could potentially be used as a prognostic and therapeutic marker in gastric cancer.
Introduction
Gastric cancer is categorized as the fourth most common and third cause of cancer-related mortality worldwide (Bray et al., 2018). In recent years, the survival rate in many cancers has been improved due to the application of neoadjuvant chemotherapy, but in GC it is still worst because of its diagnosis at advanced stages, drug resistance, recurrence (Pernot et al., 2015; Ilson, 2017; Zurleni et al., 2018), high tumor heterogeneity, and poor immune cell infiltration in TME, which seriously hinder the prognosis and therapeutic outcomes (Meacham and Morrison, 2013; Weinberg, 2014; Van Cutsem et al., 2016). Therefore, it is crucial to thoroughly explore the heterogeneity of the GC, the mechanism of immune cell infiltration, and the new therapeutic targets for gastric cancer.
Currently, transcriptomic analyses revealed a variety of biomarkers that provide a base to determine the complexity and heterogeneity of tumors and identify new therapeutic targets (Cieslik and Chinnaiyan, 2018). The large-scale copy number variations (CNVs) through single-cell RNA-seq (scRNA-seq) have distinguished malignant cells from the normal cells (Patel et al., 2014; Müller et al., 2016; Tirosh et al., 2016). In general, the CNVs may regulate the function of somatic cells thus it is useful to use as the potential tumorigenesis markers (Beroukhim et al., 2010) and may affect immunotherapy (Kacew et al., 2019). On the other hand, the regulation of immune cell infiltration in TME plays an important role in the occurrence, progression, therapeutics and prognosis of cancers including GC (Siegel et al., 2017; Waniczek et al., 2017). However, the role of CNVs in immune cell infiltration and tumor development specifically in gastric cancer is not well illustrated.
Certainly, the scRNA-seq is an effective method for analyzing the heterogeneity of the complex biological systems such as TME (Chung et al., 2017; Cochain et al., 2018). Therefore, we quantified CNVs from scRNA-seq data of the gastric cancer and surrounding normal tissues to differentiate malignant cells from the normal epithelial cells. The differentially expressed genes (DEGs) in GC tissues were screened by the least absolute shrinkage and selection operator (LASSO) Cox regression model (McEligot et al., 2020). The expression of the hub genes and their CNVs in gastric cancer were further assessed for their relationship with immune cell infiltration and prognosis in the gastric tumor. Lastly, we determined the expression of levels of all hub genes in gastric cancer tissues and cell lines, then based on the expression pattern of the genes we selected CPVL to explore its role in cellular proliferation in gastric cancer cell lines.
Methods and Materials
Data Mining and Processing
The scRNA-seq data of a total of 707 tumors and paired normal cells (GSE112302), and RNA-seq data (GSE84437) of 357 gastric cancer tissues were downloaded from Gene Expression Omnibus (GEO: https://www.ncbi.nlm.nih.gov/geo/) database. The transcriptome sequencing data of 407 individuals (32 normal and 375 gastric cancer tissue samples) along with complete clinical information were downloaded from The Cancer Genome Atlas (TCGA: https://portal.gdc.cancer.gov/). The complete study design and sample information are shown in Figure 1. The Seurat (Loraine et al., 2015) in RStudio (Stuart et al., 2019) was used to filter and standardize the tumor samples (355 tumor cells in total) in GSE112302 single-cell sequencing data. Genes expressed in less than three samples, and mitochondrial (MT) genes expressing >5% samples were filtered out. Principal component analysis (PCA) and tSNE were used for the dimensional reduction (Satija et al., 2015), and different cells’ clusters were identified and annotated according to the marker genes (resolution = 0.5). The raw data of GSE84437 and the gastric cancer data from TCGA were standardized using the “limma” package (Smyth et al., 2005).
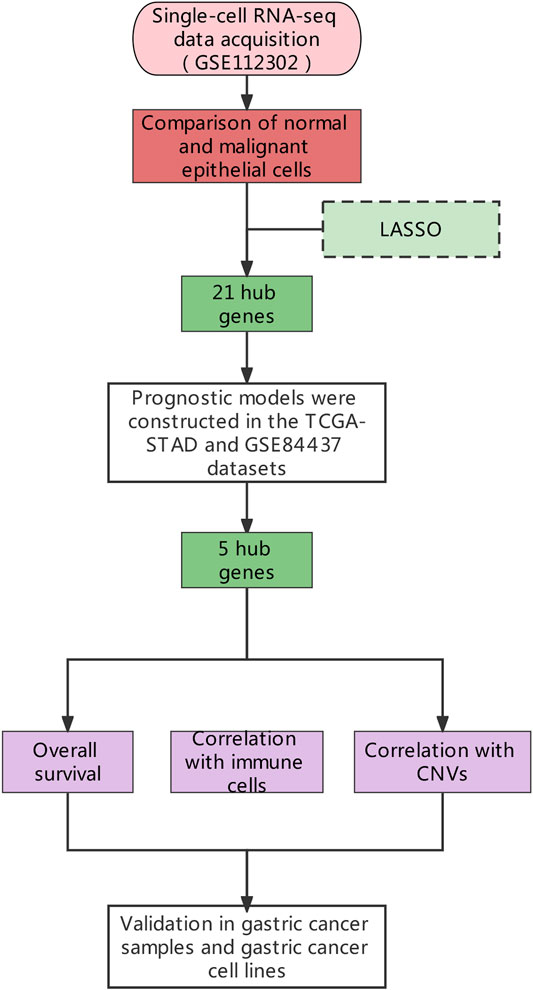
FIGURE 1. The general research design.
Epithelial Cell Reanalysis
The CNVs in macrophages (n = 23) and epithelium (n = 332) were evaluated by “infercnv” R package (Patel et al., 2014). The genomic locations of the differential genes with a high rate of copy number variations (CNVs) were determined and compared their average expression level with their relative expression. The “limma” package was used to find the differentially expressed genes among tumor epithelial cells with high and low CNVs (|log FC|> 2, p < 0.05).
LASSO Regression Analysis
We constructed a prediction model based on the CNV scores of five signature genes by performing a LASSO regression analysis using the “glmnet” package in R. LASSO regression was applied to the module(s) with p-value of cnv-scores less than 0.05 to determine the signature gene, and the analyses were repeated 1,000 times to cross-validate and to select the best lambda value of the hub gene.
Construction of the Prognostic Model
The risk scores of the potential genes from both TCGA transcriptome and GSE84437 data of gastric cancer were calculated by the formula Risk score = βgene1 × exprgene1 + βgene2 × exprgene2 + · ···· + βgene n × exprgene n. By considering the median risk score as a critical value, the samples were divided into high-risk groups and low-risk groups. Overall survival was determined by using R packages “survival” and “survminer” while R package “survival ROC” was used to draw the receiver operating characteristic curve (ROC), and Area Under Curve (AUC) to show the accuracy of the prognostic model. Single-factor COX analysis and multi-factor COX analysis were used to analyze the relationship between risk scores and clinical characteristics. R packages “rms” were used to build a nomogram model to estimate the factors related to overall survival and to calculate the risk scores. The sum of risk scores was used to predict 3-years and 5-years survival rates.
Immune Relevance of Hub Genes
Kaplan-Meier plotter (http://kmplot.com/analysis/) is an online database for analyzing the survival rate of mRNA or miRNA in various cancers. Using this, we obtained the survival curve of the hub genes in gastric cancer, and their correlation with the infiltration of the immune cells (neutrophils, macrophages, dendritic cells, B cells, and CD4/CD8 T cells) in the tumor microenvironment was analyzed by TIMER (https://cistrome.shinyapps.io/timer/) (Li et al., 2017). The expression levels of the hub genes were also analyzed in the pan-cancer to find the difference between normal tissues and various cancers. The differences in the genes’ expression and the relationship of hub genes with immune cell infiltration and immune checkpoints (PDCD1, CD274, PDCD1LG2, and CTLA4) were also determined.
Gastric Cancer Tissue Sampling, RNA Extraction and Q-RT-PCR Analyses
A total of seven gastric cancer tissue and adjacent normal tissue samples were obtained from patients undergoing partial gastrectomy at the Fifth Affiliated Hospital of Zhengzhou University. Informed written consent was obtained from all patients before recruitment into the study, and all sampling and experimental procedures were approved by the ethics committee of the fifth affiliated hospital of Zhengzhou University. Fresh tissues were washed thrice with PBS, crushed and treated with TRIzol (Invitrogen, Carlsbad, United States) for RNA extraction. The cDNA samples were prepared by using the Rever Tra Ace qPCR RT Kit (Osaka, Japan) and mRNA expression was performed using SYBR Premix Ex Taq (Tokyo, Japan) and specially designed primers (Table 1). GAPDH was used as internal control and the relative transcriptional expression level was calculated according to the 2^∆Ct approach.

TABLE 1. List of the primers used in the study.
Correlation of CPVL With Immune and Matrix Scores
The “Estimate” package was used to evaluate the immune score and matrix score in pan-cancer. The correlation between CPVL, immune, and matrix scores was calculated by spearman text and the “ggplot2” package was used to draw scatter plots.
siRNA-Mediated Gene Knockdown
The siRNA targeting CPVL and scrambled negative control siRNA were provided by Shanghai GenePharma (Shanghai, China), the sequences of siRNA are listed in Table 1. The MGC803 cells were transfected with siRNA using Lipofectamine 2000 (Invitrogen, Carlsbad, CA, United States) at a final concentration of 80 nM. The efficiency of siRNA knockdown was subsequently confirmed using qPCR.
Cell Proliferation Assay
Cell Counting Kit-8 (DOJINDO, Kumamoto, Japan) was used according to the manufacturer’s instructions. After 24–48 h of transfecting cells with siRNA-CPVL, ∼5,000 cells were seeded into each well of the 96-well plate, followed by adding 10 μL of CCK-8 reagent to each well after 24 h and incubating at 37°C for 2 h, then measuring absorbance at 450 nm (ELx800, Bio-Tek, United States). Starting from siRNA transfection to the proliferation test, all experiments were repeated thrice.
The Prediction of CPVL Related miRNA and Upstream lncRNA
The StarBase (http://starbase.sysu.edu.cn/) is an online database for studying correlation and predicting the regulatory relationships between mRNA, miRNA, and lncRNA in tumors (Li et al., 2014). First, we predicted the candidate miRNAs associated with CPVL by taking |R|> 0.1 and p-value <0.05 as a baseline, however, miRNAs showing higher significance were chosen and validated by qPCR in gastric cancer tissues and cell lines.
Statistical Analysis
R package “Seurat” and “infercnv” were used to perform quality control on single-cell sequencing data, and to filter and calculate cell cnv-scores. The expression levels of genes in transcriptome data were normalized by log2 transformation. COX regression analysis was used to establish the relationship between gene expression and risk score, R package “survival ROC” for survival prediction models, and the “rms” package was used to build nomogram models. The “Estimate” package was used to evaluate the immune score and matrix score of pan-cancer, and the Spearman test was used to calculate the correlation between CPVL and the immune score and matrix score. p < 0.05 was considered as significant.
The experimental data were statistically analyzed and plotted by GraphPad 8.0 software, and other measurement data were described by means ± standard deviation, all using the student t-test.
Results
CNV and Related Genes Within the Tumor Cell Through scRNA-Seq Analyses
First of all, the quality checks were performed for the scRNA-seq GSE112302 dataset (Supplementary Figures S1A,C), and selected the top 1,500 genes fulfilling our basic selection criteria (Supplementary Figure S1B). For 355 tumor cells, we performed principal component analysis (PCA) and clustered the cells using graph-based clustering (n = 20) (Supplementary Figures S1D–G). Furthermore, we annotated the cells including epithelial cells and macrophages showing marker genes (Figures 2A,B). It has been known that the transformation of normal cells to cancer cells is closely related to large-scale chromosomal aberrations (Beroukhim et al., 2010). Therefore, the CNVs in different genes were analyzed to differentiate between normal epithelial cells and cancer cells, and we found that cluster2 and cluster3 have comparatively low CNVs than other clusters 0, 1 and 4 (Figure 2C). Furthermore, we analyzed the differences between the tumor cells expressing high and low CNVs, showing a large number of differential genes in both groups (Figures 2D,E). These results indicate that CNVs are one of the key contributors to GC heterogeneity.
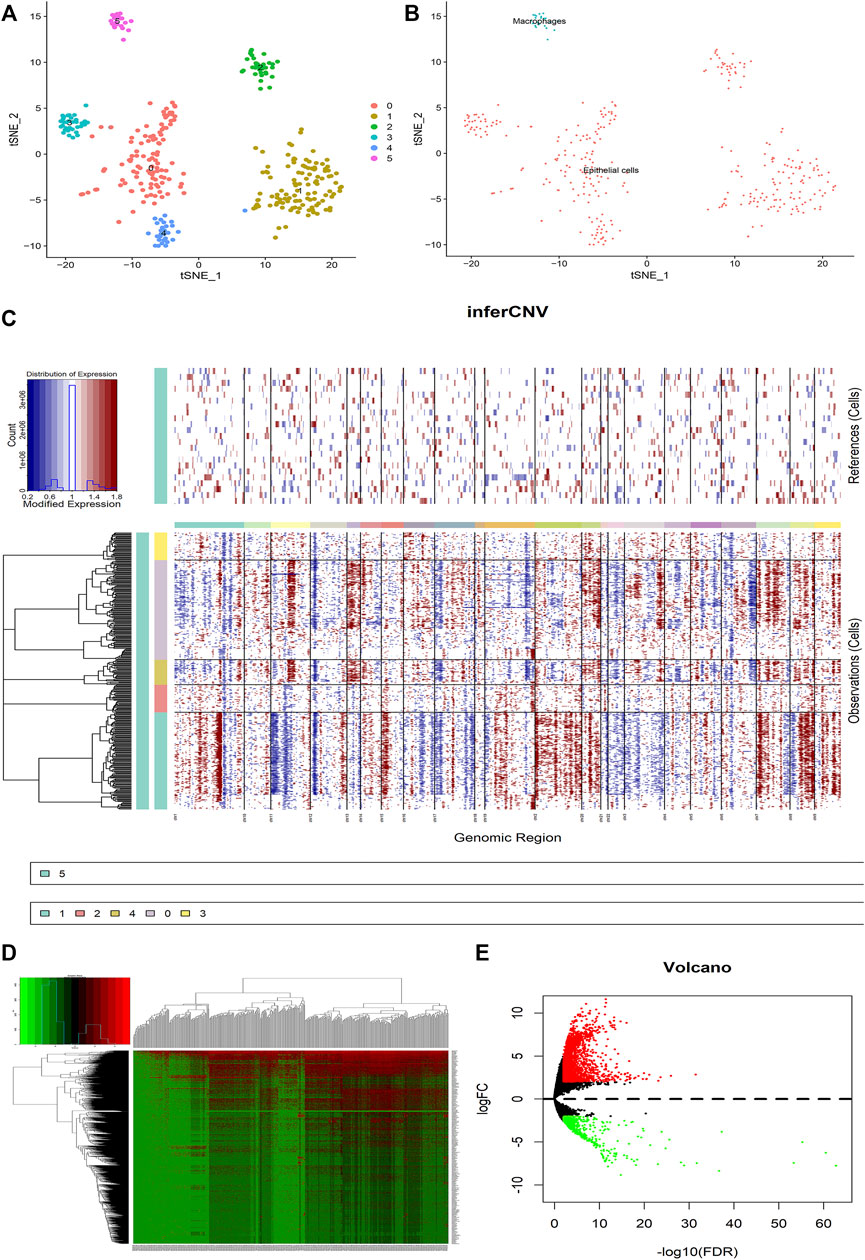
FIGURE 2. Analysis of the difference between malignant cells and normal epithelial cells in GC tumors. (A) The tumor cells are clustered into six clusters including 0–5, clusters 0–4 are annotated as epithelial cells, and cluster 5 is annotated as macrophages. (B) The cells are divided into epithelial cells and macrophages. (C) CNV heat map of other epithelial cells with cluster 5 macrophages as a control. (D,E) Heat map and volcano map for differential analysis. Red represents upregulation and green downregulation, |logFC|>2, p < 0.05.
LASSO Regression Analysis
Furthermore, we performed the LASSO regression analysis for the differential genes (Figures 3A,B), and obtained 21 genes as potential hub genes (LRMP, SDR42E1, ERICH5, NPPC, KCNJ3, CNTNAP2, LINC00346, CPVL, UNC93A, ONECUT2, MAGEA6, SLC19A3, DDC, VGF, LINC00392, AQP2, PRSS21, ETV4, F12, RAP2A, and GRTP1), suggesting a strong functional association of these genes with tumor epithelial cells.
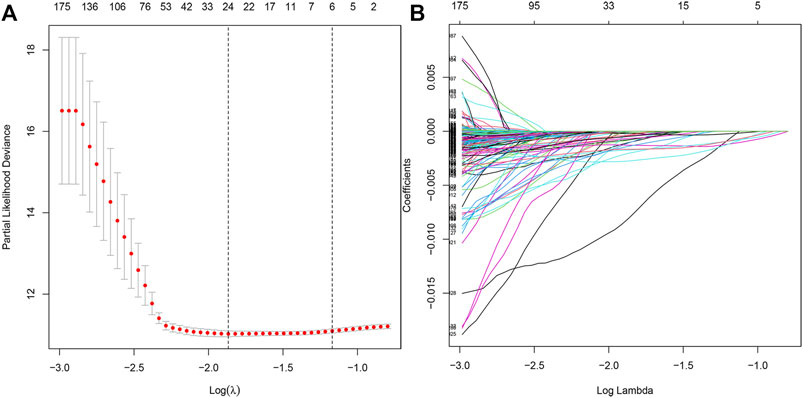
FIGURE 3. LASSO regression analysis model construction. (A) LASSO coefficient distribution of differentially expressed genes. (B) Partial likelihood bias of the LASSO coefficient distribution.
Hub Genes Correlated With CNV and Prognosis
To find out the role of hub genes in the overall survival of gastric cancer we performed a multivariate Cox regression analysis, among 21 hub genes, the eight genes (KCNJ3, CPVL, ONECUT2, SLC19A3, DDC, PRSS21, F12, and GRTP1) were designated as independent indicators of poor prognosis. Based on these findings we constructed a prediction model for the clinical prognosis of GC patients and validated it by the ROC curve [0.625 as an area under the curve (AUC)] (Figures 4A,B). Next, the survival information of hub genes and clinical features of the patients were combined to construct the nomogram (Figure 4C). The total score of each prognostic factor was represented as 1, 3, and 5-years survival rates of the patients. To find out whether the risk signatures were independent predictors of prognosis, the Cox univariate analysis was performed showing that the age (p = 0.033), stage (p = 0.002), N stage (p = 0.022), and risk score (p < 0.001) were significantly linked with OS. While in Cox multivariate analysis only age (p < 0.001) and risk score (p < 0.001) were significantly linked with OS (Figures 4D,E).
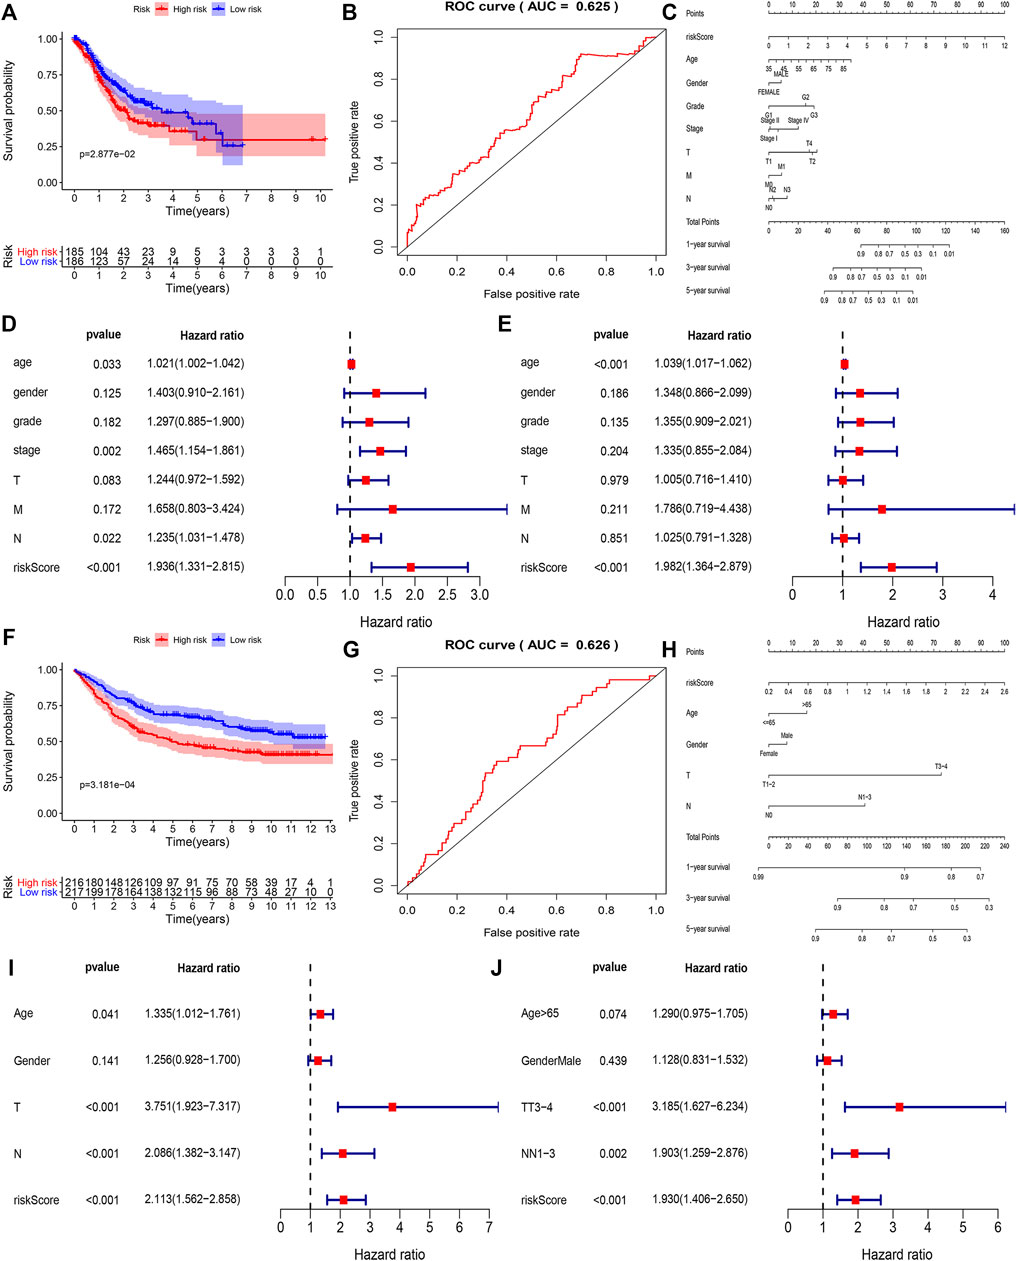
FIGURE 4. The correlation between the construction of the prognostic model and the clinical characteristics of the selected genes in the TCGA and GEO databases. (A,B) Based on COX regression analysis to screen out high-risk genes in TCGA, ROC curve showing accuracy (AUC = 0.625) of the clinical prognosis model. (C) Nomogram of TCGA risk score and clinical characteristics of gastric cancer patients. Each factor corresponds to its score, and each score is added to obtain a total score. (D,E) Single-factor COX regression analysis and multi-factor COX regression analysis of TCGA risk score. (F,G) Based on COX regression analysis a clinical prognostic model was constructed, and the ROC curve is used to detect the accuracy of the model (AUC = 0.625). (H) Nomogram of GSE84437 risk score and clinical characteristics of patients with gastric cancer. (I,J) Univariate Cox regression analysis and multivariate COX regression analysis of GEO risk score.
Using the GSE84437 dataset, we identified five genes (CPVL, ONECUT2, DDC, PRSS21, and GRTP1) as independent indicators of poor prognosis. Based on that we constructed and validated a prediction model for clinical prognosis, ROC curve (AUC = 0.626) (Figures 4F,G), and the relationship between multiple factors and survival rate was analyzed by nomogram (Figure 4H). The single factor analysis in GSE84437 showed that age (p = 0.041), T stage (p < 0.001), N stage (p < 0.001), and risk score (p < 0.001) were significantly associated with OS. However, the Cox multivariate analysis showed a significant association between the T3-4 stage (p < 0.001), N1-3 stage (p = 0.002), and risk score (p < 0.001) with OS (Figures 4I,J). A venn diagram was drawn for these five survival-related genes (Supplementary Figure S2A), expressed in all cell clusters (Supplementary Figure S2B). Next, we plotted the relationship between the top five hub genes and survival in gastric cancer on the Kaplan-Meier plotter (http://kmplot.com/analysis/) (Figure 5A) showing a significant correlation between low expression of CPVL, ONECUT2, and PRSS21 with prolonged survival of the patients. On the other hand, the low expression of GRTP1 showed an association with poor prognosis, and the expression of DDC did not affect the prognosis of GC patients.

FIGURE 5. The survival curve of the Hub gene and its relationship with immune cell infiltration. (A) The survival curve of CPVL, ONECUT2, DDC, PRSS21, and GRTP1 in patients with gastric cancer. (B–F) The correlation of CPVL, ONECUT2, DDC, PRSS21, and GRTP1 with neutrophils, macrophages, dendritic cells, B cells, and CD4/CD8 T cells in gastric cancer immune infiltration.
Correlation Between Hub Genes and Immune Cells Infiltration
The copy number variations are one of the well-known factors affecting the infiltration of immune cells in tumor microenvironment (Campos-Carrillo et al., 2020). Therefore, we studied the correlation between five hub genes and the infiltration of immune cells such as neutrophils, macrophages, dendritic cells, B cells and CD4/CD8 T cells in GC TME. Among all genes, CPVL and GRTP1 showed a significant positive and negative correlation with immune cell infiltration, respectively. Other genes did not affect the infiltration of immune cells in GC TME (Figures 5B–F).
PD1/PD-L1 and CTLA-4 are important immune checkpoints for tumor immune escape, playing significant roles in tumor immunotherapy (Guo et al., 2021). Among hub genes, only CPVL was found to have a positive and ONECUT2 negative correlation with the immune checkpoints (Supplementary Figure S3).
The Relationship Between Hub Genes, Copy Number Variation and Immune Cell Infiltration
Next, we explored the correlation between the expression of the genes and their CNVs with immune cell infiltration in gastric TME. For this purpose, we analyzed the somatic mutations of the hub genes through TIMER [deep deletion (-2), arm-level deletion (-1), diploid/normal (0), arm-level gain (1), and high amplification (2)] and the infiltration of the multiple immune cells. Interestingly, we observed that the copy number variations (CNVs) in hub genes significantly affect the infiltration of immune cells (Figures 6A–E). Apart from DDC, all other genes including CPVL, ONECUT2, PRSS21, and GRTP1 positively regulate the infiltration of the immune cells. These findings revealed that CNVs are also major players in the immune regulation of the gastric cancer TME.
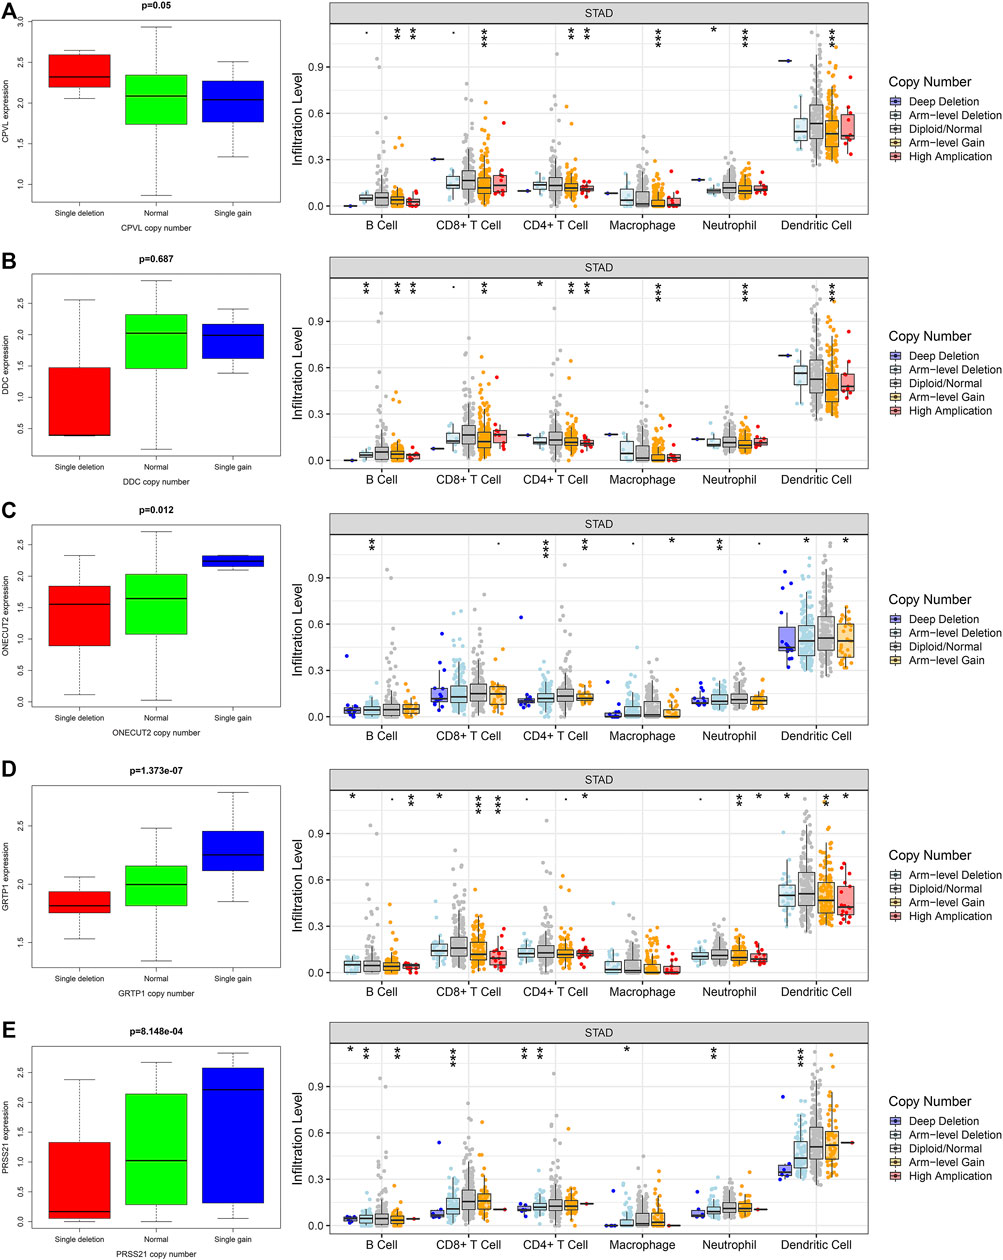
FIGURE 6. The relationship between the hub genes, CNVs and level of immune infiltration in gastric cancer. The expression and CNVs of (A) CPVL, (B) ONECUT2, (C) DDC, (D) PRSS21 and (E) GRTP1 showed association with the immune cell infiltration in gastric cancer. *p <0.05, **p <0.01, ***p <0.001.
Effect of CPVL on Proliferation of Gastric Cancer Cells
We performed the expression of five hub genes in gastric cancers and normal tissue samples which showed significantly high expression of CPVL in cancer samples, and cell lines (Figures 7A–C) which was consistent with the RNA sequences obtained from TCGA. To further explore the role of CPVL in gastric cancer, two different siRNAs were used to silence the expression of CPVL in MGC803 cells (Figure 7D). Subsequently, we examined the effect of the CPVL-knockdown on the proliferation of MGC803 cells. The results showed a significant reduction in the proliferation of MGC803 cells after silencing CPVL (Figure 7E).
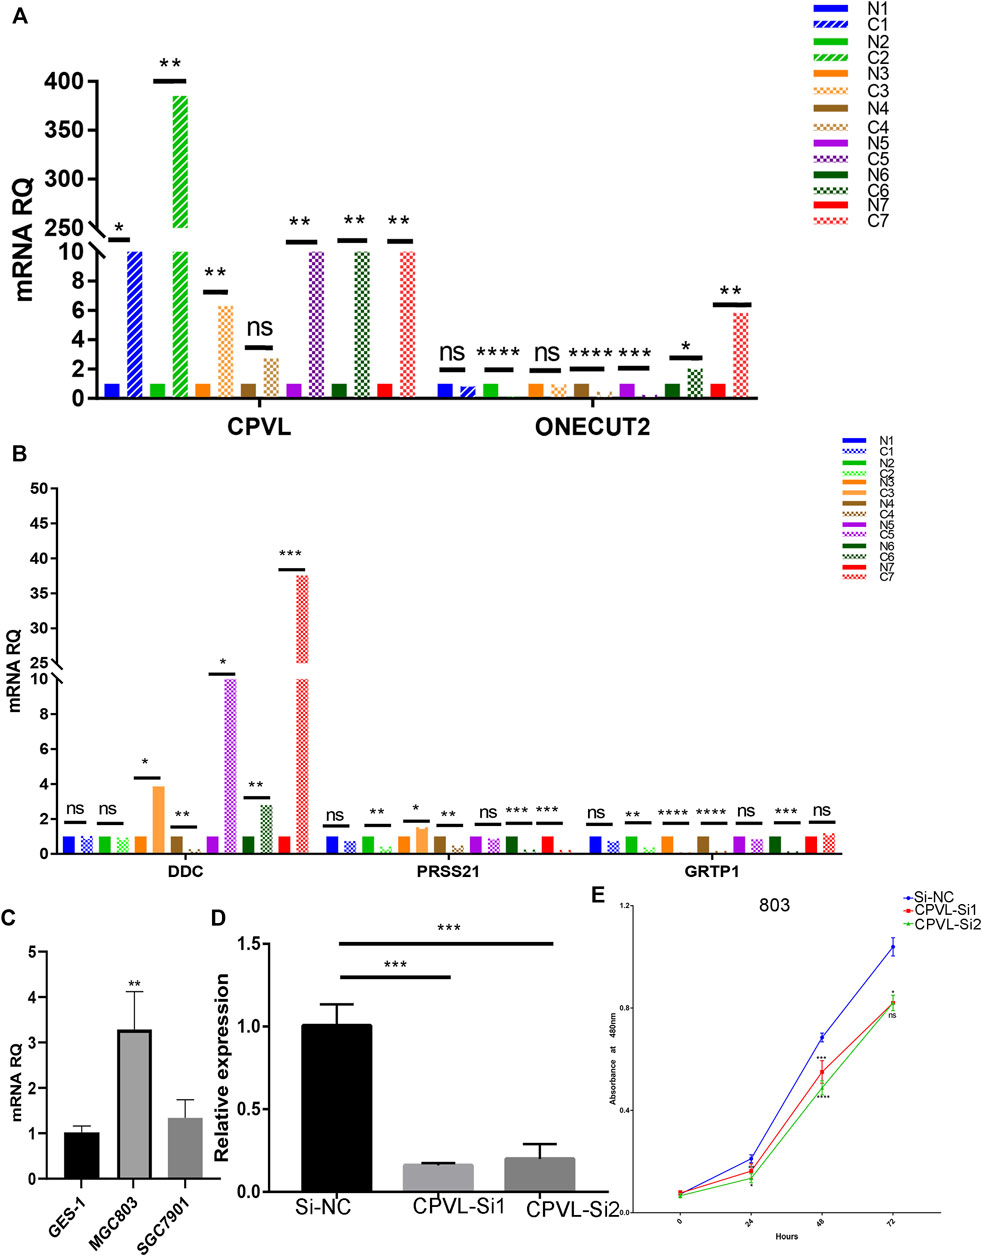
FIGURE 7. The effect of CPVL on cellular proliferation of Gastric cancer. (A,B) Q-PCR analysis of the relative expression levels of CPVL, ONECUT2, DDC, PRSS21, and GRTP1 in gastric cancer and corresponding adjacent tissues. Where “C” represents the tumor samples and “N” represents the corresponding paracancerous samples. (C) Relative expression of CPVL in gastric cancer cell lines. (D) Knockdown efficiency of CPVL in MGC803. (E) Effects of CPVL knockdown on MGC803 proliferation. (*p < 0.05, **p < 0.01, ***p < 0.001, ****p < 0.0001).
Relationship of CPVL With Immunity in Pan-Cancer
Among five hub genes, we focused on CPVL because it showed the highest degree of correlation with immune cell infiltration and immune checkpoints PD-1/PD-L1 and CTLA-4 in gastric cancer. Thus, we comprehensively explored the CPVL in pan-cancer, and its high expression showed a strong association with the poor prognosis in a variety of cancers (Figure 8). Total out of 33 pan-cancers, CPVL was found to have high expression in 29 cancers (Supplementary Figure S4), also showing a significant correlation with the immune and matrix scores. These findings show that CPVL has a universal effect on the immune cell infiltration and immune function in TME of various cancers.
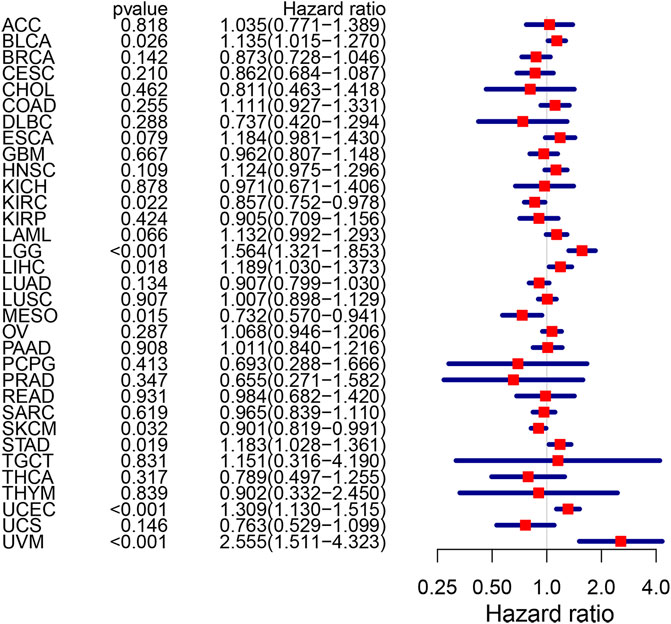
FIGURE 8. The risk rate of CPVL gene in pan-cancer. CPVL is associated with patients’ survival in BLCA, KIRC, LCC, LIHC, MESO, SKCM, STAD, UCEC, and UVM (p < 0.05). The hazard ratio greater than 1 indicates a high-risk gene(s), meaning that patients with high expression of such gene(s) have a worse prognosis; the hazard ratio less than 1 indicates a low-risk gene(s) for particular cancer, meaning that patients with high expression have a better prognosis.
The Prediction of CPVL Related miRNA and Upstream lncRNA
In starBase (http://starbase.sysu.edu.cn/), we have obtained four potential upstream miRNAs (hsa-miR-196a-5p, hsa-miR-7-5p, hsa-miR-196b-5p, and hsa-miR-561-5p) correlated with CPVL (Table 2) and among them, we selected hsa-miR-196b-5p as a potential target because of its highest degree of negative correlation with CPVL. Moreover, we predicted the upstream lncRNAs of hsa-miR-196b-5p, and obtained 68 possible lncRNAs, and five lncRNAs showing a negative correlation with hsa-miR-196b-5p and positive correlation with CPVL in gastric cancer were filtered out (Table 3). Furthermore, the expression levels of selected miRNAs and lncRNAs were determined in gastric cancer cell lines. The results showed that lncRNAs AL158207.2 and AL122035.2 were significantly reduced in gastric cancer samples, while the expression levels of the four miRNAs in gastric cancer cell lines were significantly higher than the normal controls (Supplementary Figure S5). Thus, based on these results, we believe that these lncRNAs and miRNAs could be used to construct ceRNA networks and studying other functions.
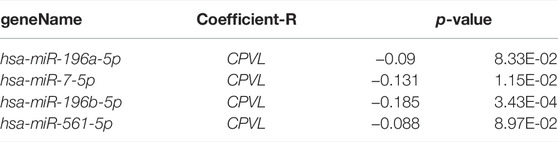
TABLE 2. Correlation between CPVL and miRNA.
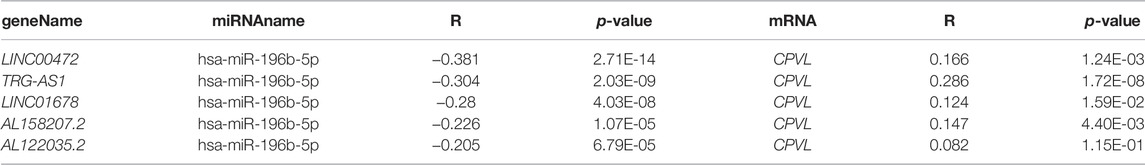
TABLE 3. Correlation analysis between lncRNA and hsa-miR-196b-5p or lncRNA and CPVL in GC determined by starBase database.
Discussion
Gastric cancer is considered as one of the most deadly cancers, ranked as the third leading cause of cancer-associated deaths worldwide (Chen et al., 2014). Exploring the heterogeneity within the tumor can help to deeply understand the microenvironment of gastric cancer (Yan et al., 2018). Recently, it has been validated that CNVs (deletion, insertion or SNPs) in genes are one of the important factors affecting cellular functions (Nakamura, 2009). In a variety of tumors, including gastric cancer, a large number of CNVs are potentially involved in the occurrence and development of tumors (Leary et al., 2008; Despierre et al., 2014; Horpaopan et al., 2015; Xu et al., 2015).
A study using 183 gastric cancer samples identified drugs’ targeted genes exhibit a high ratio of copy number gains (CNG) (Labots et al., 2014). It is well-known fact that the CNVs play integral roles in the screening of new prognostic targets and individualized treatment for patients based on the heterogeneity of their tumors (Hou et al., 2016). Believing that, single-cell sequencing of tumors could serve as a useful tool for exploring tumor heterogeneity (Hou et al., 2016). In the current study, we considered the CNV-score of the cells to differentiate the malignant cells from epithelial cells in GC. Abnormally high expressing genes with CNV-score in the tumor cells were screened out, and top genes were analyzed for their roles in overall survival in gastric cancer patients. Furthermore, we also verified that the level of CNVs and high-risk scores related to the poor prognosis of gastric cancer patients.
The tumor immune process and the host’s immune protection mechanism are divided into three phases: elimination, equilibrium, and escape phases (Lazar et al., 2018). Specifically, at the early stages of tumorigenesis and development, the immune system can kill tumor cells to inhibit the development and progression of cancers. With the progression of the tumor, the surviving cancer cells become smarter and can change some of their characteristics to avoid killers’ immune cells thus proliferating and metastasizing. We found that high expression of CPVL, ONECUT2, DDC, PRSS21, and GRTP1 increase the risk of gastric cancer. Interestingly, the expression of CPVL, ONECUT2, PRSS21, and GRTP1 was linked with the higher ratio of CNVs which further suppressed the level of immune cell infiltration. These results partially explain that the low degree of immune cell infiltration in GC may affect the efficiency of ICIs. High expression of ONECUT2 and PRSS21 have been reported to be associated with poorer prognosis in various cancers including prostate cancer, hepatocellular carcinoma, and gastric cancer (Liu et al., 2021; Pollan et al., 2021; Shen et al., 2021; Sun et al., 2021).
In the current study, CPVL showed higher expression than the other genes, thus we selected it for further analyses. CPVL is a serine carboxypeptidase that was first characterized in human macrophages (Mahoney et al., 2001). Though, the function of CPVL remains unclear in a variety of tumors. So far CPVL has not been deeply studied in gastric cancer. However, CPVL induced apoptosis in glioma cells through the IFN-γ/STAT1 signaling pathway (Yang et al., 2021). In gastric cancer cell lines, we showed for the first time that CPVL on cell proliferation, suggesting that CPVL may be a new prognostic target for gastric cancer. Further comprehensive studies are required to explore its deep function and underlying mechanisms in regulation of gstric cancer.
Conclusion
The high risk-scores of CPVL, ONECUT2, DDC, PRSS21, and GRTP1 could be used to determine the degree of malignancy and prognosis in gastric cancer patients. The increased expression of CPVL, ONECUT2, PRSS21, and GRTP1 may indicate the advanced stage of GC, as well as a low level of immune cell infiltration in gastric TME. In gastric cancer cell lines, we determined that CPVL regulate the cellular proliferation, showing that CPVL could be an important predictor in gastric cancer development.
Data Availability Statement
The datasets presented in this study can be found in online repositories. The names of the repository/repositories and accession number(s) can be found in the article/Supplementary Material.
Ethics Statement
The sampling and data collection procedures from human participants were reviewed and approved by The ethical committee of the Fifth Affiliated Hospital of Zhengzhou University. The patients/participants provided their written informed consent to participate in this study.
Author Contributions
FL: Conceptualization of the study and prepared first draft. HW: Analyzed the data, and revised the first draft. IB: Revised and reviewed manuscript, logical reasoning and language corrections. CG, FR, YT, and BL: Drafted the manuscript. PZ and YM: Conceived idea of the study, supervised overall work and reviewed and revised final draft. All authors read and approved the submission of the final manuscript.
Funding
This work was supported by Zhengzhou Major Collaborative Innovation Project (No. 18XTZX12003); Key projects of discipline construction in Zhengzhou University (No. XKZDJC202001); National Key Research and development program in China (No. 2020YFC2006100); Excellent Foreign Scientist Studio of Henan Province in China (No. GZS2018001); Medical service capacity improvement project of Henan Province in China [grant number Yu Wei Medicine (2017) No.66].
Conflict of Interest
The authors declare that the research was conducted in the absence of any commercial or financial relationships that could be construed as a potential conflict of interest.
Publisher’s Note
All claims expressed in this article are solely those of the authors and do not necessarily represent those of their affiliated organizations, or those of the publisher, the editors and the reviewers. Any product that may be evaluated in this article, or claim that may be made by its manufacturer, is not guaranteed or endorsed by the publisher.
Acknowledgments
We greatly acknowledge the participation of the patients into our study, and doctors and paramedic staff of the fifth affiliated hospital of zhengzhou university for their help in provision of samples. We are also highly thankful to our colleagues who are not listed as authors of this manuscript, for their support in the completion of this study. We also acknowledge the role of institutes and departments involved in this study.
Supplementary Material
The Supplementary Material for this article can be found online at: https://www.frontiersin.org/articles/10.3389/fgene.2022.869967/full#supplementary-material
Supplementary Figure S1 | Quality control and screening of single cells of gastric cancer. (A) Filter and normalize the tumor samples (355 tumor cells in total) in the GSE112302 single-cell sequencing data. (B) Red indicates the first 1,500 differential genes. (C) Sequencing depth and mitochondrial gene distribution. (D–G) Principal component analysis to screen marker genes (20 PCs in total).
Supplementary Figure S2 | Take the intersection of the Venn diagram to obtain the hub gene and its expression in a single cell population.
Supplementary Figure S3 | The scatter plot shows the correlation between CPVL, ONECUT2, DDC, PRSS21, and GRTP1 genes and immune checkpoints (PDCD1, CD274, PDCD1LG2, and CTLA4) in gastric cancer.
Supplementary Figure S4 | The scatter plot shows the correlation of CPVL with immune score and matrix score in pan-cancer.
Supplementary Figure S5 | Relative expression levels of lncRNAs and miRNAs in gastric cancer cell lines.
Abbreviations
AUC, Area under the curve; CNVs, copy number variations; DEGs, Differentially expressed genes; EBV+, Epstein-Barr virus infection positive; GEO, Gene Expression Omnibus; ICI, Immune checkpoint inhibitor; LASSO, Least Absolute Shrinkage and Selection Operator; MSI, Microsatellite Instability; PCA, Principal component analysis; ROC, Receiver operating characteristic curve; TCGA, The cancer genome atlas project; TME, Tumor microenvironment.
References
Beroukhim, R., Mermel, C. H., Porter, D., Wei, G., Raychaudhuri, S., Donovan, J., et al. (2010). The Landscape of Somatic Copy-Number Alteration across Human Cancers. Nature 463 (7283), 899–905. doi:10.1038/nature08822
Bray, F., Ferlay, J., Soerjomataram, I., Siegel, R. L., Torre, L. A., and Jemal, A. (2018). Global Cancer Statistics 2018: GLOBOCAN Estimates of Incidence and Mortality Worldwide for 36 Cancers in 185 Countries. CA Cancer J. Clin. 68 (6), 394–424. doi:10.3322/caac.21492
Campos-Carrillo, A., Weitzel, J. N., Sahoo, P., Rockne, R., Mokhnatkin, J. V., Murtaza, M., et al. (2020). Circulating Tumor DNA as an Early Cancer Detection Tool. Pharmacol. Ther. 207, 107458. doi:10.1016/j.pharmthera.2019.107458
Chen, W., Zheng, R., Zhang, S., Zhao, P., Zeng, H., and Zou, X. (2014). Report of Cancer Incidence and Mortality in China, 2010. Ann. Transl. Med. 2 (7), 61. doi:10.3978/j.issn.2305-5839.2014.04.05
Chung, W., Eum, H. H., Lee, H.-O., Lee, K.-M., Lee, H.-B., Kim, K.-T., et al. (2017). Single-cell RNA-Seq Enables Comprehensive Tumour and Immune Cell Profiling in Primary Breast Cancer. Nat. Commun. 8, 15081. doi:10.1038/ncomms15081
Cieslik, M., and Chinnaiyan, A. M. (2018). Cancer Transcriptome Profiling at the Juncture of Clinical Translation. Nat. Rev. Genet. 19 (2), 93–109. doi:10.1038/nrg.2017.96
Cochain, C., Vafadarnejad, E., Arampatzi, P., Pelisek, J., Winkels, H., Ley, K., et al. (2018). Single-Cell RNA-Seq Reveals the Transcriptional Landscape and Heterogeneity of Aortic Macrophages in Murine Atherosclerosis. Circ. Res. 122 (12), 1661–1674. doi:10.1161/circresaha.117.312509
Despierre, E., Moisse, M., Yesilyurt, B., Sehouli, J., Braicu, I., Mahner, S., et al. (2014). Somatic Copy Number Alterations Predict Response to Platinum Therapy in Epithelial Ovarian Cancer. Gynecol. Oncol. 135 (3), 415–422. doi:10.1016/j.ygyno.2014.09.014
Guo, X.-J., Lu, J.-C., Zeng, H.-Y., Zhou, R., Sun, Q.-M., Yang, G.-H., et al. (2021). CTLA-4 Synergizes with PD1/PD-L1 in the Inhibitory Tumor Microenvironment of Intrahepatic Cholangiocarcinoma. Front. Immunol. 12, 705378. doi:10.3389/fimmu.2021.705378
Horpaopan, S., Spier, I., Zink, A. M., Altmüller, J., Holzapfel, S., Laner, A., et al. (2015). Genome-wide CNV Analysis in 221 Unrelated Patients and Targeted High-Throughput Sequencing Reveal Novel Causative Candidate Genes for Colorectal Adenomatous Polyposis. Int. J. Cancer 136 (6), E578–E589. doi:10.1002/ijc.29215
Hou, Y., Guo, H., Cao, C., Li, X., Hu, B., Zhu, P., et al. (2016). Single-cell Triple Omics Sequencing Reveals Genetic, Epigenetic, and Transcriptomic Heterogeneity in Hepatocellular Carcinomas. Cell Res. 26 (3), 304–319. doi:10.1038/cr.2016.23
Ilson, D. H. (2017). Advances in the Treatment of Gastric Cancer. Curr. Opin. Gastroenterol. 33 (6), 473–476. doi:10.1097/mog.0000000000000395
Kacew, A. J., Harris, E. J., Lorch, J. H., Haddad, R. I., Chau, N. G., Rabinowits, G., et al. (2019). Chromosome 3q Arm Gain Linked to Immunotherapy Response in Advanced Cutaneous Squamous Cell Carcinoma. Eur. J. Cancer 113, 1–9. doi:10.1016/j.ejca.2019.03.004
Labots, M., Buffart, T. E., Haan, J. C., van Grieken, N. C. T., Tijssen, M., van de Velde, C. J. H., et al. (2014). High-level Copy Number Gains of Established and Potential Drug Target Genes in Gastric Cancer as a Lead for Treatment Development and Selection. Cell Oncol. 37 (1), 41–52. doi:10.1007/s13402-013-0162-4
Lazar, D. C., Avram, M. F., Romosan, I., Cornianu, M., Taban, S., and Goldis, A. (2018). Prognostic Significance of Tumor Immune Microenvironment and Immunotherapy: Novel Insights and Future Perspectives in Gastric Cancer. World J. Gastroenterol. 24 (32), 3583–3616. doi:10.3748/wjg.v24.i32.3583
Leary, R. J., Lin, J. C., Cummins, J., Boca, S., Wood, L. D., Parsons, D. W., et al. (2008). Integrated Analysis of Homozygous Deletions, Focal Amplifications, and Sequence Alterations in Breast and Colorectal Cancers. Proc. Natl. Acad. Sci. U.S.A. 105 (42), 16224–16229. doi:10.1073/pnas.0808041105
Li, J. H., Liu, S., Zhou, H., Qu, L. H., and Yang, J. H. (2014). StarBase v2.0: Decoding miRNA-ceRNA, miRNA-ncRNA and Protein-RNA Interaction Networks from Large-Scale CLIP-Seq Data. Nucleic Acids Res. 42 (Database issue), D92–D97. doi:10.1093/nar/gkt1248
Li, T., Fan, J., Wang, B., Traugh, N., Chen, Q., Liu, J. S., et al. (2017). TIMER: A Web Server for Comprehensive Analysis of Tumor-Infiltrating Immune Cells. Cancer Res. 77 (21), e108–e110. doi:10.1158/0008-5472.can-17-0307
Liu, D., Zhang, T., Chen, X., Zhang, B., Wang, Y., Xie, M., et al. (2021). ONECUT2 Facilitates Hepatocellular Carcinoma Metastasis by Transcriptionally Upregulating FGF2 and ACLY. Cell Death Dis. 12 (12), 1113. doi:10.1038/s41419-021-04410-3
Loraine, A. E., Blakley, I. C., Jagadeesan, S., Harper, J., Miller, G., and Firon, N. (2015). Analysis and Visualization of RNA-Seq Expression Data Using RStudio, Bioconductor, and Integrated Genome Browser. Methods Mol. Biol. 1284, 481–501. doi:10.1007/978-1-4939-2444-8_24
Mahoney, J. A., Ntolosi, B., DaSilva, R. P., Gordon, S., and McKnight, A. J. (2001). Cloning and Characterization of CPVL, a Novel Serine Carboxypeptidase, from Human Macrophages. Genomics 72 (3), 243–251. doi:10.1006/geno.2000.6484
McEligot, A. J., Poynor, V., Sharma, R., and Panangadan, A. (2020). Logistic LASSO Regression for Dietary Intakes and Breast Cancer. Nutrients 12 (9), 2652. doi:10.3390/nu12092652
Meacham, C. E., and Morrison, S. J. (2013). Tumour Heterogeneity and Cancer Cell Plasticity. Nature 501 (7467), 328–337. doi:10.1038/nature12624
Müller, S., Liu, S. J., Di Lullo, E., Malatesta, M., Pollen, A. A., Nowakowski, T. J., et al. (2016). Single‐cell Sequencing Maps Gene Expression to Mutational Phylogenies in PDGF ‐ and EGF ‐driven Gliomas. Mol. Syst. Biol. 12 (11), 889. doi:10.15252/msb.20166969
Nakamura, Y. (2009). DNA Variations in Human and Medical Genetics: 25 Years of My Experience. J. Hum. Genet. 54 (1), 1–8. doi:10.1038/jhg.2008.6
Patel, A. P., Tirosh, I., Trombetta, J. J., Shalek, A. K., Gillespie, S. M., Wakimoto, H., et al. (2014). Single-cell RNA-Seq Highlights Intratumoral Heterogeneity in Primary Glioblastoma. Science 344 (6190), 1396–1401. doi:10.1126/science.1254257
Pernot, S., Voron, T., Perkins, G., Lagorce-Pages, C., Berger, A., and Taieb, J. (2015). Signet-ring Cell Carcinoma of the Stomach: Impact on Prognosis and Specific Therapeutic Challenge. World J. Gastroenterol. 21 (40), 11428–11438. doi:10.3748/wjg.v21.i40.11428
Pollan, S. G., Teng, P. C., Jan, Y. J., Livingstone, J., Huang, C., Kim, M., et al. (2021). Loss of CDCP1 Triggers FAK Activation in Detached Prostate Cancer Cells. Am. J. Clin. Exp. Urol. 9 (4), 350–366.
Satija, R., Farrell, J. A., Gennert, D., Schier, A. F., and Regev, A. (2015). Spatial Reconstruction of Single-Cell Gene Expression Data. Nat. Biotechnol. 33 (5), 495–502. doi:10.1038/nbt.3192
Shen, C., Wang, J., Xu, Z., Zhang, L., Gu, W., and Zhou, X. (2021). ONECUT2 Which Is Targeted by Hsa-miR-15a-5p Enhances Stemness Maintenance of Gastric Cancer Stem Cells. Exp. Biol. Med. (Maywood) 246 (24), 2645–2659. doi:10.1177/15353702211038496
Siegel, R. L., Miller, K. D., and Jemal, A. (2017). Cancer Statistics, 2017. CA Cancer J. Clin. 67 (1), 7–30. doi:10.3322/caac.21387
Smyth, G. K., Michaud, J., and Scott, H. S. (2005). Use of Within-Array Replicate Spots for Assessing Differential Expression in Microarray Experiments. Bioinformatics 21 (9), 2067–2075. doi:10.1093/bioinformatics/bti270
Stuart, T., Butler, A., Hoffman, P., Hafemeister, C., Papalexi, E., Mauck, W. M., et al. (2019). Comprehensive Integration of Single-Cell Data. Cell 177 (7), 1888–1902. doi:10.1016/j.cell.2019.05.031
Sun, Z., Mao, Y., Zhang, X., Lu, S., Wang, H., Zhang, C., et al. (2021). Identification of ARHGEF38, NETO2, GOLM1, and SAPCD2 Associated with Prostate Cancer Progression by Bioinformatic Analysis and Experimental Validation. Front. Cell Dev. Biol. 9, 718638. doi:10.3389/fcell.2021.718638
Tirosh, I., Izar, B., Prakadan, S. M., Wadsworth, M. H., Treacy, D., Trombetta, J. J., et al. (2016). Dissecting the Multicellular Ecosystem of Metastatic Melanoma by Single-Cell RNA-Seq. Science 352 (6282), 189–196. doi:10.1126/science.aad0501
Van Cutsem, E., Sagaert, X., Topal, B., Haustermans, K., and Prenen, H. (2016). Gastric Cancer. Lancet 388 (10060), 2654–2664. doi:10.1016/s0140-6736(16)30354-3
Waniczek, D., Lorenc, Z., Śnietura, M., Wesecki, M., Kopec, A., and Muc-Wierzgoń, M. (2017). Tumor-Associated Macrophages and Regulatory T Cells Infiltration and the Clinical Outcome in Colorectal Cancer. Arch. Immunol. Ther. Exp. 65 (5), 445–454. doi:10.1007/s00005-017-0463-9
Weinberg, R. A. (2014). Coming Full Circle-From Endless Complexity to Simplicity and Back Again. Cell 157 (1), 267–271. doi:10.1016/j.cell.2014.03.004
Xu, H., Zhu, X., Xu, Z., Hu, Y., Bo, S., Xing, T., et al. (2015). Non-invasive Analysis of Genomic Copy Number Variation in Patients with Hepatocellular Carcinoma by Next Generation DNA Sequencing. J. Cancer 6 (3), 247–253. doi:10.7150/jca.10747
Yan, H. H. N., Siu, H. C., Law, S., Ho, S. L., Yue, S. S. K., Tsui, W. Y., et al. (2018). A Comprehensive Human Gastric Cancer Organoid Biobank Captures Tumor Subtype Heterogeneity and Enables Therapeutic Screening. Cell Stem Cell 23 (6), 882–897. doi:10.1016/j.stem.2018.09.016
Yang, H., Liu, X., Zhu, X., Li, X., Jiang, L., Zhong, M., et al. (2021). CPVL Promotes Glioma Progression via STAT1 Pathway Inhibition through Interactions with the BTK/p300 axis. JCI Insight 6 (24), e146362. doi:10.1172/jci.insight.146362
Keywords: gastric cancer, cancer immunotherapy, immune infiltration, copy number variation, tumor microenvironment
Citation: Li F, Wen H, Bukhari I, Liu B, Guo C, Ren F, Tang Y, Mi Y and Zheng P (2022) Relationship Between CNVs and Immune Cells Infiltration in Gastric Tumor Microenvironment. Front. Genet. 13:869967. doi: 10.3389/fgene.2022.869967
Received: 15 February 2022; Accepted: 23 May 2022;
Published: 08 June 2022.
Edited by:
Jitian Li, Henan Luoyang Orthopedic Hospital (Henan Provincial Orthopedic Hospital), ChinaReviewed by:
Zehua Song, Henan Provincial People’s Hospital, ChinaNiaz Muhammad, Minhaj University Lahore, Pakistan
Copyright © 2022 Li, Wen, Bukhari, Liu, Guo, Ren, Tang, Mi and Zheng. This is an open-access article distributed under the terms of the Creative Commons Attribution License (CC BY). The use, distribution or reproduction in other forums is permitted, provided the original author(s) and the copyright owner(s) are credited and that the original publication in this journal is cited, in accordance with accepted academic practice. No use, distribution or reproduction is permitted which does not comply with these terms.
*Correspondence: Yang Mi, yangmi198@zzu.edu.cn; Pengyuan Zheng, pyzheng@zzu.edu.cn
#: These authors contributed equally to this work