 Adam Abied1,2
 Abulgasim M. Ahbara3
 Haile Berihulay1
 Lingyang Xu1
 Rabiul Islam1
 Faisal M. El-Hag2,4
 Mourad Rekik5
 Aynalem Haile3
 Jian-Lin Han6,7Yuehui Ma1
 Qianjun Zhao1*
 Joram M. Mwacharo3,8*
- 1Institute of Animal Science, Chinese Academy of Agricultural Sciences, Beijing, China
- 2Dry Land Research Centre and Animal Production, Agricultural Research Corporation, Khartoum, Sudan
- 3Small Ruminant Genomics, International Center for Agricultural Research in the Dry Areas (ICARDA), Addis Ababa, Ethiopia
- 4Arid Land Research Centre, Tottori University, Tottori, Japan
- 5International Center for Agricultural Research in the Dry Areas (ICARDA), Amman, Jordan
- 6CAAS-ILRI Joint Laboratory on Livestock and Forage Genetic Resources, Institute of Animal Science, Chinese Academy of Agricultural Sciences, Beijing, China
- 7Livestock Genetics Program, International Livestock Research Institute, Nairobi, Kenya
- 8Animal and Veterinary Sciences, Scotland Rural College and Centre for Tropical Livestock Genetics and Health (CTLGH), Roslin Institute, Midlothian, United Kingdom
With climate change bound to affect food and feed production, emphasis will shift to resilient and adapted indigenous livestock to sustain animal production. However, indigenous livestock comprise several varieties, strains and ecotypes whose genomes are poorly characterized. Here, we investigated genomic variation in an African thin-tailed Desert Sheep sampled in Sudan, using 600K genotype data generated from 92 individuals representing five ecotypes. We included data from 18 fat-tailed and 45 thin-tailed sheep from China, to investigate shared ancestry and perform comparative genomic analysis. We observed a clear genomic differentiation between the African thin-tailed Desert Sheep and the Chinese thin-tailed and fat-tailed sheep, suggesting a broad genetic structure between the fat-tailed and thin-tailed sheep in general, and that at least two autosomal gene pools comprise the genome profile of the thin-tailed sheep. Further analysis detected two distinct genetic clusters in both the African thin-tailed Desert Sheep and the Chinese thin-tailed sheep, suggesting a fine-scale and complex genome architecture in thin-tailed sheep. Selection signature analysis suggested differences in adaptation, production, reproduction and morphology likely underly the fine-scale genetic structure in the African thin-tailed Desert Sheep. This may need to be considered in designing breeding programs and genome-wide association studies.
Introduction
A common research thread that links population and quantitative genomics is the elucidation of patterns and processes underlying population genetic structure. Whether such structure is stable in time and space is increasingly addressed for its utility in determining how many genetically distinct populations exist and their inter-relationships (Nielsen et al., 1999; Waples and Gaggiotti, 2006). Insights from such investigations inform management decisions that define conservation units and the design of genetic monitoring and breeding programs (Palsbøll et al., 2007; Schwartz et al., 2007). The tropics and sub-tropics are home to a large reservoir of indigenous livestock with a high degree of adaptive resilience, and which support agricultural and non-agricultural industries with minimal anthropogenic interventions (FAO, 2007). Indigenous livestock can therefore provide a foundation to sustain production under increasing challenges resulting from global warming and rising human demand for livestock products. It is also likely that future livestock production will come from marginal areas where arable agriculture is at high risk of failure and thus particular attention would have to be given to the uniqueness of genetic features, as it is difficult to predict the future importance of traits and alleles (Taberlet et al., 2008).
Domestic sheep (Ovis aries) are central to national economies as a source of cash, meat, milk, fiber, etc., and to traditional societies as repositories of socio-cultural values. Sheep are also essential components of diverse production systems due partly to their versatility to adapt to local biophysical and production environments. Domestic sheep comprise three broad types: thin-tailed, fat-tailed, and fat-rumped sheep (Porter, 2020). Thin-tailed sheep are the most ancient and in the African continent, two types are recognized: the long-legged (Sahelian) and the tropical Dwarf (Djallonké) sheep. The Sahelian is confined to the hot arid marginal environments in eastern, western and northern Africa, while the Djallonke is well adapted to sub-humid and humid tropics of western and central Africa. The analysis of mitochondrial genomes has shown that the Sahelian and Djallonke comprise separate maternal ancestries (Brahi et al., 2015).
The long-legged thin-tailed sheep found in Sudan represents the complexity that is typical of most indigenous livestock. They are subdivided into Desert, Nilotic, Arid upland, Arid equatorial, and West African populations, including their inter-crosses, following their eco-geographic distribution (Abualazayium, 2004). Within the Sudanese thin-tailed Desert Sheep, a long-legged Sahelian thin-tailed sheep, at least eight ecotypes, Hammari, Kabashi, Shanbali, Shugor, Dubasi, Watish, Al Ahamda, and Borouge, have been described (Abualazayium, 2004). Whether these ecotypes represent real underlying genetic variation remains unknown. If confirmed, they could offer a powerful genetic model to investigate drivers of divergence in indigenous livestock. Understanding fine-scale genetic structure is also important to control confounding effects of population stratification in association studies (Price et al., 2010). In this study, we applied distance- and model-based comparative genomic approaches to 600K single nucleotide polymorphism (SNP) genotype data from 121 individuals of five ecotypes of the Sudanese thin-tailed Desert Sheep, to investigate their genome architecture and dynamics. We analyzed the dataset alongside similar data from one fat-tailed and four thin-tailed breeds of sheep from China, to investigate their shared genome ancestry and for comparative genomic assessment.
Materials and Methods
Sample Collection and DNA Extraction
Whole blood was collected through jugular venipuncture from 121 animals representing five ecotypes of thin-tailed Desert Sheep in Sudan (Supplementary Tables 1, 2). Blood samples were also collected from 65 individuals of four breeds of Chinese sheep, including one fat-tailed breed (Tan Sheep) from a dry lowland environment in Ningxia Province and three thin-tailed breeds (Oula, Zeku, and Black Tibetan) from the alpine high-altitude in Qinghai Province (Supplementary Table 1); these were used for comparative genomic analysis. The DNeasy® Blood and Tissue Kit (Qiagen Inc., United States) and the phenol-chloroform method were used to extract DNA from the Sudanese and Chinese samples, respectively. The samples were genotyped with the Ovine Infinium 600K BeadChip at GeneSeek Inc. (Sudanese samples) and Compass Biotechnology (Chinese samples). Of the 606,006 SNPs present in the BeadChip, 577,401 are autosomal, 27,314 are on the X-chromosome and 1,291 remain unmapped.
Data Screening and Quality Control
The genotypes from both sets of samples were merged and the data were screened for quality with PLINK (Chang et al., 2015). Samples with more than 10% missing genotypes, SNPs with less than 90% genotype call rates, Hardy-Weinberg equilibrium (HWE) threshold of 1e-10 and minor allele frequency (MAF) < 0.01 were discarded. Using the “genome – min 0.05 – max 1” flag, the Pi-HAT statistic was calculated to assess the level of genetic relatedness between individuals and determine outliers with the objective of excluding the outliers and at least one amongst a pair of individuals that showed close genetic relationship. The value of 0.1875 which represents the half-way point between the 2nd and 3rd degree relatives was used as the cut-off threshold. These filtering thresholds left 155 samples (Table 1) and 519,711 SNPs which were used for selection signature analyses. Using PLINK, the 519,711 SNPs were subjected to linkage disequilibrium (LD) pruning using the parameters 50, 5, and 0.5 representing window size (kb), step size (kb), and r2 threshold, respectively, resulting in 390,243 SNPs that were used for population structure and phylogenetic analysis.
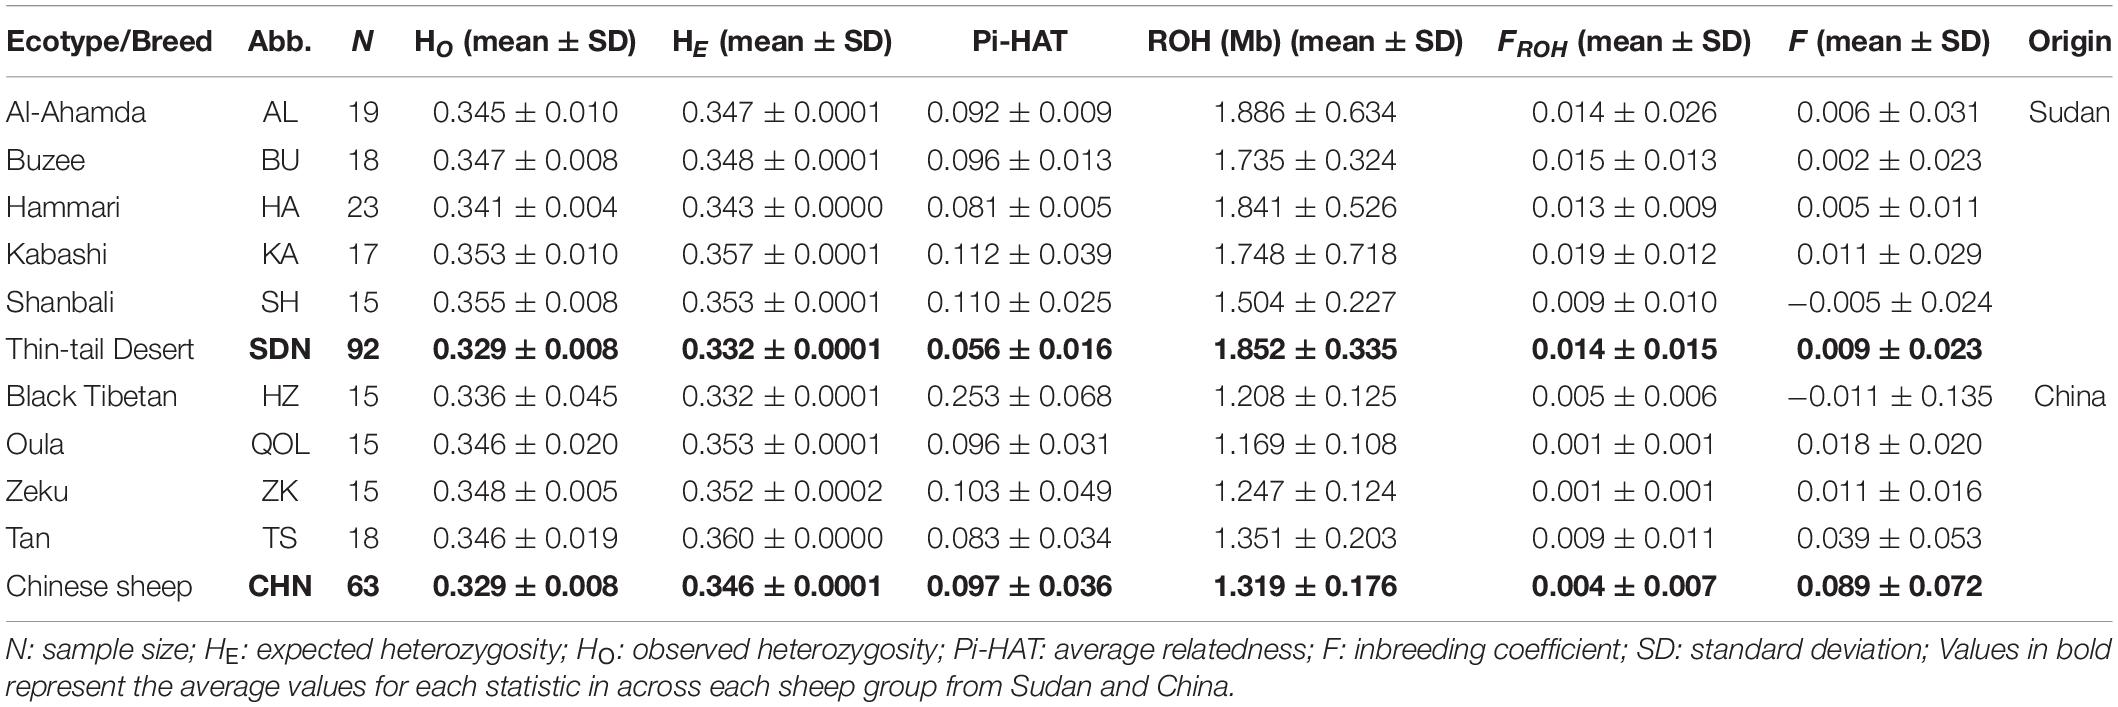
Table 1. Genetic diversity estimates in the five ecotypes of Sudanese thin-tailed Desert Sheep and the four breeds of sheep from China analyzed in this study.
Genetic Diversity, Relationship, and Structure
The “het” and “ibc” options in PLINK were used to calculate the observed (HO) and expected (HE) heterozygosity, inbreeding coefficient F and Pi-HAT statistics. The “detectRUNS” package (Biscarini et al., 2019) was used to scan the genomes for runs of homozygosity (ROH) using the consecutive method (Marras et al., 2015). The parameters used to detect ROH were: (i) minimum number of SNPs in a sliding window = 50, (ii) minimum ROH length = 1 Mb, (iii) minimum number of consecutive SNPs for each ROH = 50, (iv) number of heterozygous SNPs per window = 1, (v) missing SNP calls per window = 5, (vi) minimum SNP density = 1 SNP/100 kb, and (vii) maximum gap between consecutive SNPs = 1 Mb. The ROH coefficient depicting genome-wide inbreeding (FROH) was computed as the ratio of the total length of ROH to the length of autosomes (2.45 Gb) (McQuillan et al., 2008).
To explore demographic dynamics in the African thin-tailed Desert Sheep and in the thin-tailed and fat-tailed sheep from China, the trends in LD over genomic distances were examined by calculating the correlation coefficient (r2) between alleles at two SNP loci using the “indep” option in PLINK. Following Sved (1971), the effective population size (NE) was estimated with the equation NEt = (1/4c) (1/r2 - 1), where NEt represents the effective population size t generations ago, t = 1/2c, r2 is the LD between pairwise SNPs and c is the genetic distance in Morgan between a pair of SNPs (Tortereau et al., 2012).
Weir and Cockerham (1984) FST statistic was calculated to determine the extent of genetic differentiation using Arlequin v.3.5.2 (Excoffier and Lischer, 2010). The significance of the pairwise FST values was determined following 1,000 permutation replications of the dataset.
To investigate genetic structure, we performed neighbour-joining (NJ) phylogeny, principal component analysis (PCA) and ADMIXTURE modeling. The NJ tree was generated to visualize relationships using pairwise FST genetic distances. MEGA7 (Kumar et al., 2016) was used to construct the NJ tree with the five ecotypes of thin-tailed Desert Sheep and the four sheep breeds from China anchoring at the nodes. PCA was performed using the “pca” option in PLINK and the first two PCs were visualized using GENESIS (Buchmann and Hazelhurst, 2014). Genomic ancestry and admixture were investigated using the unsupervised clustering algorithm implemented in the ADMIXTURE toolkit v1.3 (Alexander et al., 2009). The patterns of population structure were explored by varying the number of assumed ancestral clusters between 2 ≤ K ≤ 8. Five iterations were performed for each K, summarized using CLUMPP (Jakobsson and Rosenberg, 2007) and visualized with GENESIS.
Genome-Wide Scans for Signatures of Divergent Selection
The NJ tree, PCA and ADMIXTURE revealed evidence of broad- and fine-scale genetic structures in the datasets. To detect genomic regions showing divergence between the observed genetic structures, we analyzed the dataset for signatures of divergent selection.
Using the detectRUNS package, we implemented the frequency-based threshold approach to define genome-wide ROH islands in each genetic cluster that was revealed by the NJ tree, PCA and ADMIXTURE. This approach set a percentage of animals within a genetic cluster or a population having a SNP in an ROH region as the threshold. The threshold used in our analysis to select the genomic regions with a high frequency of ROH islands was 50%. Private ROH islands were determined by filtering out homozygous variants in ROHs in a specific genetic cluster, but which could not be found in ROHs of the other genetic clusters. This allowed the detection of either whole or segments of ROHs that were either shared or were private to a genetic cluster. The frequency of ROHs were plotted against their physical genomic positions and visualized with a Manhattan plot.
Signatures of selection were investigated using FST (Weir and Cockerham, 1984). This approach analyses allele frequency differentiation between populations and detects almost complete or long-term selection signatures. The FST algorithm was implemented with HIERFSTAT (Goudet, 2005) using a window size of 200 kb and a sliding step size of 60 kb. The window and slide-step sizes were inferred from LD decay patterns. The pairwise FST values for each SNP in each window between the genetic clusters tested were estimated as:
where p1, p2 and q1, q2 are the frequencies of alleles “A” and “a” in the first and second genetic clusters, respectively, and pr and qr are the frequencies of alleles “A” and “a,” respectively, across the tested genetic clusters (Zhi et al., 2018). The FST values were standardized into Z-scores as follows:
where μFST is the overall average value of FST and σFST is the standard deviation (SD) derived from all the windows tested for a given comparison. Supplementary Figure 1 shows the distribution of the ZFST values. We set the top 0.1% positive values of ZFST as the threshold to identify the candidate regions under selection.
We also investigated signatures of selection using XP-EHH (Sabeti et al., 2007). It assesses haplotype differences between two test populations, and it can detect a wider range of selection scenarios, including selection on standing variation or incomplete sweeps or on-going selection (Sabeti et al., 2007; Innan and Kim, 2008). The test uses the integrated EHH (iHH) of a core SNP in two test populations, rather than two alleles in one test population. The unstandardized XP-EHH statistic is calculated as:
where iHHA and iHHB are the integrated EHH of a given core SNP in the A and B test populations, respectively. A large and positive value of XP-EHH at a locus suggests selection in reference population while a negative value suggests selection in the alternate one. We used the software developed by Pickrell and Pritchard (2012) to estimate the unstandardized XP-EHH statistics for all SNPs in each comparison. These were then standardized using their means and variances, and the p-values were estimated from the standard normal distribution (Supplementary Figure 2). For each comparison, we determined the regions under selection based on the threshold P value < 0.001.
To investigate the functional significance of selection signatures, the candidate regions revealed by ROH, FST, and XP-EHH were identified using the intersectBed function of BedTools software (Quinlan and Hall, 2010). The O. aries reference genome assembly (OAR_v3.0) was used to annotate the candidate regions using the BioMart Tool in Ensembl and NCBI databases. The functional annotation tool in DAVID v6.8 (Huang et al., 2009) was used to perform enrichment and gene ontology (GO) analyses using O. aries as the background. The functions of genes overlapping the candidate regions were also determined from literature.
Results
Genetic Diversity and Differentiation
The average values of HO and HE for the Sudanese thin-tailed Desert Sheep and the Chinese breeds exceeded 0.300 (Table 1). Among the Sudan thin-tailed Desert sheep, Hammari (HA) had the lowest values of HO (0.341 ± 0.004) and HE (0.343 ± 0.000) while the highest values were observed in Shanbali (SH) (HO = 0.355 ± 0.008) and Kabashi (KA) (HE = 0.357 ± 0.000). Among the Chinese breeds, the Black Tibetan (HZ) had the lowest values of HO (0.336 ± 0.045) and HE (0.332 ± 0.0001), whereas the highest values were present in Zeku (ZK) (HO = 0.348 ± 0.005) and Tan Sheep (HE = 0.360 ± 0.000). The average Pi-HAT value for the Sudan thin-tailed Desert Sheep was 0.056 ± 0.016, ranging between 0.081 and 0.112 (Table 1). This supported a low level of genetic relatedness between the individuals, which were confirmed by the low values of inbreeding (average FROH = 0.014 and F = 0.009). This validated our sampling strategy which targeted only mature unrelated animals. The Sudanese thin-tailed Desert Sheep had on average longer lengths of ROH, higher FROH but lower F compared to the Chinese breeds.
We investigated the trends in LD decay over genomic distances (Figure 1A) and in NE over generation time (Figure 1B). Across all genomic distance intervals, the Sudanese thin-tailed Desert Sheep showed lower LD compared to the Chinese breeds. At 1,000 generations ago, the Sudanese thin-tailed Desert Sheep had lower NE compared to the Chinese sheep. However, the thin-tailed Desert Sheep showed an expansion in NE up to around 270 generations ago, after which it started to contract drastically up to the present time. The NE for the Chinese breeds remained stable up to around 500 generations ago, upon which it also started to contract but at a gradual pace to the present time.
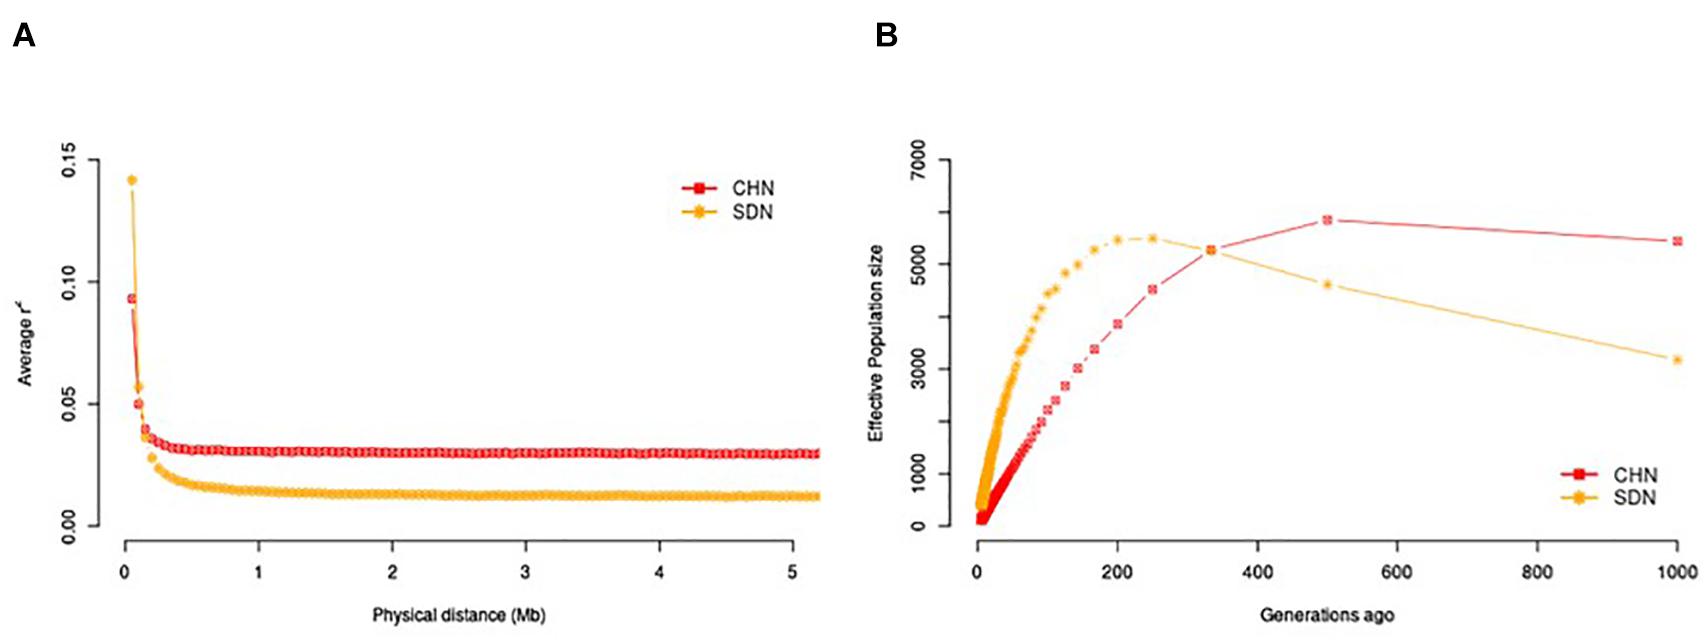
Figure 1. (A) LD decay pattern within 5 Mb distance in Sudanese and Chinese sheep. (B) NE across 1,000 generations in Sudanese and Chinese sheep.
Genetic differentiation was assessed by calculating pairwise FST values between ecotypes and breeds (Supplementary Table 3). The overall highest levels of genetic differentiation were between the fat-tailed Tan Sheep against all the other ecotypes and breeds. Among the Sudanese thin-tailed Desert Sheep, AL-Ahamda (AL) showed the highest FST values with the other ecotypes while the lowest values were between Buzee (BU) with both HA and SH. Among the Chinese breeds, the lowest values of FST occurred between the thin-tailed Oula (QOL) and Zeku (ZK).
To visualize the extent of genetic differentiation, we generated an NJ phylogeny with the ecotypes and breeds at the nodes using the pairwise FST genetic distance matrix (Figure 2A). The tree revealed a clear separation of the fat-tailed Tan Sheep from the Chinese thin-tailed sheep and the Sudanese thin-tailed Desert Sheep. The latter clustered very close together, suggesting lower genetic differentiation. The HZ was separated from both ZK and QOL, suggesting a genetic divergence within the Chinese thin-tailed sheep. ZK and QOL had the lowest value of FST between them. An NJ phylogeny for the five ecotypes of Sudanese thin-tailed Desert Sheep was generated to obtain a better picture of the extent of their genetic relationships (Figure 2B). It showed that AL was genetically differentiated from BU, HA, KA, and SH.
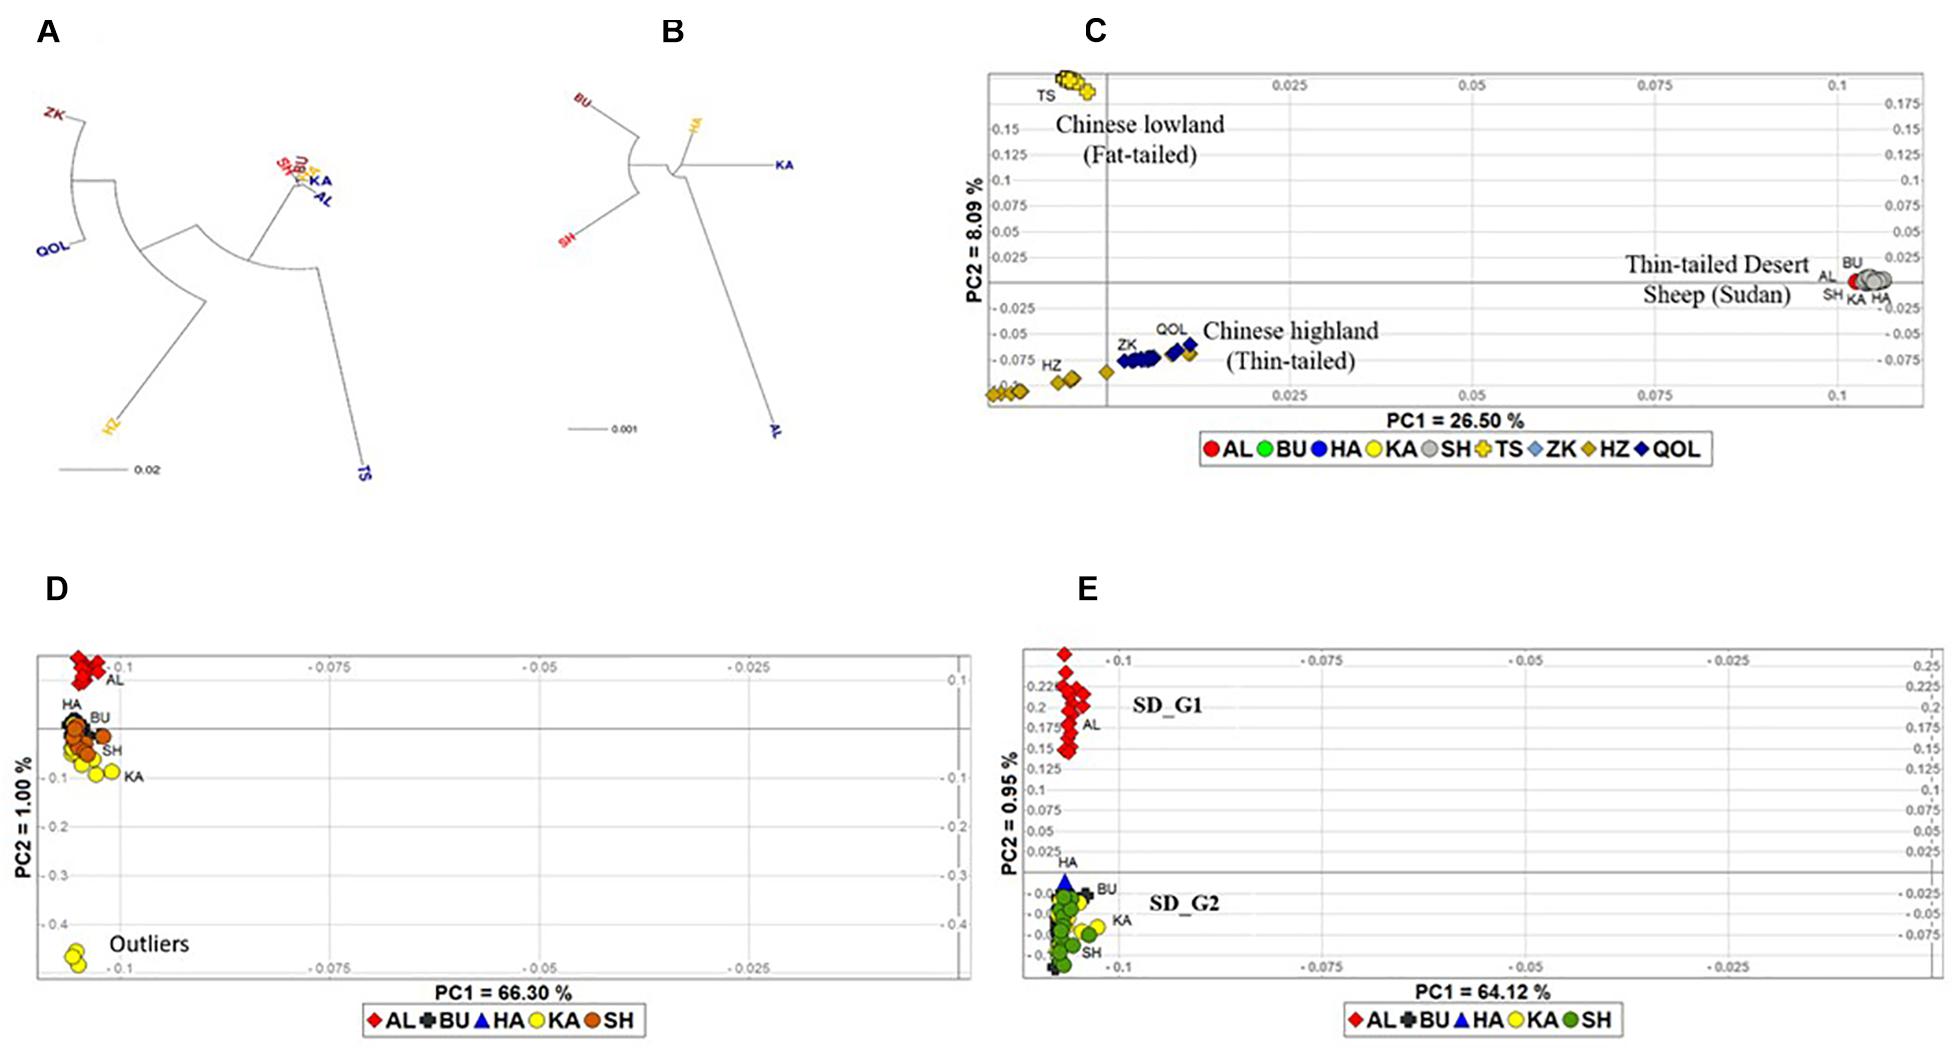
Figure 2. Neighbor Joining tree of (A) all the five Sudanese thin-tailed Desert Sheep ecotypes and four breeds of Chinese sheep; (B) the five ecotypes of Sudanese thin-tailed Desert Sheep only; (C) PCA plot of all the individuals analyzed in this study; (D) PCA of Sudanese thin tailed Desert Sheep only; (E) PCA of the Sudanese thin-tailed Desert Sheep excluding the three outliers of the Kabashi ecotype.
We used individuals as the taxonomic units and performed a PCA to ascertain the divergence revealed by the NJ tree. In the first instance, all the study individuals were included in the PCA, and PC1 and PC2 explained 26.50 and 8.09% of the total genetic variation, respectively (Figure 2C). PC1 separated the Chinese breeds into two groups showing a marked concordance with their tail type and geographic origin. One group included the Tan Sheep (fat-tailed sheep from the lowlands, Ningxia Province) while the other group comprised HZ, QOL, and ZK (thin-tailed sheep from the alpine high-altitude, Qinghai Province). This grouping corresponded to the NJ phylogeny. Although HZ appeared to be separated from both QOL and ZK, its divergence was not as distinct as on the NJ tree. PC2 separated the Chinese breeds from the five ecotypes of Sudanese thin-tailed Desert Sheep which, as in the NJ tree, clustered close together. To further investigate the clustering pattern in the latter, we performed the PCA but excluding the Chinese breeds. It revealed three outlier individuals of KA and a slight separation of AL from the other ecotypes (Figure 2D). Given the likelihood that the three outliers could be masking the divergence of AL, we performed another PCA while excluding them. It resulted in a clear divergence of AL from the other ecotypes (Figure 2E). Given this result, we excluded the three outliers from subsequent analyses as their extreme divergence could not be explained.
We used the ADMIXTURE tool to investigate genome architecture and complement the NJ phylogeny and PCA. Running ADMIXTURE using all the study individuals resulted in the lowest CV error at K = 3 (Figure 3A). At this K, three gene pools were observed (Figure 3B). The first comprised the thin-tailed Desert Sheep from Sudan, the second was made up of the thin-tailed sheep from China (ZK, QOL, and HZ) and the third is exclusive to the Chinese fat-tailed Tan Sheep. We suggest that this reveals the broad-scale genetic structure defining the dataset. Considering the results of the NJ phylogeny and PCA, which showed AL to be genetically divergent and a slight separation of HZ from both ZK and QOL, we investigated the ADMIXTURE patterns at 4 ≤ K ≤ 8 (Figure 3B). At K = 4, HZ diverges from ZK and QOL and this divergence is retained up to K = 8. At K = 5, AL diverges from the other ecotypes of Sudanese thin-tailed Desert Sheep by its unique genetic background which is also retained up to K = 8. As the pattern of genetic structure remains consistent from 5 ≤ K ≤ 8 and it corresponds to the clusters revealed by the NJ phylogeny (Figures 2A,B) and PCA (Figures 2C,E), we suggest that K = 5 represents the fine-scale genomic structure in the study individuals. We therefore refer the two genetic clusters in the Sudanese thin-tailed Desert sheep as SD_G1 (AL) and SD_G2 (BU, HA, KA, and SH). We also classify the Chinese breeds into three genetic clusters, i.e., CN_G1 (Tan Sheep), CN_G2 (ZK and QOL), and CN_G3 (HZ).
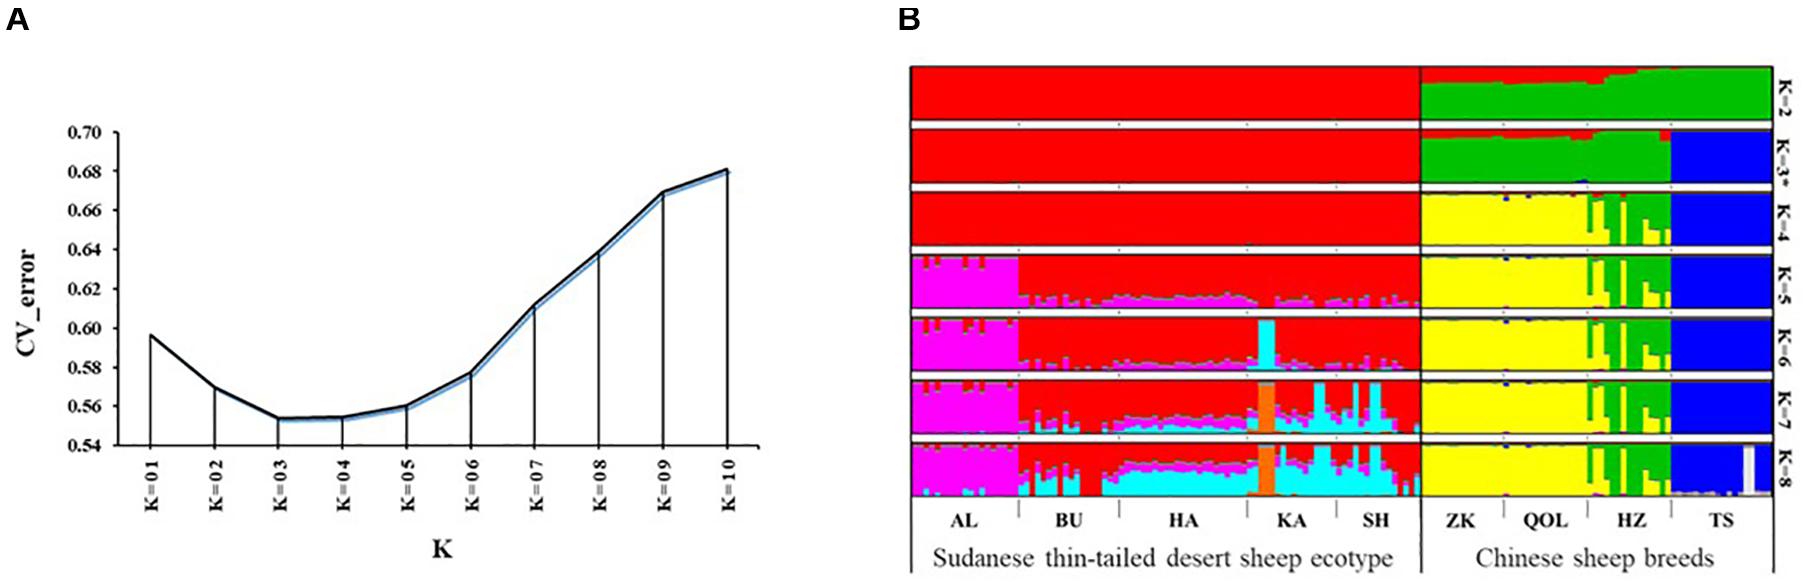
Figure 3. (A) CV plot of the admixture analysis involving all the samples analyzed in the study. (B) Admixture plot showing the assignment probabilities of all the individuals analyzed in the current study for 2 ≤ K ≤ 8.
Signatures of Selection
Based on these genetic clusters, we used ROH, FST and XP-EHH to investigate the genetic signatures of their divergence. We performed the ROH analysis to identify ROH segments that were specific to SD_G1 or SD_G2. The FST and XP-EHH were used for comparative selection signature analyses that contrasted the two genetic clusters of the Sudanese thin-tailed Desert Sheep with each other and with two of the Chinese clusters. That was, for SD_G1, the following comparative analyses were performed: SD_G1 verses SD_G2, CN_G1, or CN_G2. A similar comparative analysis was performed for SD_G2. We excluded CN_G3 from these analyses because its genome showed an admixed profile. All the candidate regions and genes identified by each approach for each comparison involving SD_G1 and SD_G2 are shown in Supplementary Tables 4–10.
The ROH analysis identified 107 ROH regions, overlapping 286 genes, that were specific to SD_G1 (Figure 4A), and 78 ROH regions, spanning 281 genes, that were specific to SD_G2 (Figure 4B). In total, 88 ROH regions were common between SD_G1 and SD_G2. The most significant ROH region which was common to SD_G1 and SD_G2 occurred on OAR3 (10,700,001–11,800,000 bp) and spanned 19 genes (Table 2). For the Chinese groups, 146 and 69 ROH islands spanning 257 and 43 genes were specific to CN_G1 (Figure 4C) and CN_G2 (Figure 4D), respectively.
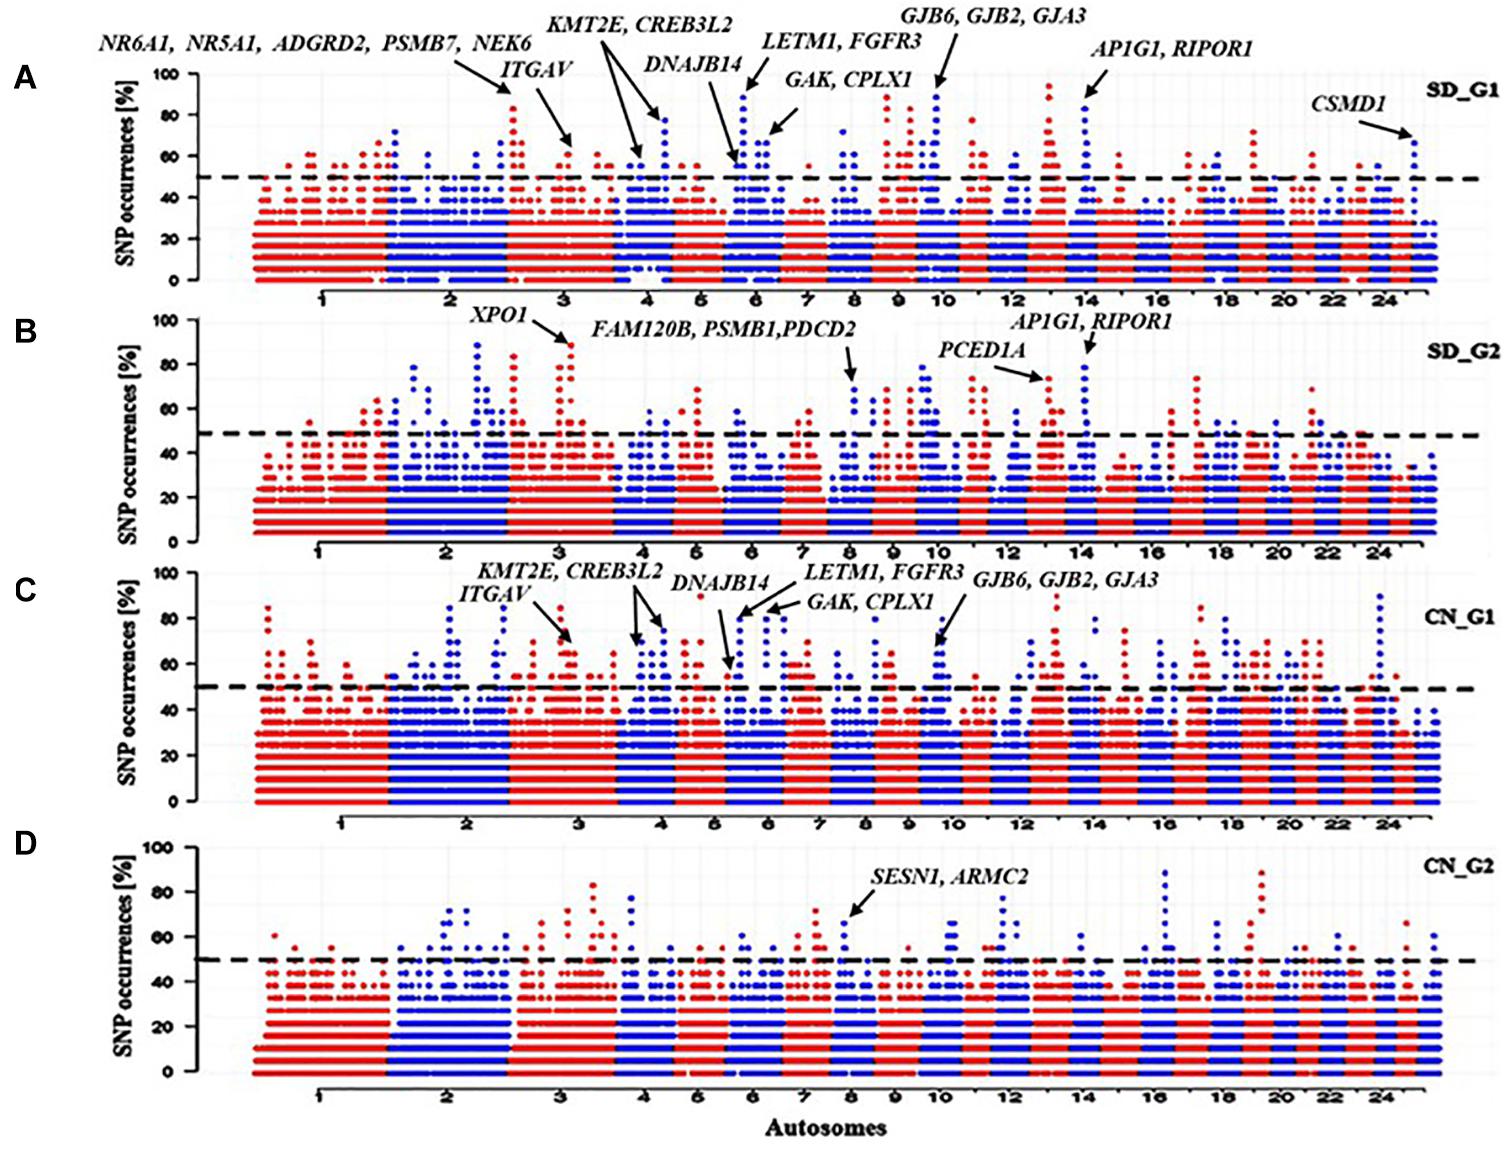
Figure 4. Manhattan plots of genome-wide distribution frequency of SNPs in stretches of ROH regions for (A) SD_G1 genetic group of thin-tailed Desert Sheep from Sudan; (B) SD_G2 genetic group of thin-tailed Desert Sheep from Sudan; (C) CN_G1 genetic group of Chinese sheep; (D) CN_G2 genetic group of Chinese sheep. The dashed lines indicate the 50% cut-off threshold for each groups of individuals.
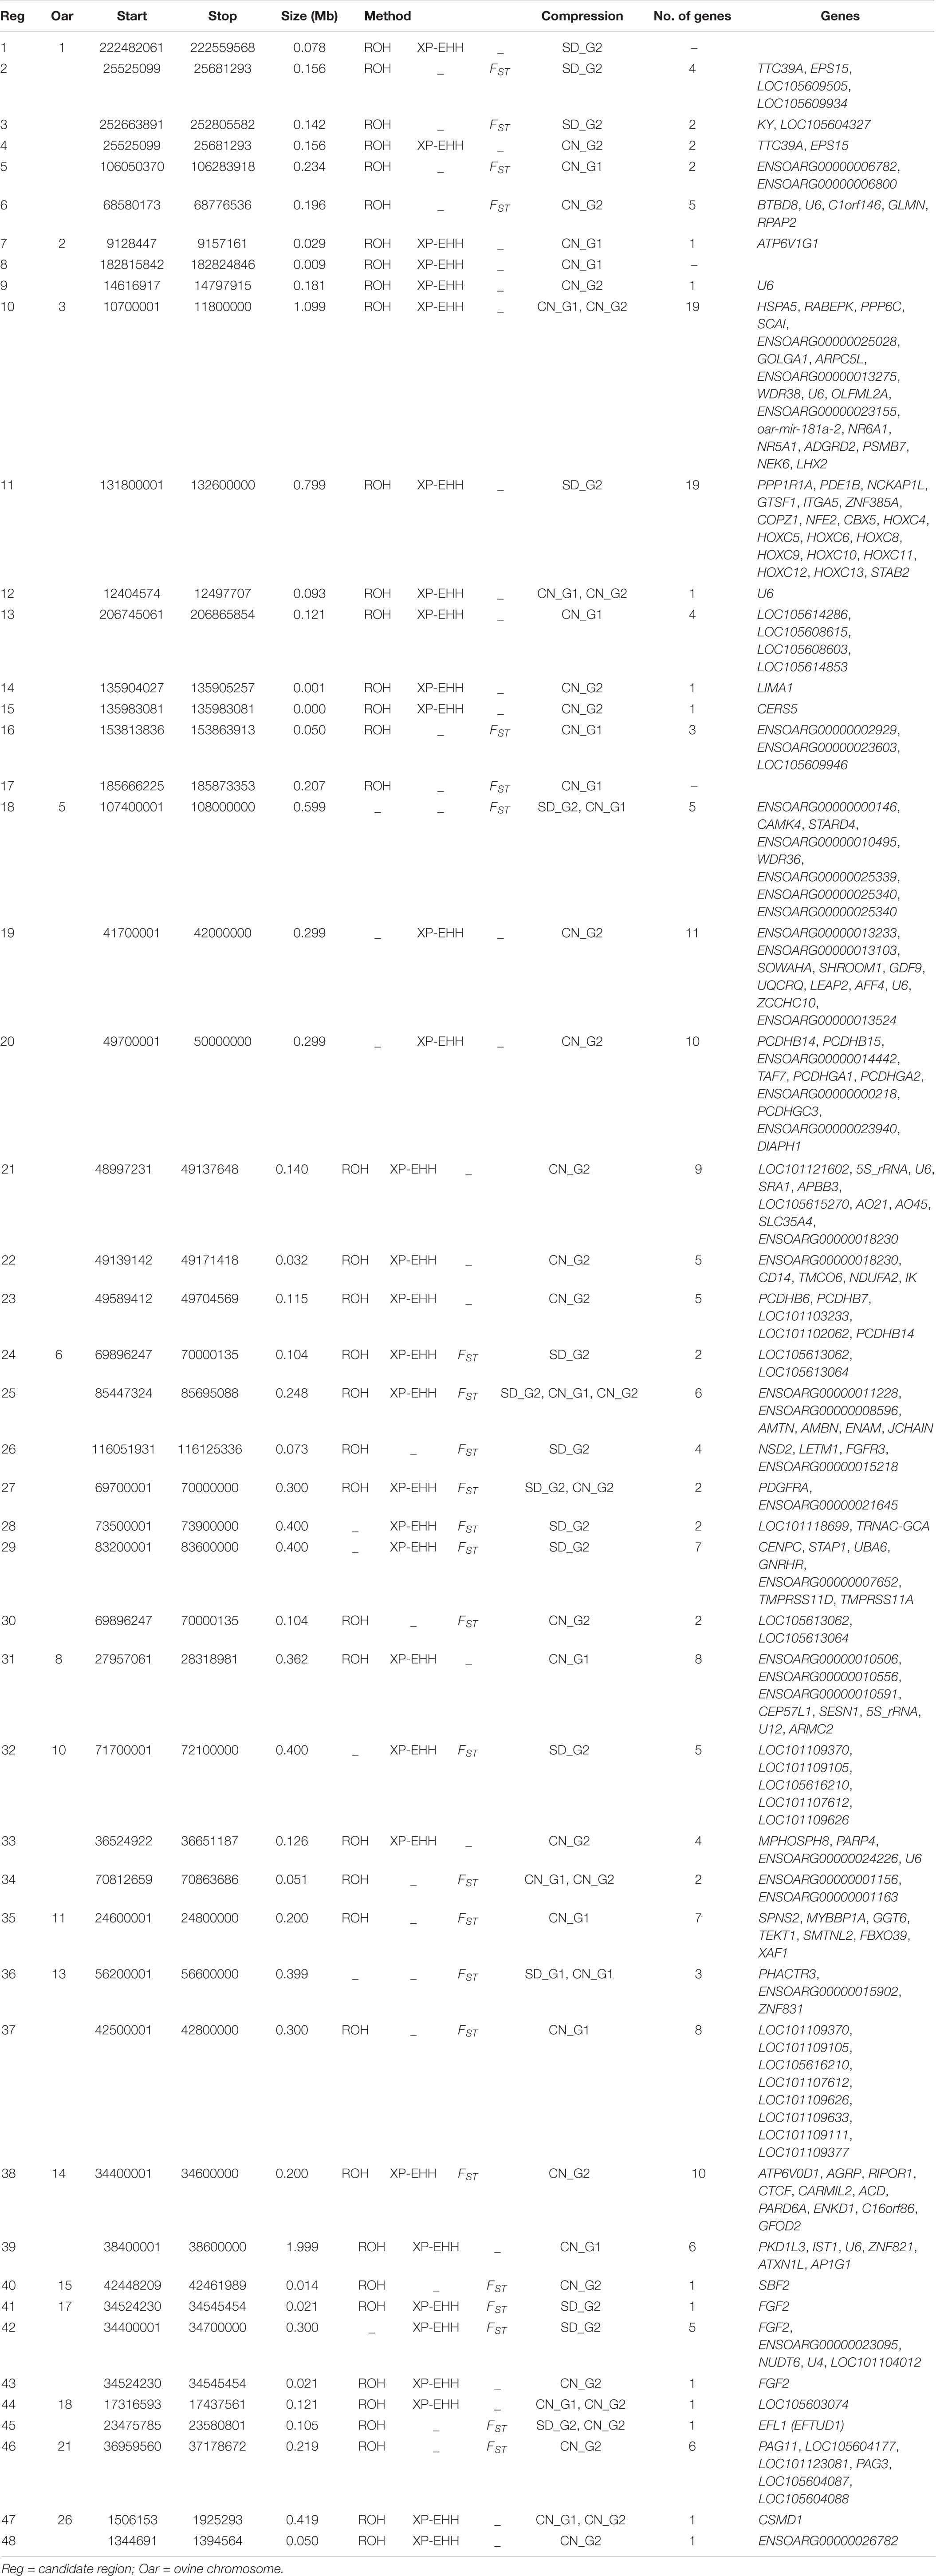
Table 2. Candidate regions detected by at least two approaches of selection signature analysis in the SD_G1 (AL) sheep group.
The XP-EHH identified 32 candidate regions in the comparative analysis between SD_G1 and SD_G2 (Figure 5A). These regions spanned 73 putative genes and the most significant region was the same as that identified by ROH on OAR3 (Table 2). Between SD_G1 and CN_G1, XP-EHH identified 34 candidate regions (Figure 5B) and against CN_G2, it identified 46 candidate regions (Figure 5C). These regions spanned 83 and 225 genes, respectively. The most significant region with CN_G1 was on OAR6 (85,447,324–85,695,088 bp) and spanned six genes while the one with CN_G2 occurred on OAR14 (34,400,001–34,600,000 bp) and spanned 10 genes (Table 2). The XP-EHH analysis between SD_G2 and CN_G1 (Figure 5D) or CN_G2 (Figure 5E) identified 31 and 46 candidate regions which spanned 83 and 208 genes, respectively. The most significant regions occurred on OAR10 (78,200,001–78,500,000 bp) and OAR14 (34,400,001–34,600,000 bp) spanning 7 and 10 putative genes (Table 3), respectively.
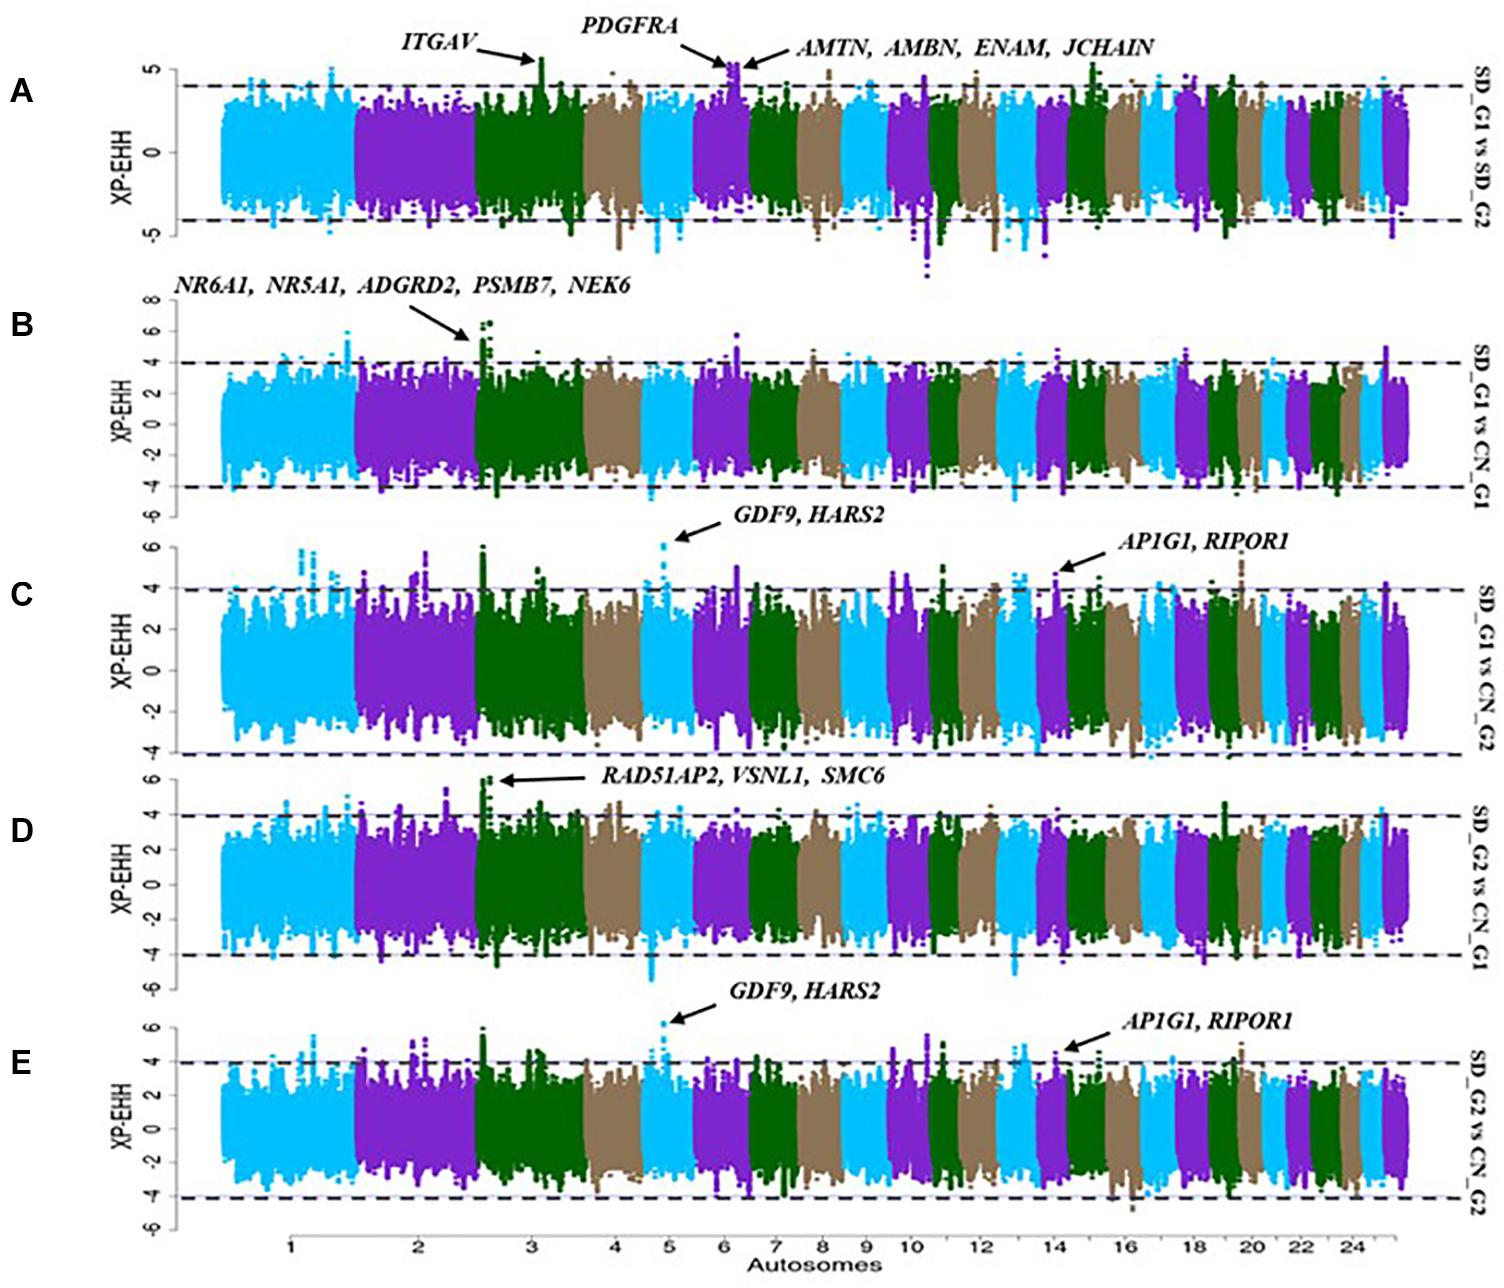
Figure 5. Manhattan plots showing the candidate signatures of selection as determined with XP-EHH. (A) SD_G1 vs. SD_G2; (B) SD_G1 vs. CN_G1; (C) SD_G1 vs. CN_G2; (D) SD_G2 vs. CN_G1; (E) SD_G2 vs. CN_G2.
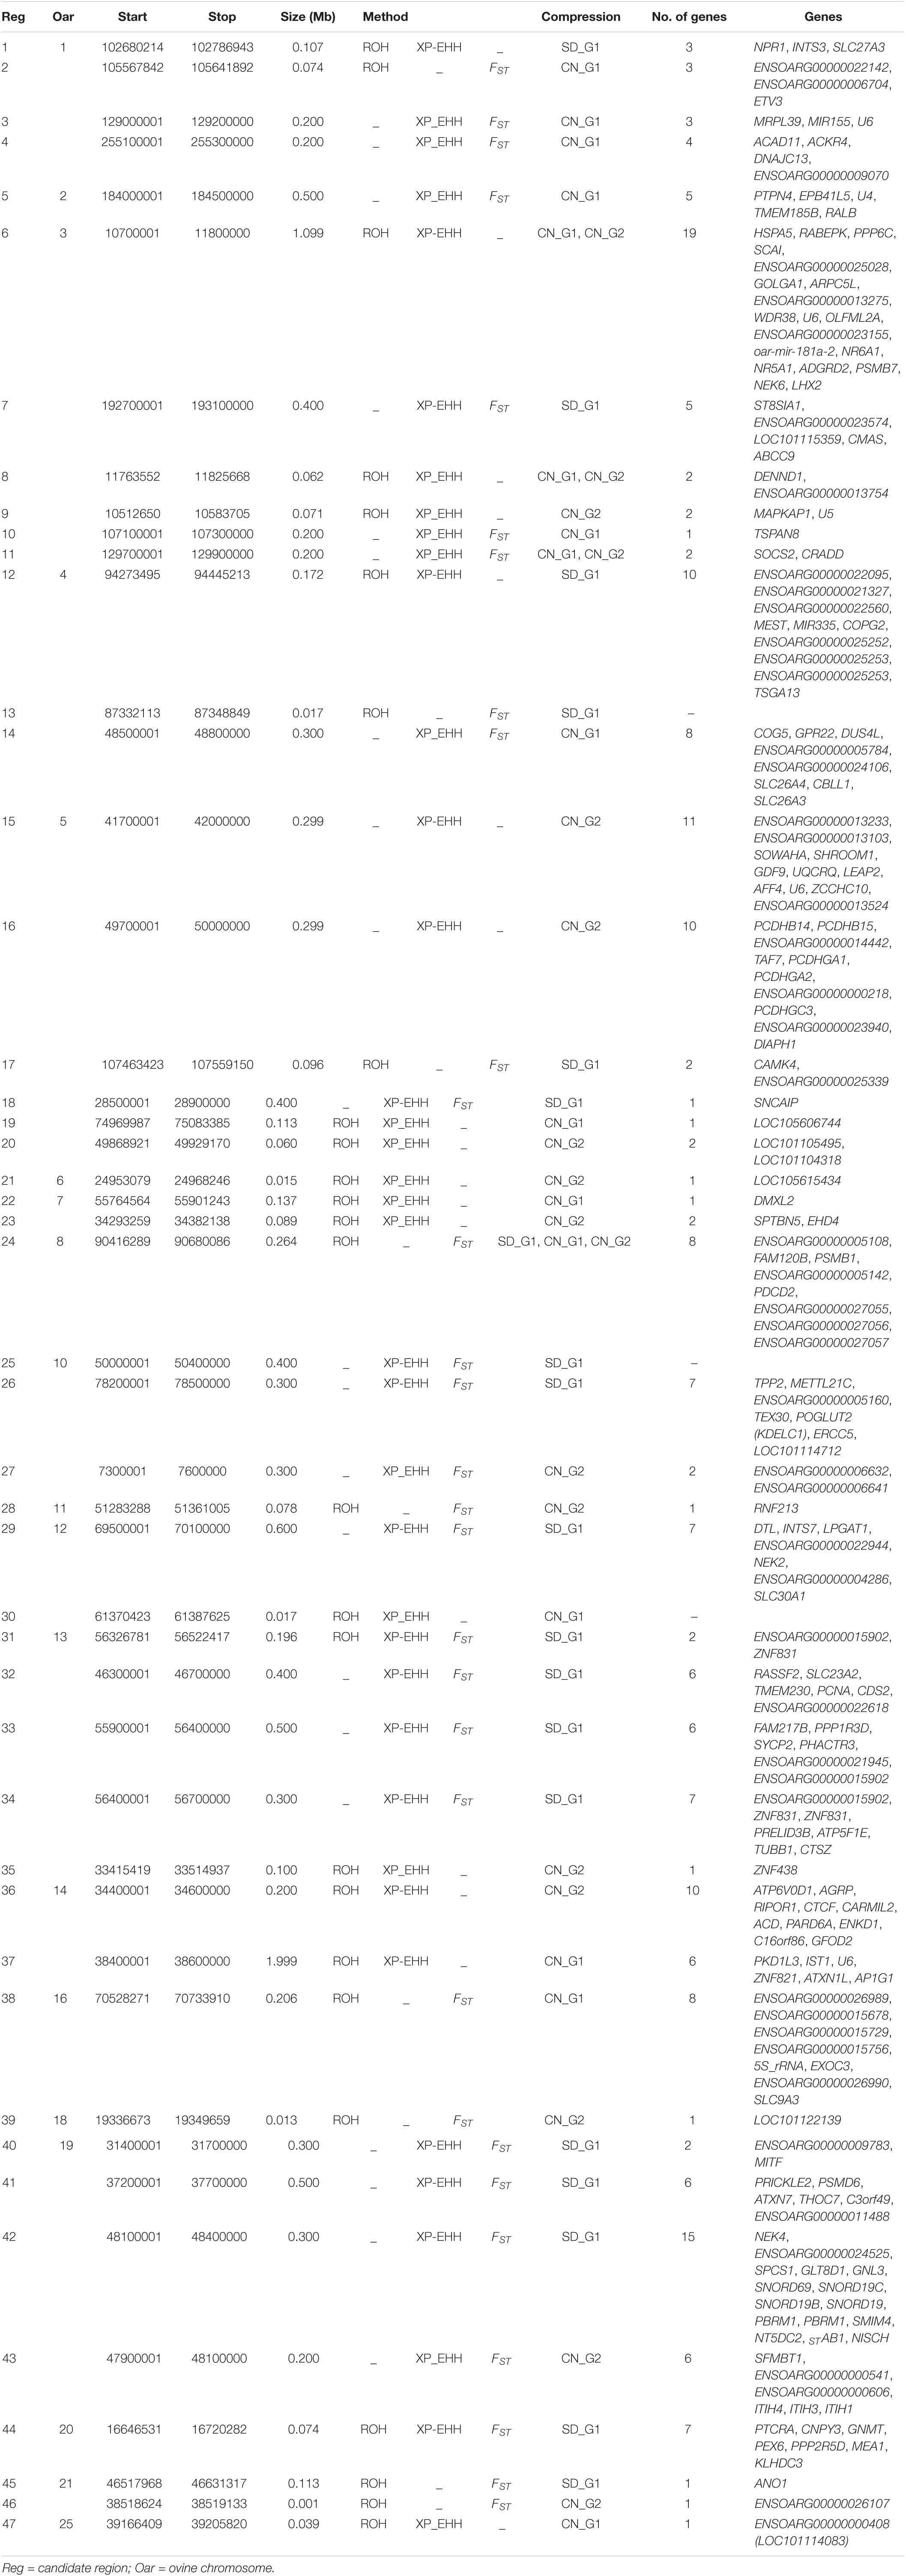
Table 3. Candidate regions detected by at least two approaches of selection signature analysis in the SD_G2 sheep group.
The FST analysis identified 73 candidate regions with extreme allele frequency differentiation between SD_G1 and SD_G2 (Figure 6A), which spanned 288 putative genes. The most significant region was on OAR6 (69,700,001–70,000,000 bp) spanning two genes (Table 2). Between SD_G1 and CN_G1, FST revealed 24 regions spanning 56 genes (Figure 6B) and between SD_G1 and CN_G2, it identified 38 regions spanning 89 genes (Figure 6C). For SD_G2, FST identified 35 and 33 candidate regions that differentiated the group with CN_G1 and CN_G2, respectively. These regions spanned 107 and 68 genes, respectively, and the most significant regions occurred on OAR20 (16,646,531–16,720,282 bp) and OAR3 (129,700,001–129,900,000 bp) spanning seven and two genes (Table 3), respectively.
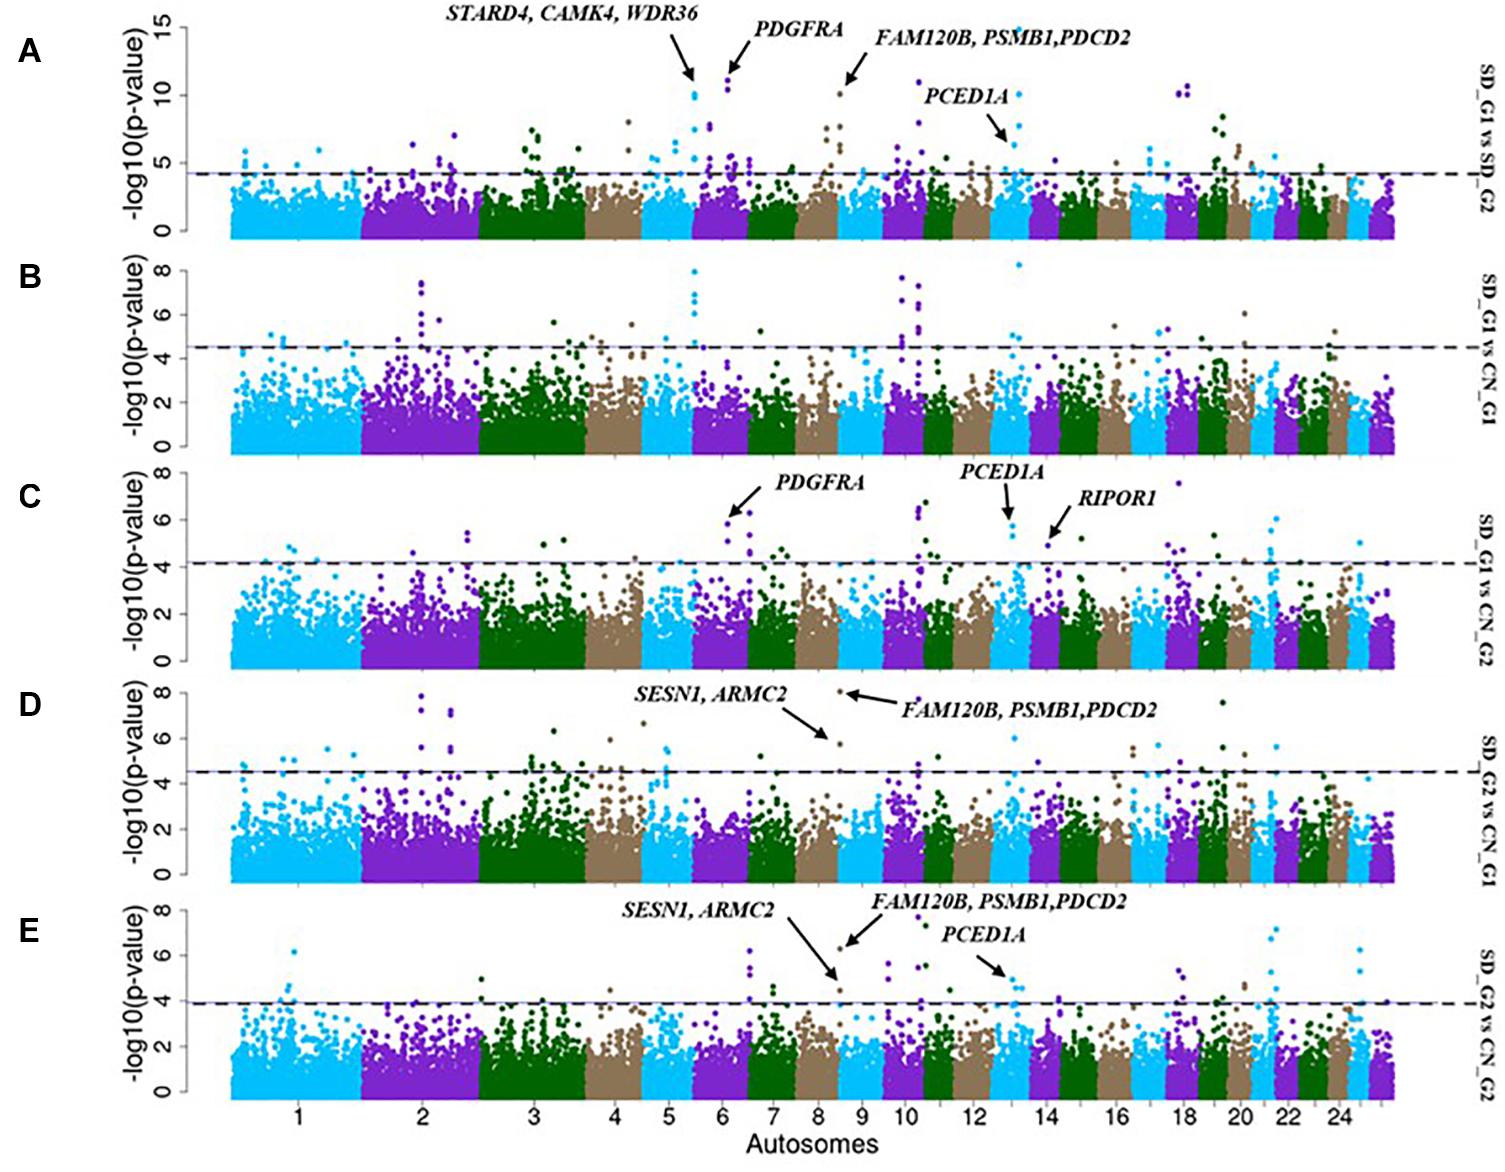
Figure 6. Manhattan plots showing the candidate signatures of selection as determined with FST. (A) SD_G1 vs. SD_G2; (B) SD_G1 vs. CN_G1; (C) SD_G1 vs. CN_G2; (D) SD_G2 vs. CN_G1; (E) SD_G2 vs. CN_G2.
In general, there were 48 candidate regions in SD_G1, overlapping 206 genes that were simultaneously identified by a combination of at least two methods (ROH, FST and/or XP-EHH) and/or two comparative analyses (SD_G1 verses SD_G2/CN_G1/CN_G2) (Table 2). Among these regions, 39 were identified by ROH with either FST or XP-EHH, four by all the three approaches and five by FST and XP-EHH. For SD_G2, 47 candidate regions overlapping 209 genes across 18 autosomes were identified by a combination of at least two approaches and/or two comparative analyses (Table 3). Among these regions, 24 were identified by a combination of ROH with either FST or XP-EHH, two by all the three approaches and 19 by FST and XP-EHH.
The three approaches (ROH, XP-EHH, and FST) identified a total of 697 and 765 putative genes that overlapped with candidate regions identified in SD_G1 (Table 4) and SD_G2 (Table 5), respectively. These genes were used for GO and enrichment analyses for each group and the top-most significant GO terms and KEGG pathways are shown in Tables 4, 5. The “hyaluronan metabolic process (GO:0030212)” is the most common GO term across the comparisons. Since it is associated with a wide range of functions (Stern et al., 2006), it may be relevant to the two groups of Sudanese thin-tailed Desert sheep.
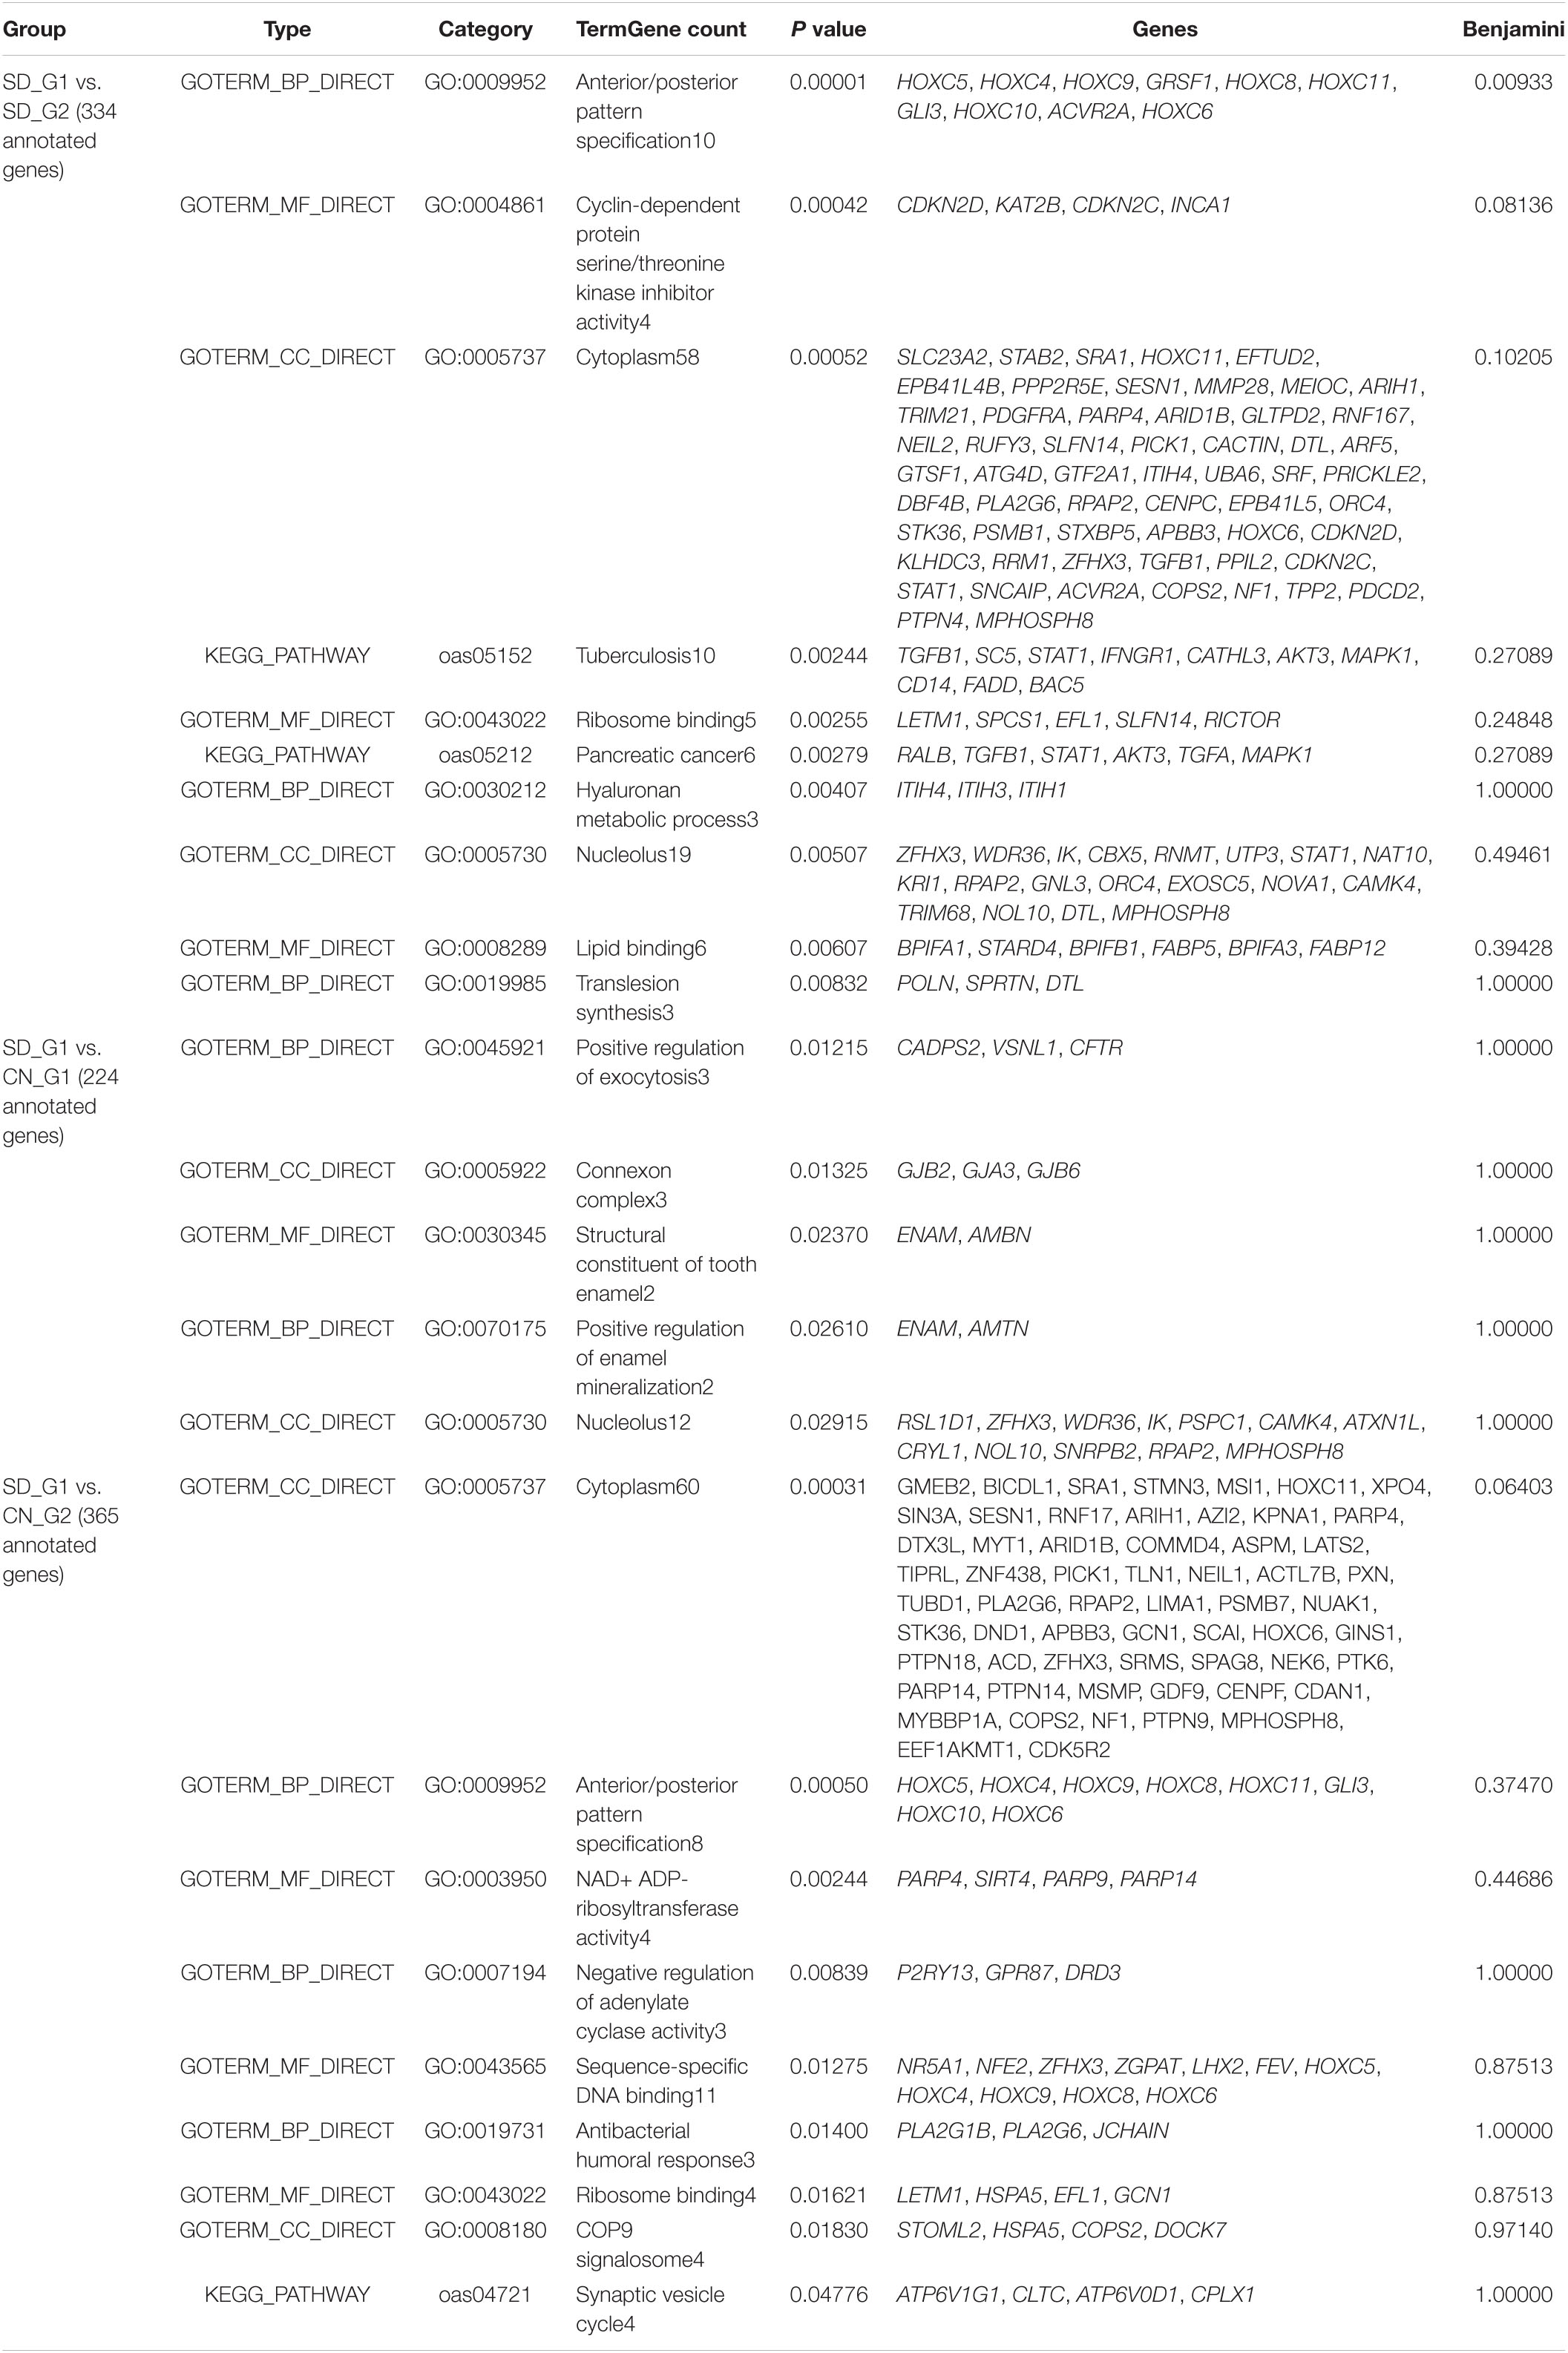
Table 4. Enriched functional terms and their enrichment scores following DAVID analysis for genes identified by all methodologies in the SD_G1 (AL) Sudanese sheep group.
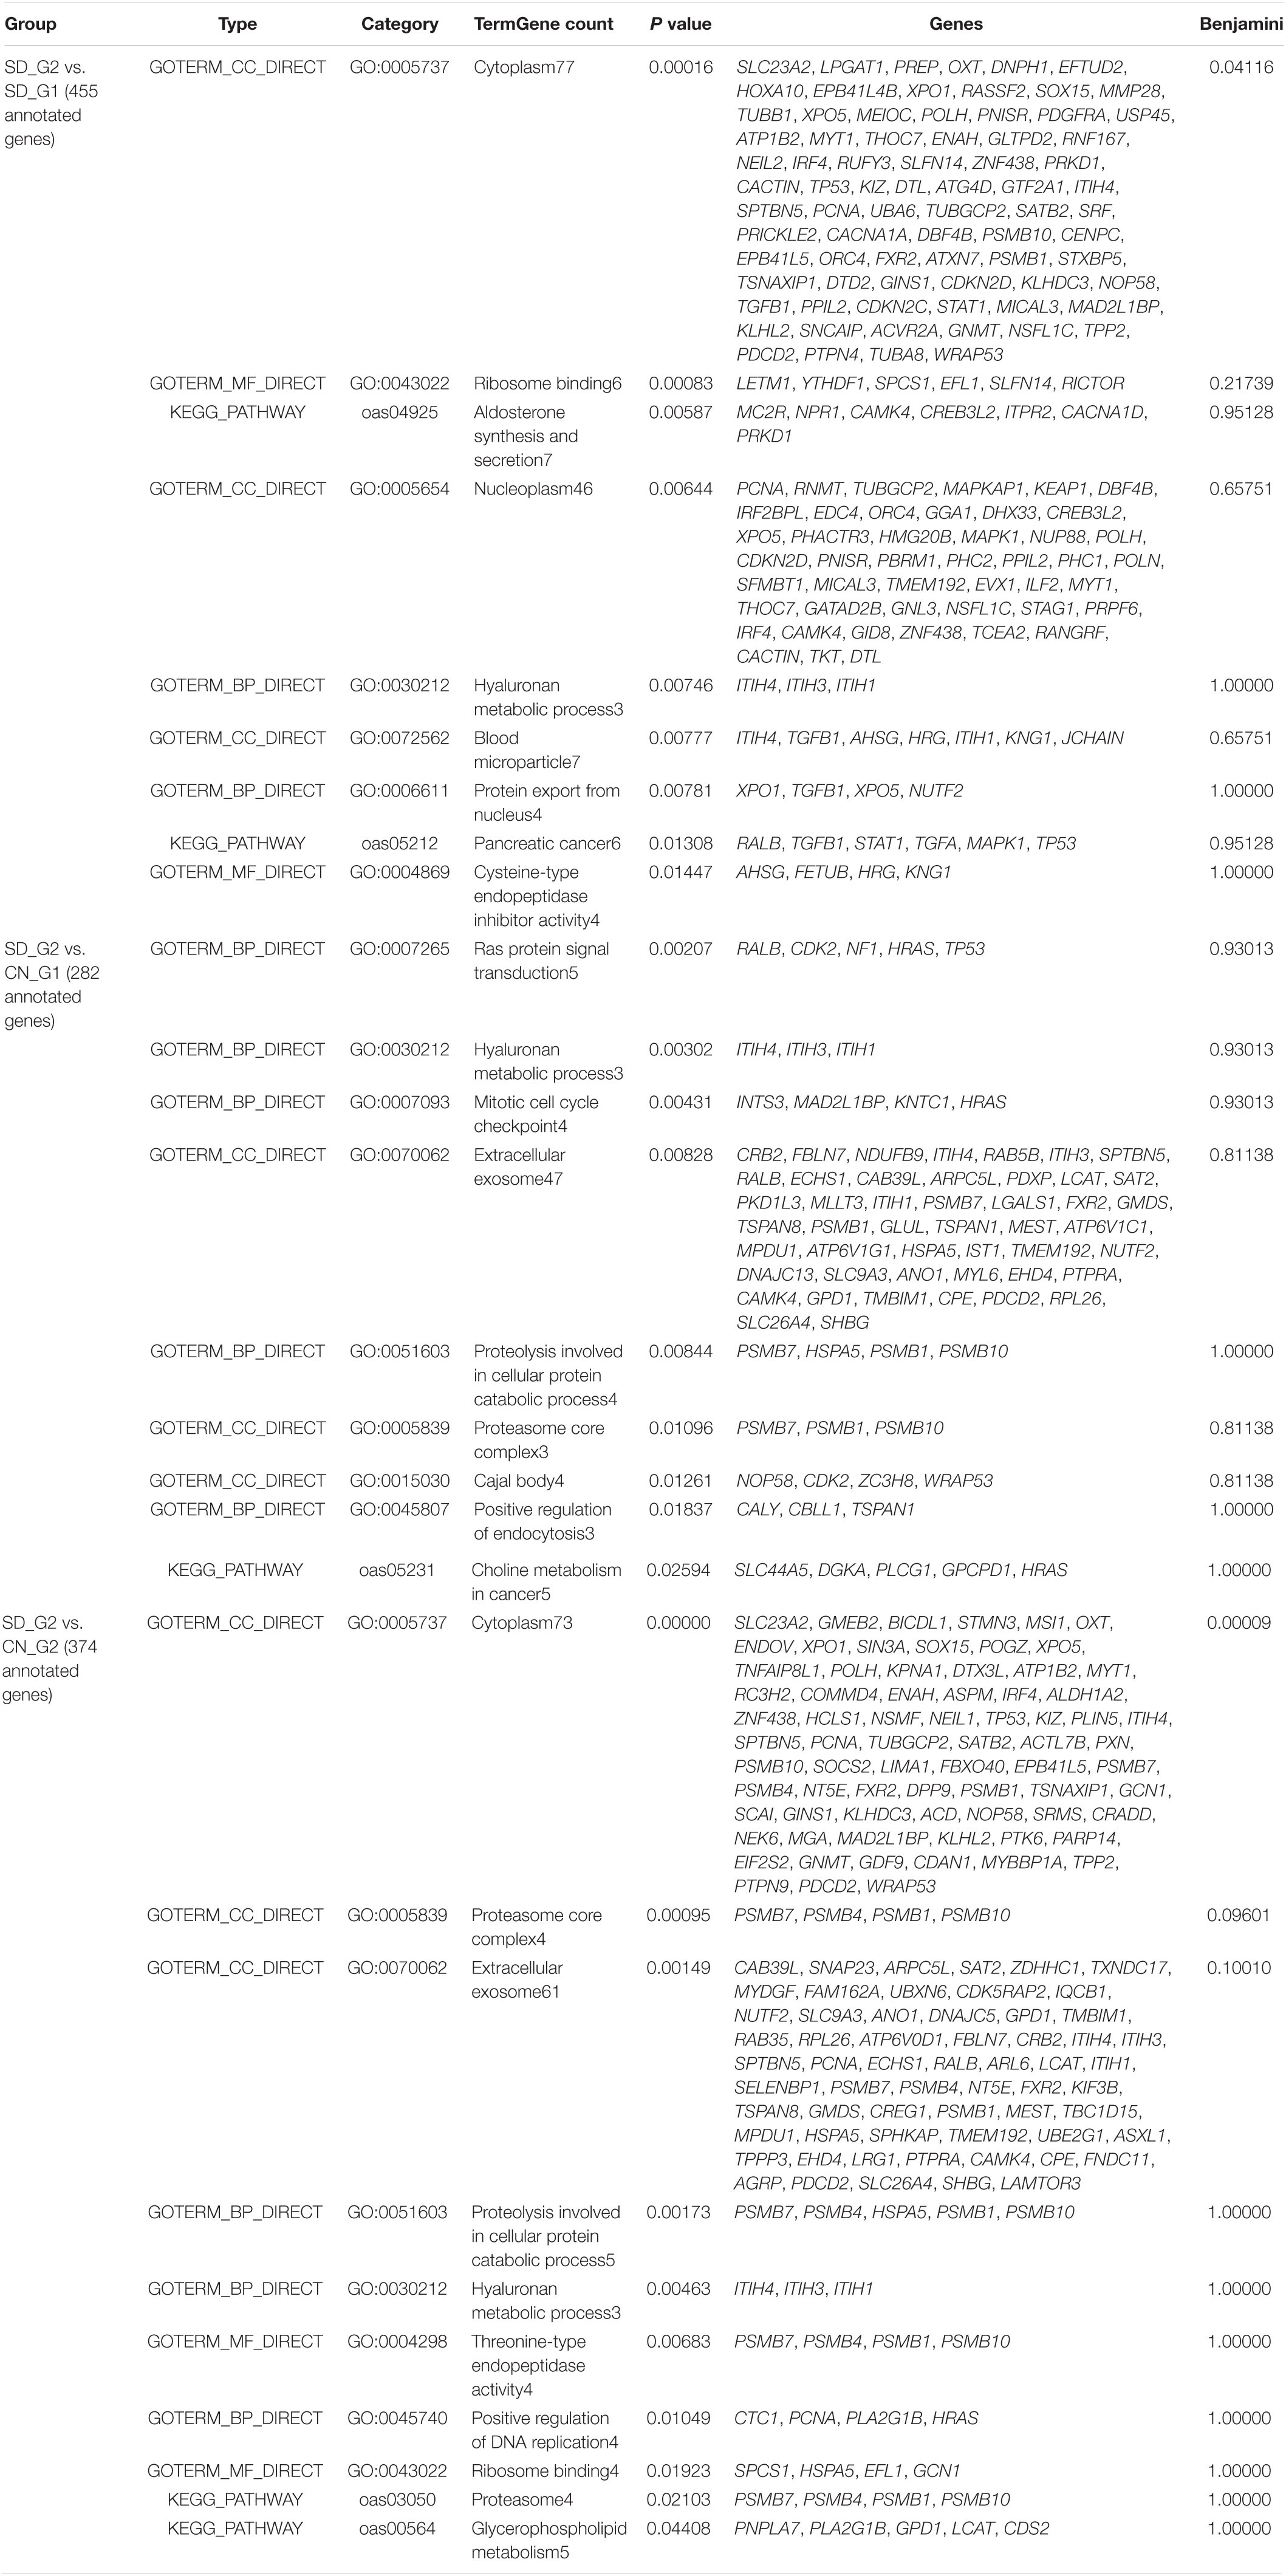
Table 5. Enriched functional terms and their enrichment scores following DAVID analysis for genes identified by all methodologies in the SD_G2 (BU, HA, KA, and SH) Sudanese sheep group.
Discussion
The history of indigenous livestock and their physiological, anatomical and genetic responses to natural and artificial selection is at the core of their diversity (phenotypic and genetic) and resilience. Here, we present findings of the analysis of genomic variation in the indigenous African long-legged thin-tailed Desert Sheep from Sudan. The overall average HO and HE for the Sudanese thin-tailed Desert Sheep exceeded 0.300, suggesting high genetic variation. The values for the individual ecotypes are, however, similar to those reported in Barki sheep (Kim et al., 2016), an indigenous breed from a hot desert environment in Egypt, are higher than the values reported in Ethiopian sheep (Edea et al., 2017), but fall within the range reported in sheep raised by South African smallholder farmers (Molotsi et al., 2017) and in New Zealand breeds (Brito et al., 2017). The level of diversity in the four Chinese breeds analyzed here is similar to that of the Sudanese thin-tailed Desert Sheep in spite some of the breeds, such as the Tan Sheep and HZ having been exposed to artificial selection. Ascertainment bias and deliberate avoidance of inbreeding in the Chinese breeds could explain this result. The former should however be seen from the context that the Ovine Infinium® HD SNP BeadChip carries assays for 606,006 loci with an average spacing of around 5 kb across the genome. These loci were selected from groups that differed in their MAF across 75 animals from an international panel of 34 domestic sheep breeds and two wild species of sheep (Bighorn and Thinhorn) (Anderson et al., 2014). The chip was also validated using 288 samples, generating 99% average call rates across SNPs and animals, and a call rate repeatability of 99.9978%.
The lack of stringent artificial selection coupled with random mating in the Sudanese thin-tailed Desert Sheep may explain their high levels of genetic diversity but low levels of genetic differentiation and inbreeding. The former may be enhancing their fitness and could be responsible for their adaptive resilience to the desert environments where they are raised.
We investigated demographic dynamics by assessing the trends in LD over genomic distances and NE over the past 1,000 generations. All the samples analysed showed a rapid decay in LD within the first 300 kb. From around 0.1 Mb, the Chinese breeds had higher r2 values, which most likely reflected an attempt at their standardization as distinct breeds compared to the Sudanese thin-tailed Desert Sheep, where such efforts are lacking. However, for both subsets, the r2 values averaged below 0.15, suggesting very limited extension of high LD blocks across their genomes. This r2 value ranked below the minimum threshold range of 0.33 ≤ r2 ≤ 0.80 that is meaningful for GWAS (Ardlie et al., 2002; Carlson et al., 2004). Much denser marker coverage may thus be required for association analysis in the thin-tailed Desert Sheep and the Chinese breeds. Besides its importance for mapping traits, LD allows the estimation of NE over generation time (Pritchard and Przeworski, 2001), acts as a significant genetic parameter for understanding population dynamics and can act as a measure of long-term performance of a population with regard to diversity and inbreeding (Fernández et al., 2005), and is useful for evaluating the risk status of populations/breeds (FAO, 1998; Duchev et al., 2006). A contraction in NE from 270 and 500 generations ago was revealed in both the Sudanese thin-tailed Desert Sheep and the Chinese breeds, respectively. These contractions appeared not to have resulted in a concomitant reduction in genetic diversity. The contraction in the Chinese breeds may be associated with the start of their establishment as distinct breeds while that in the Sudanese thin-tailed Desert Sheep is difficult to explain. However, whole-genome sequence analysis has revealed declines in NE in Ethiopian, Libyan and Sudanese sheep (Ahbara, 2019) and in Ethiopian goats based on the analysis of 50K SNP genotype data (Tarekegn et al., 2020). Mbole-Kariuki et al. (2014) also reported a bottleneck event in East African shorthorn Zebu cattle from western Kenya. The reduction in population sizes of the other African sheep and goat populations falls within the time period of the shrinkage in Sudanese thin-tailed Desert Sheep, while that of the East African shorthorn Zebu cattle started around 240 years ago. Historical fluctuations in climatic patterns resulting in cycles of favorable and deteriorating conditions in the continent (Verschuren, 2007) have been used to explain the fluctuations in NE.
The NJ phylogeny, PCA and ADMIXTURE allowed us to reveal the underlying genetic structure and divergence in the datasets analysed. We hypothesized that the ADMIXTURE pattern at K = 3, which was supported by NJ phylogeny and PCA, revealed an underlying broad-scale genetic structure as it showed (i) a separation of African sheep from the Chinese breeds, (ii) a separation of fat-tailed sheep (Tan breed) from both African and Chinese thin-tailed sheep, and (iii) different genetic backgrounds in both the African and the Chinese thin-tailed sheep. While the first result suggest genetic divergence that has most likely arisen due to reproductive isolation between sheep in different continents coupled with genetic drift, the second result confirm the existence of differences in genetic makeup of fat-tailed and thin-tailed sheep. A similar result based on the analysis of microsatellites was reported previously between African fat-tailed and thin-tailed sheep (Muigai, 2003). Furthermore, the divergence of the fat-tailed Tan Sheep from the other Chinese breeds can be due to artificial selection for lamb pelt and lustrous white curly fleece in the Tan sheep. The clear divergence between the Sudanese thin-tailed Desert Sheep and the Chinese thin-tailed sheep suggest at least two possibilities: (i) the domestication of at least two autosomal gene pools of thin-tailed sheep in the Fertile Crescent and their subsequent independent dispersal westwards to Africa and eastwards to China, and (ii) the dispersal of one gene pool followed by genetic divergence driven by genetic drift due to reproductive isolation and natural selection driving adaptation to low altitude hot arid environments in Africa or high altitude alpine arid environments in China. Although mitogenome analysis has identified two waves of sheep migration comprising three maternal lineages across eastern Eurasian (Lv et al., 2015), the study did not include sheep from Africa and therefore the first scenario is difficult to ascertain. We therefore favor the second scenario given that recent analysis of autosomal genomic data has provided compelling evidence for climate-mediated selection pressure driving genetic divergence in sheep (Lv et al., 2014) while differences in precipitation affecting feed availability has also been shown to drive variation in natural selection at a global scale (Siepielski et al., 2017).
A combination of NJ phylogeny, PCA and ADMIXTURE (K > 5) results also revealed what we hypothesized to be a fine-scale genetic structure among the individuals analyzed. The analyses revealed at least two distinct genetic clusters in the Sudanese thin-tailed Desert Sheep; one which was specific to AL and another to the four remaining ecotypes. The analyses also identified two genetic clusters in the Sudanese thin-tailed sheep from China: one cluster was exclusive to HZ and another occurred in QOL and ZK and at low frequency in HZ. Given that the five ecotypes of thin-tailed Desert Sheep are all derived from a low altitude hot arid environment while the Chinese thin-tailed breeds are adapted to an alpine/sub-alpine high-altitude rangeland, this fine-scale genetic structure was unexpected. It may hint at a complex genome architecture in the thin-tailed sheep because it cannot be explained by differential selection for adaptation. It is, however, likely that artificial selection may be driving the divergence in the Chinese thin-tailed sheep. With a common genomic background observed in QOL and ZK and the same occurring at a low frequency in HZ, it suggests that HZ has been gradually diverging from QOL and ZK. HZ has a predominantly black coat while QOL and ZK have mainly white coats with some black to brown patches around heads and legs. QOL and ZK also occur in close geographic proximity and can thus cross mate while HZ is isolated and farmers keeping this breed avoid mating it with other breeds, so as to maintain its distinct black coat, genetic purity and recognition.
We investigated molecular signatures of selection to gain insights on the divergence of SD_G1 and SD_G2 genetic clusters of the Sudanese thin-tailed Desert Sheep. For this reason, we used three approaches and contrasted SD_G1 and SD_G2 with each other and with two of the genetic clusters: CN_G1 and CN_G2 observed in Chinese sheep. We used the ROH analysis to provide evidence for selection within a cluster. If such signatures overlapped with those identified by FST and/or XP-EHH and were observed in at least two comparative analyses, then we took this to be a reliable evidence of positive selection in the specific genetic cluster. We therefore limited our discussion to the putative genes found within the candidate regions that overlapped between at least two approaches and in more than two comparative analyses involving the two genetic groups observed in the Sudanese thin-tailed Desert Sheep (Tables 2, 3).
Based on our criteria, nine candidate regions that overlapped between at least two approaches and were observed in at least two comparative analyses were identified in SD_G1. These candidate regions were located on OAR3, 5, 6 (two regions), 10, 13, 18 (two regions), and 26 (one region) (Table 2). Within these candidate regions, we found genes that are associated with functions relating to adaptation to abiotic and biotic factors and morphology. For instance, the most significant region on OAR6 (Figures 7, 8) spanned six genes, one of which was AMBN (ameloblastin), a candidate gene for gastrointestinal nematode resistance in sheep (Atlija et al., 2016; Berton et al., 2017). The PDGFRA gene occurred in another candidate region on OAR6 (Figures 7, 8). It has been reported to be a key gene in cytokine signaling and was observed to be amongst genes in biological pathways that are involved in host immune responses against parasitic infections (Benavides et al., 2015). PDGFRA has also been reported to be tightly associated with the dominant white coat color in the pig (Johansson et al., 1992; Moller et al., 1996). Nazari-Ghadikolaei et al. (2018) also found significant association between PDGFRA and KIT with white coat color in Markhoz goat from Iran. The white coat color predominated in AL based on field observations made by the first author during sampling. PDGFRA has also been linked to fat deposition in Libyan long fat-tailed sheep (Mastrangelo et al., 2019) while CAMK4 found on OAR5 has been associated with tail morphology and fat deposition in sheep (Moradi et al., 2012; Ma et al., 2018; Ahbara et al., 2019; Li et al., 2020). These results likely suggest that divergent selection for parasite resistance, coat color, differential fat deposition and tail morphology may explain the divergence of SD_G1. With the lack of phenotypic data, our suggestions would need to be confirmed with more detailed studies that include an assessment of appropriate phenotypes.
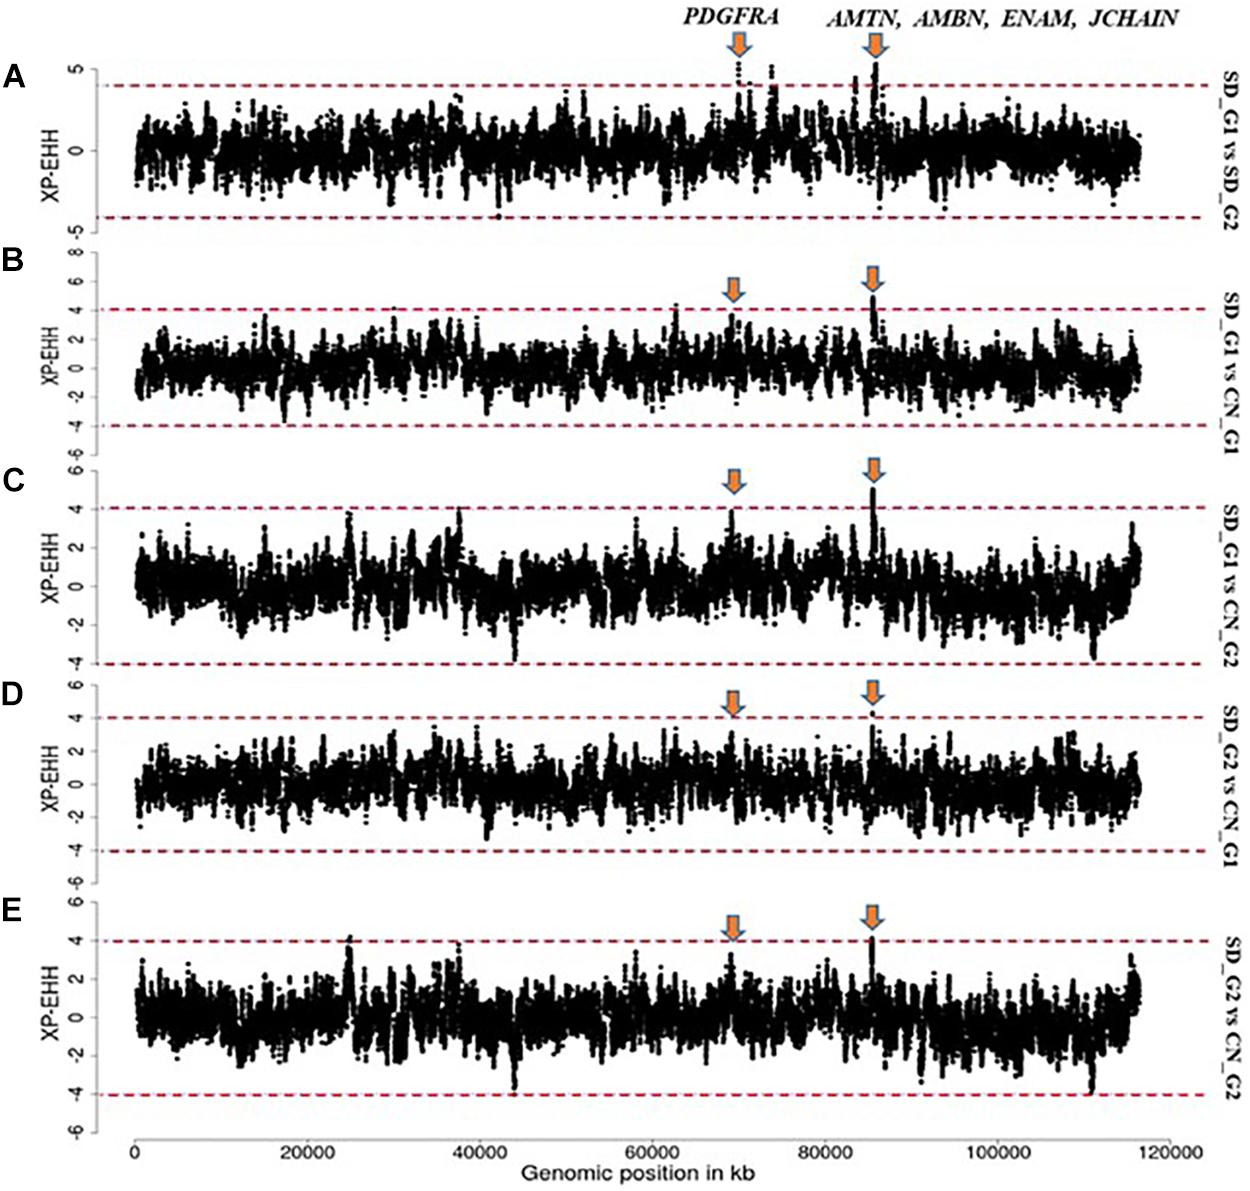
Figure 7. Manhattan plots showing the strongest candidate signatures of selection as determined with XP-EHH on OAR6. (A) SD_G1 vs. SD_G2; (B) SD_G1 vs. CN_G1; (C) SD_G1 vs. CN_G2; (D) SD_G2 vs. CN_G1; (E) SD_G2 vs. CN_G2.
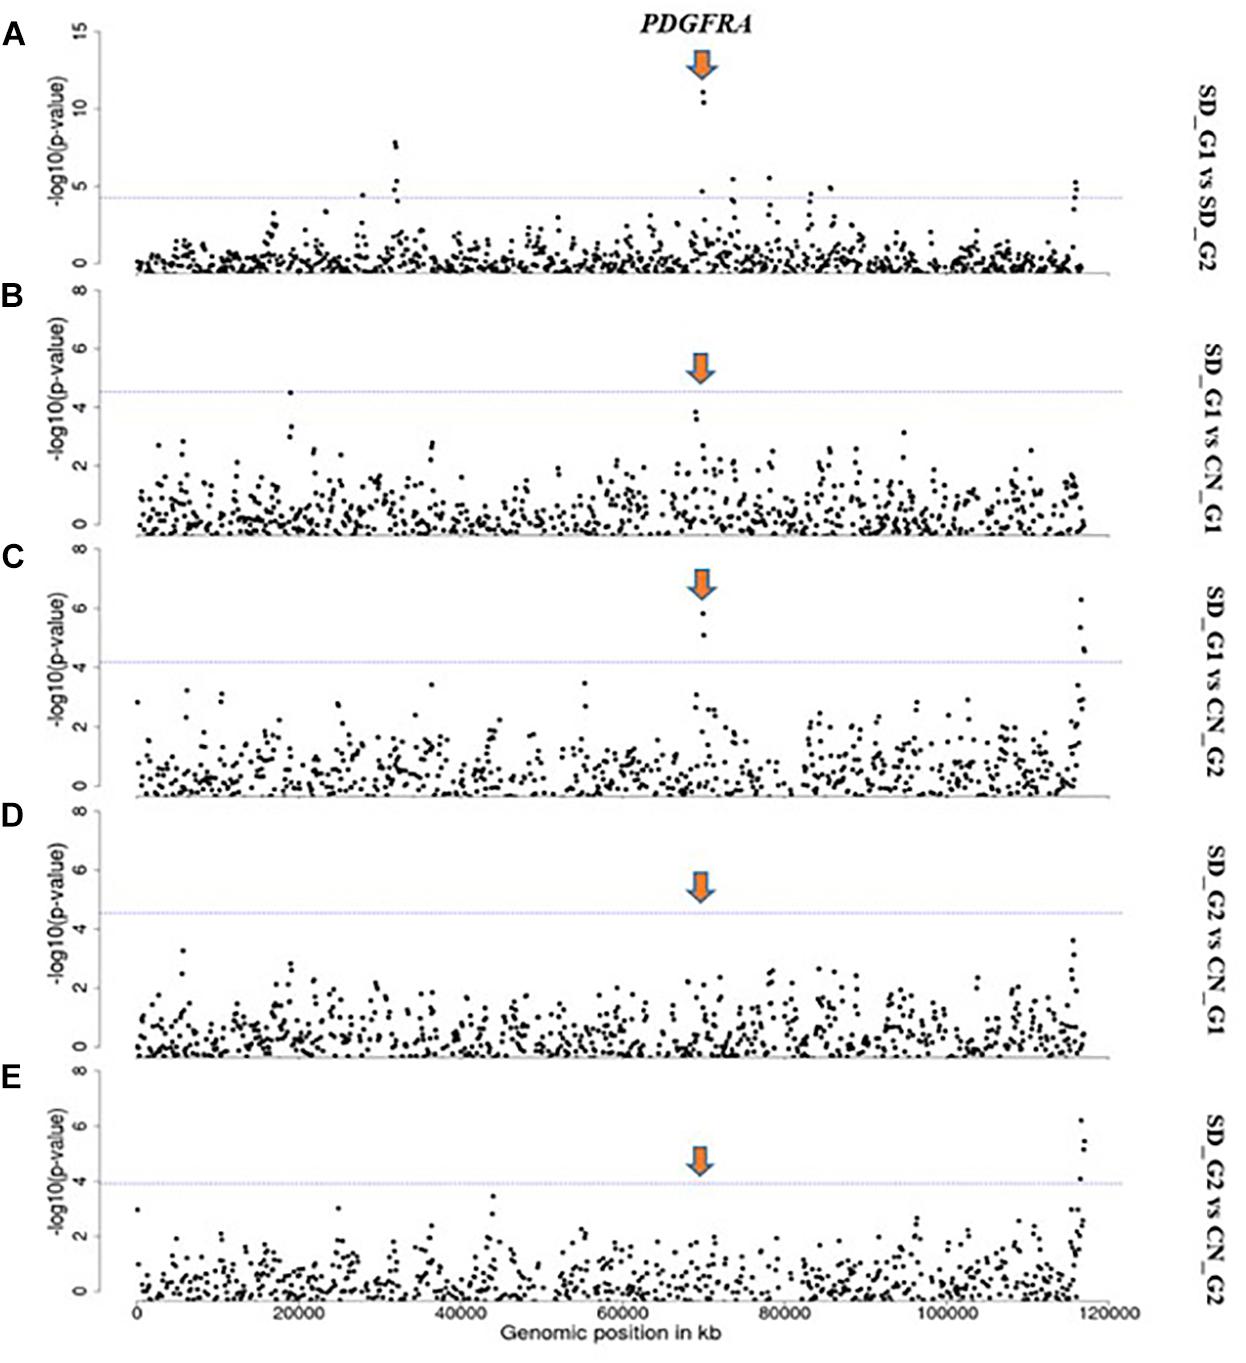
Figure 8. Manhattan plots showing the strongest candidate signatures of selection as determined with FST on OAR6. (A) SD_G1 vs. SD_G2; (B) SD_G1 vs. CN_G1; (C) SD_G1 vs. CN_G2; (D) SD_G2 vs. CN_G1; (E) SD_G2 vs. CN_G2.
Our criteria also revealed four candidate regions that overlapped between at least two approaches and in at least two comparative analyses in SD_G2 (Table 3). These regions were observed on OAR3 (three regions) and OAR8 (one region). The region on OAR8 was the strongest and it spanned three genes, FAM120B, PSMB1, and PDCD2. FAM120B has been suggested to be a potential candidate for twinning rate in humans (Painter et al., 2010) and in lowly ovulating mammals (Vinet et al., 2012). The PSMB1, which was the top candidate gene at this region, has been associated with functional adaptation of the transcriptome to mastitis-causing pathogens in mammary gland of livestock (Loor et al., 2011). The SOCS2, which was found in one of the candidate regions on OAR3, has been linked with body weight and milk production, and an increased susceptibility to inflammation of mammary glands (Rupp et al., 2015). It is important to take note that most pastoral societies in Africa prefer larger sized animals with higher milk production as offspring from such animals are thought to thrive better in hot arid environments. This indirect preference for such individuals may be responsible for this selection signal. SOCS2 has also been reported to play important roles in key adaptive phenotypes in sheep, including general immune response following infection (Yang et al., 2015; Al Kalaldeh et al., 2019) and resistance to gastrointestinal nematode (Haemonchus contortus) (Estrada-Reyes et al., 2019). The proteasome PSMB7 and the heat shock protein HSPA5, both found in the region on OAR3, were reported to be upregulated during blastocyst implantation in hamsters (Lei et al., 2014). These results suggest that the divergence of SD_G2 could be associated with differential resistance to bacterial infections, productive and reproductive performance. However, as for SD_G1, this finding will need to be investigated further with much detailed analyses of individuals with relevant phenotypes.
The candidate region on OAR3 (10,700,001–11,800,000 bp) differentiated both SD_G1 (Table 2) and SD_G2 (Table 3) from both CN_G1 and CN_G2 (Figure 9) and was therefore of interest. The top significant window at this region spanned five genes (NR6A1, NR5A1, ADGRD2, PSMB7, and NEK6) and the top-most significant position was close to NR5A1. The expression of NR5A1 drives Leydig cell differentiation from progenitor cells (Barsoum and Yao, 2010), thus initiating steroidogenesis (Martin and Tremblay, 2010). In mice, NR5A1 has been shown to be essential in the formation of pituitary, gonad and adrenal glands (Luo et al., 1994). Another region that differentiated SD_G1 and SD_G2 from both CN_G1 and CN_G2 occurred on OAR14. Two genes were present in this region, one of which was AP1G1. Proteomic analysis of sheep uterus has revealed the role of AP1G1 in prolificacy (La et al., 2020). Whether the function of NR5A1 and AP1G1 suggested inherent genetic differences in fertility and prolificacy between the Sudanese thin-tailed Desert Sheep and the Chinese breeds is difficult to say in the absence of appropriate phenotype data. Strong evidence suggests that NR6A1 is a strong candidate gene underlying vertebrae number in domestic pigs (Mikawa et al., 2007; Rubin et al., 2012) and the number of thoracic vertebrae in domestic sheep (Li et al., 2019). From a phenotypic perspective, this result is interesting as it suggests that the Sudanese thin-tailed Desert Sheep can be differentiated from the Chinese thin-tailed sheep based on the number of vertebrae. Indeed, the tail of Sudanese sheep consists of 23 caudal vertebrae (Ahbara, 2019), while that of Chinese sheep comprises less than 18 (Zhi et al., 2018).
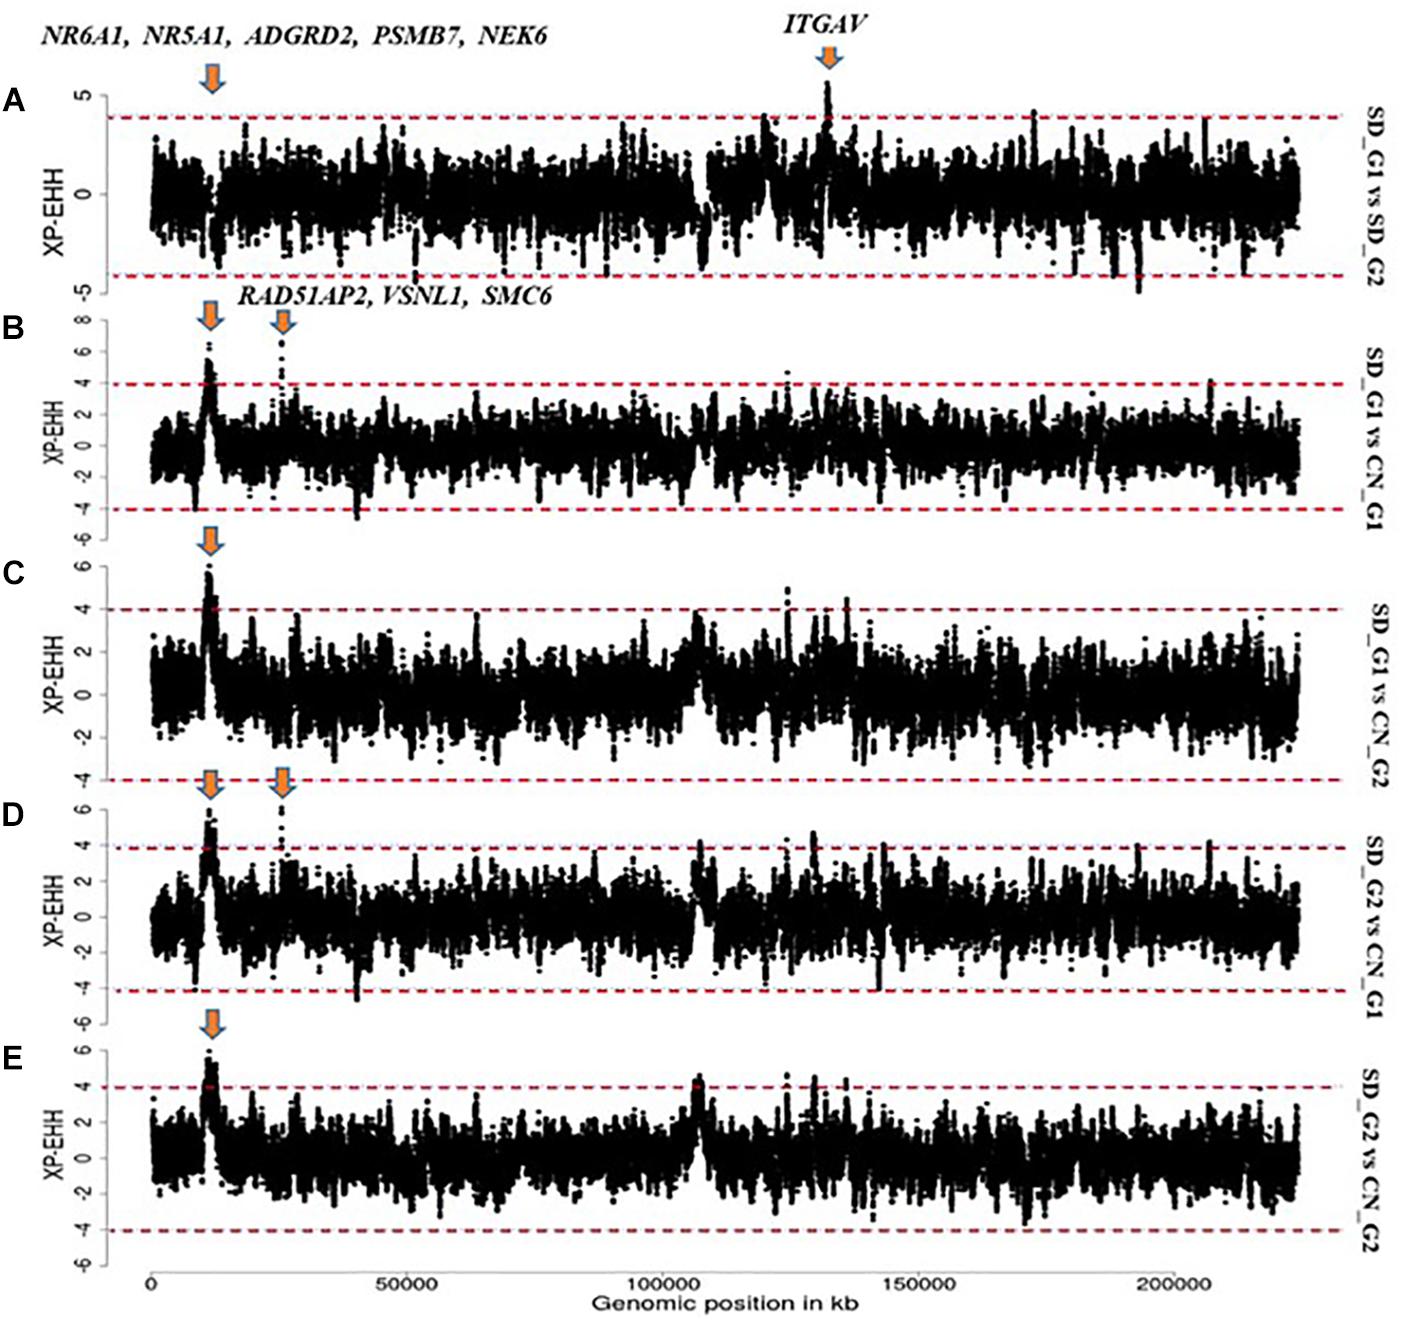
Figure 9. Manhattan plots showing the strongest candidate signatures of selection as determined with XP-EHH on OAR3. (A) SD_G1 vs. SD_G2; (B) SD_G1 vs. CN_G1; (C) SD_G1 vs. CN_G2; (D) SD_G2 vs. CN_G1; (E) SD_G2 vs. CN_G2.
The African long-legged thin-tailed sheep is raised in desert environments where they are exposed year-round, to complex interacting biophysical stressors, including high temperatures, physical exhaustion, direct solar radiation, feed and water scarcity. In this context, the revelation of the GO biological term “hyaluronan metabolic process (GO:0030212)” in four out of the six comparisons involving SD_G1 and SD_G2 is relevant. Hyaluronan (HA) comprises a major component of the extracellular matrix (ECM) in vertebrates and is a straight chain glycosaminoglycan which mediates diverse functions depending on molecular size and tissue concentration, both of which are regulated by the balance between its biosynthesis and catabolism (Hascall and Esko, 2015). HA occurs virtually in all vertebrate tissues and fluids, but skin, the first defense against environmental insults, is its largest reservoir containing more than 50% of the total body HA. The HA content of dermis is far greater than that of epidermis, and accounts for most of the 50% of the total body HA in skin. HA has excellent water retention ability and remarkable tissue hydration capacity, and at high concentrations, as found in the ECM of dermis and epidermis, it regulates water balance and osmotic pressure, functions as an ion exchange resin and regulates ion flow (Stern, 2010). HA also functions in the reepithelization process due to several of its properties, including being an integral part of the ECM of basal keratinocytes, the major constituent of epidermis, its free-radical scavenging function and its role in keratinocyte proliferation and migration (Tammi et al., 1989). It has been observed that the content of HA increases in the presence of retinoic acid (vitamin A) (Tammi et al., 1989) and the effects of retinoic acid against UV-induced skin damage may be correlated, at least in part, with an increase in skin HA content, giving rise to increased tissue hydration. It has been suggested that the free-radical scavenging property of HA contributes to protection against repeated exposure to the sun’s UV radiation (Tuhkanen et al., 1998; Averbeck et al., 2007). The rapid turnover of HA in tissues suggests tightly controlled modes for modulating steady state levels of HA and this is important because rapid increases are required in situations of extreme stress (Kobayashi et al., 2020). Therefore, the ability to provide immediate high HA levels acts as a survival mechanism for vertebrates and may explain the rapid rates of HA turnover under basal conditions. Furthermore, HA plays a role in innate immunity. Although it binds to CD44, there is evidence showing that HA degradation products transduce inflammatory signal through toll-like receptor 2 (TLR2), TLR4 or both in macrophages and dendritic cells. Thus, the HA metabolic process may be facilitating the adaptation to desert environments in African long-legged thin tailed sheep.
Conclusion
In this study, we analyzed the genetic diversity, structure and signatures of selection in the African thin-tailed Desert Sheep sampled from Sudan. We included one breed of fat-tailed and three breeds of thin-tailed sheep from China for comparative genomic analysis. We found high levels of genetic diversity but low levels of genetic differentiation among the five ecotypes of Sudanese thin-tailed Desert Sheep. The analysis also revealed a broad- and fine-scale genetic structures in the sheep analyzed, suggesting that these would need to be accounted for in genome-wide association analysis in the discovery of the genetic basis of important traits and in breeding program design. Selection signature analysis identified candidate regions that could potentially differentiate the two genetic clusters observed in the African thin-tailed Desert Sheep from the two genetic clusters observed in the Chinese thin-tailed sheep. These regions spanned a set of potential candidate genes associated with traits of adaptive, production and reproduction significance as well as morphological differentiation. While our study provides a foundation for understanding the genome structure and dynamics of African indigenous sheep, it reveals findings that could form the basis of studies that combine genomic and phenomic approaches in the quest to understand the genome architecture of indigenous livestock.
Data Availability Statement
The data presented in the study are deposited in the figshare repository, accession number doi: 10.6084/m9.figshare.14785278.v1.
Ethics Statement
The blood samples from the Sudanese thin-tailed Desert Sheep were collected after consent was granted by flock owners and local administration officials in Sudan. No further permissions were required from the ethics committee of the Organization of Veterinary Service, Government of Sudan. All animal experiments in this study were fully approved by the Animal Care and Use Committee of the Institute of Animal Sciences, Chinese Academy of Agricultural Sciences (IAS-CAAS) with the following reference number: IASCAAS-AE-03, on September 1, 2014.
Author Contributions
QZ, YM, and JM conceived, designed, and supervised the study and genotyped the Chinese breeds. JM, MR, and AH genotyped the Sudanese thin-tailed Desert Sheep. FE organised the sampling in Sudan. AAh and AAb analyzed the data with support from HB, RI and LX. AAb, AAh, J-LH, and JM wrote and revised the manuscript. All authors read and approved the final version.
Funding
This work was supported by the Sudan Agricultural Research Corporation (ARC) and Scientific Research and the Dry Land Research Centre (DLRC) and Animal Production. Sampling and genotyping of the Sudan thin-tailed Desert sheep was supported by the CGIAR Research Program on Livestock (Livestock CRP) and the China and Sudan contribution to the CGIAR through ICARDA. Additional financial support was also availed by the Science and Technology Innovation Project of Chinese Academy of Agricultural Sciences (ASTIP-IAS01) as well as the Modern Cashmere Sheep Industry System (CARS-39-01).
Conflict of Interest
The authors declare that the research was conducted in the absence of any commercial or financial relationships that could be construed as a potential conflict of interest.
Acknowledgments
We acknowledge the assistance of the technical staff at El-Obeid Research Station, during sampling.
Supplementary Material
The Supplementary Material for this article can be found online at: https://www.frontiersin.org/articles/10.3389/fgene.2021.659507/full#supplementary-material
Supplementary Figure 1 | Z-transformed average fixation index (ZFST) for autosomal 200 kb windows.
Supplementary Figure 2 | Normalized distribution of XP-EHH scores.
Supplementary Table 1 | The sampling locations of the thin-tailed Desert Sheep ecotypes from Sudan and the breeds from China that were used in the current study.
Supplementary Table 2 | Phenotypic characteristics of the thin-tailed Desert Sheep ecotypes and the climatic characteristics of their production environment.
Supplementary Table 3 | Pairwise genetic differentiation (FST) among the five ecotypes of Sudanese thin-tailed Desert Sheep and four breeds of sheep from China herein analyzed.
Supplementary Table 4 | The candidate regions spanning genes within the SD_G1 sheep group identified through the analysis of ROH islands.
Supplementary Table 5 | The candidate regions spanning genes within the SD_G2 sheep group identified through the analysis of ROH islands.
Supplementary Table 6 | The candidate regions spanning genes within the SD_G1 (SD_G1 vs. SD_G2, CN_G1, and CN_G2) sheep group identified by XP-EHH.
Supplementary Table 7 | The candidate regions spanning genes within the SD_G2 (SD_G2 vs. SD_G1, CN_G1, and CN_G2) sheep group identified by XP-EHH.
Supplementary Tables 8 | The candidate regions spanning genes within the Sudanese sheep groups (SD_G1 vs. SD_G2) identified by FST.
Supplementary Table 9 | The candidate regions spanning genes within the SD_G1 (SD_G1 vs. CN_G1 and CN_G2) sheep group identified by FST.
Supplementary Table 10 | The candidate regions spanning genes within the SD_G2 (SD_G2 vs. CN_G1 and CN_G2) sheep group identified by FST.
References
Abualazayium, M. (2004). Animal Wealth and Animal Production in Sudan. Khartoum: Khartoum University Press.
Ahbara, A., Bahbahani, H., Almathen, F., Al Abri, M., Agoub, M. O., and Mwacharo, J. M. (2019). Genome-wide variation, candidate regions and genes associated with fat deposition and tail morphology in Ethiopian indigenous sheep. Front. Genet. 9:699. doi: 10.3389/fgene.2018.00699
Ahbara, A. M. (2019). Autosomal Genome-wide Analysis of Diversity, Adaptation and Morphological Traits in African Indigenous Sheep. Ph.D. Thesis. Nottingham: University of Nottingham, 183.
Al Kalaldeh, M., Gibson, J., Lee, S. H., Gondro, C., and van der Werf, J. H. J. (2019). Detection of genomic regions underlying resistance to gastrointestinal parasites in Australian sheep. Genet. Sel. Evol. 51:37. doi: 10.1186/s12711-019-0479-1
Alexander, D. H., Novembre, J., and Lange, K. (2009). Fast model-based estimation of ancestry in unrelated individuals. Genome Res. 19, 1655–1664. doi: 10.1101/gr.094052.109 doi: 10.1080/10495390902786926
Anderson, R., McEwan, J. C., Brauning, R., Pickering, N. K., Kijas, J., Dalrymple, J., et al. (2014). “Development of a high density (600K) Illumina ovine SNP chip and its use to fine map the yellow fat locus,” in Proceedings of the (ISGC) Plant and Animal Genomics XXII Conference – January 2014, San Diego, CA. doi: 10.1016/j.vetpar.2008.12.017
Ardlie, K. G., Kruglyak, L., and Seielstad, M. (2002). Patterns of linkage disequilibrium in the human genome. Nat. Rev. Genet. 3, 299–309. doi: 10.1038/nrg777
Atlija, M., Arranz, J.-J., Martinez-Valladares, M., and Gutiérrez-Gil, B. (2016). Detection and replication of QTL underlying resistance to gastrointestinal nematodes in adult sheep using the ovine 50K SNP array. Genet. Sel. Evol. 48:4. doi: 10.1186/s12711-016-0182-4
Averbeck, M., Gebhardt, C. A., Voigt, S., Beilharz, S., Anderegg, U., Termeer, C. C., et al. (2007). Differential regulation of hyaluronan metabolism in the epidermal and dermal compartments of human skin by UVB irradiation. J. Invest. Dermatol. 127, 687–697. doi: 10.1038/sj.jid.5700614 doi: 10.1038/nature11837
Barsoum, I. B., and Yao, H. H. (2010). Fetal Leydig cells: progenitor cell maintenance and differentiation. J. Androl. 31, 11–15. doi: 10.2164/jandrol.109.008318 doi: 10.30861/9780860543251
Benavides, M. V., Sonstegard, T. S., Kemp, S., Mugambi, J. M., Gibson, J. P., Baker, R. L., et al. (2015). Identification of novel loci associated with gastrointestinal parasite resistance in a red Maasai x Dorper backcross population. PLoS One 10:e0122797. doi: 10.1371/journal.pone.0122797
Berton, M. P., de Oliveira Silva, R. M., Peripolli, E., Stafuzza, N. B., Martin, J. F., Álvarez, M. S., et al. (2017). Genomic regions and pathways associated with gastrointestinal parasites resistance in Santa Ines breed adapted to tropical climate. J. Anim. Sci. Biotechnol. 8, 73. doi: 10.1186/s40104-017-0190-4
Biscarini, F., Cozzi, P., Gaspa, G., and Marras, G. (2019). detectRUNS: An R Package to Detect runs of Homozygosity and Heterozygosity in Diploid Genomes. Available online at: https://cran.r-project.org/web/packages/detectRUNS/vignettes/detectRUNS.vignette.html (accessed October, 2020).
Brahi, O. H. D., Xiang, H., Chen, X., Farougou, S., and Zhao, X. (2015). Mitogenome revealed multiple postdomestication genetic mixtures of West African sheep. J. Anim. Breed. Genet. 132, 399–405. doi: 10.1111/jbg.12144
Brito, L. F., McEwan, J. C., Miller, S. P., Pickering, N. K., Bain, W. E., Dodds, K. G., et al. (2017). Genetic diversity of a New Zealand multibreed sheep population and composite breeds’ history revealed by a high-density SNP chip. BMC Genet. 18:25. doi: 10.1186/s12863-017-0492-8
Buchmann, R., and Hazelhurst, S. (2014). Genesis Manual. Johannesburg: University of the Witwatersrand.
Carlson, C. S., Eberle, M. A., Rieder, M. J., Yi, Q., Kruglyak, L., and Nickerson, D. A. (2004). Selecting a maximally informative set of single-nucleotide polymorphisms for association analyses using linkage disequilibrium. Am. J. Hum. Genet. 74, 106–120. doi: 10.1086/381000
Chang, C. C., Chow, C. C., Tellier, L. C., Vattikuti, S., Purcell, S. M., and Lee, J. J. (2015). Second-generation PLINK: rising to the challenge of larger and richer datasets. GigaScience 4:7. doi: 10.1186/s13742-015-0047-8
Duchev, Z., Distl, O., and Groeneveld, E. (2006). Early warning system for loss of diversity in European livestock breeds. Archiv. Anim. Breed. 49, 521–531. doi: 10.5194/aab-49-521-2006
Edea, Z., Dessie, T., Dadi, H., Do, K. T., and Kim, K. S. (2017). Genetic diversity and population structure of Ethiopian sheep populations revealed by high-density SNP markers. Front. Genet. 8:218. doi: 10.3389/fgene.2017.00218
Estrada-Reyes, Z. M., Tsukahara, Y., Amadeu, R. R., Goetsch, A. L., Gipson, T. A., Sahlu, T., et al. (2019). Signatures of selection for resistance to Haemonchus contortus in sheep and goats. BMC Genom. 20:735. doi: 10.1186/s12864-019-6150-y
Excoffier, L., and Lischer, H. E. (2010). Arlequin suite ver 3.5: A new series of programs to perform population genetics analyses under Linux and Windows. Mol. Ecol. Resour. 10, 564–567. doi: 10.1111/j.1755-0998.2010.02847.x
FAO (1998). Secondary Guidelines for the National Farm Animal Genetic Resources Management Plans: Management of Small Populations at Risk. Rome: FAO.
FAO (2007). The State of the World’s Animal Genetic Resources for Food and Agriculture, eds B. Rischkowsky and D. Pilling (Rome: FAO).
Fernández, J. B., Villanueva, B., Pong-Wong, R., and Toro, M. A. (2005). Efficiency of the use of pedigree and molecular marker information in conservation programs. Genetics 170, 1313–1321. doi: 10.1534/genetics.104.037325
Goudet, J. (2005). Hierfstat, a package for R to compute and test hierarchical F-statistics. Mol. Ecol. Notes 5, 184–186. doi: 10.1111/j.1471-8286.2004.00828.x doi: 10.1016/S2095-3119(14)60928-X
Hascall, V., and Esko, J. D. (2015). “Hyaluronan,” in Essentials of Glycobiology, 3rd Edn, eds A. Varki, R. D. Cummings, J. D. Esko, P. Stanley, G. W. Hart, et al. (Cold Spring Harbor, NY: Cold Spring Harbor Laboratory Press), 197–206.
Huang, D. W., Sherman, B. T., and Lempicki, R. A. (2009). Bioinformatics enrichment tools: paths toward the comprehensive functional analysis of large gene lists. Nucleic Acids Res. 37, 1–13. doi: 10.1093/nar/gkn923
Innan, H., and Kim, Y. (2008). Detecting local adaptation using the joint sampling of polymorphism data in the parental and derived populations. Genetics 179, 1713–1720. doi: 10.1534/genetics.108.086835
Jakobsson, M., and Rosenberg, N. A. (2007). CLUMMPP: a cluster matching and permutation program for dealing with label switching and multimodality in analysis of population structure. Bioinformatics 23, 1801–1806. doi: 10.1093/bioinformatics/btm233
Johansson, M., Ellegren, H., Marklund, L., Gustavsson, U., Ringmar-Cederberg, E., Andersson, K., et al. (1992). The gene for dominant white color in the pig is closely linked to ALB and PDGRFRA on chromosome 8. Genomics 14, 965–969. doi: 10.1016/S0888-7543(05)80118-1 doi: 10.1111/age.12197
Kim, E. S., Elbeltagy, A. R., Aboul-Naga, A. M., Rischkowsky, B., Sayre, B., Mwacharo, J. M., et al. (2016). Multiple genomic signatures of selection in goats and sheep indigenous to a hot arid environment. Heredity 116, 255–264. doi: 10.1038/hdy.2015.94
Kobayashi, T., Chanmee, T., and Itano, N. (2020). Hyaluronan: metabolism and function. Biomolecules 10:1525. doi: 10.3390/biom10111525
Kumar, S., Stecher, G., and Tamura, K. (2016). MEGA7: molecular evolutionary genetics analysis 7.0 for bigger datasets. Mol. Biol. Evol. 33, 1870–1874. doi: 10.1093/molbev/msw054
La, Y., Tang, J., Guo, X., Zhang, L., Gan, S., Zhang, X., et al. (2020). Proteomic analysis of sheep uterus reveals its role in prolificacy. J. Proteom. 210:103526. doi: 10.1016/j.jprot.2019.103526
Lei, W., Herington, J., Galindo, C. L., Ding, T., Brown, N., Reese, J., et al. (2014). Cross-species transcriptomic approach reveals genes in hamster implantation sites. Reproduction 148, 607–621. doi: 10.1530/REP-14-0388
Li, C., Li, M., Li, X., Ni, W., Xu, Y., Yao, R., et al. (2019). Whole-genome resequencing reveals loci associated with thoracic vertebrae number in sheep. Front. Genet. 10:674. doi: 10.3389/fgene.2019.00674
Li, X., Yang, J., Shen, M., Xie, X. L., Liu, G. J., Xu, Y. X., et al. (2020). Whole-genome resequencing of wild and domestic sheep identifies genes associated with morphological agronomic traits. Nat. Commun. 11:2815. doi: 10.1038/s41467-020-16485-1
Loor, J. J., Moyes, K. M., and Bionaz, M. (2011). Functional adaptations of the transcriptome to mastitis-causing pathogens: the mammary gland and beyond. J. Mammary Gland Biol. Neoplasia 16, 305–322. doi: 10.1007/s10911-011-9232-2
Luo, X., Ikeda, Y., and Parker, K. L. (1994). A cell-specific nuclear receptor is essential for adrenal and gonadal development and sexual differentiation. Cell 77, 481–490. doi: 10.1016/0092-8674(94)90211-9
Lv, F. H., Agha, S., Kantanen, J., Colli, L., Stucki, S., Kijas, J. W., et al. (2014). Adaptations to climate-mediated selective pressures in sheep. Mol. Biol. Evol. 31, 3324–3343. doi: 10.1093/molbev/msu264
Lv, F. H., Peng, W. F., Yang, J., Zhao, Y. X., Li, W. R., Liu, M. J., et al. (2015). Mitogenomic meta-analysis identifies two phases of 1migration in the history of eastern Eurasian sheep. Mol. Biol. Evol. 32, 2515–2533. doi: 10.1093/molbev/msv139
Ma, L., Li, Z., Cai, Y., Xu, H., Yang, R., and Lan, X. (2018). Genetic variants in fat-and short-tailed sheep from high-throughput RNA-sequencing data. Anim. Genet. 49, 483–487. doi: 10.1111/age.12699
Marras, G., Gaspa, G., Sorbolini, S., Dimauro, C., Ajmone-Marsan, P., Valentini, A., et al. (2015). Analysis of runs of homozygosity and their relationship with inbreeding in five cattle breeds farmed in Italy. Anim. Genet. 46, 110–121. doi: 10.1111/age.12259
Martin, L. J., and Tremblay, J. J. (2010). Nuclear receptors in Leydig cell gene expression and function. Biol. Reprod. 83, 3–14. doi: 10.1095/biolreprod.110.083824
Mastrangelo, S., Moioli, B., Ahbara, A., Latairish, S., Portolano, B., Pilla, F., et al. (2019). Genome-wide scan of fat-tail sheep identifies signals of selection for fat deposition and adaptation. Anim. Prod. Sci. 59, 835–848. doi: 10.1071/AN17753
Mbole-Kariuki, M. N., Sonstegard, T., Orth, A., Thumbi, S. M., Bronsvoort, B. M. C., Kiara, H. et al. (2014). Genome-wide analysis reveals the ancient and recent admixture history of East African shorthorn Zebu from western Kenya. Heredity 113, 297–305. doi: 10.1038/hdy.2014.31
McQuillan, R., Leutenegger, A.-L., Abdel-Rahman, R., Franklin, C. S., Pericic, M., Barac-Lauc, L., et al. (2008). Runs of homozygosity in European popula1tions. Am. J. Hum. Genet. 83, 359–372. doi: 10.1016/j.ajhg.2008.08.007
Mikawa, S., Morozumi, T., Shimanuki, S. I., Hayashi, T., Uenishi, H., Domukai, M., et al. (2007). Fine mapping of a swine quantitative trait locus for number of vertebrae and analysis of an orphan nuclear receptor, germ cell nuclear factor (NR6A1). Genome Res. 17, 586–593. doi: 10.1101/gr.6085507
Moller, M. J., Chaudhary, R., Hellmen, E., Höyheim, B., Chowdhary, B., and Andersson, L. (1996). Pigs with the dominant white coat color phenotype carry a duplication of the KIT gene encoding the mast/stem cell growth factor receptor. Mamm. Genome 7, 822–830. doi: 10.1007/s003359900244
Molotsi, A. H., Taylor, J. F., Cloete, S. W., Muchadeyi, F., Decker, J. E., Whitacre, L. K., et al. (2017). Genetic diversity and population structure of South African smallholder farmer sheep breeds determined using the OvineSNP50 beadchip. Trop. Anim. Health Prod. 49, 1771–1777. doi: 10.1007/s11250-017-1392-7
Moradi, M. H., Nejati-Javaremi, A., Moradi-Shahrbabak, M., Dodds, K. G., and McEwan, J. C. (2012). Genomic scan of selective sweeps in thin and fat tail sheep breeds for identifying of candidate regions associated with fat deposition. BMC Genetics 13:10. doi: 10.1186/1471-2156-13-10
Muigai, A. (2003). Characterization and Conservation of Indigenous Animal Genetic Resources: The Fat-tailed and Thin-tailed Sheep of Africa. Ph.D. Thesis. Juja: Jomo Kenyatta University of Agriculture and Technology. doi: 10.1007/s10437-013-9129-0
Nazari-Ghadikolaei, A., Mehrabani-Yeganeh, H., Miarei-Aashtiani, S. R., Staiger, E. A., Rashidi, A., and Huson, H. J. (2018). Genome-wide association studies identify candidate genes for coat color and mohair traits in the Iranian Markhoz goat. Front. Genet. 9:105. doi: 10.3389/fgene.2018.00105
Nielsen, E. E., Hansen, M. M., and Loeschcke, V. (1999). Genetic variation in time and space: microsatellite analysis of extinct and extant populations of Atlantic salmon. Evolution 53, 261–268. doi: 10.1111/j.1558-5646.1999.tb05351.x
Painter, J. N., Willemsen, G., Nyholt, D., Hoekstra, C., Duffy, D. L., and Henders, A. K. 9, et al. (2010). A genome wide linkage scan for dizygotic twinning in 525 families of mothers of dizygotic twins. Hum. Reprod. 25, 1569–1580. doi: 10.1093/humrep/deq084
Palsbøll, P. J., Berube, M., and Allendorf, F. W. (2007). Identification of management units using population genetic data. Trends Ecol. Evol. 22, 11–16. doi: 10.1016/j.tree.2006.09.003
Pickrell, J., and Pritchard, J. (2012). Inference of population splits and mixtures from genome-wide allele frequency data. PLoS Genet. 8:e1002967. doi: 10.1371/journal.pgen.1002967
Porter, V. (2020). Mason’s World Dictionary of Livestock Breeds, Types and Varieties, 6th Edn. Wallingford: CABI Publishing. doi: 10.1079/9781789241532.0000
Price, A. L., Zaitlen, N. A., Reich, D., and Patterson, N. (2010). New approaches to population stratification in genome-wide association studies. Nat. Rev. Genet. 11, 459–463. doi: 10.1038/nrg2813
Pritchard, J. K., and Przeworski, M. (2001). Linkage disequilibrium in humans: models and data. Am. J. Hum. Genet. 69, 1–14. doi: 10.1086/321275 doi: 10.1086/519795
Quinlan, A. R., and Hall, I. M. (2010). BEDTools: a flexible suite of utilities for comparing genomic features. Bioinformatics 26, 841–842. doi: 10.1093/bioinformatics/btq033
Rubin, C. J., Megens, H. J., Barrio, A. M., Maqbool, K., Sayyab, S., Schwochow, D., et al. (2012). Strong signatures of selection in the domestic pig genome. Proc. Natl Acad. Sci. U.S.A. 109, 19529–19536. doi: 10.1073/pnas.1217149109
Rupp, R., Senin, P., Sarry, J., Allain, C., Tasca, C., Ligat, L., et al. (2015). A point mutation in suppressor of cytokine signalling 2 (Socs2) increases the susceptibility to inflammation of the mammary gland while associated with higher body weight and size and higher milk production in a sheep model. PLoS Genet. 11:e1005629. doi: 10.1371/journal.pgen.1005629
Sabeti, P. C., Varilly, P., Fry, B., Lohmueller, J., Hostetter, E., Cotsapas, C., et al. (2007). Genome-wide detection and characterization of positive selection in human populations. Nature 449, 913–918. doi: 10.1038/nature06250
Schwartz, M. K., Luikart, G., and Waples, R. S. (2007). Genetic monitoring as a promising tool for conservation and management. Trends Ecol. Evol. 22, 25–33. doi: 10.1016/j.tree.2006.08.009
Siepielski, A. M., Morrissey, M. B., Buoro, M., Carlson, S. M., Caruso, C. M., Clegg, S. M., et al. (2017). Precipitation drives global variation in natural selection. Science 355, 959–962. doi: 10.1126/science.aag2773
Stern, R. (2010). “Hyaluronan and the process of aging in skin,” in Textbook of Aging Skin, eds M. A. Farage, K. W. Miller, and H. I. Maibach (Berlin: Springer), 225–238. doi: 10.1007/978-3-540-89656-2_22
Stern, R., Asari, A. A., and Sugahara, K. N. (2006). Hyaluronan fragments: an information-rich system. Eur. J. Cell Biol. 85, 699–715. doi: 10.1016/j.ejcb.2006.05.009
Sved, J. A. (1971). Linkage disequilibrium and homozygosity of chromosome segments in finite populations. Theor. Popul. Biol. 2, 125–141. doi: 10.1016/0040-5809(71)90011-6
Taberlet, P., Valentini, A., Rezaei, H. R., Naderi, S., Pompanon, F., Negrini, R., et al. (2008). Are cattle, sheep, and goats endangered species? Mol. Ecol. 17, 275–284. doi: 10.1111/j.1365-294X.2007.03475.x
Tammi, R., Ripellino, J. A., Margolis, R. U., Maibach, H. I., and Tammi, M. (1989). Hyaluronate accumulation in human epidermis treated with retinoic acid in skin organ culture. J. Invest. Dermatol. 92, 326–332. doi: 10.1111/1523-1747.ep12277125
Tarekegn, G. M., Khayatzadeh, N., Liu, B., Osama, S., Haile, A., Rischkowsky, B., et al. (2020). Ethiopian indigenous goats offer insights into past and recent demographic dynamics and local adaptation in sub-Saharan African goats. Evol. Appl. 00, 1–16. doi: 10.1111/eva.13118
Tortereau, F., Servin, B., Frantz, L., Megens, H. J., Milan, D., Rohrer, D., et al. (2012). A high density recombination map of the pig reveals a correlation between sex-specific recombination and GC content. BMC Genom. 13:586. doi: 10.1186/1471-2164-13-586
Tuhkanen, A. L., Tammi, M., Pelttari, A., Agren, U. M., and Tammi, R. (1998). Ultrastructural analysis of human epidermal CD44 reveals preferential distribution on plasma membrane domains facing the hyaluronan-rich matrix pouches. J. Histochem. Cytochem. 46, 241–248. doi: 10.1177/002215549804600213
Verschuren, D. (2007). “Decadal and century-scale climate variability in tropical Africa during the past 2000 years,” in Past Climate Variability Through Europe and Africa, eds R. W. Battarbee, F. Gasse, and C. E. Stickley (Dordrecht, the Netherlands: Kluwer Academic Publishers), 139–158.
Vinet, A., Drouilhet, L., Bodin, L., Mulsant, P., Fabre, S., and Phocas, F. (2012). Genetic control of multiple births in low ovulating mammalian species. Mamm. Genome 23, 727–740. doi: 10.1007/s00335-012-9412-4
Waples, R. S., and Gaggiotti, O. (2006). What is a population? An empirical evaluation of some genetic methods for identifying the number of gene pools and their degree of connectivity. Mol. Ecol. 15, 1419–1439. doi: 10.1111/j.1365-294X.2006.02890.x
Weir, B. S., and Cockerham, C. C. (1984). Estimating F-statistics for the analysis of population structure. Evolution 38, 1358–1370. doi: 10.1111/j.1558-5646.1984.tb05657.x
Yang, Y., Zhou, Q. J., Chen, X. Q., Yan, B. L., Guo, X. L., Zhang, H. L., et al. (2015). Profiling of differentially expressed genes in sheep T lymphocytes response to an artificial primary Haemonchus contortus infection. Parasit. Vectors 8:235. doi: 10.1186/s13071-015-0844-z doi: 10.1111/asj.12468 doi: 10.1093/molbev/msx181 doi: 10.1111/asj.12468
Keywords: adaptation, climate change, genetic diversity, selection signatures, SNP genotypes
Citation: Abied A, Ahbara AM, Berihulay H, Xu L, Islam R, El-Hag FM, Rekik M, Haile A, Han J-L, Ma Y, Zhao Q and Mwacharo JM (2021) Genome Divergence and Dynamics in the Thin-Tailed Desert Sheep From Sudan. Front. Genet. 12:659507. doi: 10.3389/fgene.2021.659507
Received: 27 January 2021; Accepted: 25 June 2021;
Published: 19 July 2021.
Edited by:
Xianyao Li, Shandong Agricultural University, ChinaReviewed by:
Maulik Upadhyay, Ludwig Maximilian University of Munich, GermanyAhmed Rady A. E. Elbeltagy, Animal Production Research Institute, Egypt
Copyright © 2021 Abied, Ahbara, Berihulay, Xu, Islam, El-Hag, Rekik, Haile, Han, Ma, Zhao and Mwacharo. This is an open-access article distributed under the terms of the Creative Commons Attribution License (CC BY). The use, distribution or reproduction in other forums is permitted, provided the original author(s) and the copyright owner(s) are credited and that the original publication in this journal is cited, in accordance with accepted academic practice. No use, distribution or reproduction is permitted which does not comply with these terms.
*Correspondence: Qianjun Zhao, zhaoqianjun@caas.cn; Joram M. Mwacharo, j.mwacharo@cgiar.org