Partitioning of Space Among Trees in an Old-Growth Spruce Forest in Subarctic Fennoscandia
 Pasi Pouta
 Niko Kulha
 Timo Kuuluvainen
 Tuomas Aakala
- 1Ecosystems and Environment Research Programme, Faculty of Biological and Environmental Sciences, University of Helsinki, Lahti, Finland
- 2Department of Forest Sciences, University of Helsinki, Helsinki, Finland
- 3Biodiversity Centre, Finnish Environment Institute, Helsinki, Finland
- 4School of Forest Sciences, University of Eastern Finland, Joensuu, Finland
The distribution of space among forest trees is linked to the availability of resources, among-tree competition, and hence forest dynamics. We studied partitioning of horizontal space among trees and related spatial structures in an old-growth Picea abies (L.) Karst -dominated forest in northeastern subarctic Fennoscandia, where Betula pubescens (Ehrh.) is an important co-dominant. Specifically, we asked (1) how does growing space occupied by trees vary by tree species and size in an old-growth forest with open canopy structure, and (2) at what scales does the variation in tree growing space occur? We mapped an 8.8 ha forest plot with 4,884 live trees. We used Voronoi polygons to quantify the horizontal space potentially available to each tree. We modeled the Voronoi polygon area as a function of tree size and species by using generalized additive models (GAM). We used i-to-any L-functions to study the scale-dependence of tree densities around focal trees, and mark correlation functions to study the relative sizes of trees close to each other. The GAM models showed that tree growing space increased non-linearly with tree size before saturating, and that overall growing space was larger for B. pubescens than for P. abies. Mean space occupied by trees roughly doubled from the smallest diameter class (0–5 cm) to the largest (>25 cm), from 13.7 to 26.7 m2. Depending on diameter class, shade-intolerant B. pubescens occupied on average 5–10 m2 more space than shade-tolerant P. abies. Trees close to each other were smaller than average. Size- and species-dependent differences in local tree densities accumulated mostly at the scale of a few meters but showed also broader-scale variation possibly related to edaphic variation within the study plot. The tree species- and size-related variation in the trees’ growing space suggests that among-tree competition, together with clustering of trees, shape the spatial assembly of the forest.
Introduction
The boreal forest biome contains about one third of the global forest area and half of the remaining global near-natural frontier forests. Although tree species diversity is low compared to that of other biomes, forest structural, successional, and landscape diversity are high under natural conditions (Burton, 2013; Kuuluvainen and Siitonen, 2013). Variation in structure of natural boreal forests is linked to key ecosystem properties such as biodiversity (Nilsson et al., 2001; Tikkanen et al., 2006), carbon cycle (Hyvönen et al., 2007; McKinley et al., 2011) and resilience (Messier et al., 2013). Hence, understanding the structure of natural boreal forests is fundamental for understanding their dynamics and safeguarding the ecosystem services that these forests provide (Landres et al., 1999; Kuuluvainen, 2002). This is particularly important in high-latitude forests, as they are predicted to be strongly influenced by global change (Gauthier et al., 2015).
An important aspect of forest structure is the partitioning of space among trees. It is related to the amount of resources available to trees, among-tree competition, tree regeneration, growth and mortality (Oliver and Larson, 1996). Especially in their late-successional stages, subarctic forests close to their range limits typically develop into open-canopied stands of varying tree density, with intermittent treeless spaces of different shape and area (McCarthy, 2001; Kulha et al., 2019). Thus, they provide an interesting case for studying the spatial partitioning of space among trees.
The open canopy structure means that there is unoccupied aboveground growing space that trees could potentially fill by recruitment (Engelmark et al., 1998) or by lateral crown expansion (Gavrikov et al., 1993; Aakala et al., 2016), within the species-specific limits in canopy structure (Kuuluvainen, 1992). Due to the open canopy structure, the availability of light is unlikely to inhibit the filling of the growing space. The observed increase in tree cover in subarctic forests during recent decades (Kulha et al., 2020) suggests that the allocation of space among trees is changing, so that the subarctic forests are becoming denser and the importance of light competition is increasing (MacDonald et al., 2008; Aakala et al., 2014).
The partitioning of space among trees and its drivers remain little studied in subarctic natural forests with open canopy structure. On the contrary, in southern boreal forests with more closed canopy structure, among-tree competition has been shown to be an important factor shaping the allocation of space among trees, and hence, their spatial pattern (Kenkel et al., 1997). Among-tree competition intensifies with increasing tree density, inhibiting growth. This can lead to tree sizes positively correlating with tree-tree distances at scales relevant to among-tree interactions (Pommerening, 2002; Gray and He, 2009).
High tree density and among-tree competition may lead to mortality and release of space around trees. Small trees often grow in dense clusters due to, e.g., the occurrence of safe regeneration microsites (Kuuluvainen and Kalmari, 2003; Awada et al., 2004). These microsites include dead wood and mineral soil exposed by fallen trees and function as more favorable spots for regeneration than undisturbed, vegetated forest floor (Bonan and Shugart, 1989; Hofgaard, 1993). The clusters of small trees typically become sparser due to competition-driven mortality that changes the partitioning of growing space, increasing the allocation to surviving trees that grow larger and also physically occupy more space (Kenkel, 1988; Moeur, 1997; Getzin et al., 2008). Consequently, larger trees often grow in a more dispersed manner than smaller trees, a pattern indicative of competitive mortality (Moeur, 1997; Getzin et al., 2008). In dense even-aged forests, mortality due to competition and even age structure may lead toward a dispersed tree pattern and uniform allocation of space among the trees (Kenkel et al., 1997; Gray and He, 2009). In structurally heterogeneous forests overall mortality may lead to more regular or more clustered patterns at the stand scale (He and Duncan, 2000; Larson et al., 2015; Looney et al., 2018).
Allocation of space among trees may also vary depending on the life history traits of tree species and the scale studied. For example, due to species-specific light requirements and responses to competition (Niinemets and Valladares, 2006), certain species may grow more densely than others (Zeide, 1987; Pretzsch and Biber, 2005). In addition, forest structures are shaped by processes occurring at several spatial scales (Kulha et al., 2019). Thus, the partitioning of space among trees may vary both according to fine-scale factors, such as among-tree interactions, and larger-scale variation in factors, such as soils and topography.
Competition, both below- and aboveground, also affects forest structure and dynamics in subarctic old-growth forests with open canopy structure (Doležal et al., 2006; Lundqvist and Nilson, 2007; Fraver et al., 2014; Aakala et al., 2018). Due to the highly variable tree density and the occurrence of large gaps (Caron et al., 2009), among-tree competition may drive development of forest structures especially in dense clusters of trees (Doležal et al., 2006; Aakala et al., 2018). Consequently, the allocation of space between trees may also be affected by among-tree interactions and tree traits. Improved understanding of how trees partition space in high-latitude boreal forests is needed to better understand the underlying dynamics of these forests, e.g., the role of among-tree competition in shaping forest spatial patterns.
In the current study, we examined the partitioning of horizontal space among trees in an open-canopied old-growth forest. The study area was dominated by shade-tolerant Picea abies (L.) Karst, with abundant presence of shade-intolerant Betula pubescens (Ehrh.). Specifically, we asked: (1) Does the space occupied by trees increase with tree size as expected, given that competitive interactions shape forest structure? (2) How does the partitioning of space differ between shade-tolerant P. abies and shade-intolerant B. pubescens? (3) What are the spatial scales of the potential species- and size-dependent patterns in the allocation of space?
Materials and Methods
Study Area
We studied a subarctic old-growth forest located in the Värriö strict nature reserve, northeastern Fennoscandia (67° 44′ N, 29° 34′ E). A mosaic of forests on mineral soil, waterbodies, and forested and open peatlands characterizes the reserve, established in 1981. The soils are quaternary glacial deposits, undifferentiated tills being the most prevalent soil type. The bedrock is mainly formed by gneiss complexes (Korsman et al., 1997). Low mountain fells with gentle slopes and treeless summits, and depressions between the summits characterize the topography of the reserve.
Northeastern Fennoscandia has a subcontinental climate. In the study area, the mean annual temperature is −1°C, with the lowest monthly mean temperature of −13°C in January and the highest of + 13°C in July. The mean annual precipitation equals to 570 mm (the climate data are averages from years 1970 to 2000; Fick and Hijmans, 2017).
The main tree species in the reserve are Pinus sylvestris (L.), Picea abies (L.) Karst, and Betula pubescens (Ehrh.). Our study stand was dominated by the narrow-crowned P. abies subspecies obovata, and mixed with B. pubescens, and some individual P. sylvestris, Sorbus aucuparia (L.) and Salix caprea (L.). The stand has never been logged, and the main human influence is from reindeer herding. Trees in the stand carry no signs of forest fires, and the stand age structure in the broader landscape is typical to true old-growth forests (sensu Oliver and Larson, 1996; Aakala, 2018), where fine-scale mortality events of individual trees or groups of a few trees (i.e., gap dynamics) drive forest dynamics (Kuuluvainen and Aakala, 2011; Kuuluvainen et al., 2016).
Field Data Collection
In a relatively large area of old-growth forest, we established a rectangular study plot (180 m × 500 m), for practical reasons, missing a smaller rectangle (20 m × 100 m) in its south-east corner (Figures 1, 2). The use of a large plot (8.8 ha) made it possible to examine the allocation of space among trees in an area that included natural variability in forest structure and topoedaphic conditions.
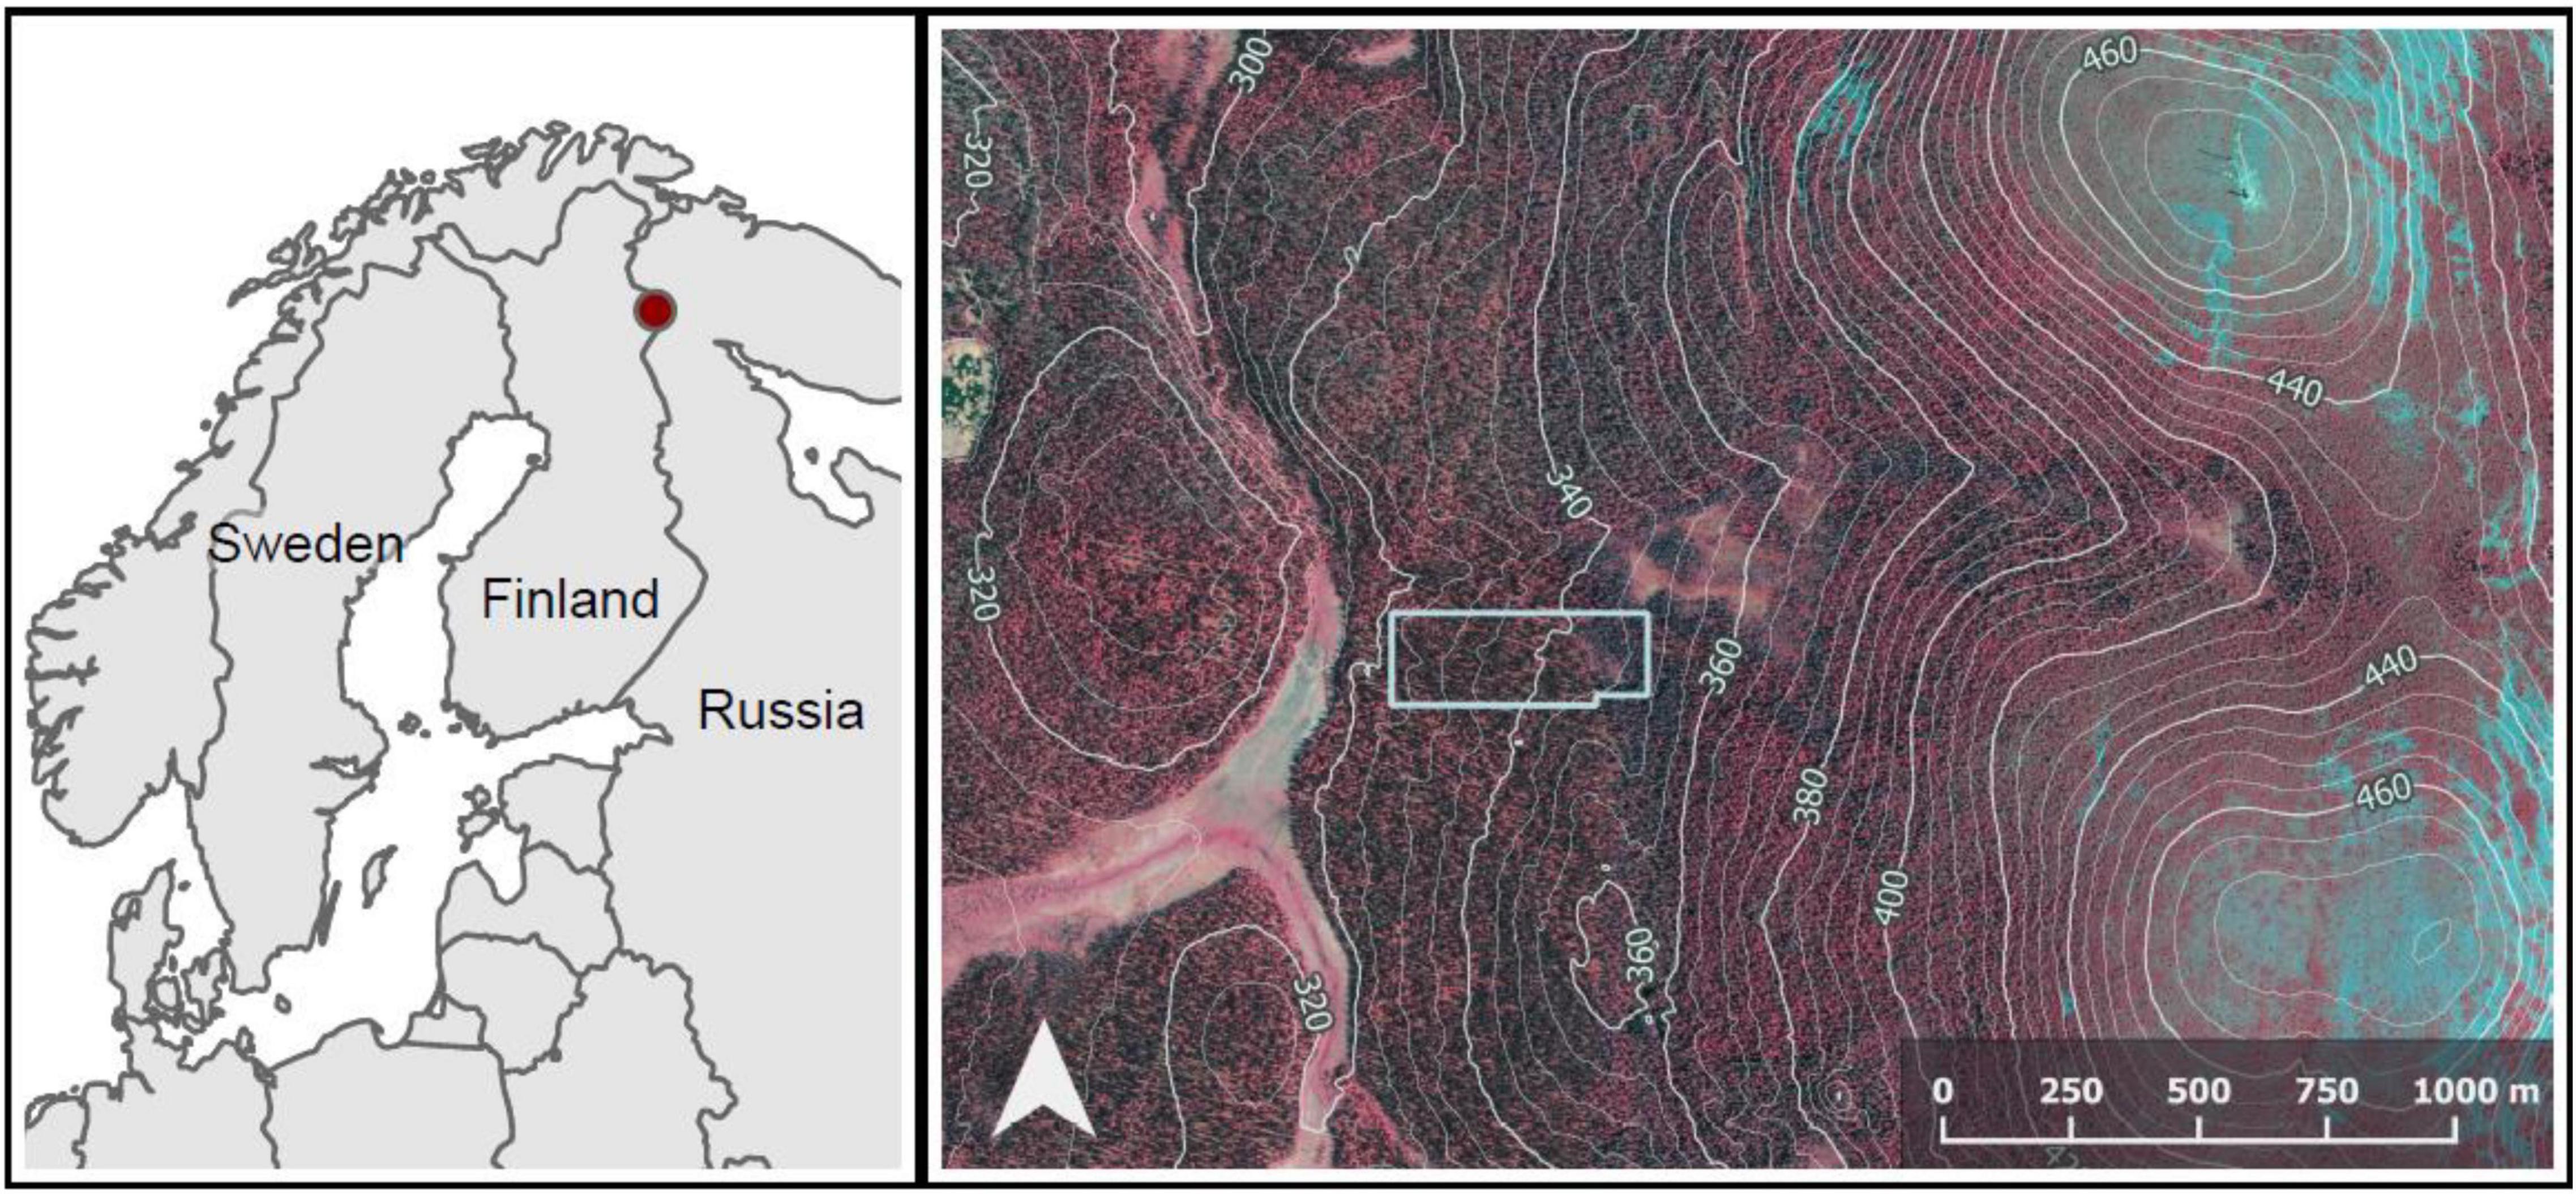
Figure 1. The location of the study plot (polygon in light gray). In the top right corner, the fell Ykkönen, and in the low right corner, the fell Kakkonen. Descending the western slope of Kakkonen, tree species composition changes from Betula pubescens -dominated to Picea abies -dominated in a narrow paludified depression overlapping the east side of the study plot. The depression also includes a small stream area dominated by stunted B. pubescens. The western part of the plot is dominated by P. abies and mixed with B. pubescens. The contours depict elevation above sea level (m). The false-color orthophotograph and the contours were derived from National Land Survey Finland (4/2020).
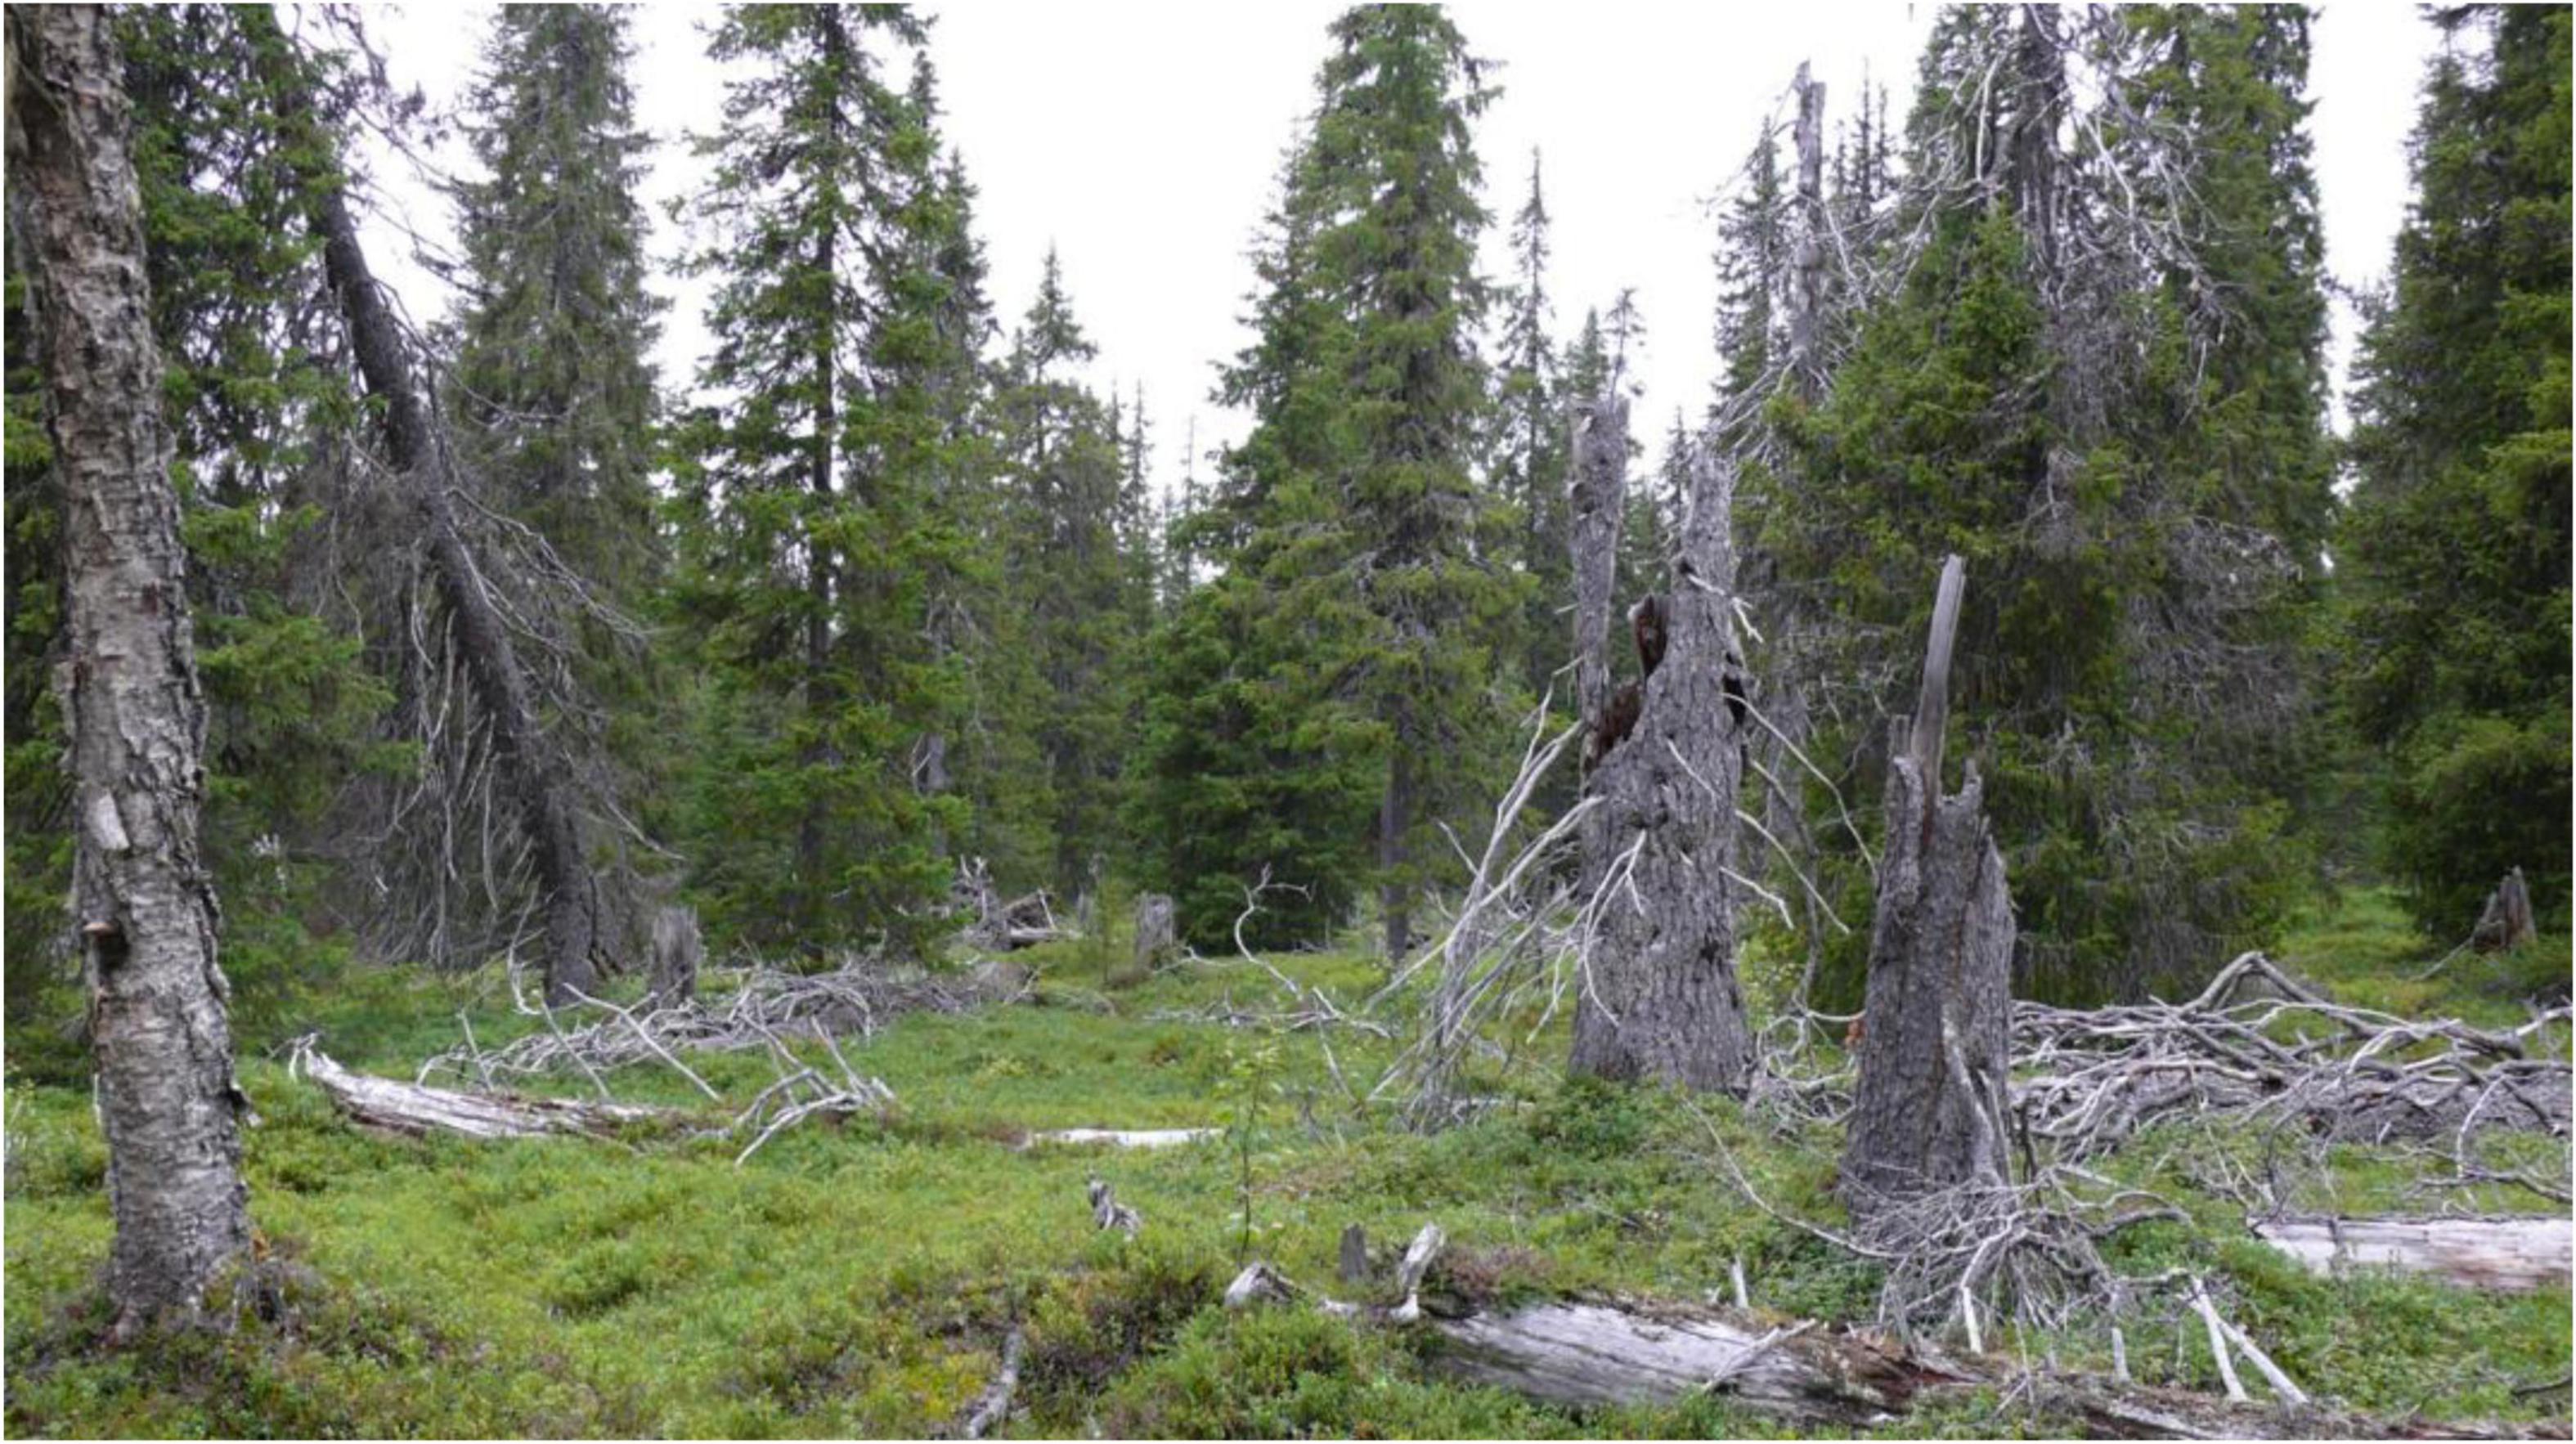
Figure 2. A gap in the studied old-growth forest characterized by the narrow-crowned P. abies subspecies obovata and very variable, generally open canopy structure. Characteristic to the Hylocomium-Myrtillus type (HMT) forest (Cajander, 1926), the ground is covered by a thick layer of moss and small shrubs effectively inhibiting tree regeneration. Photograph: Timo Kuuluvainen.
Based on the variation in forest structure, the plot could be divided into three roughly homogeneous subplots: (1) The western part of the plot, forest on mineral soil (2) the eastern part of the plot, strongly P. abies -dominated forest on mineral to paludified soil and (3) a paludified depression between the first two, including a small stream and a mire. This stream area was characterized by a high density of stunted trees and a high proportion of B. pubescens, as well as e.g., Salix lapponum (L.). From now on, we call these subplots “the East,” “the West” and “the stream area.”
During summers 2016 and 2017, we mapped and measured all living and dead trees taller than 1.3 m using the FieldMap measuring system (IFER, Czech Republic) within the plot. We registered tree locations, species, and status (alive or dead, intact, inclined, snapped or fallen), and measured tree diameter at 1.3 m height (DBH) for each tree. Especially B. pubescens often formed clusters of stems by sprouting. In these cases, of stems that clearly belonged to the same individual, we only measured the tallest stem and marked down the diameters of the other stems.
Analyses
To give an overall image of the composition of the forest, we calculated statistics on the numbers, sizes, and volumes of trees. We calculated tree volumes using equations by Laasasenaho (1982), as well as Näslund height models (Näslund, 1937) to evaluate height for other than straight intact stems. We used a height model fitted for B. pubescens for deciduous trees, and a model fitted for P. abies for conifers. In these analyses, we included all stems from multi-stemmed individuals. For the rest of the analyses, we only used live stems, and the tallest stem for multi-stemmed individuals.
To analyze partitioning of space among trees, we calculated the horizontal tree growing space available for each live tree as the Voronoi polygon area (Kenkel, 1990; Okabe et al., 2000; Illian et al., 2008). Voronoi polygons have been used to analyze local tree density and “area potentially available” for tree growth, and as a measure of plant competition (Kenkel et al., 1997; Lundqvist and Elfving, 2010). The Voronoi polygon of each tree is defined as the planar area within which the tree is the closest tree of all. Thus, polygon edges are drawn midway between trees, and the method can be considered as an even division of space among trees.
To study the variation in tree growth space by tree diameter and species, we divided the trees in classes by DBH (with 5 cm intervals up to 25 cm and one class for DBH > 25 cm) and species (P. abies or B. pubescens), and calculated the corresponding Voronoi polygon areas after excluding the polygons potentially affected by edge effect, as in Kenkel et al. (1989). In addition, we fitted gamma distributions to the resulting Voronoi area distributions. Fitting an established distribution to the data enables better visualization and direct comparability with other studies. The gamma distribution is defined by the two-parameter probability density function f of the gamma function Γ (Hogg et al., 2019):
where the denominator equals Γ(α). The distribution has the mean of α/λ and the skewness of . We plotted the gamma distributions and tabulated their parameters, as well as the corresponding observed mean Voronoi area for each combination of tree DBH and species.
For further statistical support and visualization, we modeled tree Voronoi polygon area as a function of tree size. Preliminary analyses showed that this relationship was strongly non-linear, and we opted for generalized additive models (GAM) (Hastie and Tibshirani, 1986; Zuur et al., 2009). We fitted the models separately for P. abies and B. pubescens, with a gamma distribution and identity link function. We used a smooth term for tree basal area (BA), calculated as π(DBH/2)2. To account for within-plot variation in tree density, leading to spatial autocorrelation in the residuals, we added another smooth term with tree coordinates as a covariate in the model. Despite the addition of tree coordinates, some spatial autocorrelation remained in the residuals. This means that the p-values have to be interpreted with caution.
Mapped tree stands are commonly analyzed with point pattern analysis (e.g., Illian et al., 2008). To analyze the growing space and local density around focal trees of different size and species, as well as their scale-dependence, we used “i-to-any” L-functions with isotropic edge correction (Baddeley, 2008). These i-to-any type of functions have also been called condensed functions (Illian et al., 2008) or treated as multivariate L-functions with one focal type including all trees (e.g., Lutz et al., 2014; Larson et al., 2015). Calculated from the number of neighboring trees around the focal tree type, these functions represent the degree of clustering of trees of any type around trees of the focal type i. The function can be defined as:
where Ki⋅(r) represents the expected number of trees around trees of focal type i within distance r, and divided by the density of trees in the observation area. Under complete spatial randomness (CSR), the expected value of the function is equal to 0. Higher values indicate tendency toward clustering of trees around trees of type i (high local density). Similarly, lower values indicate repulsion (low local density). We classified the trees by DBH and species as described above, and used each of the classes as the focal type i. Since i-to-any L-functions are calculated from the numbers of neighboring trees around the focal trees within a given distance r, they complement Voronoi-diagram analysis by including the effect of scale on local densities around different kinds of trees. They also give more information as compared to the basic form of L-functions which represent the degree of clustering of neighboring trees averaged over all trees.
To further describe tree neighborhood structures and the sizes of neighboring trees, we used mark correlation functions calculated for tree DBH (Illian et al., 2008, p. 341). We used the unnormalized, generalized form of the function with test function t(m1,m2) = (m1 + m2)/2. Calculated this way, the function values, cmm(r), can be interpreted as the expected mean DBH of two trees separated by distance r. If tree diameters are spatially independent, the expected value for the function equals the mean diameter of all trees. With increasing distance, any spatial association deriving from among-tree interactions is expected to decrease leading to the function approaching its expected value.
Point pattern analyses often assume stationarity of the point pattern, i.e., that there is no systematic local variation within the pattern (Wiegand and Moloney, 2013). However, large study areas are often structurally variable (Perry et al., 2006; Wiegand et al., 2007). For these reasons, forest spatial patterns have mostly been studied within fairly small homogeneous study plots, and more complex patterns have received less attention (Getzin et al., 2008).
Our study plot showed clear coarse-scale heterogeneity in tree density, diameter, and species. Thus, processes, such as complete spatial randomness and intensity-reweighted stationary process (Baddeley et al., 2000) would not have provided adequate null models for point pattern analyses. Instead, hypothesis testing would have required the use of more complex null models taking in account the local variation in tree density, diameter and species (Wiegand and Moloney, 2013). Since the aim of the point pattern analyses was primarily to describe forest structural patterns, we calculated the descriptive statistics without statistical hypothesis testing. To reduce the effect of structural heterogeneity within the plot, we separately analyzed the three internally fairly homogeneous subplots (the West, the East and the stream area) (Wiegand and Moloney, 2013).
We conducted all the analyses using R (R Development Core Team, 2019) and its packages spatstat (Baddeley et al., 2015), fitdistrplus (Delignette-Muller and Dutang, 2015), lmfor (Mehtätalo, 2015), mgcv (Wood, 2021), and ggplot2 (Wickham, 2016).
Results
Size- and Species-Composition
There were 5,766 trees in the plot, of which 4,884 were live and 882 dead. When all stems for multi-stemmed individuals were included, the number of stems was 6,722, of which 5,820 were live and 902 dead (Table 1). P. abies was clearly the dominant species (4,358 live trees), but B. pubescens was also abundant (1,438 live trees). There were only few individuals of S. caprea, P. sylvestris and S. aucuparia (4, 12, and 14, respectively), but all these species were found both as juvenile and mature individuals, live and dead. The volume of live wood was 105.3 m3ha–1, and that of dead wood 26.4 m3ha–1. Tree density was low, totaling 661 live stems ha–1 and 103 dead stems ha–1.
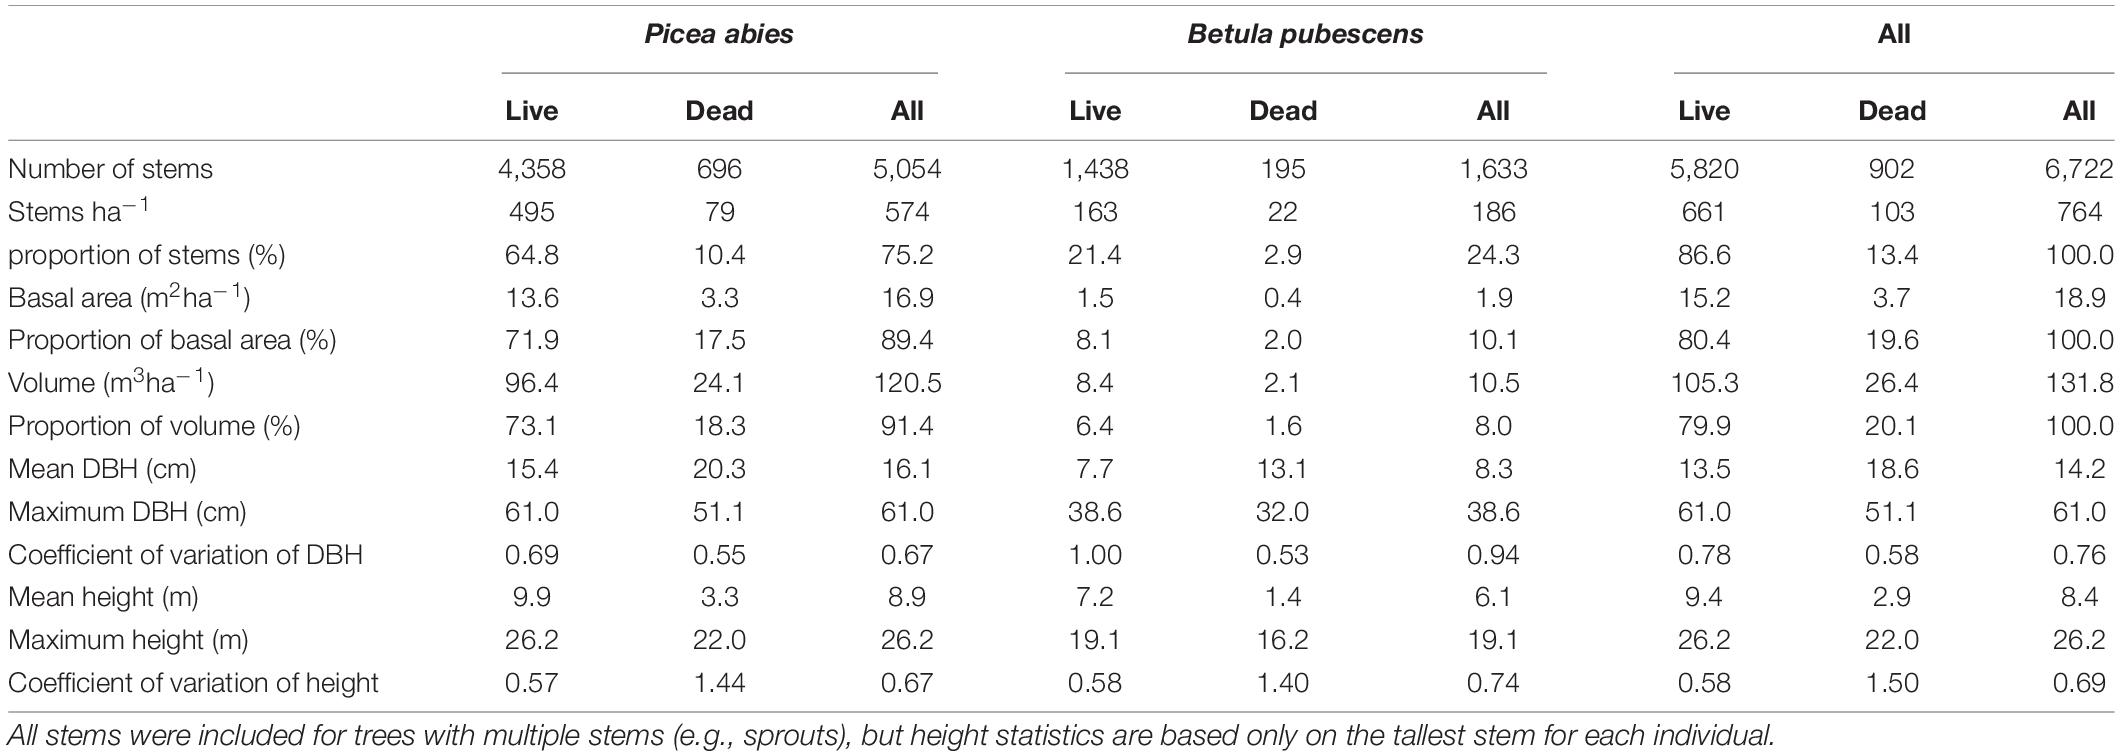
Table 1. Basic statistics of trees in the study area by tree species and status.
The live P. abies had a decreasing diameter distribution with particularly many small trees and no decrease between diameter classes 5.0–22.5 cm (Figure 3). Live B. pubescens had a bimodal distribution: trees with DBH less than 2.5 cm were the most abundant, and the other peak was at 12.5–15.0 cm. 47.6% of live B. pubescens stems were evaluated as side stems (mostly sprouts), the number of which was particularly high in the smallest DBH class.
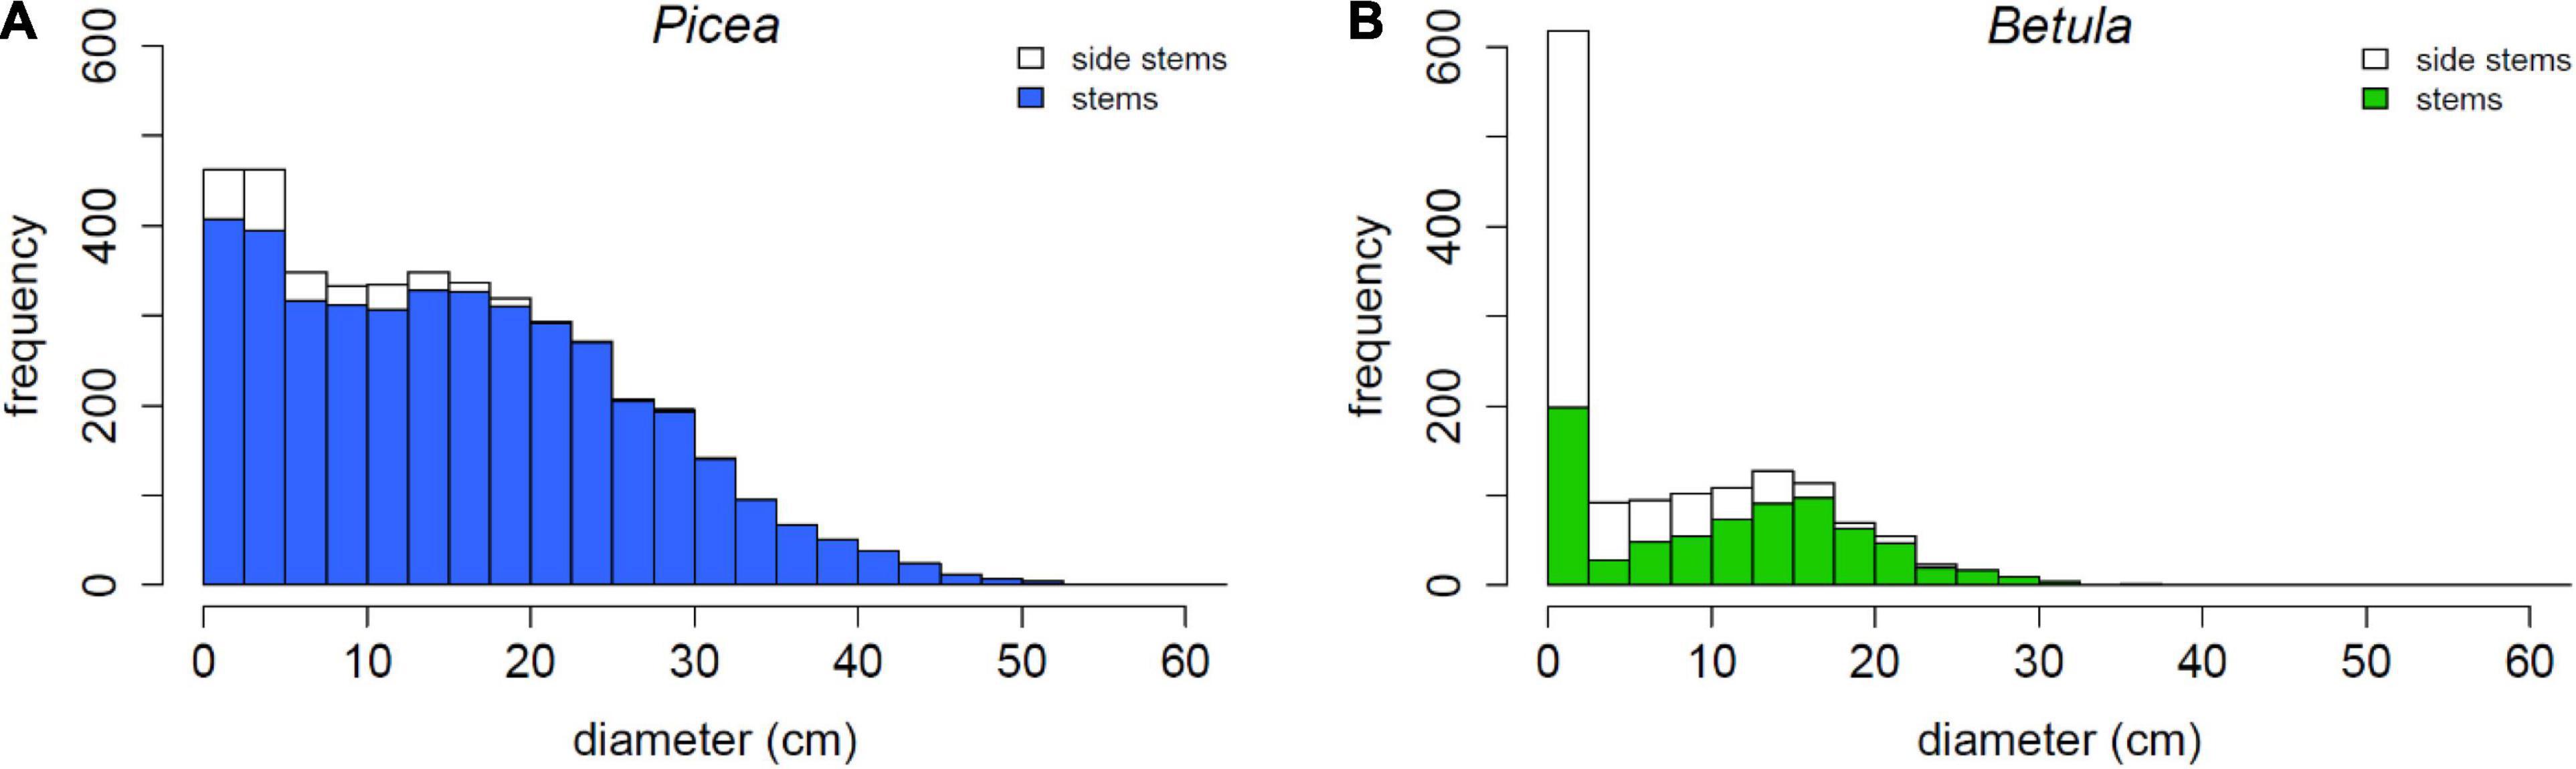
Figure 3. Diameter distributions of (A) live Picea abies and (B) live Betula pubescens trees, and the proportion of vegetative side stems, mostly sprouts.
Partitioning of Growing Space
The forest in the plot showed highly variable density, Voronoi polygon (Figure 4) areas varying between 0.2 and 111.0 m2, with the mean of 17.5 m2 and the median of 14.3 m2. The distribution was skewed to the right with a peak between 5 and 10 m2 (Figure 5). Interpreting Voronoi areas as local densities (one tree per polygon) gives a range of 90–54,000 trees per hectare, the peak being at 1,000–2,000 trees per hectare. Had the space been distributed evenly among trees, each tree would have had 18.0 m2 of space.
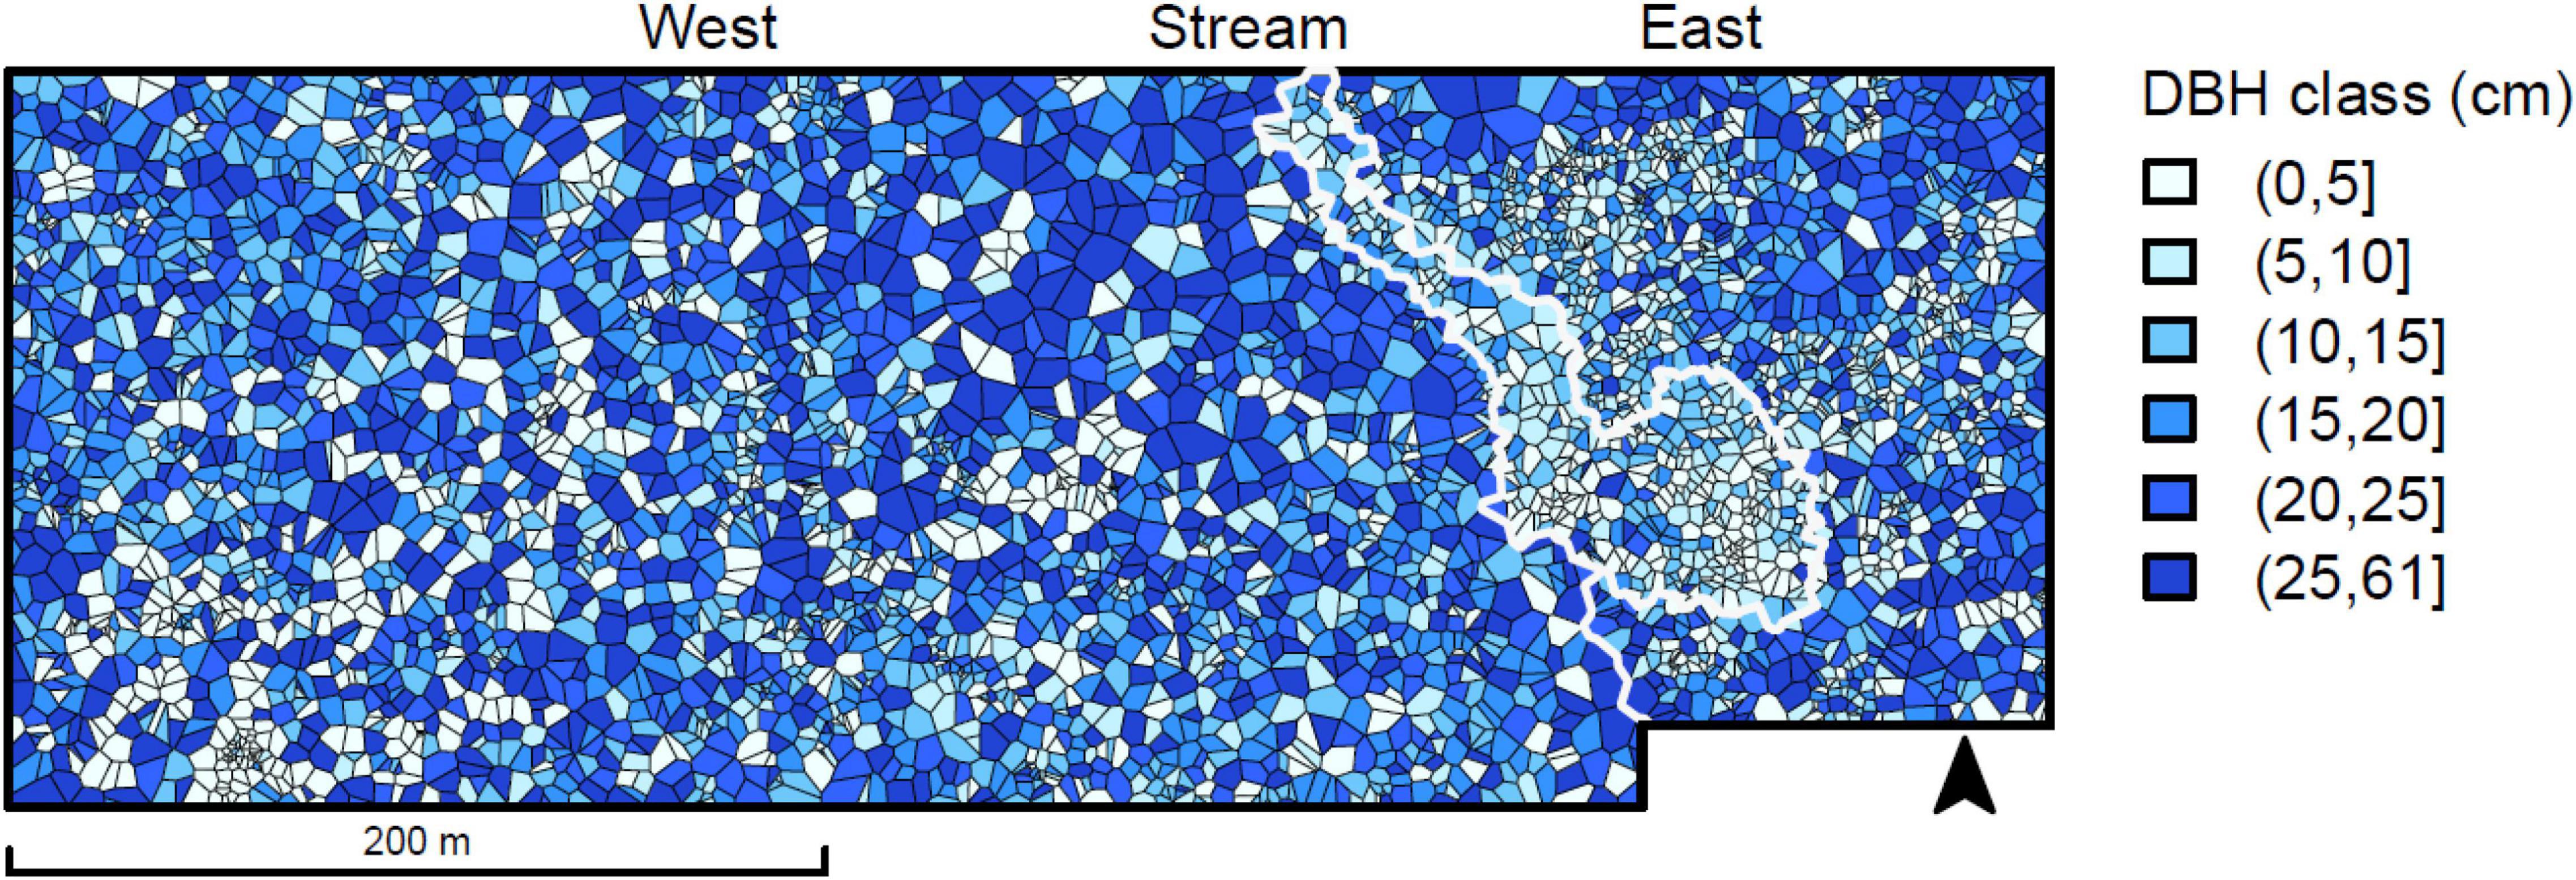
Figure 4. Voronoi tessellation for the living trees in the study area, colored by tree diameter class. The eastern side of the plot includes a stream area and its paludified surroundings, both with a high density of small trees.
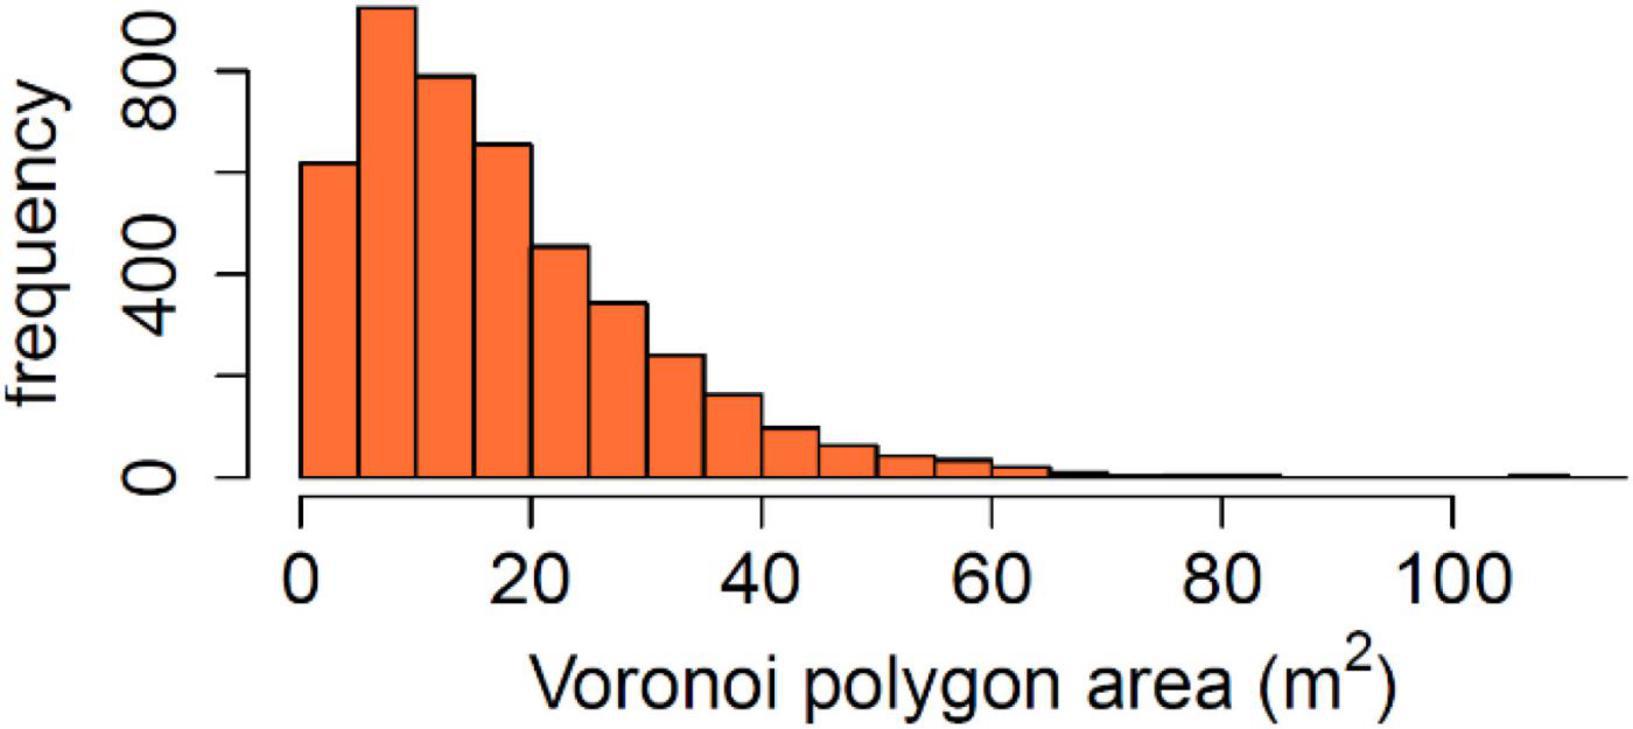
Figure 5. Distribution of area potentially available for individual trees calculated as Voronoi polygon area. Calculated from tree locations treated as points in a plane, the Voronoi polygon of each tree is defined as the planar area within which the tree is the closest tree of all.
The partitioning of space among trees varied in relation to DBH and species when calculated for the whole study area (Figure 6). Mean Voronoi area approximately doubled from the smallest diameter class to the largest, both for P. abies and B. pubescens (Table 2). However, trees between 0 and 5 cm DBH had on average more available space than trees between 5 and 10 cm DBH. B. pubescens had 5–10 m2 bigger Voronoi areas than P. abies, depending on DBH class. The difference was particularly big in the two largest DBH classes. The fitted gamma distributions differed mostly in the shape parameter α, in combination with slight variation in the rate parameter λ. Since the mean of the distribution equals to α/λ, the increase in the shape parameter α reflects the increase in Voronoi polygon area with increasing DBH, and larger Voronoi polygons of B. pubescens as compared to P. abies.
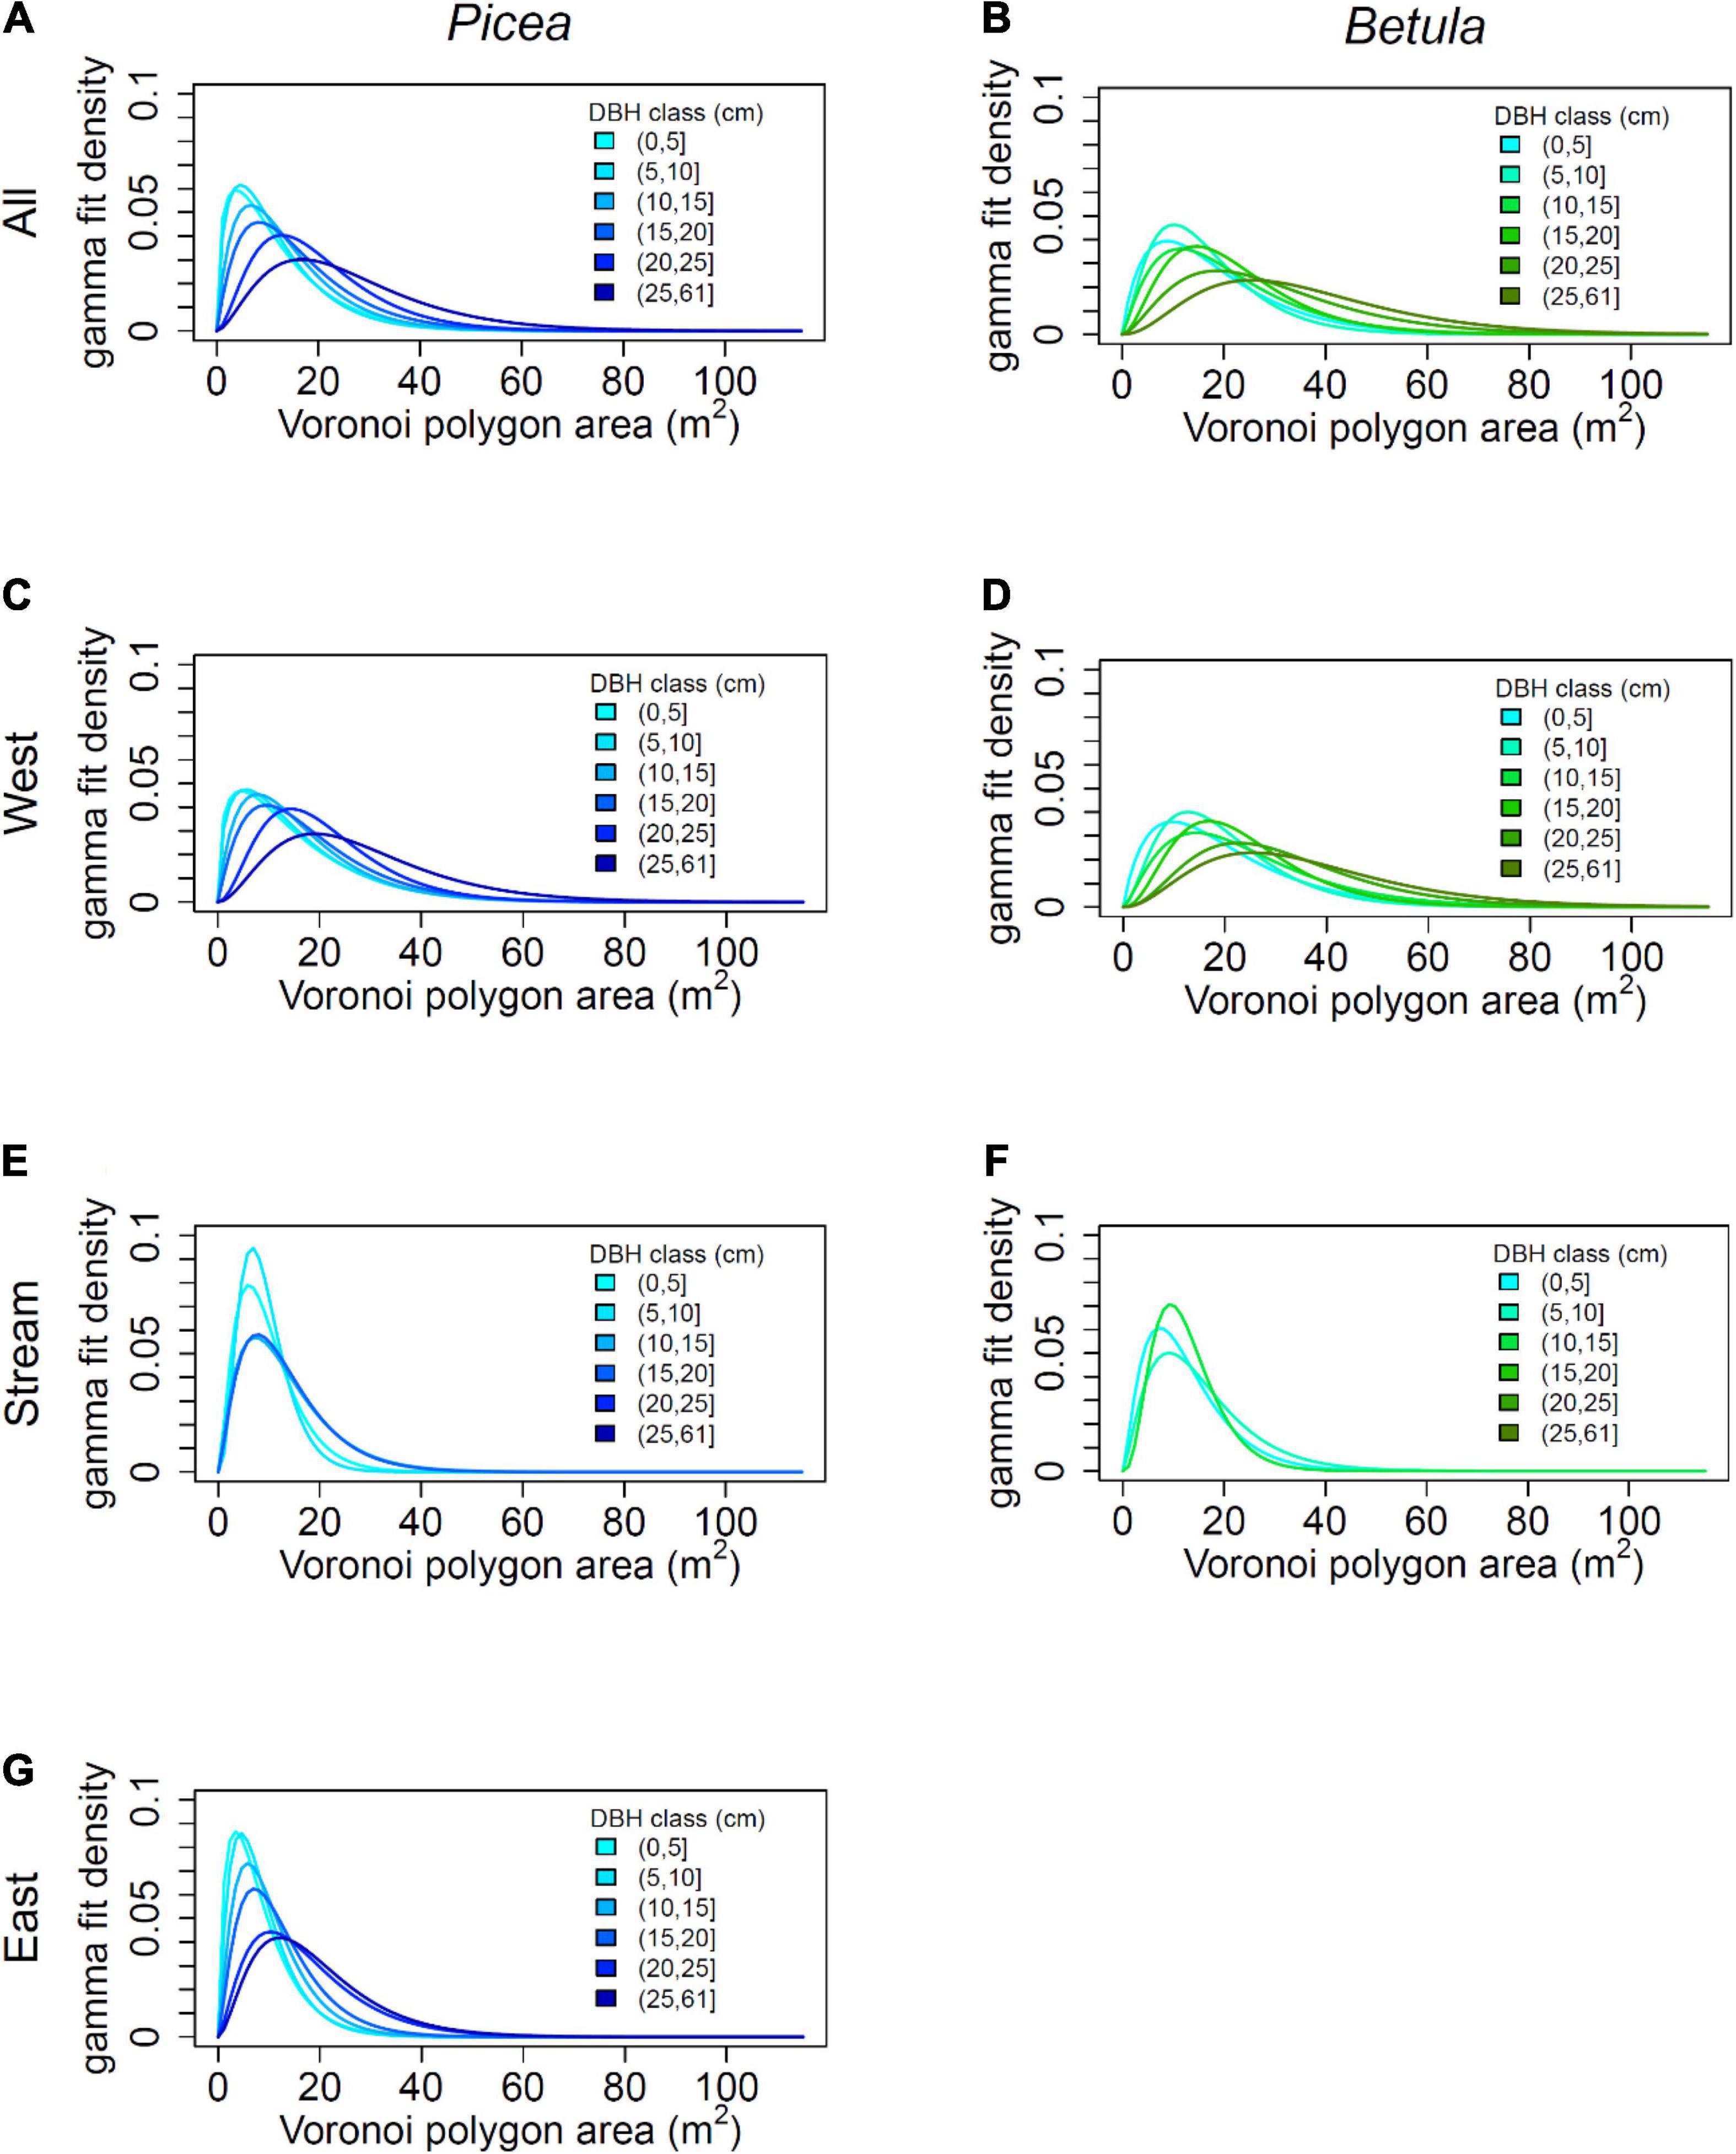
Figure 6. Distribution of space potentially available to trees by diameter at breast height (DBH) and species for the whole plot and the subplots, for combinations with at least 20 trees: (A) All Picea, (B) All Betula, (C) Picea in the West, (D) Betula in the West, (E) Picea in the Stream area, (F) Betula in the Stream area, and (G) Picea in the East. The space available to trees was calculated as the area of the Voronoi polygon of each tree. and the curves represent the fitted gamma distributions when tree growing spaces were classified by tree diameter and species.
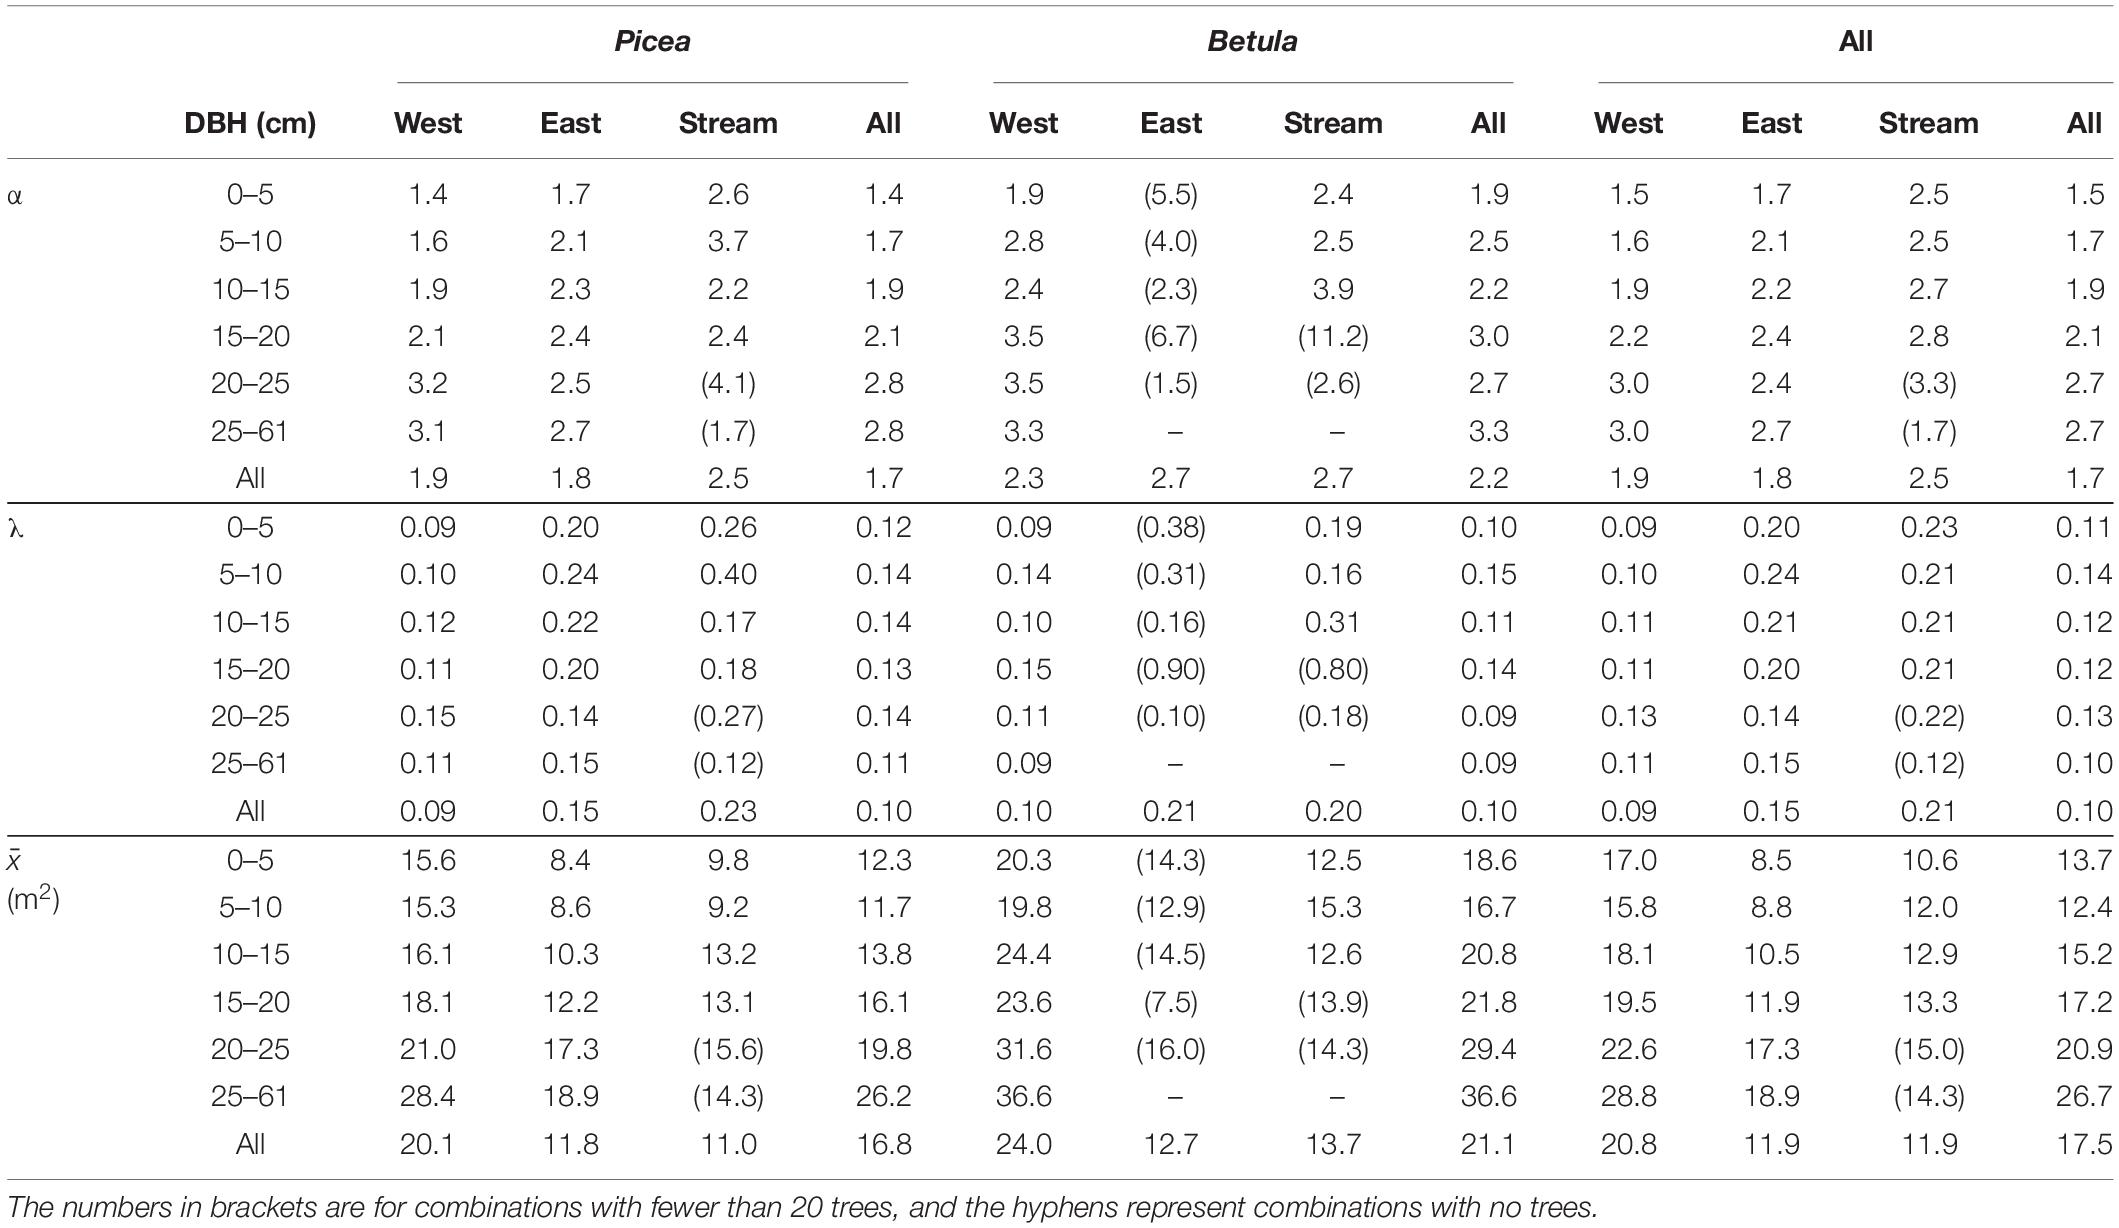
Table 2. Shape (α) and rate (λ) parameters of the gamma distributions fitted for tree growing space (Voronoi polygon area) for trees by DBH class, species and subplot, as well as the corresponding observed means ().
The amount of growing space varied rather consistently between the subplots when comparing mean Voronoi areas by DBH class and species: the trees in the East occupied the least growing space, followed by the stream area and the West. Especially for the East and the West, tree growing space clearly increased with tree diameter, and B. pubescens occupied more space than P. abies. In the stream area, these patterns were more blurred. The difference between the species varied between diameter classes, and the pattern of increased growing space with increased diameter was less clear, except for all species combined.
The best-performing GAM models explained 29.7 and 25.2% of the variance in Voronoi area for P. abies and B. pubescens correspondingly (Figure 7). The smoothing terms for tree basal area and tree coordinates were non-linear, and statistically significant for both species (Table 3). Thus, the models further indicated the increasing Voronoi polygon area with increasing tree basal area, as well as the spatial variation in tree density. In addition, the fitted models supported smaller Voronoi areas for P. abies than for B. pubescens. Moreover, the increasing area with tree size saturated earlier with P. abies compared to B. pubescens.
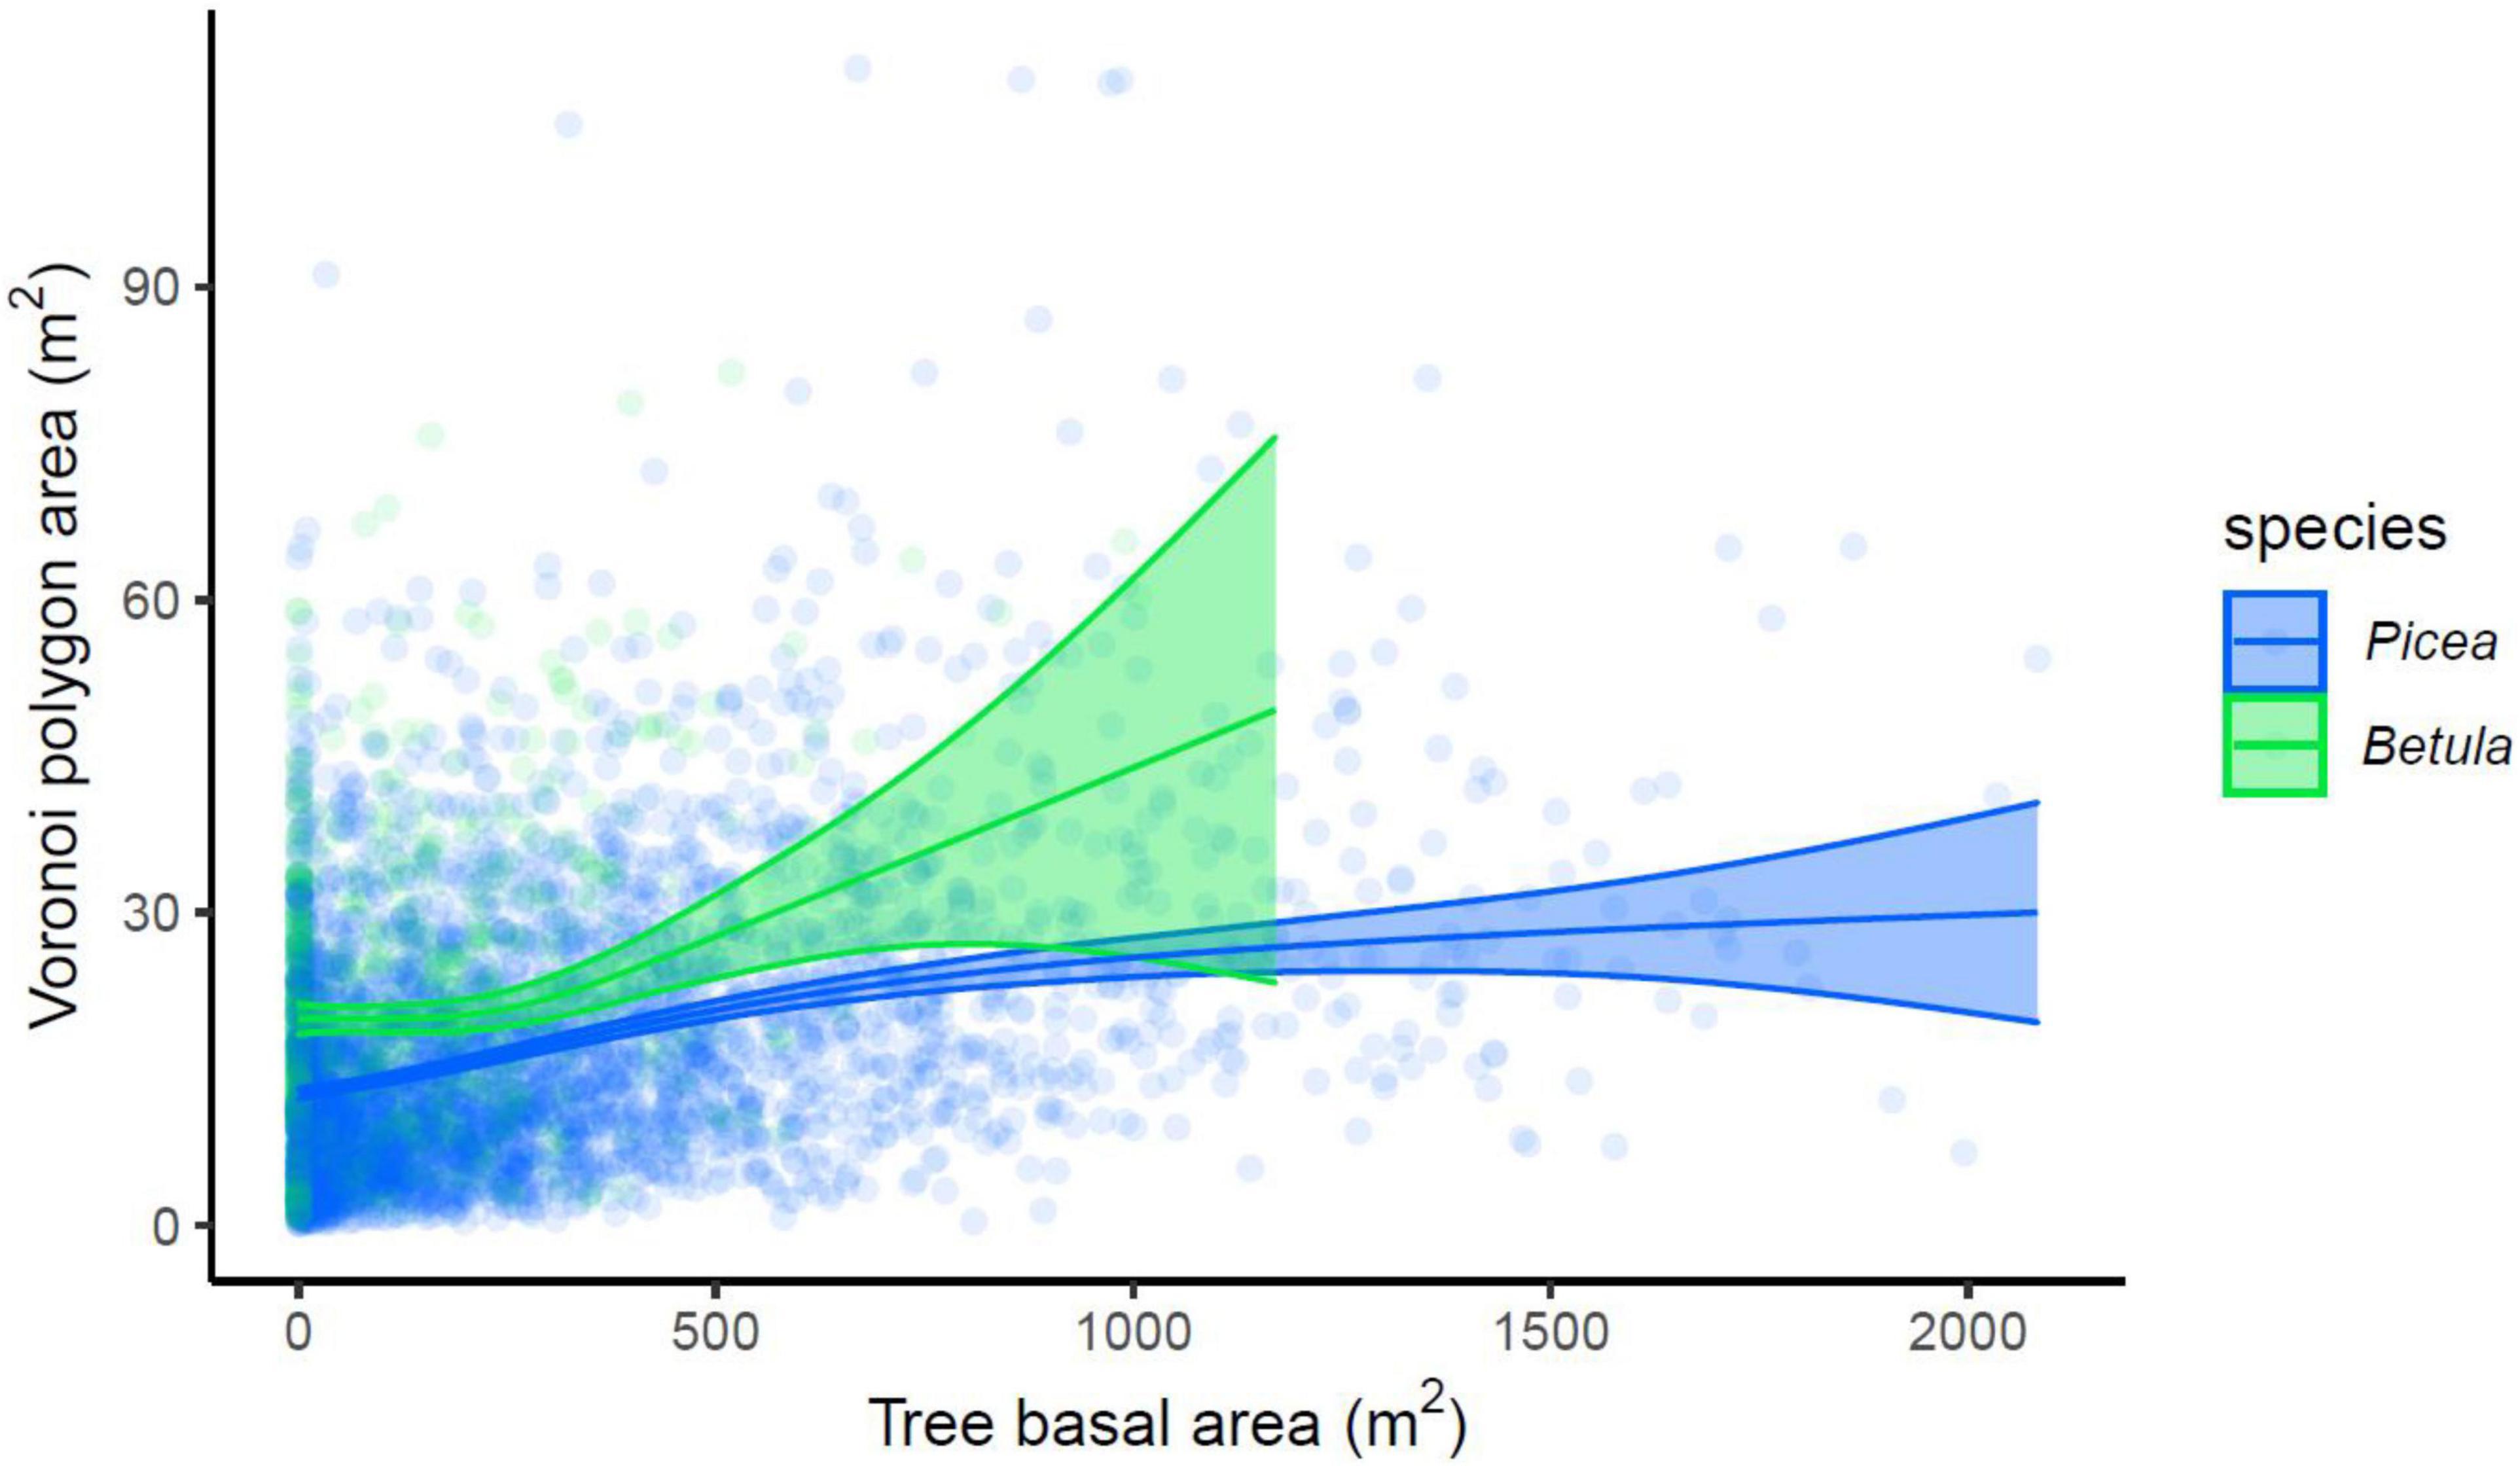
Figure 7. Relationship between Voronoi polygon area and tree basal area, modeled for P. abies and B. pubescens with generalized additive models (GAM), with 95% confidence intervals.
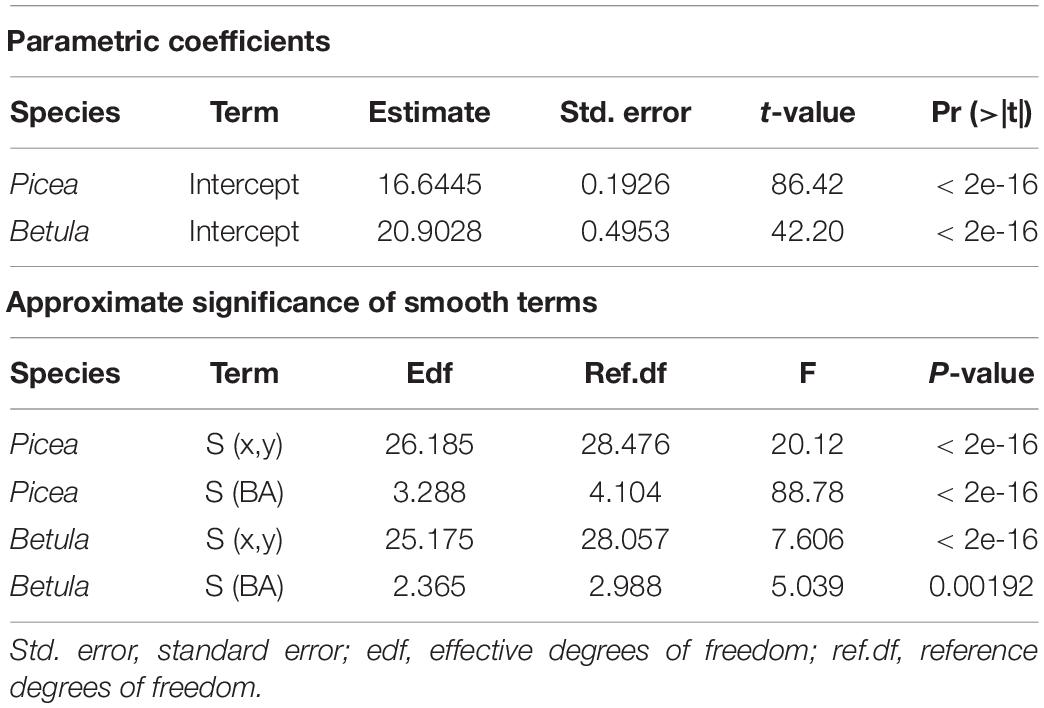
Table 3. Parameters for the GAM models explaining the relationship between Voronoi polygon area and tree basal area (BA), fitted separately for P. abies and B. pubescens.
Tree Spatial Patterns
Local densities, and thus, number of neighboring trees within given distance became lower as tree size increased, as measured by i-to-any L-functions for the whole study area (Figure 8). This pattern was observed both for P. abies and B. pubescens. For P. abies, the differences between the DBH classes accumulated rapidly after short distances of about 1–2 m. For B. pubescens, the differences accumulated more slowly, mostly within approximately 3–4 meters. Even after these distances, there were slower changes in the function values, clearly caused by the coarse-scale heterogeneity within the plot. However, at the subplot-scale the corresponding functions showed more stable values at larger distances.
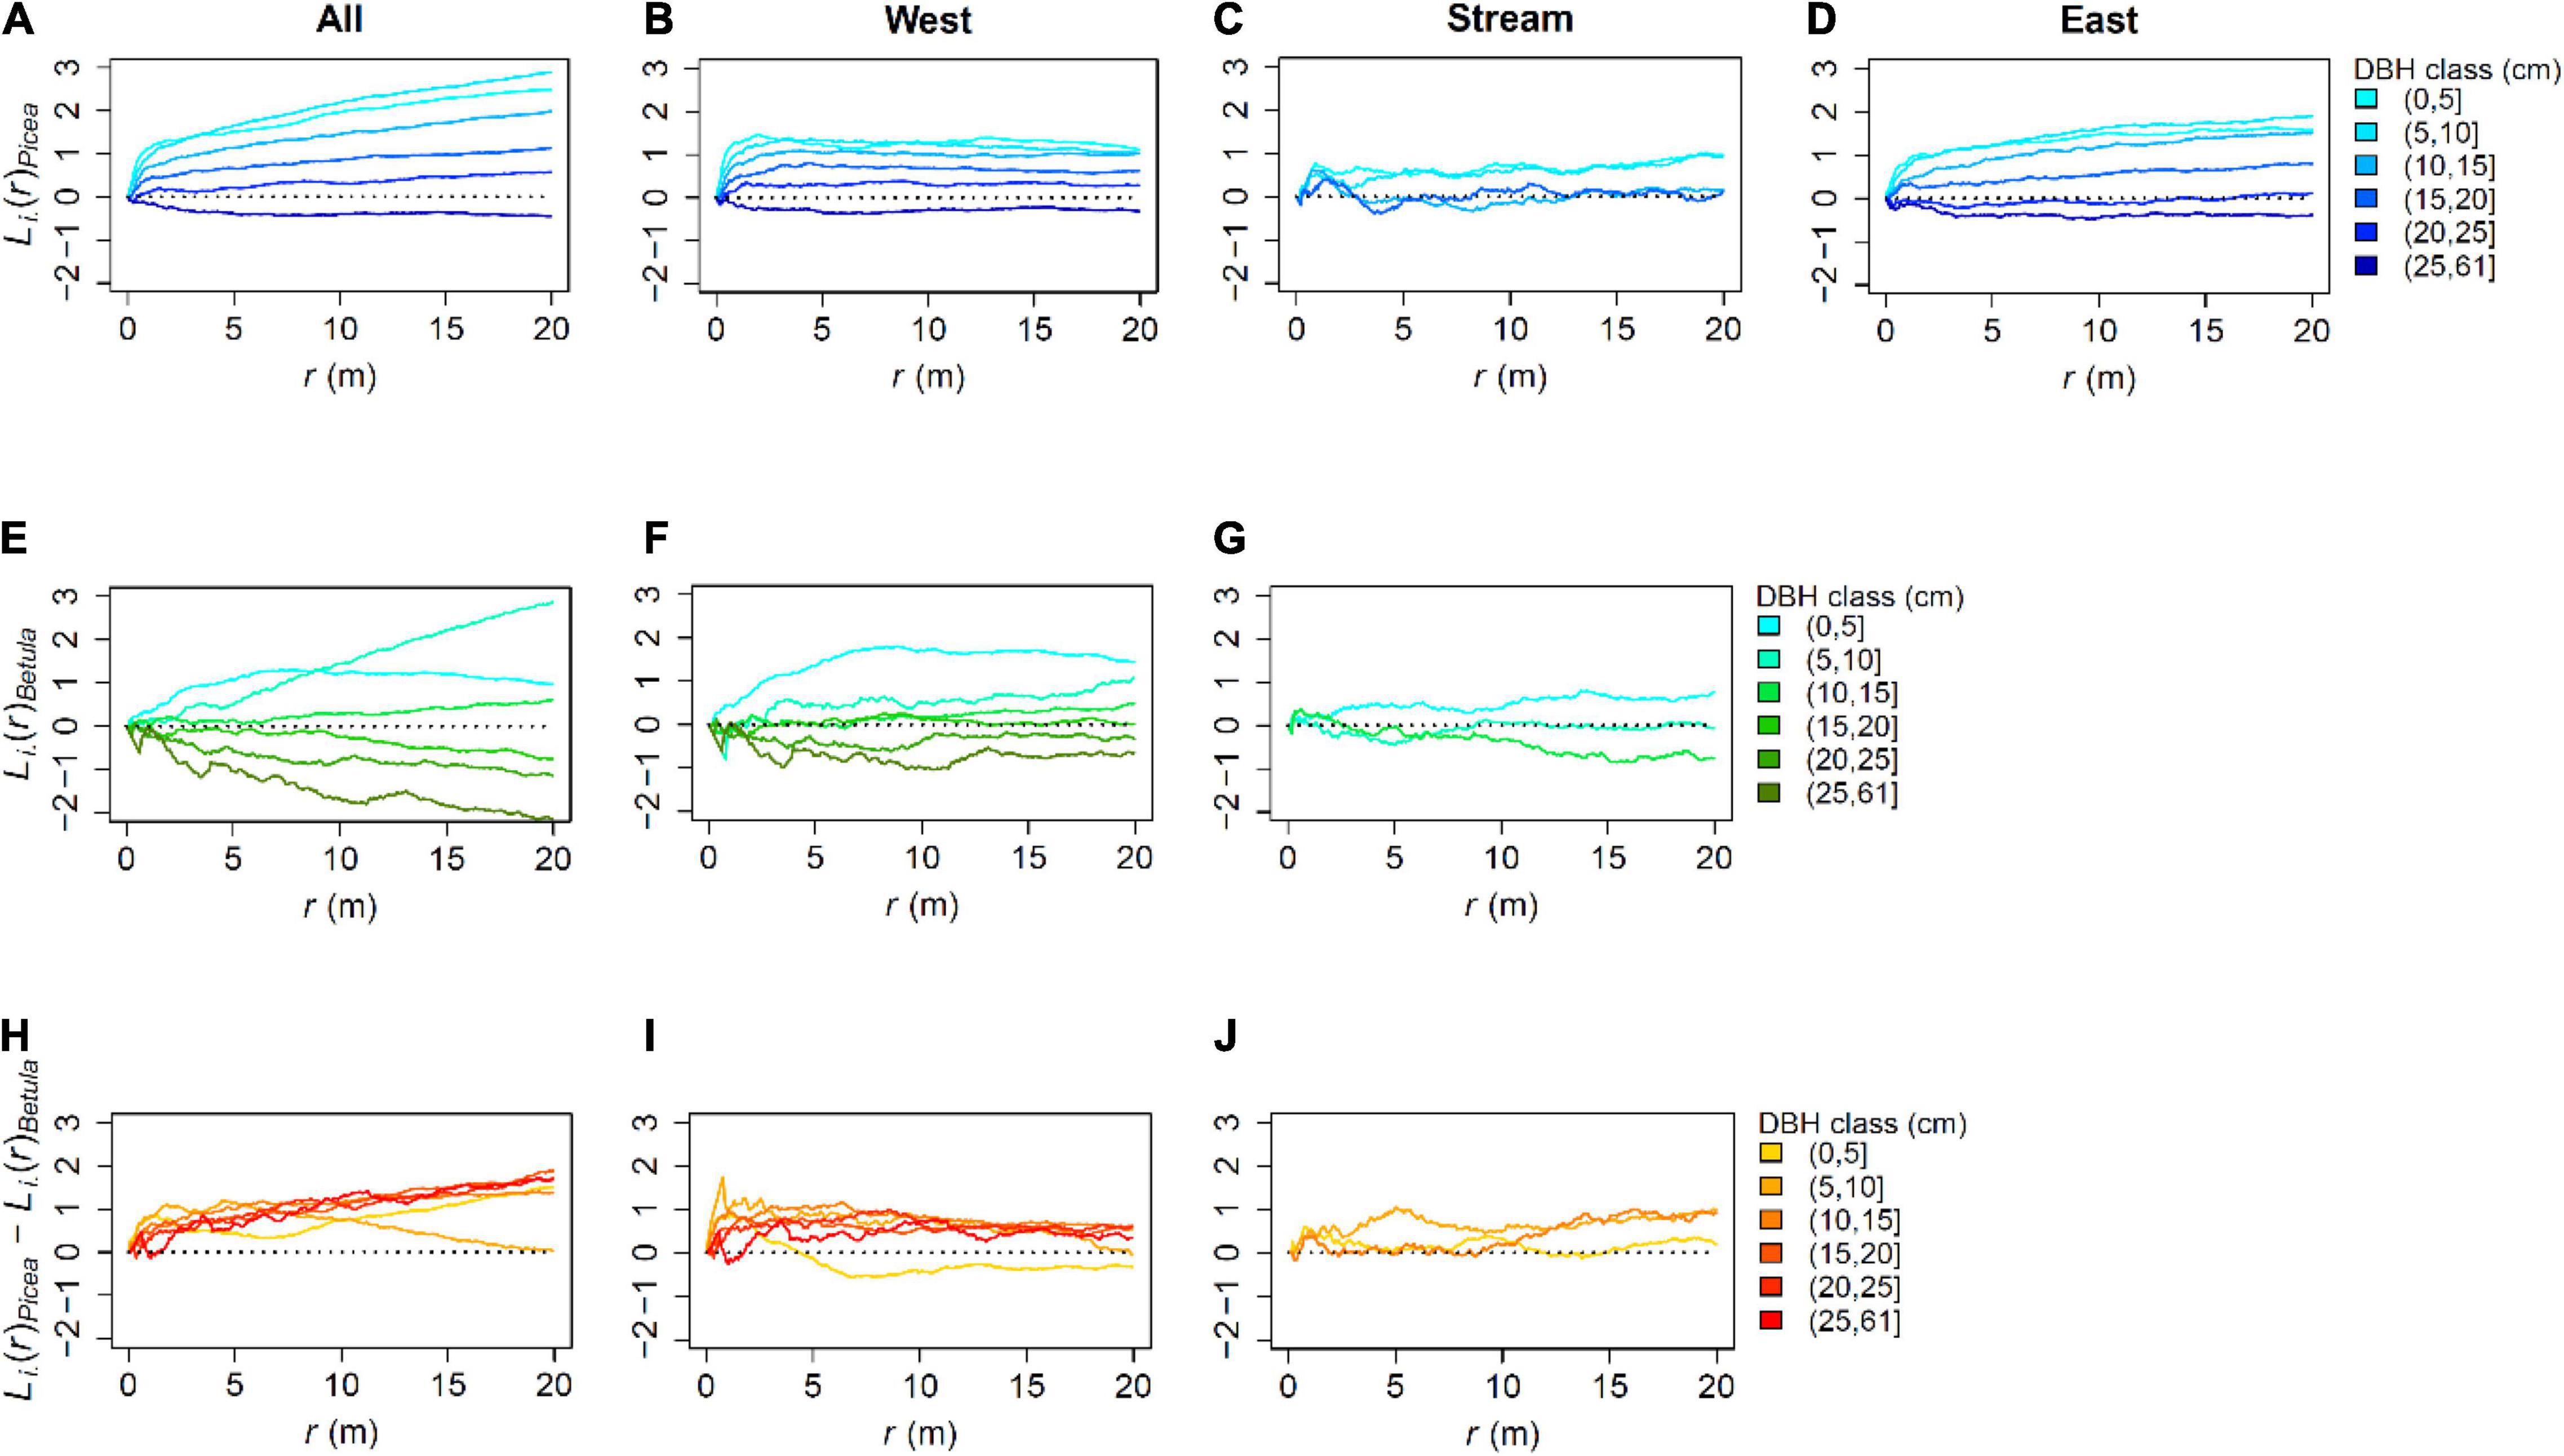
Figure 8. “i-to-any” L-functions for live P. abies, B. pubescens and the function values of P. abies substracted from those for B. pubescens for the whole study plot and the subplots: (A) All Picea, (B) Picea in the West, (C) Picea in the Stream area, (D) Picea in the East, (E) All Betula, (F) Betula in the West, (G) Betula in the Stream area, (H) combined function for all trees, (I) combined function for trees in the West, and (J) combined function for trees in the Stream area. The function values are calculated from the number of trees (of any kind) within a given distance r from trees of the focal type i. The focal types are chosen by species and diameter at breast height (DBH). Thus, the functions can be interpreted as summaries of local tree densities and their scale-dependence around different types of trees. For the combined functions (H–J), values higher than 0 indicate that P. abies grows under higher local densities than B. pubescens.
Local densities around P. abies were higher than those around B. pubescens for nearly all scales and diameter classes studied for the whole plot. At < 5 m distance, there was also a slight tendency of this difference to be bigger in the smaller diameter classes. At the distance of approximately 1 m, there was no difference in local density between the species for trees with DBH > 25 cm. The values of the combined function changed also at larger scales: for trees 5–10 cm DBH, for example, the local densities of B. pubescens at coarse scales approached those of P. abies between distances of 5–20 m.
The dependencies of local densities on tree size and species remained fairly similar when analyzed separately for the subplots. Especially the West showed clear patterns with little signs of coarse-scale heterogeneity. However, at larger scales, the smallest B. pubescens were growing at somewhat higher densities than the corresponding P. abies. The P. abies for the East also showed fairly consistent patterns, with slow changes in the function values at larger scales, probably caused by the varying tree density within the subplot. The patterns in the stream area were less consistent: the smallest trees tended to grow under higher local densities than larger trees, as did P. abies compared to B. pubescens. However, the patterns were more blurred, and could not be clearly divided into fine- and coarse-scale variation. The patterns observed for the subplots mostly accumulated by 1–5 m.
Nearby trees were smaller than average (Figure 9), both for the whole plot and for the subplots. For the whole plot, the mark correlation function for tree DBH had the value of approximately 10 for zero distances whereas the expected value for the function was 15.1 (mean tree DBH in cm). The function values quickly increased within approximately 5 meters, after which the function approached the expected value more slowly. The functions for the subplots showed similar behavior. However, the expected value varied according to the mean tree size within the subplots, and the pattern for the stream area was blurred.
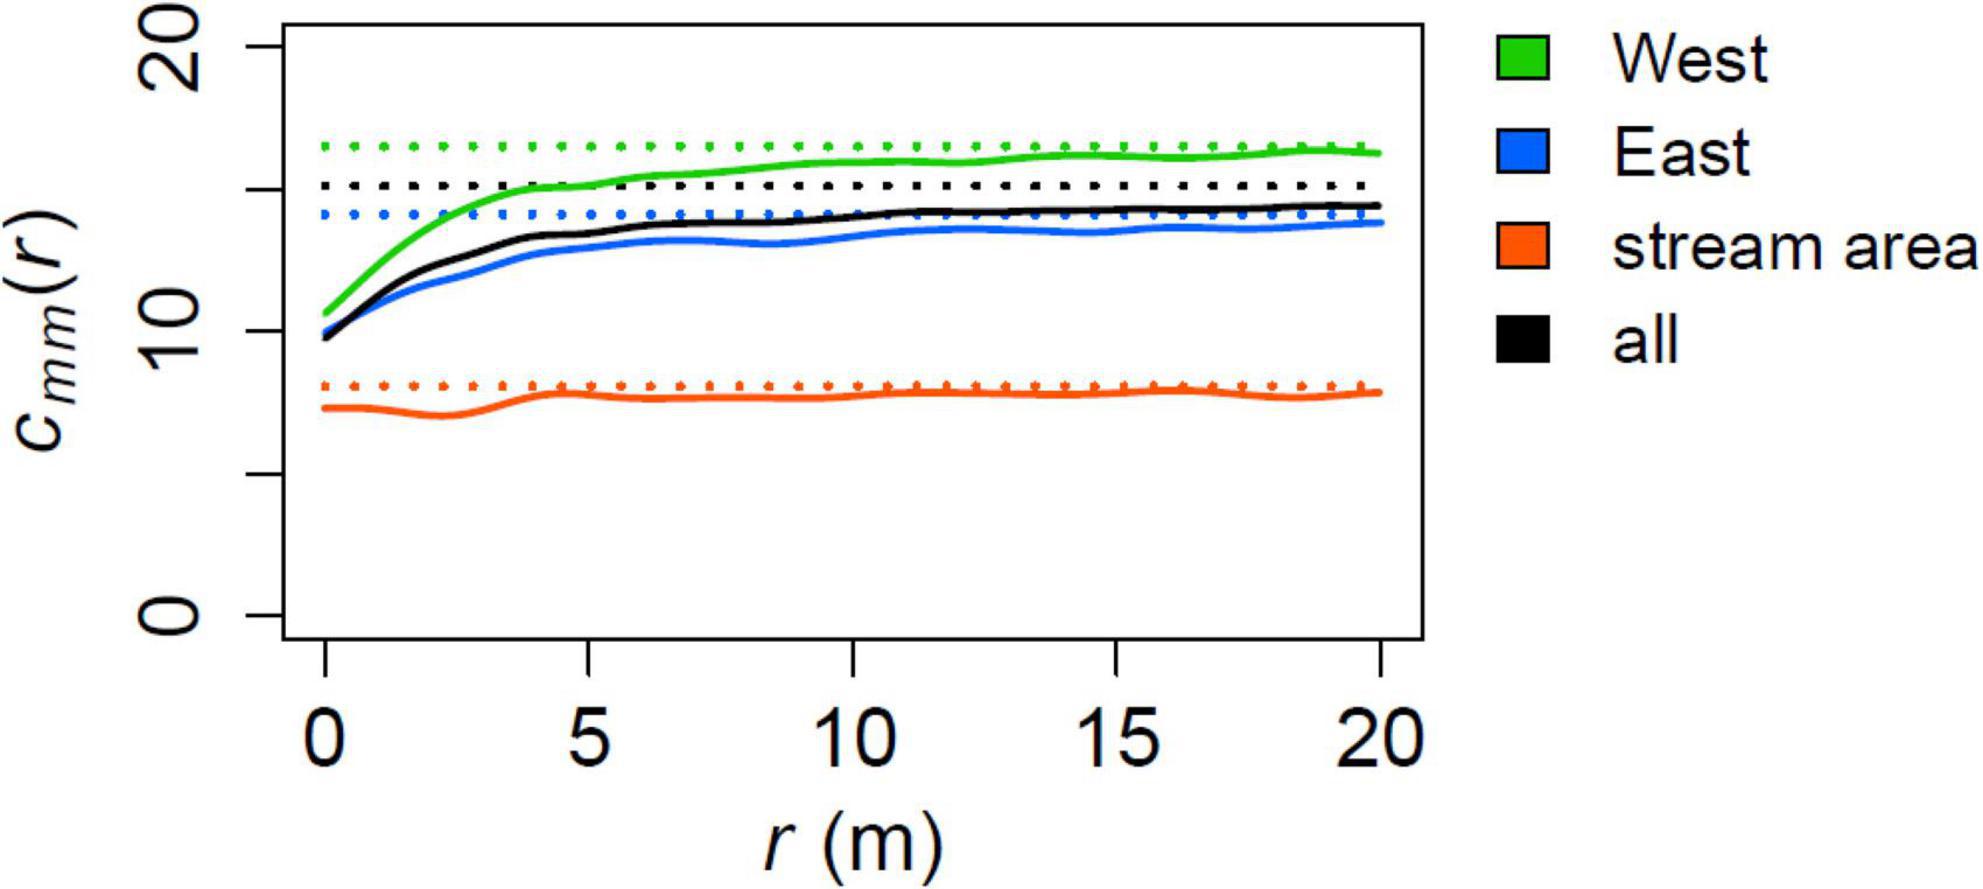
Figure 9. Mark correlation functions cmm(r) for diameter of living trees in the subplots and for the whole study area with their expected values (dotted lines). Calculated with test function t(m1,m2) = (m1 + m2)/2. The function can be interpreted as the expected mean of the diameters of two trees separated by distance r. Note the differing expected values (mean diameters) between the subplots.
Discussion
We studied the partitioning of horizontal space among trees in an old-growth spruce forest in subarctic Fennoscandia. We detected forest structural patterns that generally have been related to among-tree competition: tree growing space increased with tree size and shade-intolerant B. pubescens occupied more growing space than shade-tolerant P. abies. In addition, trees close to each other were smaller than average. The patterns mostly occurred over short distances of a few meters, but also showed larger-scale variation related to the larger-scale structural heterogeneity in the composition of the forest.
The detected pattern of larger trees growing less densely than smaller trees is consistent with observations in even-aged forests with a closed canopy (Kenkel et al., 1997). A related pattern of large trees growing in a less clustered manner than smaller trees has been found both in even-aged (Kenkel et al., 1997) and uneven-aged forests (Moeur, 1993; Getzin et al., 2008). The aggregated pattern of small trees may be due to clustered tree recruitment that is related to the availability of “safe” regeneration microsites, such as dead decayed wood, or vegetative reproduction (Pielou, 1961; Kuuluvainen and Kalmari, 2003; Awada et al., 2004). The more dispersed distribution of large trees compared to small trees is consistent with competition-driven mortality around trees as they grow and physically occupy more space and resources (Moeur, 1997). In addition, among-tree competition can increasingly inhibit growth with increasing tree density, contributing to the pattern of smaller trees growing in denser clusters than more widely scattered trees (Wyszomirski and Weiner, 2009). Thus, trees close to each other being smaller than average (Figure 9) may also indicate competitive growth inhibition (Pommerening, 2002; Gray and He, 2009).
Among-tree competition has been shown to affect forest dynamics also in open-canopied subarctic forests (Hofgaard, 1993; Doležal et al., 2006; Fraver et al., 2014). Moreover, similar to forests with a closed canopy, large trees have been observed to grow in a more dispersed manner than smaller trees, which indicates the effect of among-tree competition on forest structures (Doležal et al., 2006). Our observations that tree growing space increased with tree size and that nearby trees were smaller than average are consistent with similar competition-related patterns documented earlier in boreal forests with more closed canopy structure (Kenkel et al., 1997; Gray and He, 2009). Thus, our results support the idea that among-tree competition, potentially for underground resources in particular, shapes the structure and dynamics also in these late-successional forests, despite their low density and open canopy structure.
B. pubescens had more growing space than P. abies. The result reflects the life-history traits of the species, with the shade-intolerant B. pubescens requiring more growing space than the shade-tolerant P. abies (Hynynen, 1993; Niinemets and Valladares, 2006). Thus, the coherence of the observed pattern in all diameter classes, as well as differences in the level and shape of the response in the GAM-models, can be explained by B. pubescens preferentially reproducing under lower local densities and being more susceptible to density-dependent competition also in later life-stages than P. abies (Doležal et al., 2006; Lilja et al., 2006). On the other hand, it is unclear whether the species-dependent differences in the growing space of small trees are caused more by differing preferences in safe regeneration microsites than by competition for available space. The effects of below-ground competition have been studied in more southern forests (e.g., Kuuluvainen et al., 1993; Martens et al., 1997; Axelsson et al., 2014). However, it is unclear to what extent any competition would occur as above-ground competition between tree crowns and as below-ground root competition in open-canopied subarctic forests. However, our results give an example of how tree species affects the partitioning of space between trees, and thus, forest structure and dynamics in these northern forests.
Since B. pubescens tended to form clumps of several stems (stools), the space available for individual stems was smaller than suggested by our results. We tested this effect by dividing each Voronoi area with the number of stems the tree had. This did not change the pattern that larger trees had more space than smaller trees. However, it did reduce the differences between growing spaces of B. pubescens and P. abies to 0.4–4.0 m2 for other DBH classes than 15–20 cm, in which P. abies had in average 2.5 m2 more space than B. pubescens. However, the majority of B. pubescens side stems were very small.
The diameter- and species-specific differences in local densities mostly accumulated within short distances of approximately 1–5 m, and the mark correlation functions for tree DBH mostly reached their plateaus before 5 m. These distances can be interpreted as the scale of among-tree interactions weakening with distance (Pommerening and Särkkä, 2013; Aakala et al., 2018). On the other hand, among-tree interactions co-occur with other potential fine-scale factors affecting forest structure, such as the availability of regeneration microsites and vegetative reproduction. Indeed, there was one especially dense cluster of small B. pubescens, probably sprouts, about 15 m in diameter in the West. This cluster caused an increase in the corresponding i-to-any L-function values. Thus, fine-scale patterns observed seem to be affected by vegetative reproduction by B. pubescens in the study area. The high reindeer density in the region most likely inhibits regeneration and early growth of B. pubescens so that regeneration of new stems is confined to existing birch stools. In these forests, P. abies is also known to be able to produce vegetative stems by adventitious rooting of moss-covered lower branches (Heikinheimo, 1920), but this appears to be rare in our study area.
The patterns observed in the stream area were more blurred as compared to those in the East and the West. This can be due to smaller number of trees used for the analyses in the subarea. However, the stream area was characterized by a high density of stunted trees, and additional competition by Salix lapponum shrubs. Thus, it is possible that the underlying pattern somewhat differs in the stream area as compared to the East and the West.
The study plot incorporated coarse scale topoedaphic variation. This variation was reflected in differing tree densities, diameters and tree species composition in the three subplots studied (see also Supplementary Information 1). The amount of growing space varied rather consistently between the subplots when comparing mean Voronoi areas by DBH class and species: the trees in the East occupied the least growing space, followed by the stream area and the West. Thus, the study area illustrates how forest structures and the allocation of space can vary in a forest landscape (Wiegand et al., 2007; Getzin et al., 2008). Regardless of the variation of tree density within the plot, the relative dependencies of growing space on tree size and species remained relatively consistent, which suggests similar driving factors throughout the entire plot.
Overall, the density of the forest and the space available to trees was highly variable, with the Voronoi polygon areas varying between 0.2 and 111.0 m2. The scale observed in allocation of space among individual trees, a few meters, supports the earlier thoughts that among-tree competition more strongly occurs in dense clusters of trees whereas more widely scattered trees may better escape among-tree competition (Doležal et al., 2006; Aakala et al., 2018). On the other hand, should these forests become denser in the future (MacDonald et al., 2008; Kulha et al., 2020), the importance of among-tree competition can be expected to increase.
This study was based on a single large plot (8.8 ha), potentially limiting its generalizability. However, the exceptionally large study plot enabled a detailed analysis of within-stand variation in the allocation of space among trees and reduced the role of edge effects that are problematic in spatial analyses of small plots. Moreover, tree-tree interactions occur over limited distances, and hence relying on such a large plot allows characterization of both these interactions that shape forest structures at fine scales, as well as the natural variability in forest structure and topoedaphic conditions that typically results in larger scale variation in forest structure (Kulha et al., 2020).
In the open-canopy forest studied here, light is obviously not the main factor limiting tree recruitment. Instead, the availability of safe regeneration microsites seems important and generates clustered distributions of small trees. This is a difference to closed-canopied forests where small trees are clustered in gaps due to limitations in light availability, while regeneration microsites also play a role (Muscolo et al., 2014). Hence, even though the factors limiting regeneration are different in importance in open- vs. closed-canopied forests, clustered distributions of small trees are commonly observed in both (Awada et al., 2004; Doležal et al., 2006).
The significance of among-tree competition is less evident in open-canopied forests as compared to closed-canopied forests where its role has long been recognized. However, our results suggest that also in open-canopied forests with variable density, due to clustered regeneration, there is sufficient among-tree competition to affect spatial assembly of trees at the stand-scale. Thus, in both open- and closed-canopied forests, clustered regeneration and consequent among-tree competition seem to be the main drivers of tree patterns. These patterns include increased regularity and growing space as trees grow, possibly also positive autocorrelation of tree sizes. Nevertheless, contrasting patterns, such as negative autocorrelation of tree sizes have also been observed in other studies of subarctic forests (Doležal et al., 2006).
Since tree regeneration in northern open-canopy forests does not seem to be as strongly related to canopy gaps as in closed-canopy forests, also the species-specific dynamics may not be as much affected by the availability of light. In closed-canopy forests, shade-intolerant trees are known to regenerate mainly in sufficiently large canopy gaps with ample light availability (Leemans, 1991; McCarthy, 2001). In northern open-canopied forests, also light availability, but especially the availability of “safe” regeneration microsites are important for early survival of trees (Hofgaard, 1993). Moreover, preferences for these microsites may be tree species-specific (Grenfell et al., 2011). Even though regeneration in open-canopied forests is not as limited by above-ground growing space as in closed-canopy forests, in both, there may be species-specific patterns in the partitioning of growing space, possibly induced by tree-tree competition (Table 2; Pretzsch and Biber, 2005).
Data Availability Statement
The data and R code used for analysis are available at: doi: 10.6084/m9.figshare.19698352.v1.
Author Contributions
TK and TA formulated the original research idea and planned the data collection. TK, TA, and PP focalized the research questions. PP and TA participated in the data collection. PP analyzed the data, with contribution from TA. PP wrote the first draft of the manuscript. All authors contributed to writing the final manuscript version.
Funding
This project was funded by the Kone Foundation and Niemi Foundation (20180052 to NK).
Conflict of Interest
The authors declare that the research was conducted in the absence of any commercial or financial relationships that could be construed as a potential conflict of interest.
Publisher’s Note
All claims expressed in this article are solely those of the authors and do not necessarily represent those of their affiliated organizations, or those of the publisher, the editors and the reviewers. Any product that may be evaluated in this article, or claim that may be made by its manufacturer, is not guaranteed or endorsed by the publisher.
Acknowledgments
We cordially thank Markku Larjavaara, Jussi Kauhanen, Helinä Poutamo, Sara Lankinen, and Rabins Gaudel for their contribution to data collection.
Supplementary Material
The Supplementary Material for this article can be found online at: https://www.frontiersin.org/articles/10.3389/ffgc.2022.817248/full#supplementary-material
References
Aakala, T. (2018). Forest fire histories and tree age structures in Värriö and Maltio Strict Nature Reserves. Northern Finland. Boreal. Env. Res. 23, 209–219.
Aakala, T., Berninger, F., and Starr, M. (2018). The roles of competition and climate in tree growth variation in northern boreal old-growth forests. J. Veg. Sci. 29, 1040–1051. doi: 10.1111/jvs.12687
Aakala, T., Hari, P., Dengel, S., Newberry, S. L., Mizunuma, T., and Grace, J. (2014). A prominent stepwise advance of the tree line in north-east Finland. J. Ecol. 102, 1582–1591. doi: 10.1111/1365-2745.12308
Aakala, T., Shimatani, K., Abe, T., Kubota, Y., and Kuuluvainen, T. (2016). Crown asymmetry in high latitude forests: disentangling the directional effects of tree competition and solar radiation. Oikos 125, 1035–1043. doi: 10.1111/oik.02858
Awada, T., Henebry, G. M., Redmann, R. E., and Sulistiyowati, H. (2004). Picea glauca dynamics and spatial pattern of seedlings regeneration along a chronosequence in the mixedwood section of the boreal forest. Ann. For. Sci. 61, 789–794. doi: 10.1051/forest:2004079
Axelsson, E. P., Lundmark, T., Högberg, P., and Nordin, A. (2014). Belowground competition directs spatial patterns of seedling growth in boreal pine forests in Fennoscandia. Forests 5, 2106–2121. doi: 10.3390/f5092106
Baddeley, A. (2008). Analysing spatial point patterns in R. Australia: CSIRO and University of Western Australia
Baddeley, A. J., Møller, J., and Waagepetersen, R. (2000). Non-and semi-parametric estimation of interaction in inhomogeneous point patterns. Stat. Neerland. 54, 329–350. doi: 10.1111/1467-9574.00144
Baddeley, A., Rubak, E., and Turner, R. (2015). Spatial point patterns: methodology and applications with R. Boca Raton: CRC Press.
Bonan, G. B., and Shugart, H. H. (1989). Environmental factors and ecological processes in boreal forests. Ann. Rev. Ecol. Syst. 20, 1–28. doi: 10.1146/annurev.es.20.110189.000245
Burton, P. (2013). Exploring complexity in boreal forests. Managing forests as complex adaptive systems. Building resilience to the challenge of global change. London: Routledge, 79–109.
Caron, M.-N., Kneeshaw, D. D., Grandpré, L. D., Kauhanen, H., and Kuuluvainen, T. (2009). Canopy gap characteristics and disturbance dynamics in old-growth Picea abies stands in northern Fennoscandia: Is the forest in quasi-equilibrium? Ann. Bot. Fennici 46, 251–262. doi: 10.5735/085.046.0402
Delignette-Muller, M. L., and Dutang, C. (2015). fitdistrplus: An R package for fitting distributions. J. Stat. Soft. 64, 1–34.
Doležal, J., Šrutek, M., Hara, T., Sumida, A., and Penttilä, T. (2006). Neighborhood interactions influencing tree population dynamics in nonpyrogenous boreal forest in northern Finland. Plant Ecol. 185, 135–150. doi: 10.1007/s11258-005-9090-3
Engelmark, O., Hofgaard, A., and Arnborg, T. (1998). Successional trends 219 years after fire in an old Pinus sylvestris stand in northern Sweden. J. Veg. Sci.. 9, 583–592. doi: 10.2307/3237274
Fick, S. E., and Hijmans, R. J. (2017). WorldClim 2: new 1-km spatial resolution climate surfaces for global land areas. Int. J. Climatol. 37, 4302–4315. doi: 10.1002/joc.5086
Fraver, S., D’Amato, A. W., Bradford, J. B., Jonsson, B. G., Jönsson, M., and Esseen, P. A. (2014). Tree growth and competition in an old-growth Picea abies forest of boreal Sweden: influence of tree spatial patterning. J. Veg. Sci. 25, 374–385. doi: 10.1111/jvs.12096
Gauthier, S., Bernier, P., Kuuluvainen, T., Shvidenko, A., and Schepaschenko, D. (2015). Boreal forest health and global change. Science 349, 819–822. doi: 10.1126/science.aaa9092
Gavrikov, V., Grabarnik, P. Y., and Stoyan, D. (1993). Trunk-top relations in a Siberian pine forest. Biometrical J. 35, 487–498. doi: 10.1002/bimj.4710350412
Getzin, S., Wiegand, T., Wiegand, K., and He, F. (2008). Heterogeneity influences spatial patterns and demographics in forest stands. J. Ecol. 96, 807–820. doi: 10.1111/j.1365-2745.2008.01377.x
Gray, L., and He, F. (2009). Spatial point-pattern analysis for detecting density-dependent competition in a boreal chronosequence of Alberta. For. Ecol. Manag. 259, 98–106. doi: 10.1016/j.foreco.2009.09.048
Grenfell, R., Aakala, T., and Kuuluvainen, T. (2011). Microsite occupancy and the spatial structure of understorey regeneration in three late-successional Norway spruce forests in northern Europe. Silva Fennica 45, 1093–1110.
He, F., and Duncan, R. P. (2000). Density-dependent effects on tree survival in an old-growth Douglas fir forest. J. Ecol. 88, 676–688. doi: 10.1046/j.1365-2745.2000.00482.x
Heikinheimo, O. (1920). Kuusen iän määräämisestä ja kuusen myöhäisjuurista = Über die Bestimmung des Alters der Fichte und ihre Adventivwurzeln. Helsinki: Metsätieteellinen koelaitos.
Hofgaard, A. (1993). Structure and regeneration patterns in a virgin Picea abies forest in northern Sweden. J. Veg. Sci. 4, 601–608. doi: 10.2307/3236125
Hogg, R. V., McKean, J. W., and Craig, A. T. (2019). Introduction to Mathematical Statistics, 8th Edn. London: Pearson.
Hynynen, J. (1993). Self-thinning models for even-aged stands of Pinus sylvestris, Picea abies and Betula pendula. Scandinavian J. For. Res. 8, 326–336. doi: 10.1080/02827589309382781
Hyvönen, R., Agren, G., Linder, S., Persson, T., Cotrufo, M., Ekblad, A., et al. (2007). The likely impact of elevated [CO2], nitrogen deposition, increased temperature and management on carbon sequestration in temperate and boreal forest ecosystems: a literature review. New Phytol. 173, 463–480. doi: 10.1111/j.1469-8137.2007.01967.x
Illian, J., Penttinen, A., Stoyan, H., and Stoyan, D. (2008). Statistical analysis and modelling of spatial point patterns. Chichester: John Wiley & Sons.
Kenkel, N. (1988). Pattern of self-thinning in jack pine: testing the random mortality hypothesis. Ecology 69, 1017–1024. doi: 10.2307/1941257
Kenkel, N., Hendrie, M., and Bella, I. (1997). A long-term study of Pinus banksiana population dynamics. J. Veg. Sci. 8, 241–254. doi: 10.1093/aob/mcm320
Kenkel, N., Hoskins, J., and Hoskins, W. (1989). Edge effects in the use of area polygons to study competition. Ecology 70, 272–274. doi: 10.2307/1938433
Korsman, K., Koistinen, T., Kohonen, J., Wennerström, M., Ekdahl, E., Honkamo, M., et al. (1997). Suomen kallioperäkartta – berggrundskarta över Finland – Bedrock map of Finland. 1, : 1 000 000 Espoo: Geological Survey of Finland.
Kulha, N., Pasanen, L., Holmström, L., De Grandpré, L., Gauthier, S., Kuuluvainen, T., et al. (2020). The structure of boreal old-growth forests changes at multiple spatial scales over decades. Lands. Ecol. 35, 843–858. doi: 10.1007/s10980-020-00979-w
Kulha, N., Pasanen, L., Holmström, L., De Grandpré, L., Kuuluvainen, T., and Aakala, T. (2019). At what scales and why does forest structure vary in naturally dynamic boreal forests? An analysis of forest landscapes on two continents. Ecosystems 22, 709–724. doi: 10.1007/s10021-018-0297-2
Kuuluvainen, T. (1992). Tree architectures adapted to efficient light utilization: is there a basis for latitudinal gradients? Oikos 275–284. doi: 10.2307/3545019
Kuuluvainen, T. (2002). Natural variability of forests as a reference for restoring and managing biological diversity in boreal Fennoscandia. Silva Fennica 36, 97–125.
Kuuluvainen, T., and Aakala, T. (2011). Natural forest dynamics in boreal Fennoscandia: a review and classification. Silva Fennica 45, 823–841.
Kuuluvainen, T., and Kalmari, R. (2003). Regeneration microsites of Picea abies seedlings in a windthrow area of a boreal old-growth forest in southern Finland. Ann. Bot. Fennici 401–413.
Kuuluvainen, T., and Siitonen, J. (2013). “Fennoscandian boreal forests as complex adaptive systems. Properties, management challenges and opportunities,” in Managing Forests as Complex Adaptive Systems. Building Resilience to the Challenge of Global Change, eds C. Messier, K. J. Puettman, and K. D. Coates. (Oxford: Earthscan from Routledge)
Kuuluvainen, T., Hofgaard, A., Aakala, T., and Jonsson, B. G. (2016). North Fennoscandian mountain forests: History, composition, disturbance dynamics and the unpredictable future. For. Ecol. Manag. 385, 140–149. doi: 10.1016/j.foreco.2016.11.031
Kuuluvainen, T., Hokkanen, T. J., Järvinen, E., and Pukkala, T. (1993). Factors related to seedling growth in a boreal Scots pine stand: a spatial analysis of a vegetation–soil system. Can. J. For. Res. 23, 2101–2109. doi: 10.1139/x93-262
Laasasenaho, J. (1982). Taper curve and volume functions for pine, spruce and birch. Finland: Metsäntutkimuslaitos.
Landres, P. B., Morgan, P., and Swanson, F. J. (1999). Overview of the use of natural variability concepts in managing ecological systems. Ecol. Appl. 9, 1179–1188. doi: 10.2307/2641389
Larson, A. J., Lutz, J. A., Donato, D. C., Freund, J. A., Swanson, M. E., HilleRisLambers, J., et al. (2015). Spatial aspects of tree mortality strongly differ between young and old-growth forests. Ecology 96, 2855–2861. doi: 10.1890/15-0628.1
Leemans, R. (1991). Canopy gaps and establishment patterns of spruce (Picea abies (L.) Karst.) in two old-growth coniferous forests in central Sweden. Vegetatio 93, 157–165. doi: 10.1007/bf00033209
Lilja, S., Wallenius, T., and Kuuluvainen, T. (2006). Structure and development of old Picea abies forests in northern boreal Fennoscandia. Ecoscience 13, 181–192. doi: 10.2980/i1195-6860-13-2-181.1
Looney, C. E., D’Amato, A. W., Palik, B. J., Fraver, S., and Kastendick, D. N. (2018). Size-growth relationship, tree spatial patterns, and tree-tree competition influence tree growth and stand complexity in a 160-year red pine chronosequence. For. Ecol. Manag. 424, 85–94. doi: 10.1016/j.foreco.2018.04.044
Lundqvist, L., and Elfving, B. (2010). Influence of biomechanics and growing space on tree growth in young Pinus sylvestris stands. For. Ecol. Manag. 260, 2143–2147. doi: 10.1016/j.foreco.2010.09.006
Lundqvist, L., and Nilson, K. (2007). Regeneration dynamics in an uneven-aged virgin Norway spruce forest in northern Sweden. Scandinavian J. For. Res. 22, 304–309. doi: 10.1080/02827580701479717
Lutz, J. A., Larson, A. J., Furniss, T. J., Donato, D. C., Freund, J. A., Swanson, M. E., et al. (2014). Spatially nonrandom tree mortality and ingrowth maintain equilibrium pattern in an old-growth Pseudotsuga–Tsuga forest. Ecology 95, 2047–2054. doi: 10.1890/14-0157.1
MacDonald, G., Kremenetski, K., and Beilman, D. (2008). Climate change and the northern Russian treeline zone. Philos. Trans.R. Soc. B 363, 2283–2299. doi: 10.1098/rstb.2007.2200
Martens, S. N., Breshears, D. D., Meyer, C. W., and Barnes, F. J. (1997). Scales of aboveground and below-ground competition in a semi-arid woodland detected from spatial pattern. J. Veg. Sci. 8, 655–664. doi: 10.2307/3237370
McCarthy, J. (2001). Gap dynamics of forest trees: a review with particular attention to boreal forests. Environ. Rev. 9, 1–59. doi: 10.1139/a00-012
McKinley, D. C., Ryan, M. G., Birdsey, R. A., Giardina, C. P., Harmon, M. E., Heath, L. S., et al. (2011). A synthesis of current knowledge on forests and carbon storage in the United States. Ecol. Appl. 21, 1902–1924. doi: 10.1890/10-0697.1
Mehtätalo, L. (2015). Lmfor: Functions for forest biometrics. R package version 1.4. https://CRAN.R-project.org/package=lmfor.
Messier, C., Puettmann, K. J., and Coates, K. D. (2013). Managing forests as complex adaptive systems: building resilience to the challenge of global change. London: Routledge.
Moeur, M. (1993). Characterizing spatial patterns of trees using stem-mapped data. For. Sci. 39, 756–775.
Moeur, M. (1997). Spatial models of competition and gap dynamics in old-growth Tsuga heterophylla/Thuja plicata forests. For. Ecol. Manag. 94, 175–186. doi: 10.1016/s0378-1127(96)03976-x
Muscolo, A., Bagnato, S., Sidari, M., and Mercurio, R. (2014). A review of the roles of forest canopy gaps. J. For. Res. 25, 725–736. doi: 10.1007/s11676-014-0521-7
Näslund, M. (1937). Skogsförsöksanstaltens gallringsförsök i tallskog, Meddelanden från Statens Skogsförsöksanstalt. 29.
Niinemets, Ü, and Valladares, F. (2006). Tolerance to shade, drought, and waterlogging of temperate Northern Hemisphere trees and shrubs. Ecol. Monogr. 76, 521–547. doi: 10.1890/0012-9615(2006)076[0521:ttsdaw]2.0.co;2
Nilsson, S. G., Hedin, J., and Niklasson, M. (2001). Biodiversity and its assessment in boreal and nemoral forests. Scandinavian J. For. Res. 16, 10–26. doi: 10.1111/1462-2920.15058
Okabe, A., Boots, B., Sugihara, K., Chiu, S. N., and Kendall, D. G. (2000). Spatial tessellations—concepts and applications of Voronoi diagram. Chichester: Wiley & Sons
Perry, G. L., Miller, B. P., and Enright, N. J. (2006). A comparison of methods for the statistical analysis of spatial point patterns in plant ecology. Plant Ecol. 187, 59–82. doi: 10.1007/s11258-006-9133-4
Pielou, E. (1961). Segregation and symmetry in two-species populations as studied by nearest-neighbour relationships. J. Ecol. 49, 255–269. doi: 10.2307/2257260
Pommerening, A. (2002). Approaches to quantifying forest structures. Forestry 75, 305–324. doi: 10.1093/forestry/75.3.305
Pommerening, A., and Särkkä, A. (2013). What mark variograms tell about spatial plant interactions. Ecol. Model. 251, 64–72. doi: 10.1016/j.ecolmodel.2012.12.009
Pretzsch, H., and Biber, P. (2005). A re-evaluation of Reineke’s rule and stand density index. For. Sci. 51, 304–320.
R Development Core Team (2019). R: A language and environment for statistical computing. Vienna, Aus: R foundation for statistical computing
Tikkanen, O.-P., Martikainen, P., Hyvärinen, E., Junninen, K., and Kouki, J. (2006). Red-listed boreal forest species of Finland: associations with forest structure, tree species, and decaying wood. Ann. Zool. Fennici 43, 373–383.
Wiegand, T., and Moloney, K. A. (2013). Handbook of spatial point-pattern analysis in ecology. Boca Raton: CRC press.
Wiegand, T., Gunatilleke, S., Gunatilleke, N., and Okuda, T. (2007). Analyzing the spatial structure of a Sri Lankan tree species with multiple scales of clustering. Ecology 88, 3088–3102. doi: 10.1890/06-1350.1
Wood, S. (2021). Package ‘mgcv’ version 1. 8–39. Available online at: https://cran.r-project.org/web/packages/mgcv/mgcv.pdf.
Wyszomirski, T., and Weiner, J. (2009). Variation in local density results in a positive correlation between plant neighbor sizes. Am. Nat. 173, 705–708. doi: 10.1086/597612
Keywords: tree growing space, Voronoi polygon, spatial structure, old-growth forest, subarctic forest, point pattern analysis, competition, scale
Citation: Pouta P, Kulha N, Kuuluvainen T and Aakala T (2022) Partitioning of Space Among Trees in an Old-Growth Spruce Forest in Subarctic Fennoscandia. Front. For. Glob. Change 5:817248. doi: 10.3389/ffgc.2022.817248
Received: 17 November 2021; Accepted: 27 April 2022;
Published: 09 June 2022.
Edited by:
Peter Potapov, University of Maryland, College Park, United StatesReviewed by:
Borderieux Jeremy, UMR 1434 Silva, FranceYoan Paillet, INRAE Clermont-Auvergne-Rhône-Alpes, France
Copyright © 2022 Pouta, Kulha, Kuuluvainen and Aakala. This is an open-access article distributed under the terms of the Creative Commons Attribution License (CC BY). The use, distribution or reproduction in other forums is permitted, provided the original author(s) and the copyright owner(s) are credited and that the original publication in this journal is cited, in accordance with accepted academic practice. No use, distribution or reproduction is permitted which does not comply with these terms.
*Correspondence: Pasi Pouta, pasi.pouta@helsinki.fi
†ORCID: Pasi Pouta, orcid.org/0000-0003-3568-3457; Niko Kulha, orcid.org/0000-0002-1610-9938; Timo Kuuluvainen, orcid.org/0000-0002-9085-5584; Tuomas Aakala, orcid.org/0000-0003-0160-6410