A Potential Framework for Allocating National Park Service Budgets
 Douglas B. Rideout
 Yu Wei
 Nicole Kernohan
 Andy G. Kirsch2
- 1Department of Forest and Rangeland Stewardship, Colorado State University, Fort Collins, CO, United States
- 2US Department of Interior National Park Service, National Interagency Fire Center, Boise, ID, United States
The US Department of Interior, including the National Park Service (NPS), has interest in developing a national fire budgeting process that reflects and promotes program (fuels and preparedness) efficiencies while being transparent, fair, stable, and predictable. A systematic approach should have the potential to operate at all scales (national, regional, and park). To accomplish these objectives, the research introduced a Budgeting Analysis that can be integrated into the STARFire (Strategic budgeting and planning system for wildland fire). The approach used is known as the “gradient method” reflecting the concept that budgets are allocated based on proportionate performance. Using the gradient method, budget increments were allocated to fuels and preparedness programs to improve return on investment (ROI). Three-dimensional performance surfaces were generated for each of the parks in the NPS’s Alaska Fire Management Zone and a gradient was fit to each surface. The individual park gradients were then used to allocate the zone budget increments to the parks and in turn, to the park’s fuels and preparedness programs. These allocations were then summed up to illustrate regional and park level allocations and allocations by program. The results show how a full range of budget increments can be allocated from the zone to each individual park and to each park’s program. The process and the allocations are repeatable and defensible while meeting the NPS budgeting criteria. They also address the concerns expressed by the US Government Accountability Office and reflect the objectives of the Cohesive Strategy. In the current study, we demonstrate a pragmatic example of implementing this method.
Introduction
The US Department of Interior (DOI) and the US Department of Agriculture’s Forest Service (FS) are tasked with managing wildland fire programs on US federal lands. The DOI and the FS receive wildland fire management funding through annual federal appropriations. The National Park Service (NPS) is one of four DOI bureaus that provide a coordinated response to wildland fire management (WFM). The NPS was interested in developing a national budget analysis that considers national policies, government accountability concerns and current scientific recommendations. The analysis methodology needs to promote program efficiencies, fairness, transparency, and stability.
Wildland fire management activities and budgets are divided among a suite of programs that include preparedness, suppression, fuels management, facilities, and burned area rehabilitation. Fuels management programs involve the strategic removal of fuels (grasses, shrubs, and/or trees) to limit negative effects from wildfires and to restore ecosystems. Preparedness programs address a range of actions that help agencies prepare and respond to wildland fire. Traditionally, fuels management and preparedness have been considered in isolation from one another (Calkin and Gebert, 2006; Gebert et al., 2008; Chung, 2015). Recent research suggests that these two elements of wildland fire management are strongly interrelated (Rideout et al., 2008; Minas et al., 2015; Wei et al., 2016), for example, fuels programs affect preparedness efforts by reducing fire spread rates and fire intensity. As such, this interaction should be considered in budgeting efforts.
Following a severe fire season in 2000, US wildland fire management appropriations increased significantly to a high in 2008 (Hoover, 2017). In response, the US Government Accountability Office (GAO) identified a need for land management agencies to improve the cost-effectiveness of fire programs with better accountability for spending (US Government Accountability Office (GAO), 2002, 2005, 2009). In 2009, The National Cohesive Wildland Fire Management Strategy (Cohesive Strategy) was initiated to address the current wildland fire management challenges (US Department of the Interior and Us Department of Agriculture (USDOI and USDA), 2014). It identified the key goals of restoring and maintaining fire-resilient landscapes while considering “wildfire risk, values at risk, and appropriate response to wildfire at different temporal and geographic scales.” It also recommended establishing performance measures and metrics for assessing the accomplishment of its goals.
Budgets are traditionally used to implement strategic plans, coordinate work, and justify expenditures. A budget analysis provides the framework to incorporate policy, accountability, and current research recommendations. Within the DOI, the Office of Wildland Fire (OWF) is responsible for oversight of the wildland fire management budget. Each fiscal year, the DOI’s Office of Budget publishes its overall budget summary. As revealed in DOI’s 2020 Budget Justification book current budgeting methodologies include line-item budgeting and performance-based budgeting. Line-item budgeting is used in the report to summarize expenditures on its wildland fire management programs. This method compares the previous period’s expenditure with current expenditure to identify changes in spending. Performance-based budgeting is used to clarify government goals and objectives and communicate progress (Melkers and Willoughby, 1998). The budget summary includes a section on wildland fire management program justifications and how the program strategies align with the Cohesive Strategy.
Several key issues emerged from the DOI’s budget summary with respect to addressing issues raised by the GAO, the Cohesive Strategy and current budgeting research recommendations. First, while line-item budgeting is easy to prepare and monitor, it does not demonstrate return on investment (Lindblad, 2019). Such a metric is also recommended in Performance-based budgeting to allow for the measurement of results (Melkers and Willoughby, 1998; Kong, 2005). While the 2019 Budget Summary identifies goals and progress, it is missing performance metrics that would allow the DOI to assess the accomplishment of program goals as required by the Cohesive Strategy and the GAO. Second, the budget summary does not address how to allocate budgets to preparedness and fuels programs simultaneously as recommended by current research. Finally, the budget summary omits any guidance on how to allocate funds with regarding to geographic scale as outlined in the Cohesive Strategy.
In addressing the GAO recommendation that land management agencies improve the cost effectiveness of their programs the NPS required that the Budget Analysis methodology generate cost-efficient frontiers of investment into its programs that are not unduly disruptive to current programs of work while being transparent, fair, and stable. Efficient frontiers were often combined with scenario planning to assess fire risk and prioritize fire management projects with multiple objectives. Ager et al. (2019) examined the tradeoffs between multiple forest management scenarios targeting wildfire risk to the wildland urban interface (WUI) and those meeting agency convertible volume production targets. Palaiologou et al. (2021) tested a multicriteria spatial prioritization framework to identify projects under multiple forest management scenarios that reflected multiple management priorities, treatment constraints, and treatment thresholds. In the context of NPS budgeting, cost-efficient means that additional budget dollars are allocated to their most highly valued alternatives, fairness means that programs are rewarded for their productivity, stable means avoiding unnecessary disruption through excessive budget swings, and transparency means a set of reproducible processes that are predictable and can be applied with new budget years.
The objective of this study is to introduce an application of the gradient method of budgeting in a way that is scalable from the planning unit to the regional and program levels in ways that are consistent with the GAO recommendation and better achieve the goals outlined by the cohesive strategy. To generate supporting data, we selected a previously developed strategic planning and wildland fire management system known as STARFire (Rideout et al., 2017). This system adopted some concepts and analysis processes like other fire risk assessment, fuel treatment prioritization and fire suppression planning studies. For example, STARFire used fire simulations to estimate fire likelihood, intensity levels, and fire effects and identify optimal treatment arrangements based on simulation results (Finney et al., 2011; Ager et al., 2013). It also evaluated the relative importance and values of resources and assets impacted by fire based on a non-market and non-monetized valuation system known as MARS (Rideout et al., 2008). A similar system from Scott et al. (2013) also used the expected non-monetized net value change of highly valued resources and assets to measure the wildfire risk to resources and assets. For regional or national budgeting purposes, STARFire needs to be run across all parks involved in the budgeting analyses to provide consistent, transparent, and stable regional and national comparisons. Note that, for the purpose of regional or national scale fire budgeting, other fire planning systems could have been used if the system would be consistent with the Cohesive strategy and meet GAO requirements. While our focus is on budgeting methodology, we provide a brief background on STARFire for context.
Materials and Methods
STARFire Overview
STARFire is a geospatial budgeting and planning system that consists of four modules: (1) the Wildfire Risk Analysis (WRA), (2) the Landscape Value Analysis (LVA), (3) the Fuel Treatment Analysis (FTA), and (4) the Preparedness Analysis (PA). We provide a brief overview of the STARFire system noting that the system has been described in a series of publications (e.g., Rideout et al., 2017). The general budgeting approach developed here is not limited to STARFire, as it could be used with other underlying fire planning approaches. Common to all modules is the incorporation of a set of fire affected values as described in detail in Rideout et al. (2008, 2017). In short, all fire affected values are spatially identified across the landscape. The marginal value of fire effects is elicited from fire management officials as rates of substitution (positive and negative). These are assessed by fire intensity level and ecosystem condition. Expected values are then calculated, as appropriate by module, by introducing ignition or burn probabilities as appropriate.
The WRA module estimates the wildfire transmission (i.e., risk source) to valued resources and assets in the landscape. We designed a cellular-based fire spread model (Rideout et al., 2008; Wei et al., 2008; Rideout and Wei, 2013) to simulate the probability of fire growth from each ignition cell. FlamMap (v 5.0) was first used to generate both fire behavior data and simulate many fires to create burn probability maps. FlamMap inputs (slope, aspect, elevation, canopy cover, canopy base height, canopy bulk density and fuel model) were obtained from LANDFIRE (v 1.3.0 used in this study). Weather information required by FlamMap (wind speed and fuel moistures) was obtained from National Predictive Service. The rate of spread and burn probability maps from a FlamMap run were used to estimate the conditional probability of fire spread between cells. Once a fire probability footprint was produced from an ignition cell, STARFire estimates the expected net benefit (loss) within the fire footprint and stores it back at the ignition cell. Fuel treatment and preparedness programs may change the ignition probability and conditional probability of fire spread from a raster cell.
The LVA calculates the wildfire risk to valued resources and assets in the landscape and fuel treatment effects. It uses the same inputs raster maps as WRA including conditional probability of fire spread and other fire behavior spatial data, i.e., fire intensity (BTU/ ft2), flame length (meters) and rate of spread (m/sec). In addition, LVA uses ignition probability map that was estimated from historical ignitions data. STARFire used ignition history data over at least a decade and converted using a kernel density function in the ESRI software to develop an ignition probability map. Fires were ignited and grown from all cells in a landscape following ignition and spread probabilities. LVA then estimated the probability and value change of each cell being burned at different intensity levels was multiplied by the fire loss and benefits at the corresponding intensity in that cell. The LVA module calculates the expected land values in each raster cell “prior” and “post” fire management decisions. The value differences prior and post to any fire management effort, combined with treatment cost, reveals the expected return on investment (ROI) for engaging fire management programs (preparedness and fuel treatments). ROI is the expected marginal fire effected value divided by treatment cost (Rideout et al., 2017). The fire affected values, either losses or benefits, and management cost were identified in close collaboration with NPS officials, and their marginal values were assessed using rates of substitution (Rideout et al., 2008).
The FTA uses the expected ROI surface generated in the LVA module to inform fuel treatment selections at any given budget level. The FTA first produces a rank order of all burnable cells on the landscape by ROI until the budget is expended. STARFire simulated treatments on the ranked cells until the budget was expended to produce a “post-treatment” surface. This capital budgeting technique produces the greatest overall return at each budget level. We analyzed this rank order for each budget level for each park by updating the fire behavior for the treated cells and comparing the “pre-treatment” LVA with the “post-treatment” LVA for each budget level. To assess the impact of a fuels management program to preparedness program, we incrementally increased the preparedness budget to the maximum value of the preparedness budget under each selected fuel treatment budget level.
STARFire’s PA module includes the dual importance of reducing wildfire risk to highly valued resources (via initial attack) and the management of beneficial wildfire for resource improvement or ecological restoration (Rideout et al., 2016). The STARFire PA requires identifying dispatch locations, travel times, ignition probability, and rates of spread generated from the previous analyses. The dispatch locations and a travel cost surface were supplied by the NPS. We incrementally increased the preparedness budget to each park to estimate the LVA from the preparedness program. STARFire assumes that the probability of containing a fire within a user defined IA standard (e.g., 121 ha) depends upon how fast the fire will grow beyond that standard relative to firefighting arrival times. We first simulate fire growth on the non-treated landscape to implement the STARFire PA. Fuel treatments would lower the rates of spread and intensity in the treated cells. Next, we simulate fire growth using the conditional probability of spread in each cell and conduct the PA on the treated surface. This enabled the STARFire analysis to reflect the dependence of the preparedness program on the fuels program. Performance of the preparedness program was estimated by comparing the LVA pre and post treatment for each park at each treatment level. In this way, the ROI for each level of the preparedness program was estimated under different fuel treatment levels.
Study Area
We analyzed increasing fuels budgets and preparedness budgets at nine NPS parks within the Alaska Fire Management Zone (Figure 1) to demonstrate the effects of preparedness and fuels programs on ROI. Those parks are Noatak National Park (NOAT), Gates of the Arctic National Park (GAAR), Cape Krusenstern National Monument (CAKR), Bering Land Bridge National Preserve (BELA), Denali National Park and Preserve (DENA), Yukon-Charley Rivers National Preserve (YUCH), Wrangell—St Elias National Park (WRST), Lake Clark National Park and Preserve (LACL), and Kobuk Valley National Park (KOVA). Records from the Monitoring Trends in Burn Severity (MTBS; Eidenshink et al., 2007) from 1984 to 2019 show there were ninety-nine fires larger than 405 ha intersected with at least one of the nine national parks, with the largest fire burned more than 115,822 ha. To assess the impact of a fuels management program, we tested six fuels budget levels (Table 1) and seven preparedness budget levels (Table 2).
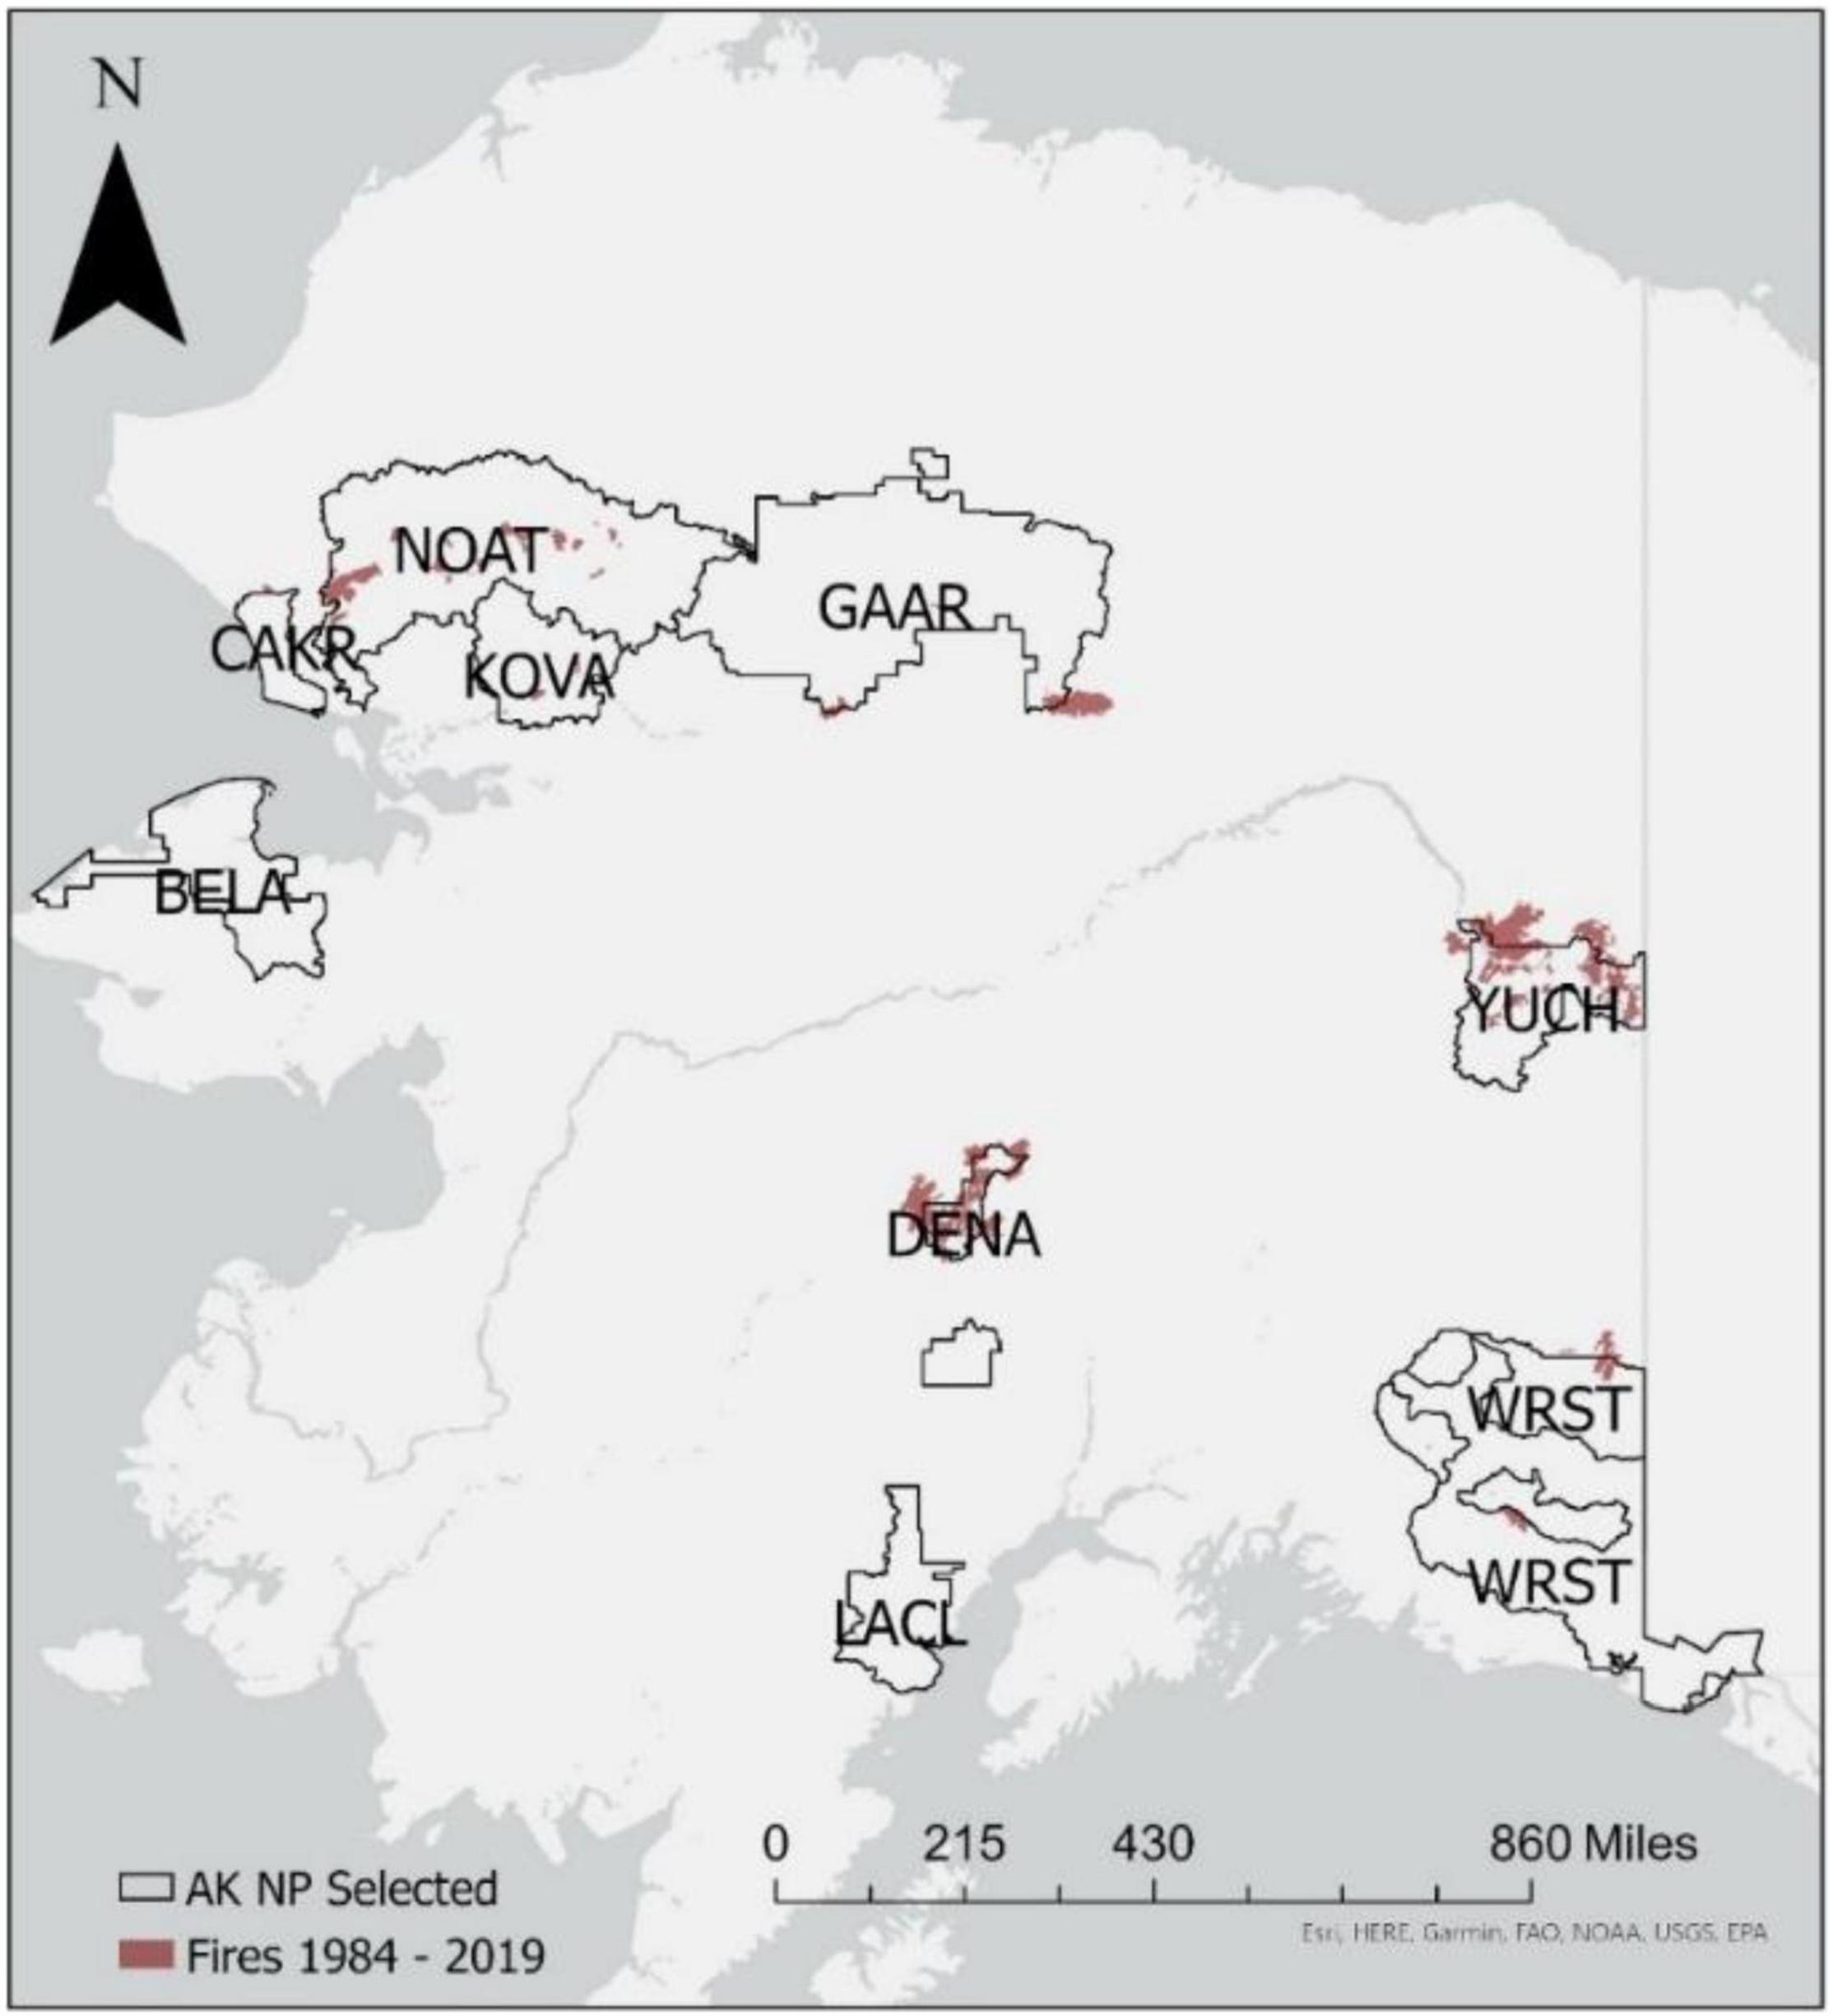
Figure 1. Locations of the nine Alaska national parks analyzed in this study and the large fires (>405 ha) occurred from 1984 to 2019 in or near those parks.
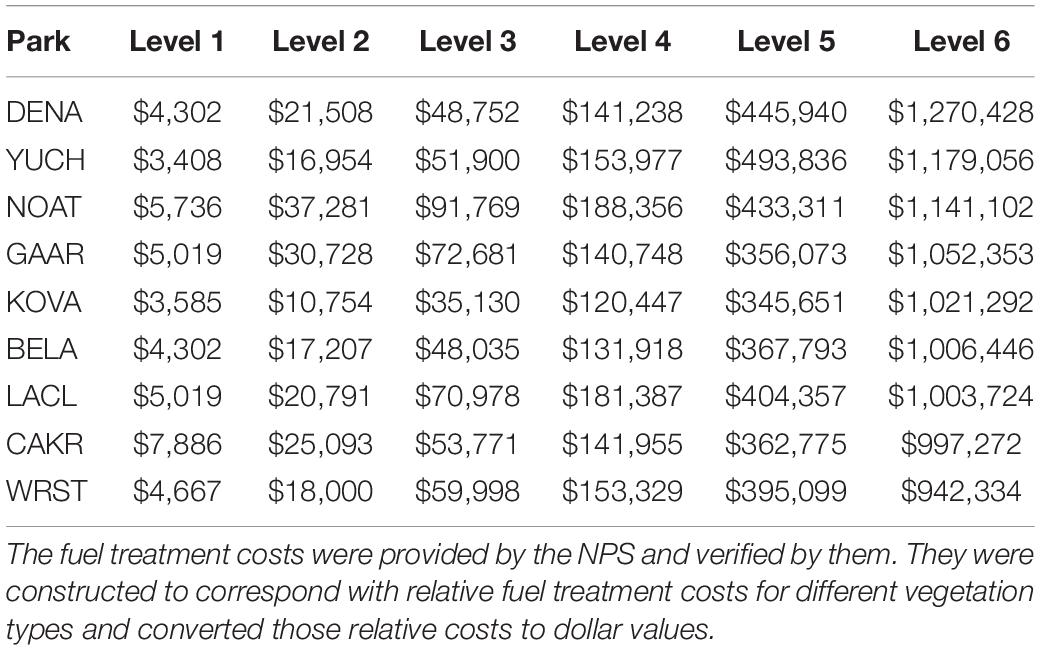
Table 1. Fuel Management budget by level for each park.
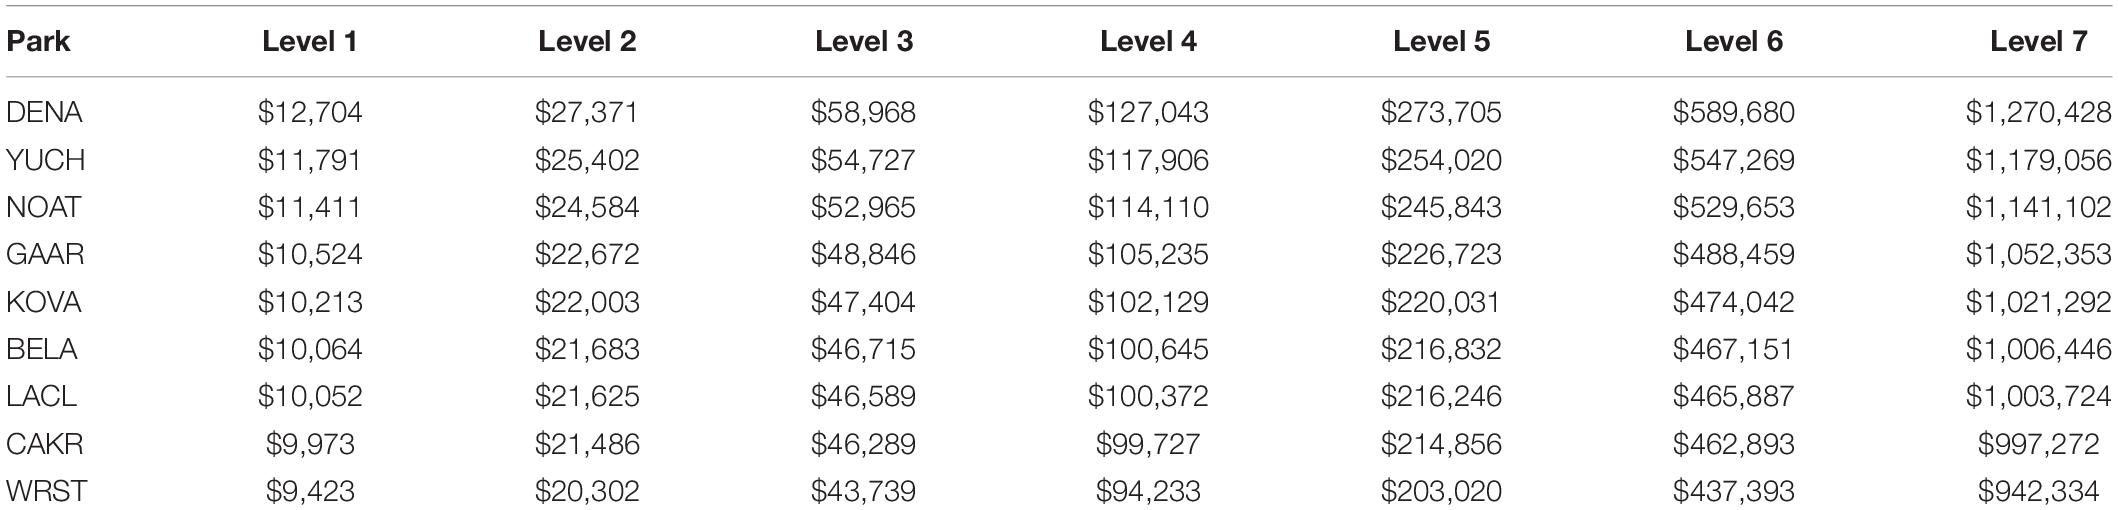
Table 2. Preparedness budget by level for each park.
Budget Analysis Steps
We organized the budget analysis process into three stages: (1) Independent park (or other budgeting unit) program analysis, (2) Zone (including multiple parks) analysis, and (3) Relative park-to-park program comparison (Figure 2).
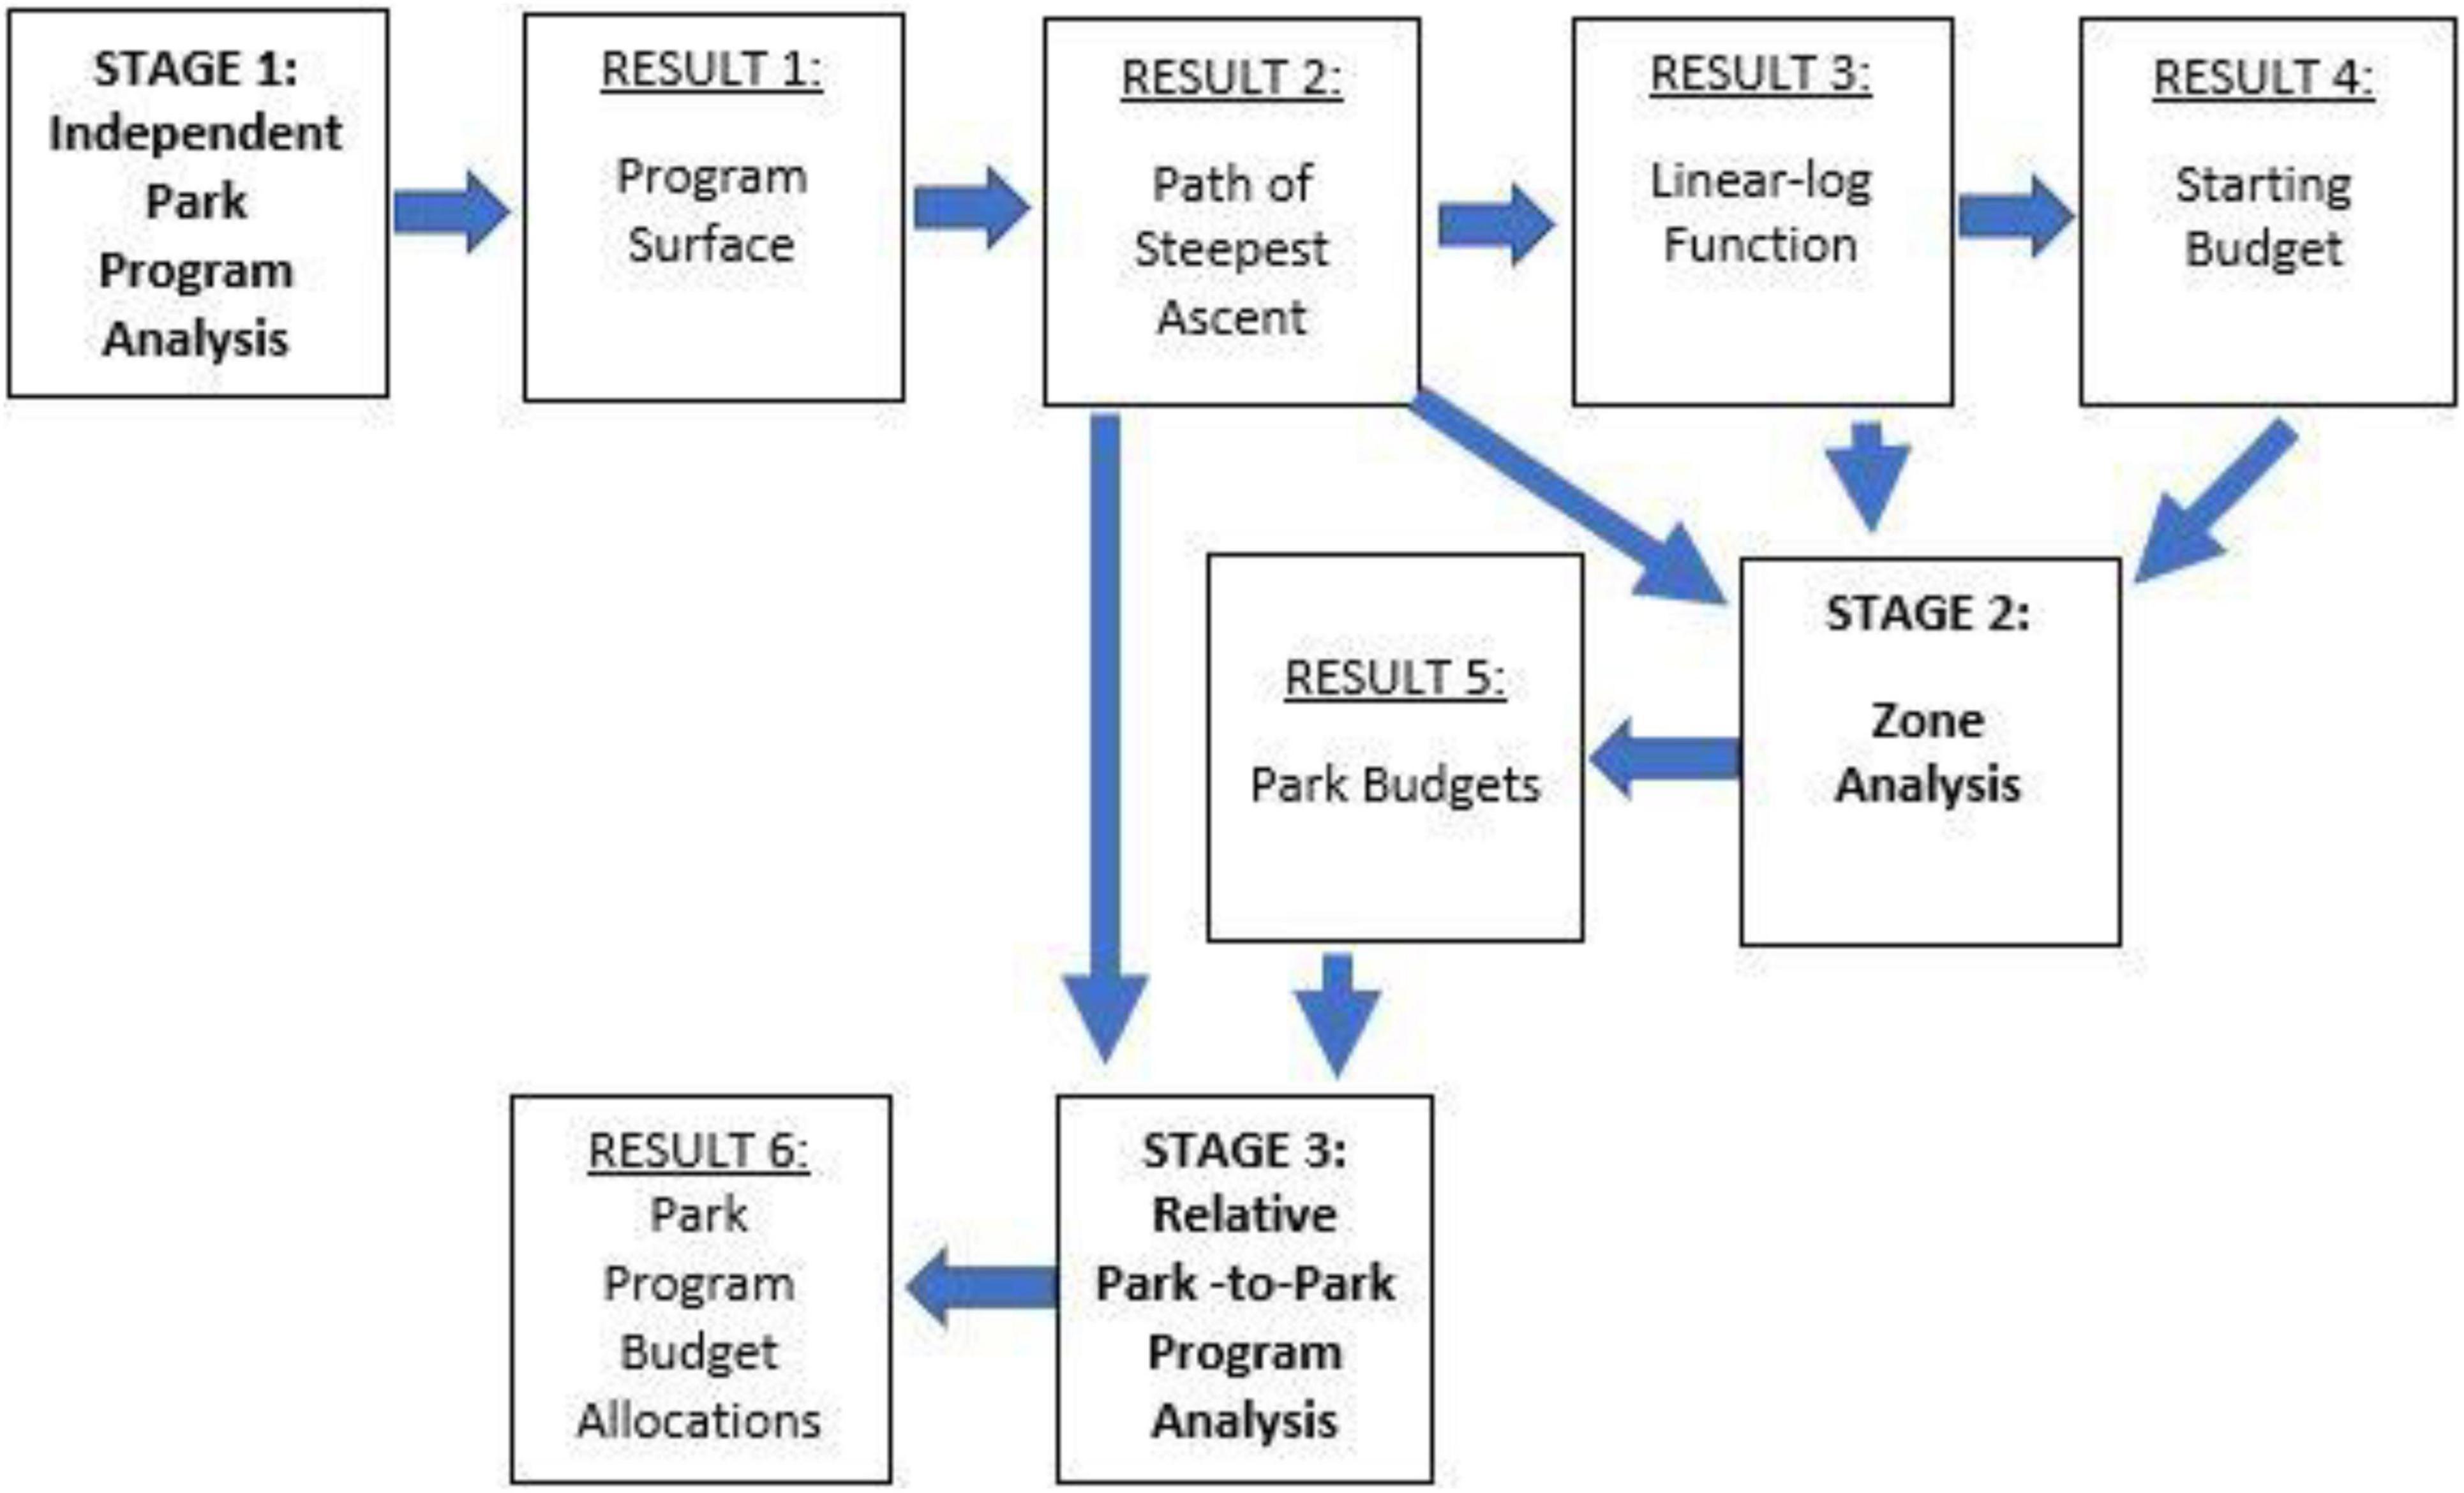
Figure 2. Three stage process to produce results that can be used to allocate wildland fire program budgets.
In stage 1, we begin by generating a three-dimensional ROI surface for each park to show how all possible combinations of preparedness and fuels budgets contribute to ROI (result 1) following the resource benefit and loss measurement provided by the parks. This surface is then used to estimate a gradient (path of steepest ascent) that is used to allocate the preparedness and fuels budgets (result 2). Any point on the gradient path corresponds with a unique combination of fuels budget, preparedness budget and ROI. The points identified on the gradient are modeled as a continuous linear-log function (result 3). The modeled function is then used to estimate a starting budget for each park (result 4). In stage 2, the linear-log function and starting budgets are applied to produce the zone analysis. The zone analysis allocates zone budget increments to individual parks proportionately according to park performance in generating value added to calculate individual park budgets (result 5). Stage 3 takes the allocated park budgets and allocates them to the park’s preparedness and fuels programs. The details and essential mathematics are described next.
Stage 1: Independent Park Program Analysis
Each park’s program surface is generated by interpolating the data points generated by STARFire using the bilinear interpolation function in the statistical computing software, R (v 1.1.463). One point is a convex linear combination of the ROI of the four closest points surrounding it in a rectangle with weights according to the distance from the interpolated point to the corner points. Because it is convex, the interpolation is bounded between the minimum and maximum budget values provided for each park. Bilinear interpolation was chosen because it is one of the simplest methods that produce a continuous surface (Getreuer, 2011). The resulting program surface contains all possible program budget combinations and their corresponding ROI.
Using the points on the surface, the gradient method in R was applied to estimate the budget combinations that rewarded each program based on proportionate performance. Starting at the point (0,0) (zero dollars preparedness and zero dollars fuels), preparedness budget, fuels budget, and ROI values were recorded and used to calculate the slope at that point. The next point is identified by moving in the direction of the linear combination of slopes in the preparedness budget and fuels budget direction until a new cell on the surface is reached. This process is repeated until the maximum fuels and preparedness budgets are exceeded.
To estimate how changing park budgets affect ROI a linear-log function was derived using the points on the gradient. The linear-log function was selected due to its simplicity, fitting accuracy and ability to reflect diminishing returns (Studenmund, 2001) to each program. The total budget (fuels and preparedness combined) and the ROI values from the gradient were supplied to the equation programmatically in R. The linear-log function has the form:
where i denotes the index for each park, V denotes the ROI, α is the regression coefficient to be estimated for the total park budget, ln denotes the natural log of the associated variable, B denotes the total park budget, and c is the constant estimated by the regression. The coefficient reflects the percent change in ROI as total park budget changes.
The derivative (slope) of Equation (1) was used to estimate each park’s marginal performance in terms of ROI at any total budget, as shown in Equation (2).
To avoid taking the natural log of zero, Equation (1) was transformed to estimate the starting budget Bi0 for each park where ROI was zero as shown in Equation (3).
Stage 2: Zone Analysis
The zone analysis estimated the total budgets allocated to each park as the zone budget changed. Park budgets were allocated proportionately relative to each park’s performance within the zone using the gradient method. The starting zone budget was the sum of all park’s starting budgets. This was calculated using Equation (3). From that starting point, budget increments were added to the total zone budget using the following process:
where b is budget level, is the change in total budget for park i at the new budget level (b+1), is the performance of park i at the current budget level, is the performance of all parks in the zone at the current budget level, and is the change in total zone budget for the new budget level increment. We then estimated the new total park Bib+1 and zone budgets BZb+1 using Equations (5, 6) respectively.
We were also able to calculate ROI for each park and the zone using Equations (7, 8) respectively.
This process continued with a fixed budget increment being allocated to each park until a park exceeded its maximum budget. Once a park’s maximum budget was exceeded, that park’s budget would remain constant as the zone budget increased and its ratio () would no longer be part of the denominator in Equation (4). The next increment would be allocated to the remaining parks. We continued this process until all parks exceeded their maximum budget where a maximum zone budget was estimated.
Stage 3: Relative Park-to-Park Program Analysis
The park’s gradient (path of steepest ascent) was used to allocate the park budgets (stage 2) to preparedness and fuels programs. Park budgets were allocated to each program proportionately to that program’s performance in ROI relative to the performance of both programs:
Preparedness and fuels budgets were calculated based on Equations (9, 10), respectively. The values used to calculate each part of the ratios were preparedness budget, fuels budget, and ROI values taken from the gradient based on the total park budget on the gradient path closest to the total park budget allocated through the zone analysis. When a park exceeded its maximum budget, the preparedness and fuels budgets remained constant despite an increase in zone budget.
Results
Stage 1: Independent Park Program Analysis
To support park level analysis, we first produced the fuel treatment priority maps for all nine parks based on the ROI of conducting fuel treatment in every raster cell across each park calculated through STARFire (Figure 3). Resource values used to calculate ROI was obtained from park officials (Appendix Table A1). Using the rank ordering method introduced before, fuel treatment prioritizations at each of the six fuel treatment budget levels in each park can be directly derived from the priority map. The park-level analysis revealed different fuel treatment prioritization patterns across the nine parks. For example, high treatment priority areas concentrate within a small portion of the GAAR, YUCH, WRST, DENA, and LACL, but more evenly distributed across the other four parks, e.g., in BELA, CAKR, KOVA, and NOAT.
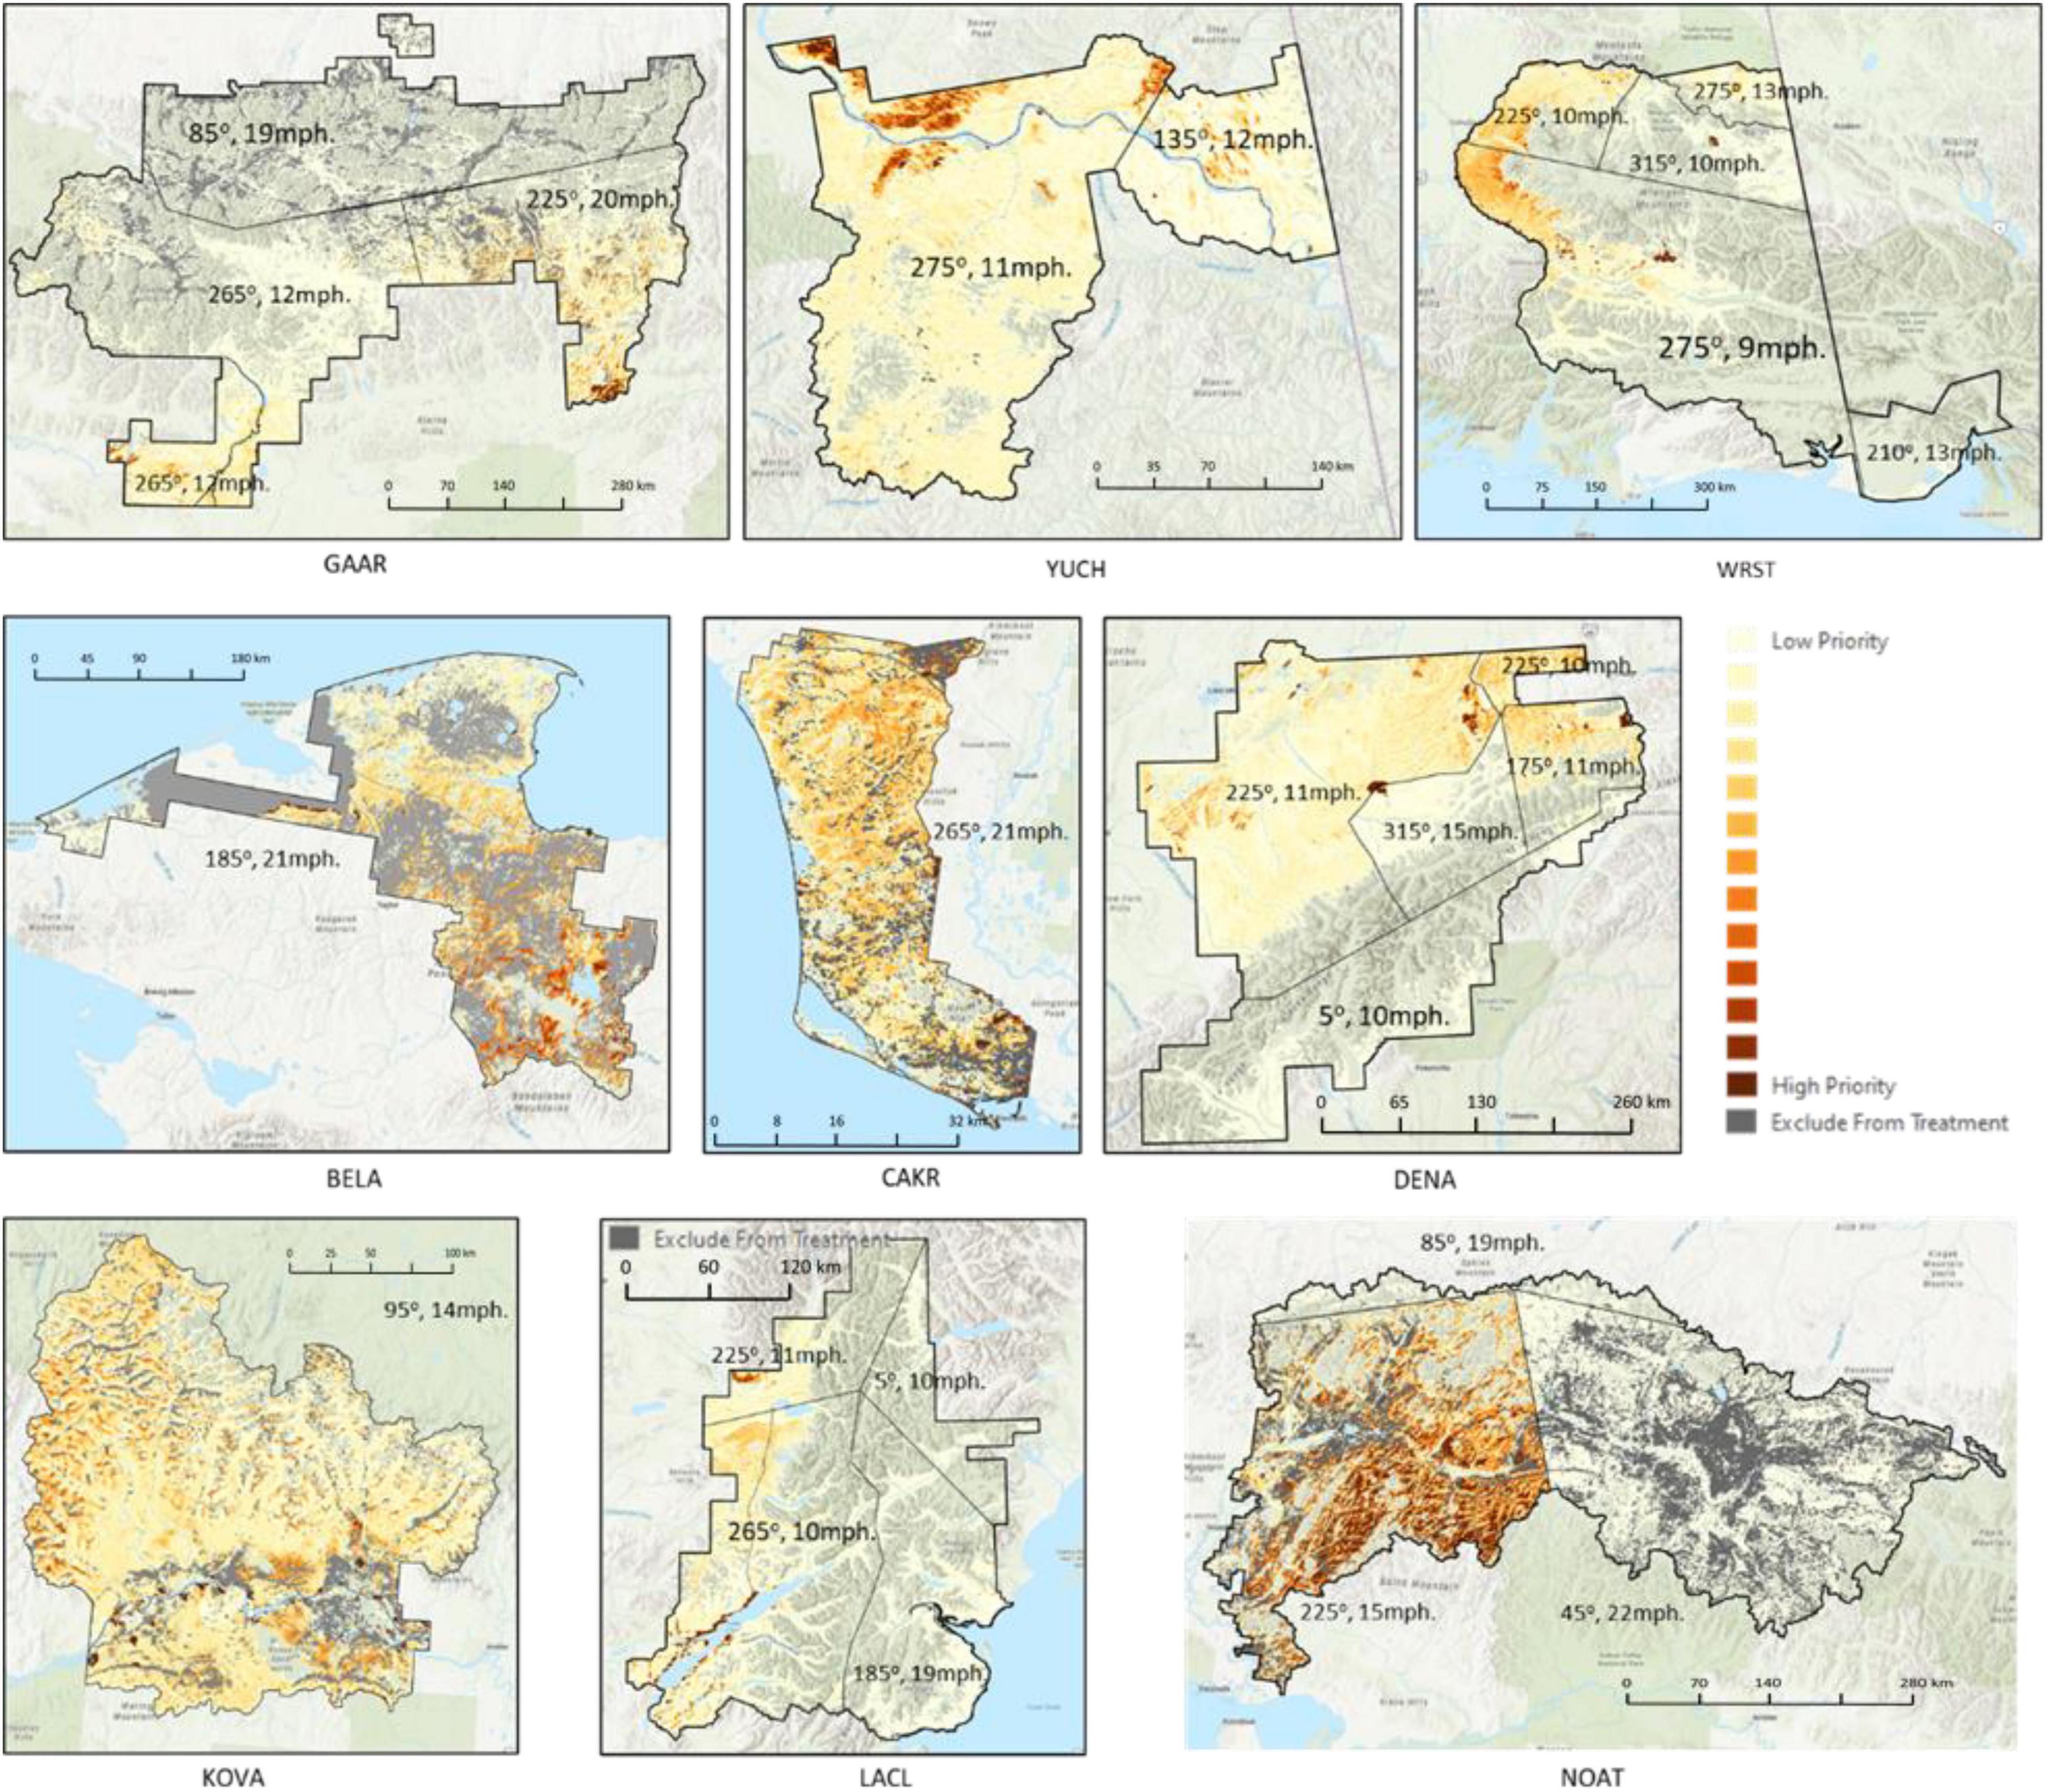
Figure 3. Fuel treatment prioritization for the nine national parks under different simulated fire weather conditions. The wind direction and speed (e.g., 225 degree and 20 miles per hour) used for each management zone were identified by park fire managers.
The program surfaces (Figure 4) were generated by interpolating the STARFire analysis results for each park. We extended the methods developed by Wei et al. (2016) to generate a gradient that rewards proportionate performance and to support the budgeting of the national parks. The gradient was applied to linear-log functions to allocate a zone budget to individual parks, which were then allocated to different park programs following the path with the highest ROI increases per dollar invested. Each path starts at preparedness and fuels budgets of zero dollars. Fuels budgets increase until the maximum total park budget (sum of preparedness and fuels budgets) is exceeded. The ROI is represented by the contour lines with the same color scheme as the program surface (Figure 5). These paths were used to generate the zone analysis (stage 2) and relative park-to-park program analysis (stage 3) results.
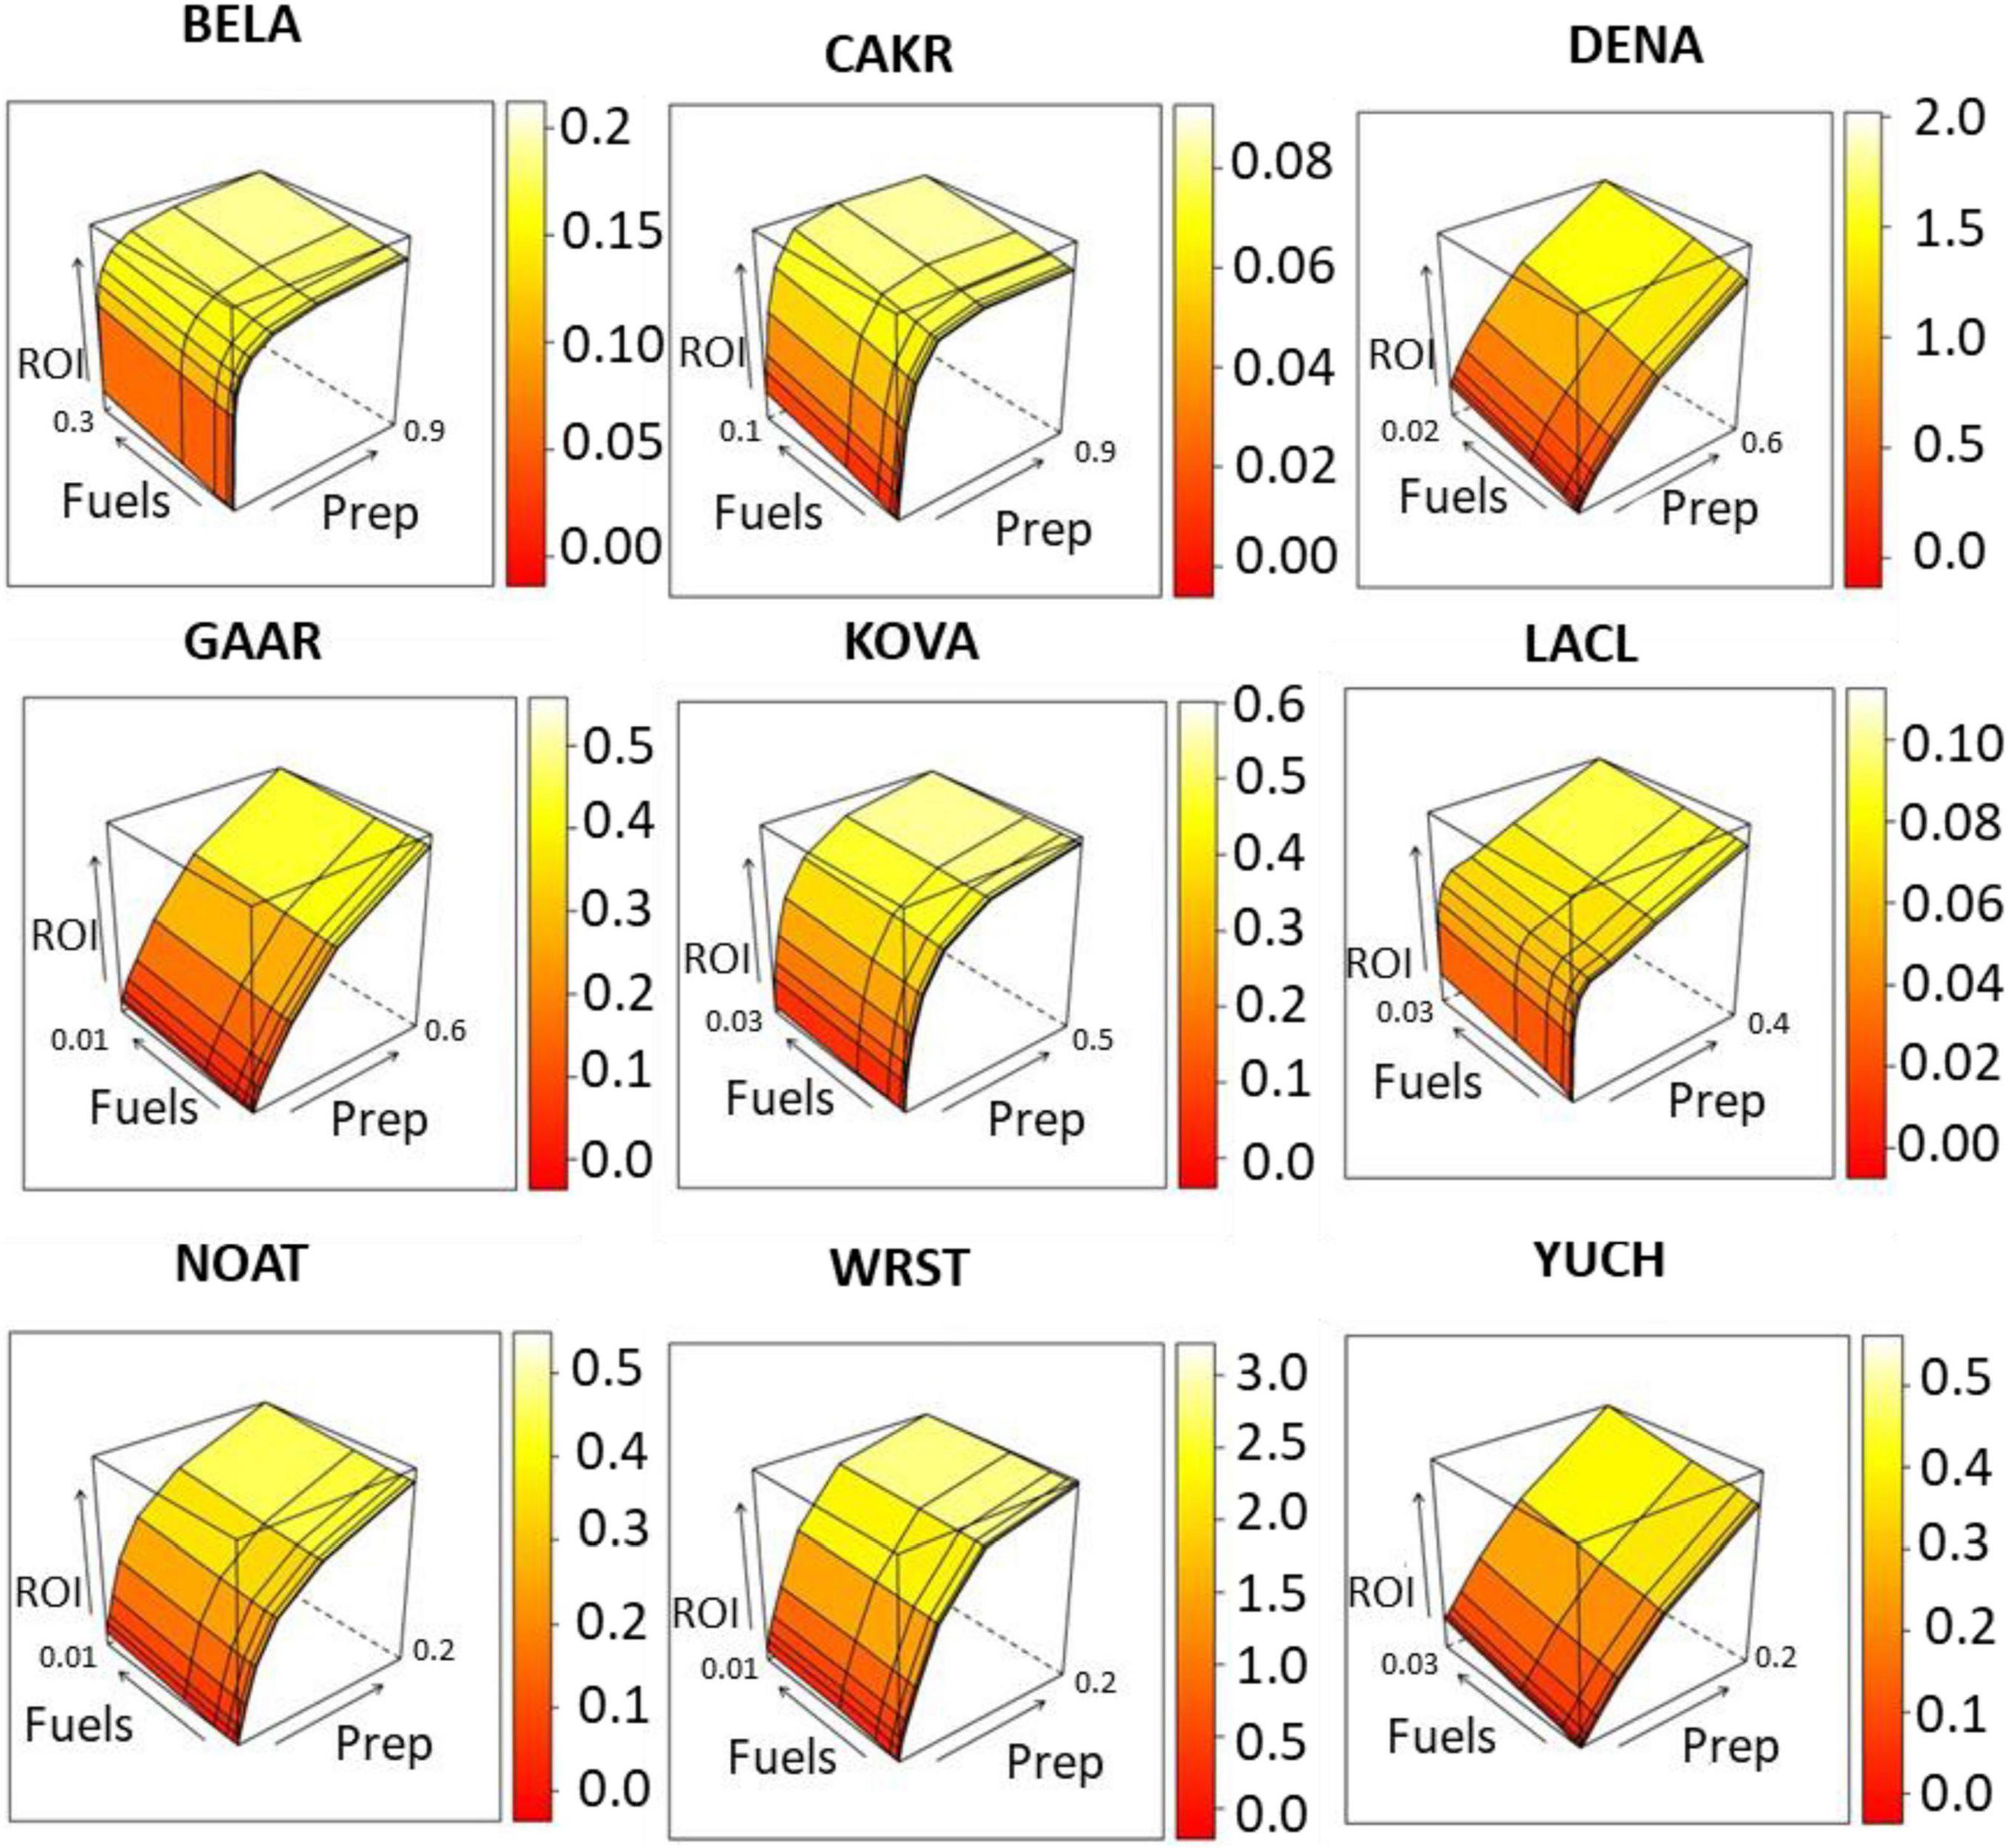
Figure 4. Program surfaces for the Alaska Fire Management Zone. Preparedness budgets are represented by the x-axis and fuels budgets are represented by the y-axis. Both budgets are measured by million USD ($); ROI is depicted by the z-axis, with ROI increasing as the surface changes from red to yellow. The program surface shows all possible preparedness and fuels budget combinations and their respective ROI. The STARFire-generated results are represented by the points where the preparedness and fuels budget lines cross and the areas in between are interpolated.
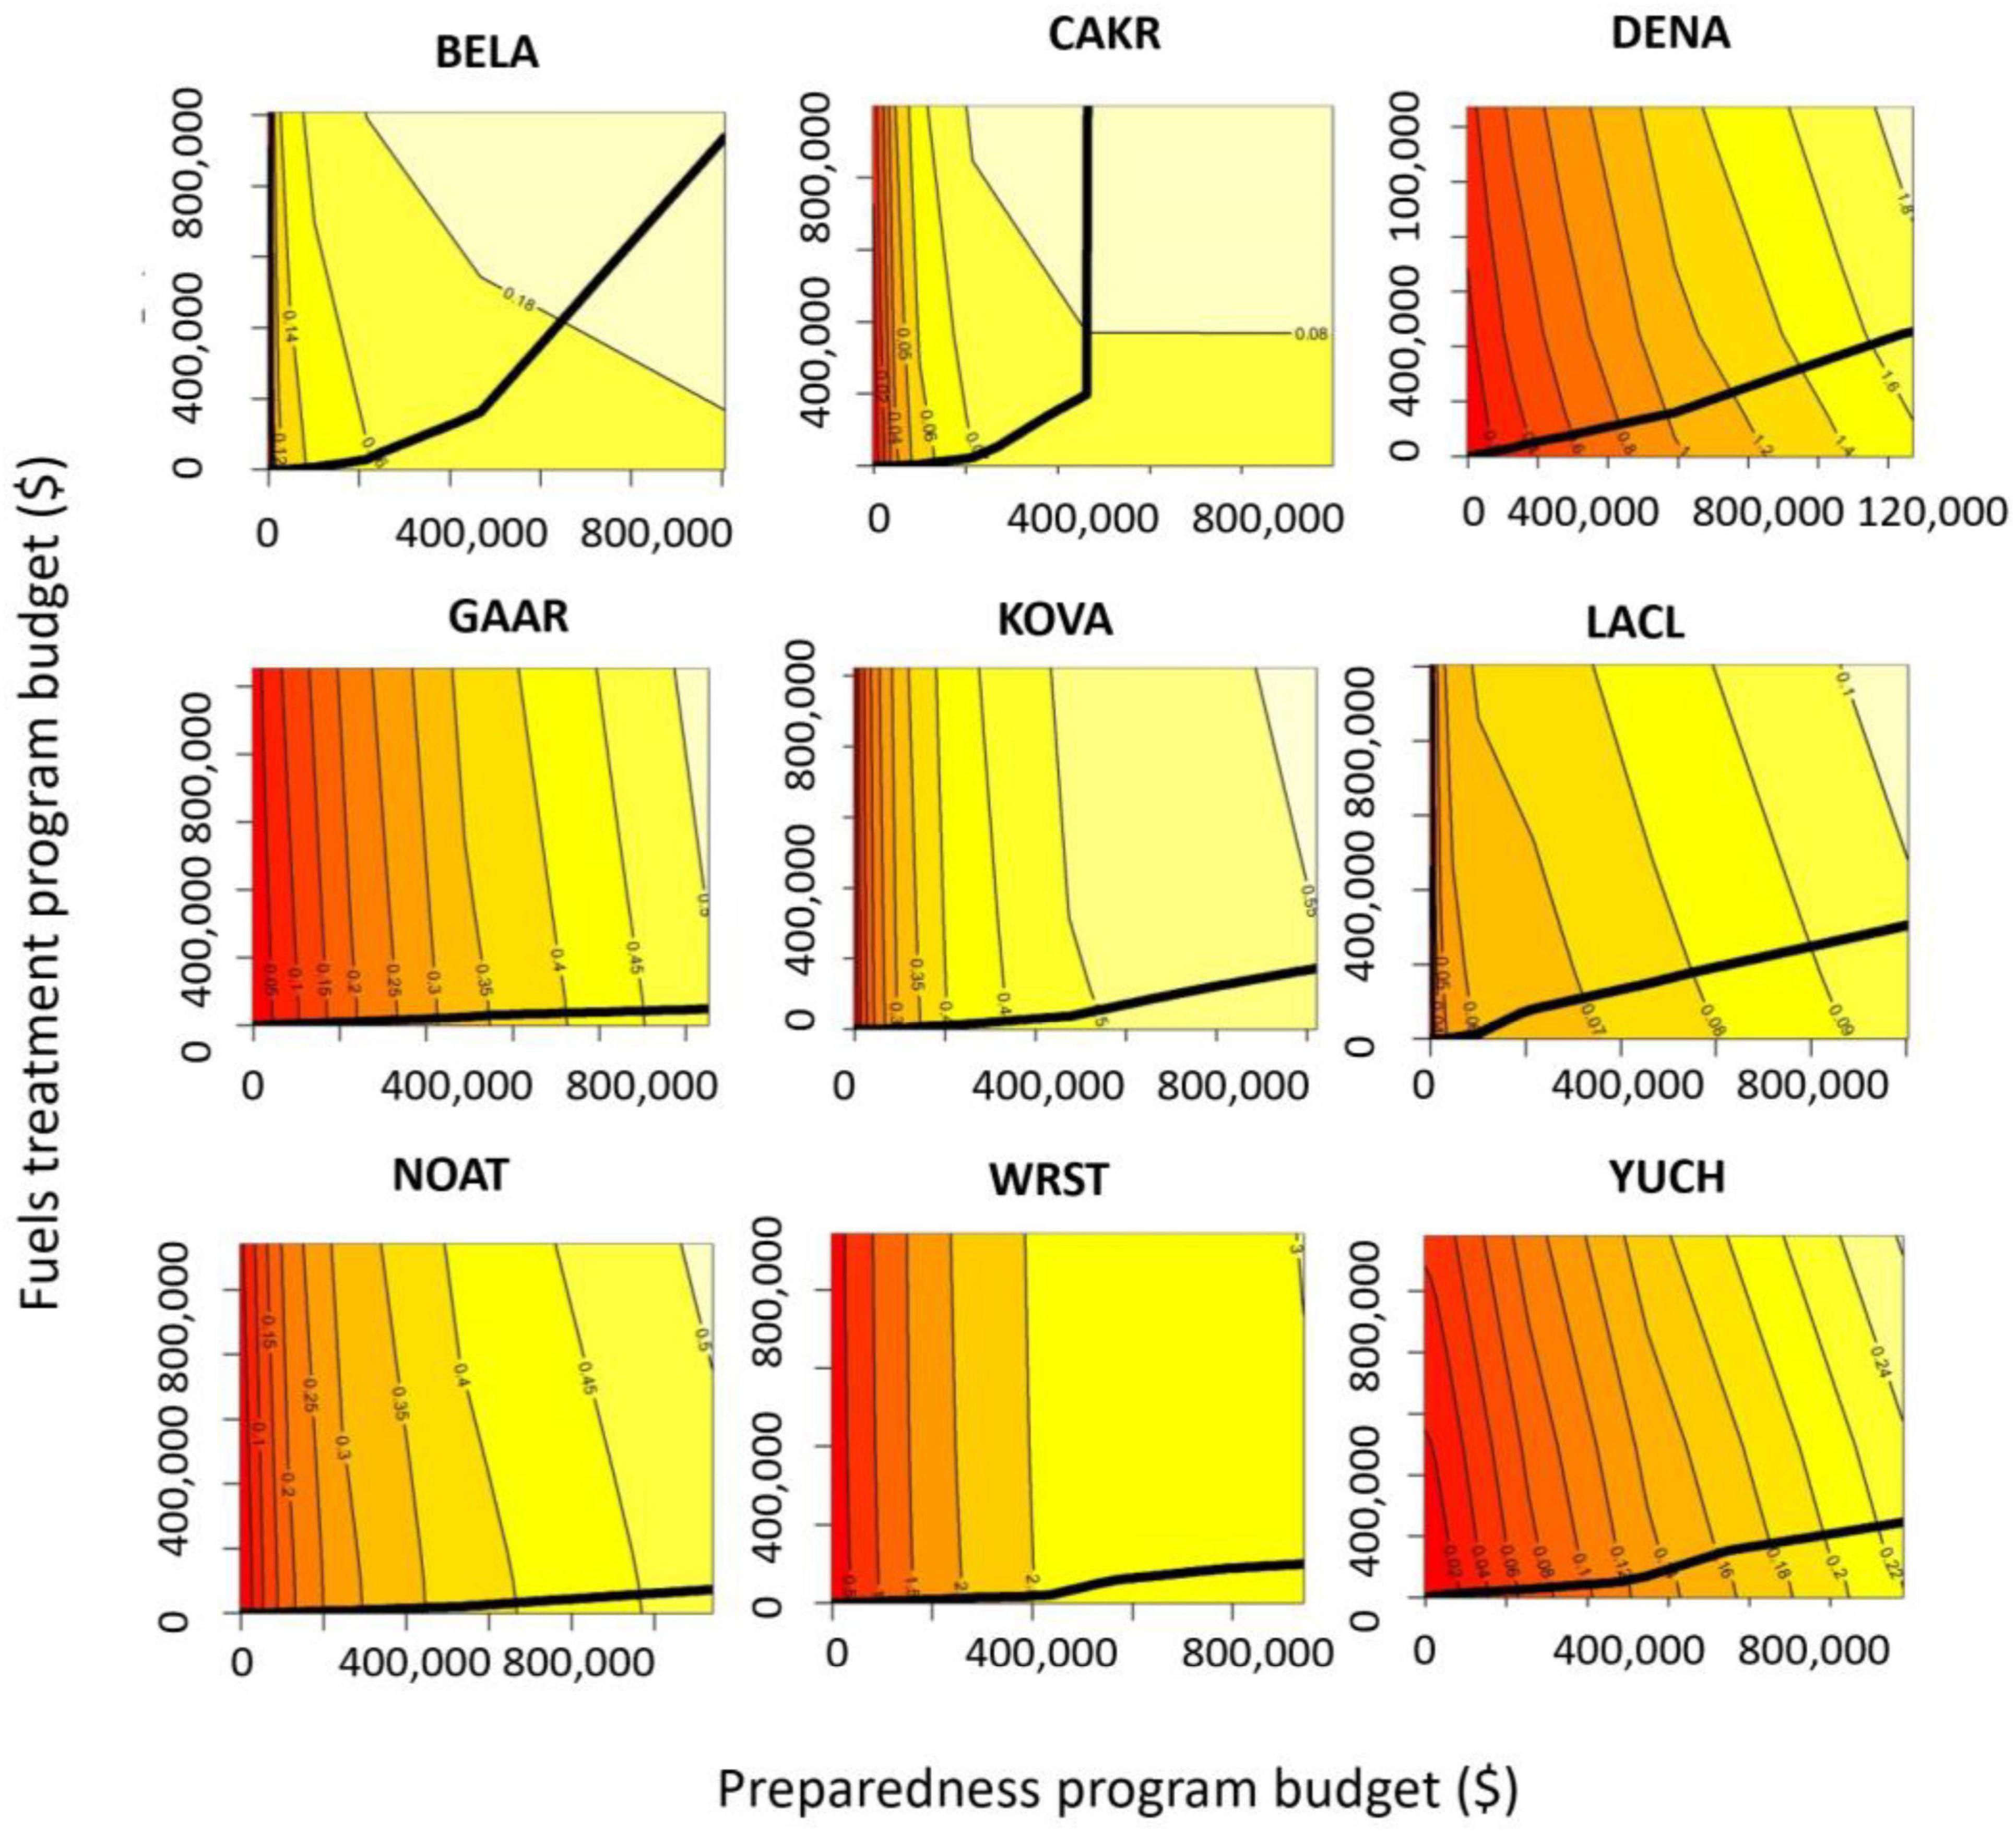
Figure 5. Gradients for the nine national parks in the Alaska Fire Management Zone. ROI increases as the surface changes from red to yellow.
From the graphs in both Figures 4, 5, we find that different fuel treatment and preparedness budget allocation strategies exist between parks to maximize the overall ROI. In almost all parks, the ROI functions are non-linear. More specifically, for BELA, the most efficient budget allocation strategy would be allocating most of the investment to preparedness program up to about $440,000 before we should start to evenly distribute the additional fundings to both programs; for CAKR, we should distribute most funding to the preparedness program when funding is limited, but switching emphasis to the fuel treatment program after the total investment into both programs is beyond $900,000; for the other seven parks, we should continue to invest into both programs at fixed ratios, although those ratios can vary between parks.
When the current budget is used as a starting point, the gradient method used in this research enables program budgets to be allocated based on proportionate performance. However, the gradient method (aka path of steepest ascent) is sensitive to the current budget. This means that for whatever budget is being allocated that it will be allocated from the current budget proportionately according to incremental performance. This incremental approach may not represent the most efficient budget allocation to maximize the ROI for the zone, but it made budget allocations predictable, stable, and potentially incentivizes performance. The gradient method, as developed here are equitable and pragmatic. The continuous linear-log function for each park are given in Table 3 with the R-squared value between 0.85 to 0.97, which indicates they can effectively capture the ROI from those studied parks.
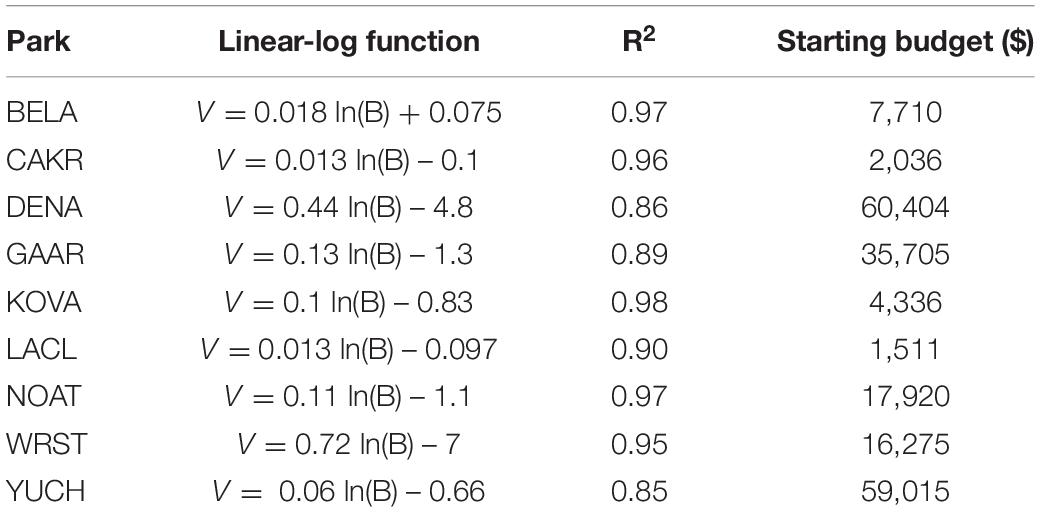
Table 3. Park linear-log functions, R2 values, and starting budgets.
Stage 2: Zone Analysis
The zone analysis allocates the zone budget increments to each of the programs and to the individual parks based on proportional park performance. Both x-axes in Figures 6A,B represent the total zone budget. The starting Alaska zone budget is the sum of each park’s starting budgets as estimated in Stage 1. In Figure 6A the proportion of the total zone budget allocated to the fuels program varies between a low of 7.7% and a high of 12.5% across budget increments, while the proportion of the total zone budget allocated to the preparedness program budget varies between a low of 87.5% and a high of 92.3% across budget increments. This result suggested most of the future fire program budget would be invested into their preparedness program, with only a smaller portion into fuel treatment program. One reason for this budget allocation is the AK region parks and the fires that occur in them are remote. Visitation to AK parks is often among the least of all the parks (apart from DENA which is the most visited in AK). As such they have few roads, or buildings to protect from fire compared to many national parks in other states of the US, ROI for preparedness is less than fuel treatment. Within the nine parks, DENA and WRST have the highest concentration of structures to protect. That substantiates the lack of fuel treatment needs in other parks but DENA and WRST. In Figure 6B the parks are listed from bottom to top in the order in that they exceed their maximum budget. The first park to exceed its maximum budget is CAKR located at the bottom and the last park to exceed its maximum budget (DENA) is at the top. DENA and WRST should get the most budgetary appropriations.
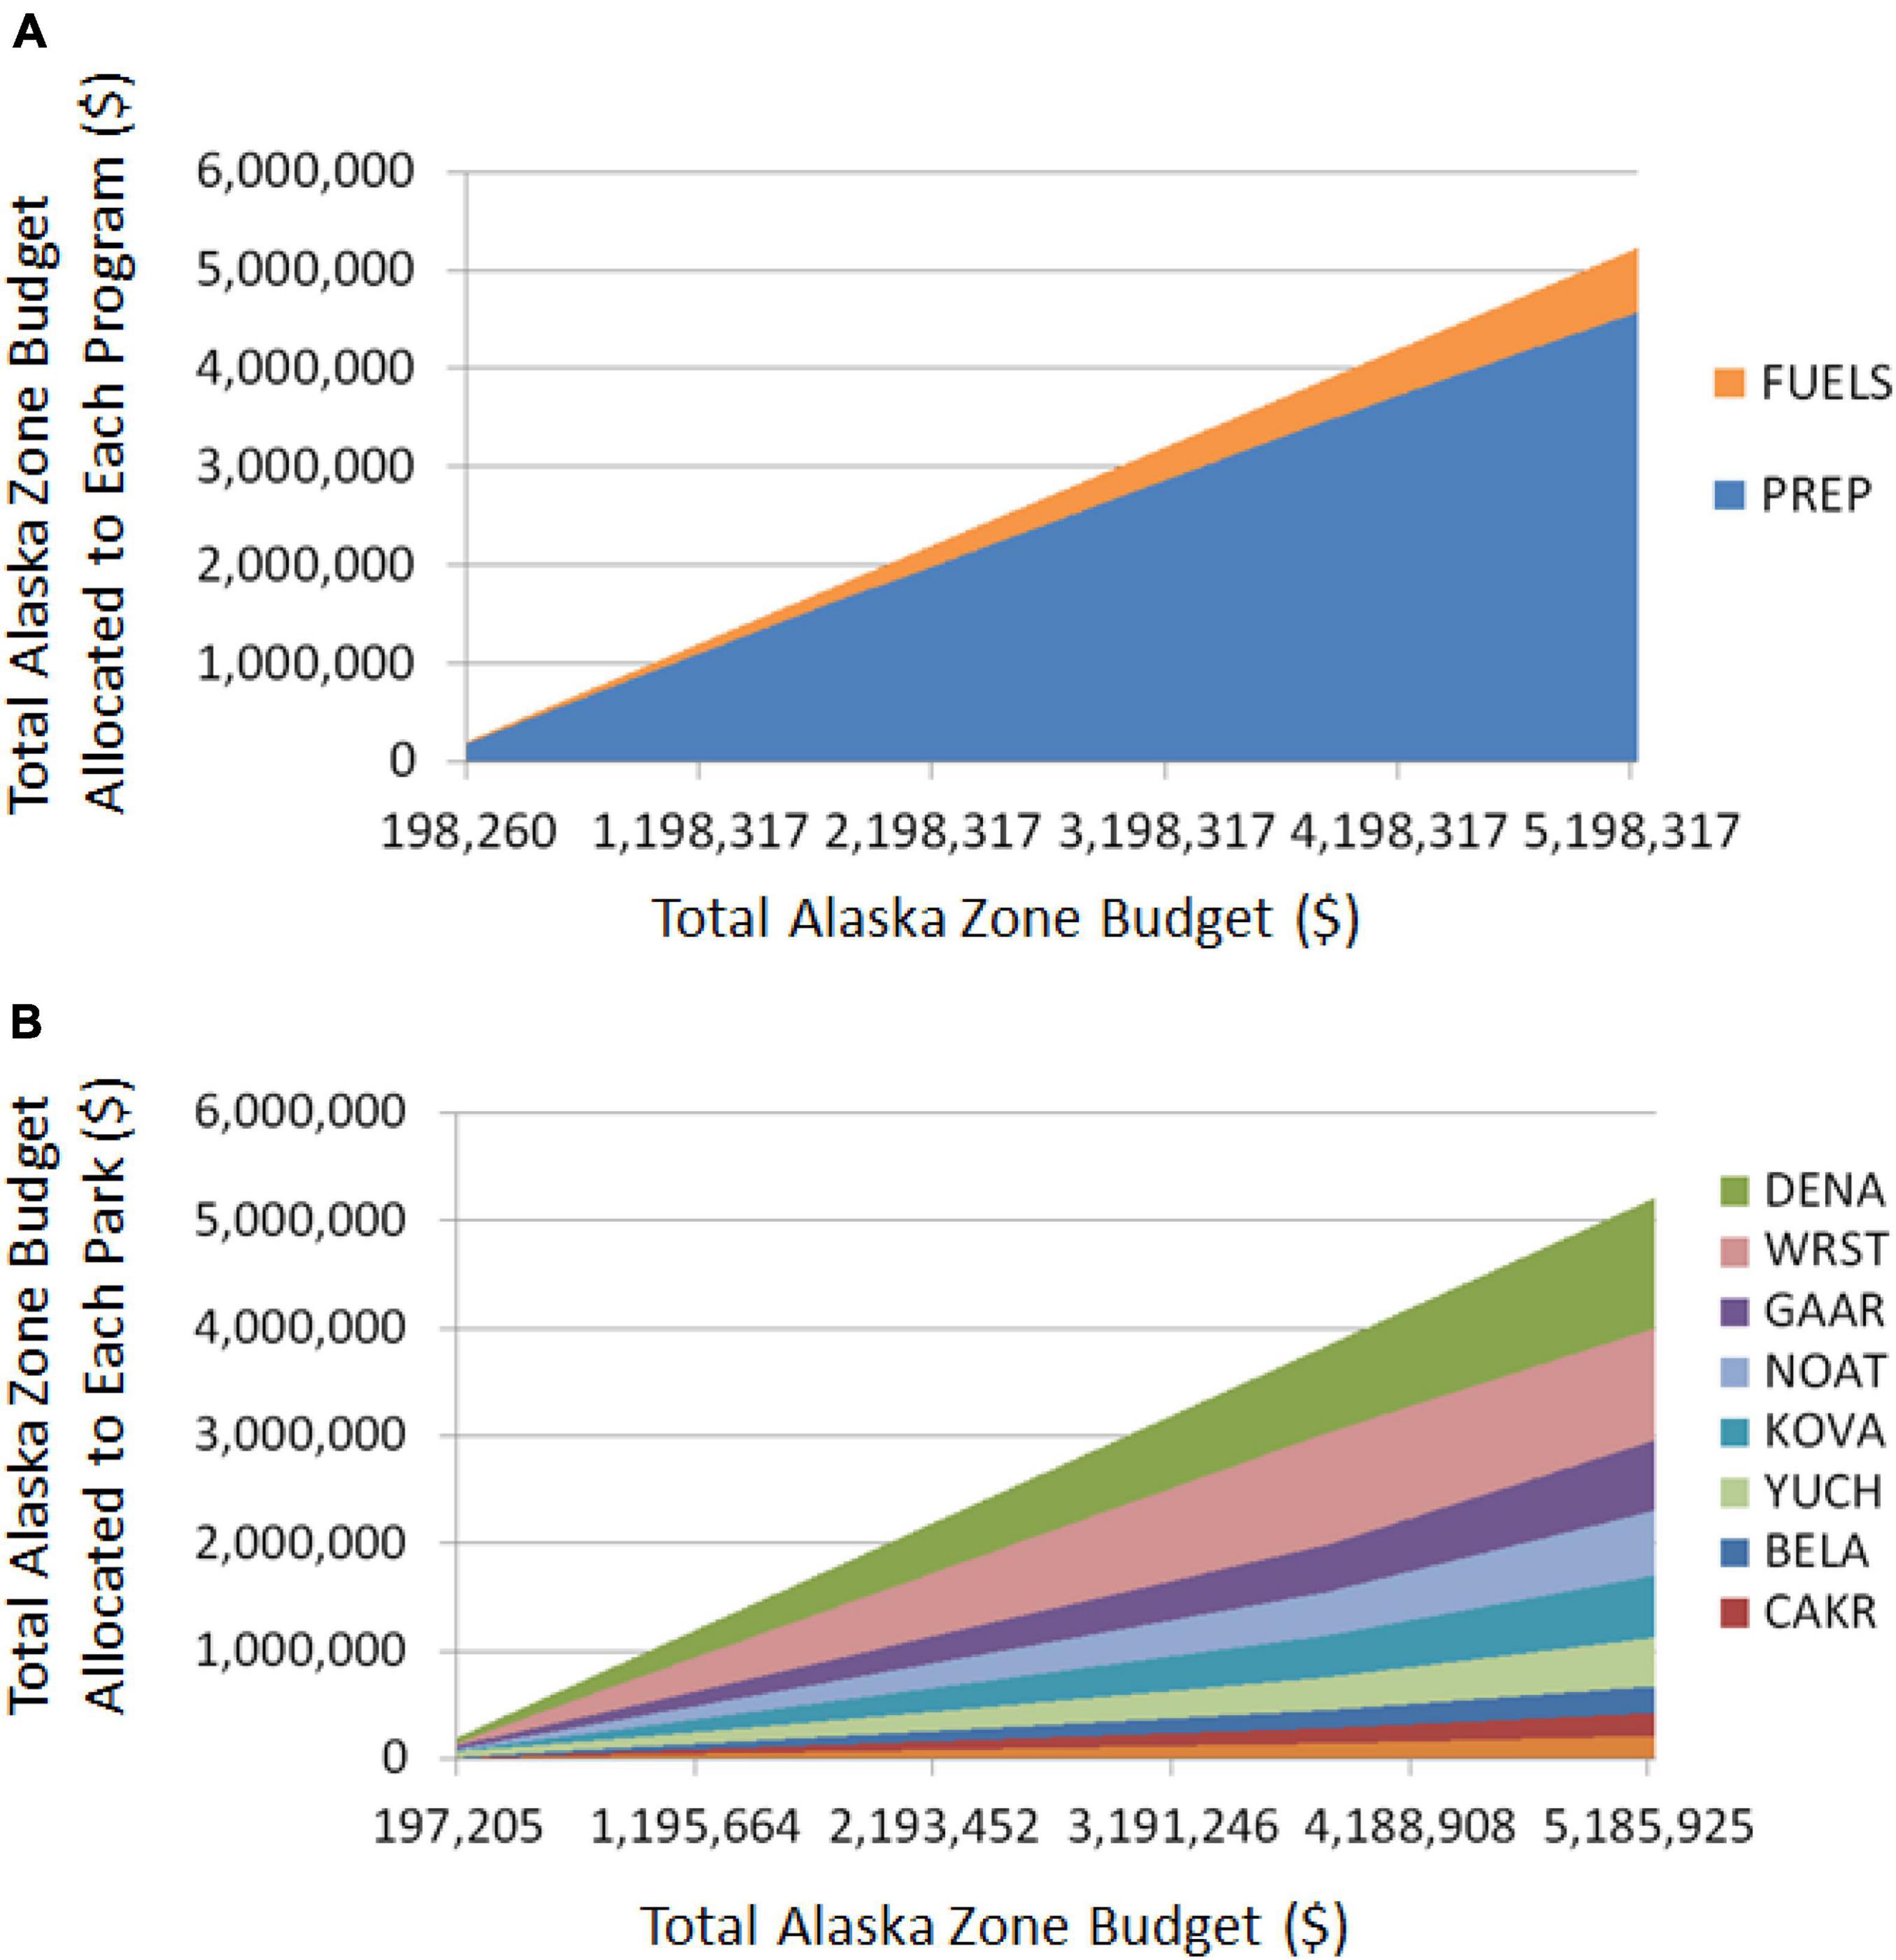
Figure 6. Total Alaska zone budget allocations to each (A) program and to each park (B).
Stage 3: Relative Park-to-Park Program Analysis
We used the park allocations generated in Stage 2 and the gradients generated in Stage 1 to allocate park budgets to the preparedness and fuels programs. This allocation was based on their proportionate program performance (Stage 3). The program budget allocations for each park are shown in Figure 7. Results show most of the budgets for each park would be allocated to preparedness. DENA and WRST will receive the most total budgets, and higher portions of the total budget should be allocated to fuel treatments in both parks. BELA, CAKR, and LACL would receive the least budgets.
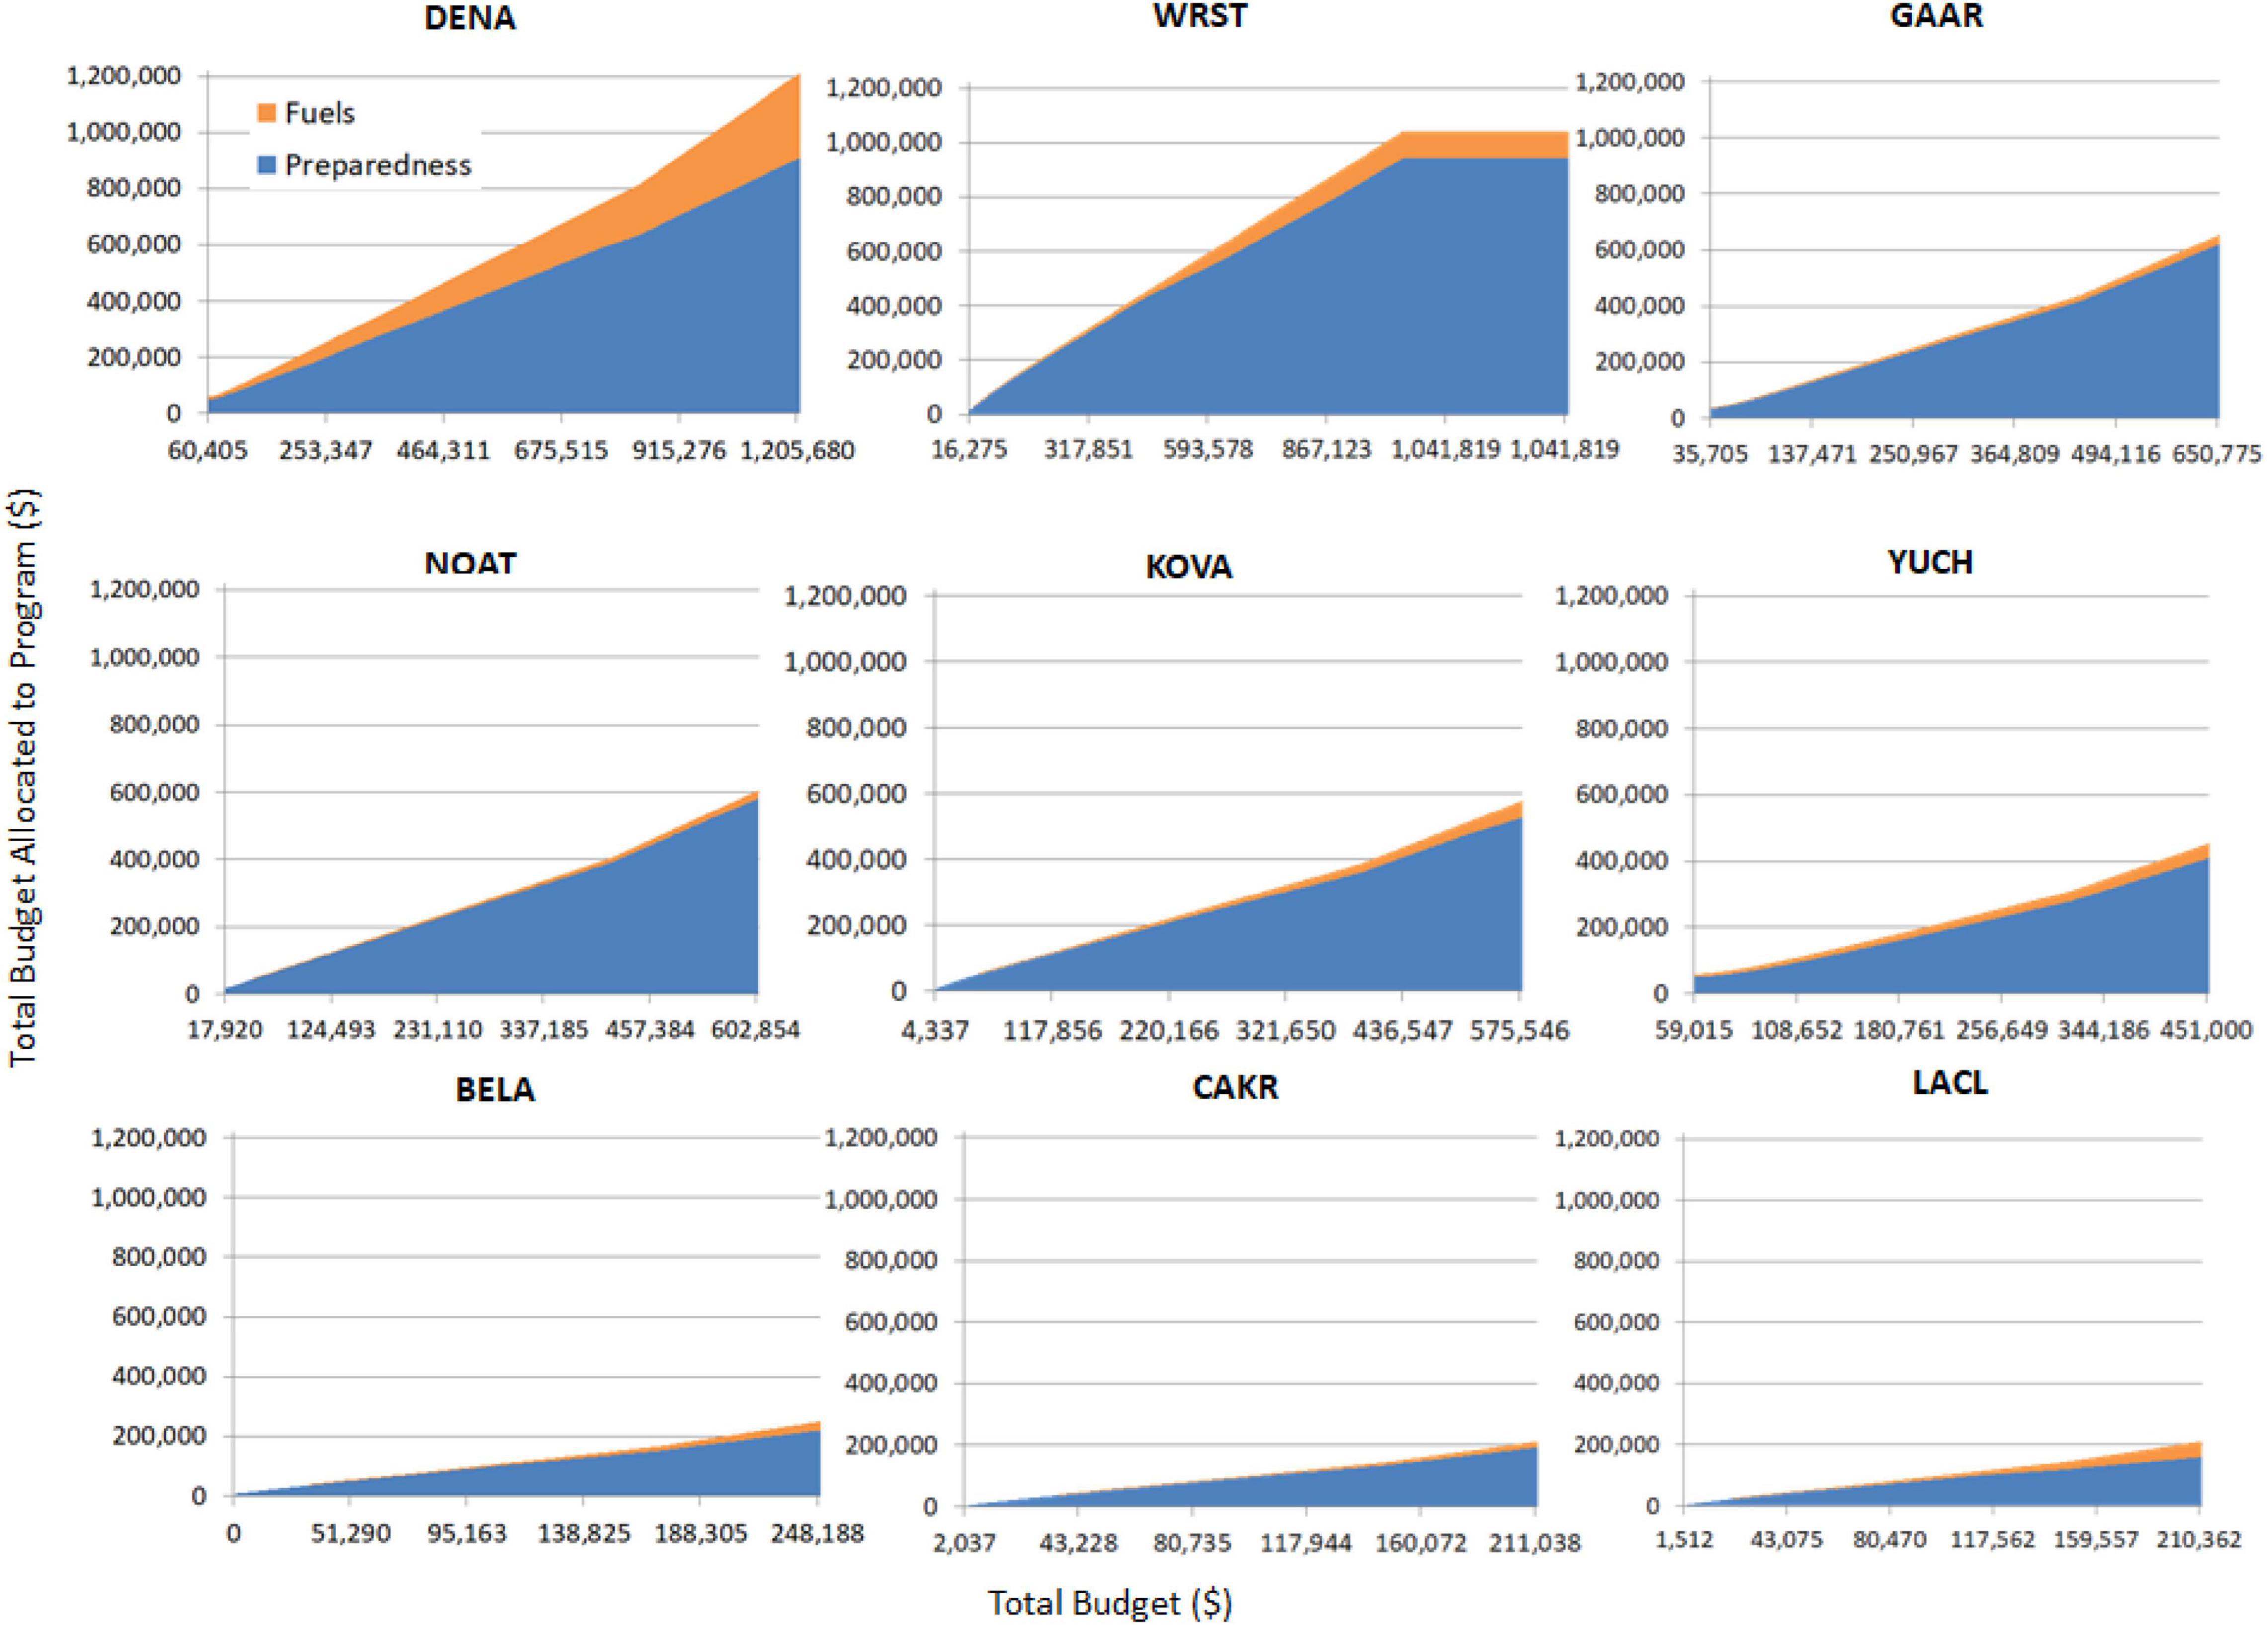
Figure 7. Program allocations for CALO, CARL, FOSU, and GRSM.
A National Park Service Budgeting Perspective
Here we provide a pragmatic example of how an NPS budgeting officer could interpret the Budget Analysis results and apply them to budgeting decisions. For demonstration, assume that the NPS Alaska Zone has been given a total wildland fire management budget of $1,864,181. The NPS budgeting officer(s) would locate the matching budget amount (Figure 6) from the Zonal Analysis (stage 2). They would then calculate the proportion of funding to allocate to each park. This scenario has been re-rendered from Figure 7 into Figure 8 to represent this budget “slice.” Using this information, the budget officer is quickly provided with guidelines on how to allocate the total appropriated budget to each of the nine parks. This example shows WRST and DENA would receive slightly less than half of the total NPS fire budget for the nine parks in AK (Figure 8A). Next, the budget officer can use the Park-to-Park Analysis (stage 3) to calculate each park’s program allocation (fuels and preparedness) as in Figure 8B. The pie-charts show the NPS should invest much heavier in the preparedness programs than the fuels programs in all nine parks. This analysis can be used to support budget allocations and study the impact of budget increases or decreases.
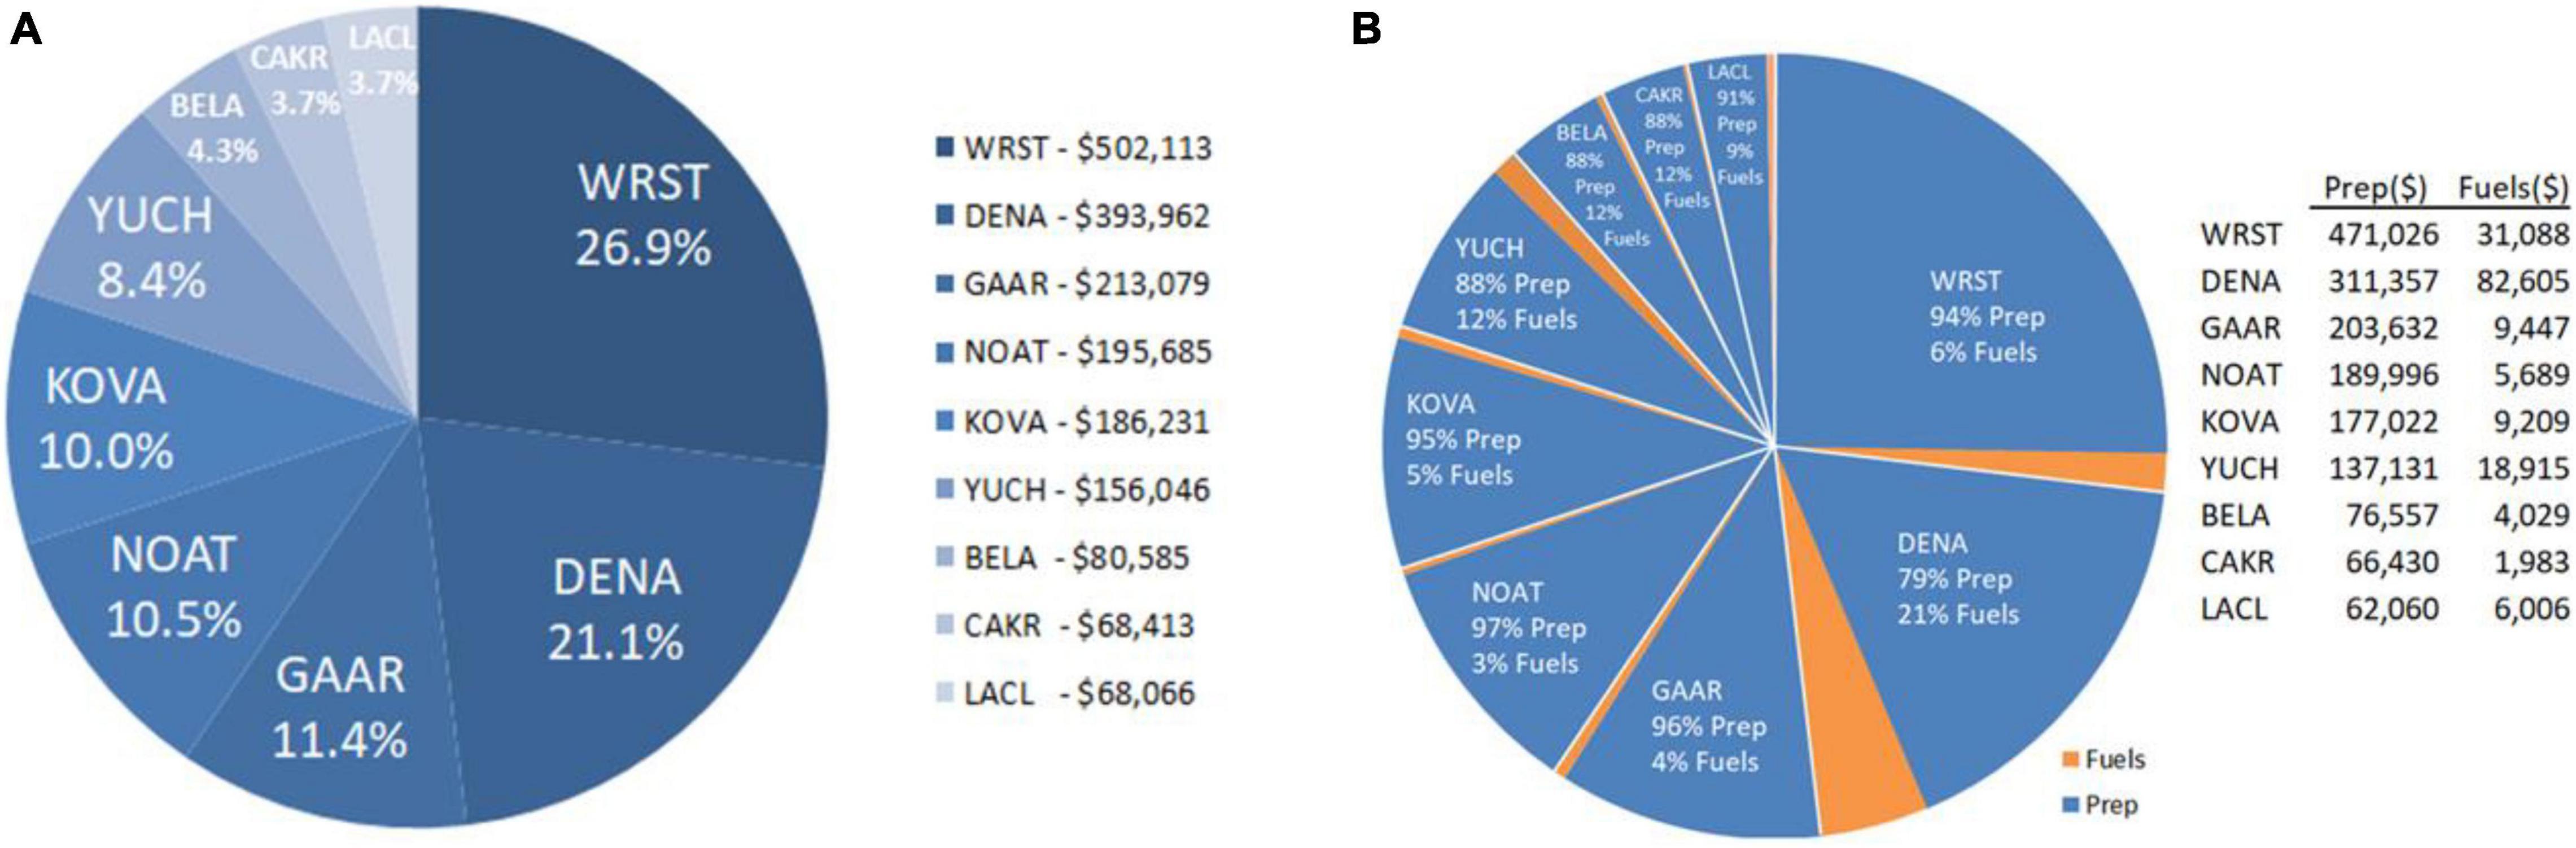
Figure 8. (A) Allocation of a zone budget of $1,864,181 to each of the nine parks based on proportionate performance; (B) individual park total budgets allocated between fuels and preparedness programs.
Discussion and Conclusions
The NPS was interested in developing a budgeting process that could generate efficient use of funds for its programs, promote program stability, be transparent and predicable, and demonstrate how performance is tied to budget allocation. This study focuses on strategic budgeting in the Alaska region to address several significant wildland fire management budgeting issues identified by the US Government Accountability Office (GAO) (2009), the Cohesive Strategy (US Department of the Interior and Us Department of Agriculture (USDOI and USDA), 2014), concerns of current research (e.g., Ager et al., 2021), and the NPS (US Department of Interior Office of Budget (USDOI), 2020). Fire behavior modeling and fire planning analysis were used to create input data for strategic budgeting, but they are not the focus of this study. A variety of fire planning and fire behavior analysis systems could have been used without affecting the contribution the paper makes to budgeting theory and practice.
We believe the gradient method is built on a sound analytical framework and it provided informative and objective analytical support to strategic budgeting across multiple national parks. The research achieved the goals for strategic and multi-scale budgeting by conducting consistent and transparent fire risk assessment and calculating ROI from fuel treatment and preparedness programs. The ROI metric used in this analysis can directly address line-item budgeting concerns in the DOI’s Budget Justification publications. Further, this metric accompanied performance-based budgeting sections (Rideout and Botti, 2002) and provided the ability to assess the accomplishment of program and policy goals (Thompson et al., 2018). The ROI recorded from increasing fuels and preparedness budgets was used to inform the Budget Analysis. The results from the Budget Analysis could be used to support appropriations for large scale-budgets, individual region budgets, planning unit budgets and allocations between fuels and preparedness programs while rewarding performance. Planning unit managers can use the results to inform decisions and justify appropriation requests. The Budget Analysis is flexible and could be applied to other land management agencies.
Many innovations have emerged recently to support landscape fire risk assessment, schedule fuel treatment, evaluate WUI risk, and conduct fire suppression effective analysis. Many of those would likely allow us to improve future program, regional and national fire program budgeting analysis. For example, a recent study from Thompson et al. (2021) suggested pre-season and strategic fire planning following potential operational delineations (PODs), which are spatial management units with boundaries relevant to fire containment operations features such as roads, ridgetops, and fuel transitions. Fire risk attributes such as fire consequences, suppression opportunities, and strategic response objectives can be analyzed for each POD to optimize fire management decision making within them. We believe the concept of POD and associated analysis could be used to delineate landscape and analyzing ROI from fuel treatment, preparedness, and suppression programs, therefore supporting budget analysis in the future.
Input data availability, quality and consistency has been a major challenge in landscape fire management. The accuracy of fire program budgeting analysis results would certainly depend on the quality of those input date used. Many data assumptions were made during our analysis. Recent nationwide studies, related with fire risk assessment, fireline effectiveness (Gannon et al., 2020), fire suppression difficulty (O’Connor et al., 2016), and WUI risk delineation (Ager et al., 2021) could be useful to better quantify fire risk and improve future landscape fire management and fire program budget analyses. It would also be advantageous to continuously communicating with park fire managers and stakeholders to improve the system inputs.
Data Availability Statement
The datasets presented in this article are not readily available because sensitive budgeting information is not publicly available. Requests to access the datasets should be directed to DR, doug.rideout@colostate.edu.
Author Contributions
DR: overall manuscript and project design economic theory. YW: quantitative methods and theory. NK: programing, GIS, and data management. All authors contributed to the article and approved the submitted version.
Conflict of Interest
The authors declare that the research was conducted in the absence of any commercial or financial relationships that could be construed as a potential conflict of interest.
Publisher’s Note
All claims expressed in this article are solely those of the authors and do not necessarily represent those of their affiliated organizations, or those of the publisher, the editors and the reviewers. Any product that may be evaluated in this article, or claim that may be made by its manufacturer, is not guaranteed or endorsed by the publisher.
References
Ager, A. A., Evers, C. R., Day, M. A., Alcasena, F. J., and Houtman, R. (2021). Planning for future fire: scenario analysis of an accelerated fuel reduction plan for the western United States. Lands. Urban Plan. [Online] 215:104212. doi: 10.1016/j.landurbplan.2021.104212
Ager, A. A., Houtman, R., Day, M. A., Ringo, C., and Palaiologou, P. (2019). Tradeoffs between US national forest harvest targets and fuel management to reduce wildfire transmission to the wildland urban interface. For. Ecol. Manag. 434, 99–109. doi: 10.1016/j.foreco.2018.12.003
Ager, A. A., Vaillant, N. M., and Mcmahan, A. (2013). Restoration of fire in managed forests: a model to prioritize landscapes and analyze tradeoffs. Ecosphere [Online] 4, 1–19. doi: 10.1890/ES13-00007.1
Calkin, D., and Gebert, K. (2006). Modeling fuel treatment costs on Forest Service lands in the western United States. West. J. Appl. For. 21, 217–221. doi: 10.1093/wjaf/21.4.217
Chung, W. (2015). Optimizing fuel treatments to reduce wildland fire risk. Curr. For. Rep. 1, 44–51. doi: 10.1007/s40725-015-0005-9
Eidenshink, J., Schwind, B., Brewer, K., Zhu, Z. L., Quayle, B., and Howard, S. (2007). Monitoring trends in burn severity. Fire Ecol. 3, 3–21. doi: 10.4996/fireecology.0301003
Finney, M. A., Mchugh, C. W., Grenfell, I. C., Riley, K. L., and Short, K. C. (2011). A simulation of probabilistic wildfire risk components for the continental United States. Stoch. Environ. Res. Risk Asses. 25, 973–1000. doi: 10.1007/s00477-011-0462-z
Gannon, B. M., Thompson, M. P., Deming, K. Z., Bayham, J., Wei, Y., and O’Connor, C. D. (2020). A Geospatial framework to assess fireline effectiveness for large wildfires in the Western USA. Fire 3:43. doi: 10.3390/fire3030043
Gebert, K. M., Calkin, D. E., Huggett, R. J., and Abt, K. L. (2008). Economic Analysis of Federal Wildfire Management Programs: The Economics of Forest Disturbances. Dordrecht: Springer, 295–322. doi: 10.1007/978-1-4020-4370-3_15
Getreuer, P. (2011). Linear methods for image interpolation. Image Proces. Line 1, 238–259. doi: 10.5201/ipol.2011.g_lmii
Hoover, K. (2017). Congressional Research Service: Wildfire Management Funding: Background Issues, and FY2018 Appropriations. 18. Available online at: at https://fas.org/sgp/crs/misc/R45005.pdf (accessed December 31, 2021).
Kong, D. (2005). Performance-based budgeting: the US experience. Public Organ. Rev. 5, 91–107. doi: 10.1007/s11115-005-1782-6
Lindblad, M. (2019). The Purposes, Advantages and Disadvantages of a Line Item Budget. Available online at: https://bizfluent.com/info-8628756-purposes-disadvantages-line-item-budget.html (accessed December 31, 2021).
Melkers, J., and Willoughby, K. (1998). The state of the states: performance-based budgeting requirements in 47 out of 50. Public Admin. Rev. 58:66. doi: 10.2307/976891
Minas, J., Hearned, J., and Martell, D. (2015). An integrated optimization model for fuel management and fire suppression preparedness planning. Ann. Operat. Res. 232, 201–215.
O’Connor, C. D., Thompson, M. P., and Rodríquez, S. F. (2016). Getting ahead of the wildfire problem: quantifying and mapping management challenges and opportunities. Geosciences 894:35. doi: 10.3390/geosciences6030035
Palaiologou, P., Kalabokidis, K., Ager, A. A., Galatsidas, S., Papalampros, L., and Day, M. A. (2021). Spatial optimization and tradeoffs of alternative forest management scenarios in Macedonia, Greece. Forests [Online] 12:697. doi: 10.3390/f12060697
Rideout, D. B., and Wei, Y. (2013). A probabilistic landscape analysis supporting the management of unplanned ignitions at sequoia and kings canyon National Parks. J. Sustain. For. 32, 437–455. doi: 10.1080/10549811.2012.760470
Rideout, D. B., Wei, Y., Kirsch, A. G., and Kernohan, N. (2016). Strategic planning and budgeting of wildland fire preparedness programs for risk management. Int. J. Safety Secur. Eng. 6, 246–253. doi: 10.2495/safe-v6-n2-246-253
Rideout, D. B., Wei, Y., Kirsch, A., and Botti, S. J. (2008). “Toward a unified economic theory of fire program analysis with strategies for empirical modeling,” in The Economics of Forest Disturbances, eds T. P. Holmes, J. P. Prestemon, and K. Abt (Dordrecht: Springer), 361–380. doi: 10.1007/978-1-4020-4370-3_18
Rideout, D. B., Wei, Y., Kirsch, A., and Kernohan, N. (2017). STARFire: strategic budgeting and planning for wildland fire management. Park Sci. 32, 34–41.
Scott, J. H., Thompson, M. P., and Calkin, D. E. (2013). A Wildfire Risk Assessment Framework for Land and Resource Management. Fort Collins, CO: USDA Forest Service, Rocky Mountain Research Station. doi: 10.2737/RMRS-GTR-315
Studenmund, A. (2001). Using Econometrics: A Practical Guide, 4th Edn. Boston, MA: Addison Wesley Longman, Inc.
Thompson, M. P., Gannon, B. M., Caggiano, M. D., O’connor, C. D., Brough, A., Gilbertson-Day, J. W., et al. (2021). Prototyping a geospatial atlas for wildfire planning and management. Forests 11:909. doi: 10.3390/f11090909
Thompson, M. P., Lauer, C. J., Calkin, D. E., Rieck, J. D., Stonesifer, C. S., and Hand, M. S. (2018). Wildfire response performance measurement: current and future directions. Fire 1:21. doi: 10.3390/fire1020021
US Department of Interior Office of Budget (USDOI) (2020). The United States Department of the Interior, Budget Justifications and Performance Information Fiscal Year 2020: Wildland Fire Management. Available online at: https://www.doi.gov/sites/doi.gov/files/uploads/fy2020_wfm_budget_justification.pdf (accessed December 31, 2021).
US Department of the Interior and Us Department of Agriculture (USDOI and USDA) (2014). The National Strategy: Final Phase in the Development of the National Cohesive Wildland Fire Management Strategy. Available online at: https://forestsandrangelands.gov/documents/strategy/strategy/CSPhaseIIINationalStrategyApr2014.pdf (accessed December 31, 2021).
US Government Accountability Office (GAO) (2002). Wildland Fire Management: Improved Planning Will Help Agencies Better Identify Fire-Fighting Preparedness Needs. Report GAO-02-158. Washington, DC: US General Accounting Office, 35.
US Government Accountability Office (GAO) (2005). Wildland Fire Management: Forest Service and Interior Need to Specify Steps and a Schedule for Identifying Long-Term Options and Their Costs. Testimony GAO-05-353T. Washington, DC: US Government Accountability Office, 15.
US Government Accountability Office (GAO) (2009). Wildland Fire Management: Federal Agencies Have Taken Important Steps Forward, but Additional, Strategic Action is Needed to Capitalize on Those Steps. Report GAO-09-877. Washington, DC: US Government Accountability Office, 49.
Wei, Y., Rideout, D., and Kirsch, A. (2008). An optimization model for locating fuel treatments across a landscape to reduce expected fire losses. Canad. J. For. Res. 38, 868–877. doi: 10.1139/x07-162
Wei, Y., Rideout, D., Kirsch, A., and Kernohan, N. (2016). Comparing alternative budget allocation models to support strategic wildland fire program analysis across US National Parks. Int. J. Saf. Secur. Eng. 6, 238–245. doi: 10.2495/SAFE-V6-N2-238-245
Appendix
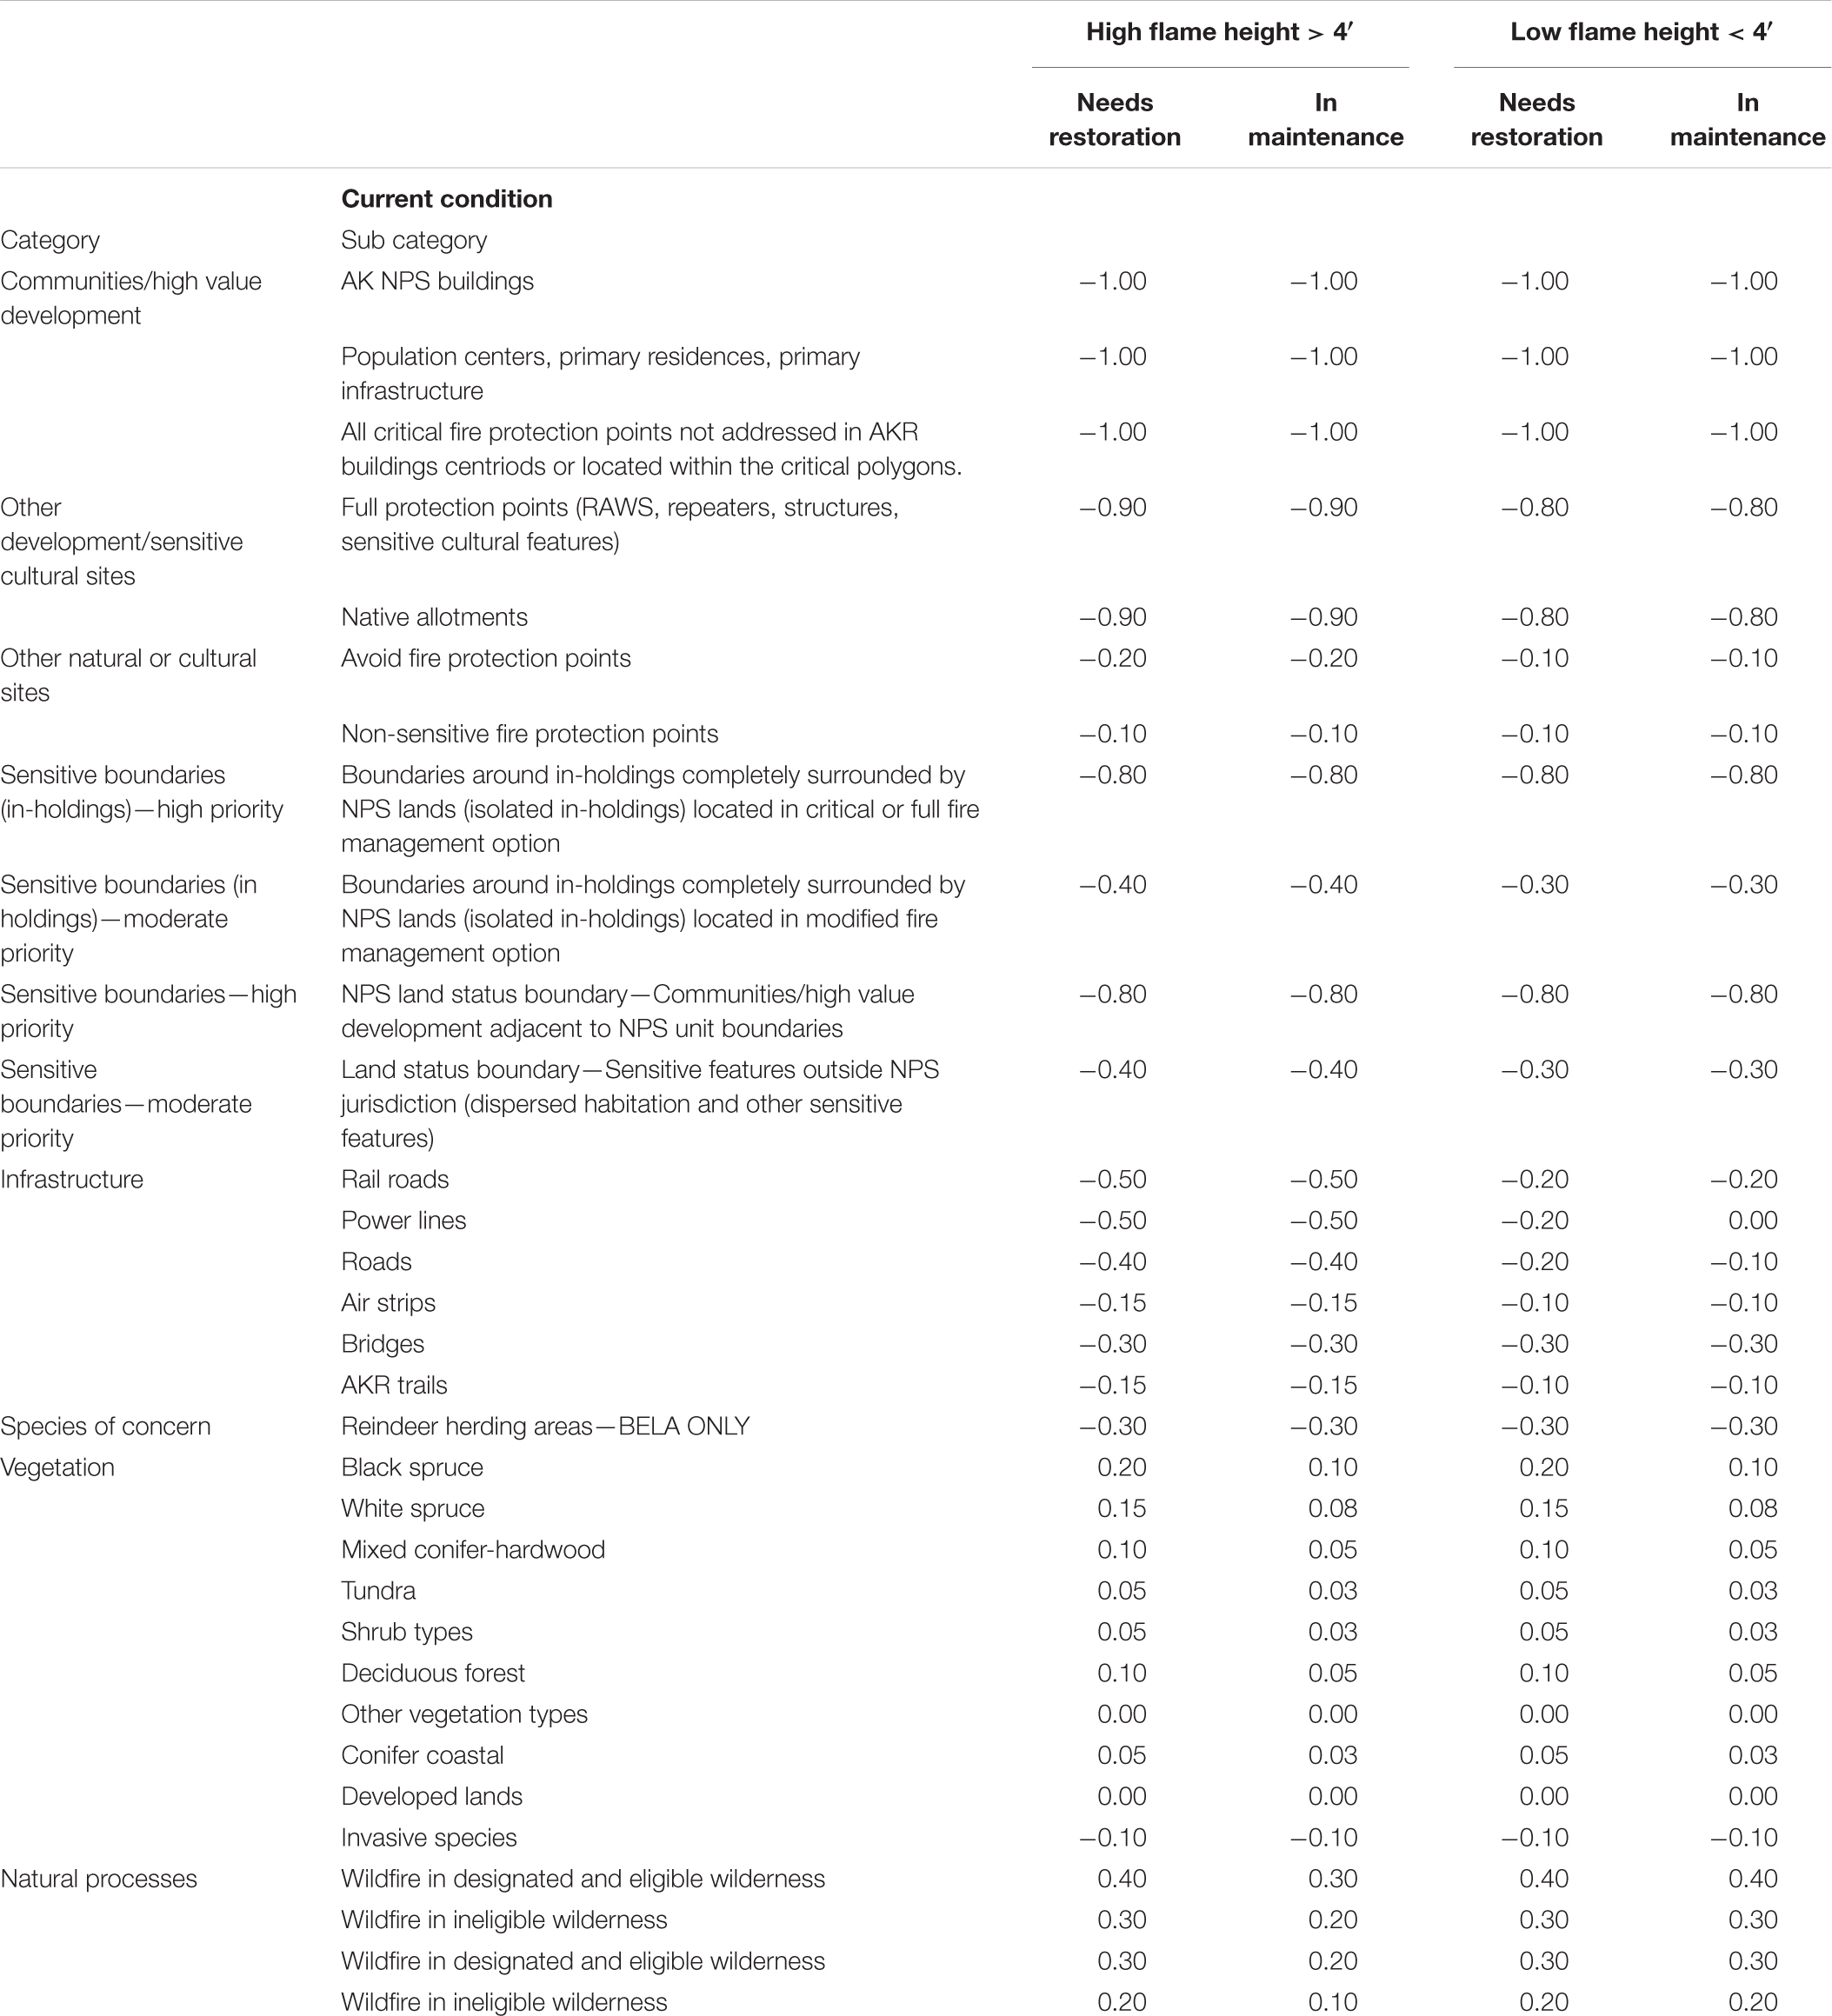
Table A1. The use of marginal fire effective values in the AK study measured by WUI Coin (Rideout et al., 2017).
Keywords: wildland fire, strategic budgeting, program analysis, Alaska national parks, gradient method
Citation: Rideout DB, Wei Y, Kernohan N and Kirsch AG (2022) A Potential Framework for Allocating National Park Service Budgets. Front. For. Glob. Change 5:716569. doi: 10.3389/ffgc.2022.716569
Received: 28 May 2021; Accepted: 12 January 2022;
Published: 03 February 2022.
Edited by:
Marcos Rodrigues, University of Zaragoza, SpainReviewed by:
Anastasia Christopoulou, National and Kapodistrian University of Athens, GreeceFermín J. Alcasena Urdíroz, United States Forest Service, United States Department of Agriculture (USDA), United States
Copyright © 2022 Rideout, Wei, Kernohan and Kirsch. This is an open-access article distributed under the terms of the Creative Commons Attribution License (CC BY). The use, distribution or reproduction in other forums is permitted, provided the original author(s) and the copyright owner(s) are credited and that the original publication in this journal is cited, in accordance with accepted academic practice. No use, distribution or reproduction is permitted which does not comply with these terms.
*Correspondence: Douglas B. Rideout, doug.rideout@colostate.edu