Experimental Test of the Combined Effects of Water Availability and Flowering Time on Pollinator Visitation and Seed Set
 M. Kate Gallagher1,2,3
  Diane R. Campbell1,2*
- 1Department of Ecology and Evolutionary Biology, University of California, Irvine, Irvine, CA, United States
- 2Rocky Mountain Biological Laboratory, Crested Butte, CO, United States
- 3The Botanical Garden, School of Plant Sciences and Food Security, Tel Aviv University, Tel Aviv, Israel
Climate change is likely to alter both flowering phenology and water availability for plants. Either of these changes alone can affect pollinator visitation and plant reproductive success. The relative impacts of phenology and water, and whether they interact in their impacts on plant reproductive success remain, however, largely unexplored. We manipulated flowering phenology and soil moisture in a factorial experiment with the subalpine perennial Mertensia ciliata (Boraginaceae). We examined responses of floral traits, floral abundance, pollinator visitation, and composition of visits by bumblebees vs. other pollinators. To determine the net effects on plant reproductive success, we also measured seed production and seed mass. Reduced water led to shorter, narrower flowers that produced less nectar. Late flowering plants produced fewer and shorter flowers. Both flowering phenology and water availability influenced pollination and reproductive success. Differences in flowering phenology had greater effects on pollinator visitation than did changes in water availability, but the reverse was true for seed production and mass, which were enhanced by greater water availability. The probability of receiving a flower visit declined over the season, coinciding with a decline in floral abundance in the arrays. Among plants receiving visits, both the visitation rate and percent of non-bumblebee visitors declined after the first week and remained low until the final week. We detected interactions of phenology and water on pollinator visitor composition, in which plants subject to drought were the only group to experience a late-season resurgence in visits by solitary bees and flies. Despite that interaction, net reproductive success measured as seed production responded additively to the two manipulations of water and phenology. Commonly observed declines in flower size and reward due to drought or shifts in phenology may not necessarily result in reduced plant reproductive success, which in M. ciliata responded more directly to water availability. The results highlight the need to go beyond studying single responses to climate changes, such as either phenology of a single species or how it experiences an abiotic factor, in order to understand how climate change may affect plant reproductive success.
Introduction
Anthropogenic climate change includes both rising global temperatures and changes in precipitation patterns (IPCC, 2014). These abiotic factors have direct physiological effects on plants and animals that can impact their fitness, but they also influence the timing of key life history events (i.e., phenology) of many species (Fitter and Fitter, 2002; Walther, 2003; Parmesan, 2006; Marshall et al., 2008; Hegland et al., 2009; Bartomeus et al., 2011). Species-specific responses to climate change can also disrupt many ecologically and economically important relationships among species (Cleland et al., 2007; Memmott et al., 2007; Forrest and Miller-Rushing, 2010; Forrest et al., 2010; Cardinale et al., 2012; Jamieson et al., 2012; Winfree, 2013). The mutualism between plants and their pollinators is among the most vital of these interactions to maintaining the functional integrity of terrestrial ecosystems (Abrol, 2012; Aizen et al., 2009). Understanding how plant-pollinator relationships are being affected by climate change is therefore of critical importance. Here we focus on the combined influence of changes in water availability and phenology for plant reproductive success and the extent to which they are mediated through changes in animal pollination by studying impacts on seed set as well as pollinator visitation. Each of these factors (water and phenology) have been investigated separately, but how they act in concert is little known.
Phenological shifts among plants and their pollinators can affect plant reproductive success through the mechanism of seasonal changes in the pollinator visitation rate and the community of potential pollinators that visit plants (Parsche et al., 2011; Rafferty and Ives, 2011, 2012). While reduced pollinator visitation rates are predicted to result in insufficient pollen deposition, changes in the community of pollinators may increase or decrease pollination success via changes in pollinator effectiveness (Bruckman and Campbell, 2014). Because plants in the same community may not respond in the same way to environmental changes (CaraDonna et al., 2014), species-level phenological shifts can also impact the relative abundances of hetero- and conspecific co-flowering plants, altering pollinator visitation rates (Lázaro et al., 2009; Lázaro and Totland, 2010) and the types of pollinators that visit a plant (Moeller, 2005; Mitchell et al., 2009). Changes in pollinator visitation due to experimental manipulation of flowering phenology are known from several systems (Campbell, 1985; Parsche et al., 2011; Rafferty and Ives, 2012; Gezon et al., 2016; Eisen et al., 2019).
Altered precipitation patterns and changes in temperature are expected to have direct physiological effects on plants and insect pollinators, which can affect reproductive success through changes in resource availability for developing offspring. Importantly, changes in water availability can also affect pollination by altering the capacity of plants to produce a floral display that is attractive to pollinators, e.g., by changing flower number, size, or reward (Herrera, 1995; Galen, 2000; Carroll et al., 2001; Mal and Lovett-Doust, 2005; Caruso, 2006; Strauss and Whittall, 2006; Burkle and Irwin, 2009; Gorden and Adler, 2013; Gallagher and Campbell, 2017; Suni et al., 2020). Changes in water availability during the growing season alters the capacity of plants to maintain turgor while transpiring water during photosynthesis, and also impacts their ability to uptake nutrients by affecting plant-microbial interactions and mass flow of nutrients in the soil (Galen et al., 1999; Caruso et al., 2005; Burkle and Irwin, 2009; Berdanier and Klein, 2011; Barber and Soper Gorden, 2014). As a consequence, changes in water availability can affect the ability of plants to attract pollinators through changes in the emission and composition of floral volatiles (Burkle and Runyon, 2016), the volume and composition of nectar and pollen rewards (Zimmerman and Pyke, 1988; Carroll et al., 2001; Nicolson et al., 2007; Burkle and Irwin, 2009; Halpern et al., 2010; Waser and Price, 2016), and the overall size of the floral display. These floral responses to experimental changes in water availability have been shown to impact pollinator visitation in several plant species (Burkle and Runyon, 2016; Glenny et al., 2018; Walter, 2020), sometimes in non-linear ways (Gallagher and Campbell, 2017).
Whereas previous studies have experimentally manipulated either flowering phenology or water availability and measured impacts on pollinator visitation, these two types of manipulations have generally been carried out in separate systems. As a result, we know little about their comparative effects on plant reproductive success. And, although each factor can independently affect pollination, the extent to which phenological shifts and water availability interact in their effects on pollination and reproductive success remains unexplored. Whether the effects of water availability vary with timing of flowering will likely depend on a variety of factors. These include seasonal changes in pollinator abundance and whether that imposes seasonal variation in pollen limitation, the extent to which early and late-season pollinators respond differently to water-mediated changes in floral traits, and the extent to which plant reproductive success depends on differences in pollen limitation or water resource availability. For example, if flower size and nectar amount have a greater influence on pollinators that dominate late in the season than they have on those that are more common early in the season, then water availability may have a stronger effect on visitation rate late in the season than early in the season. In turn, that response would mean that the effect of water availability on pollinator visitation would depend on flowering time. If, however, drought-mediated changes in floral traits alter pollinator visitation equally through time, then pollination and seed set may decline throughout the season to the same extent when water is limited and when water is abundant, such that effects are additive. Changes in water availability and flowering phenology are frequently co-occurring responses to climate change. For example, in the southern Rocky Mountains, the trend toward reduced snowpack and early snowmelt in the spring (IPCC, 2014) advances flowering time (CaraDonna et al., 2014) and also reduces soil water in early summer (Blankinship et al., 2014), which in turn increases water stress on plants (Sloat et al., 2015). Climate models predict a general decline in precipitation compared to evapotranspiration in the region (Seager et al., 2012), which could exacerbate that water stress further. It is therefore important to test the relative impacts of phenology and water and the extent to which their effects on pollination and plant reproductive success depend on each other. Such interactions have not yet been investigated through experimental manipulation.
In this study, we asked the following major questions: (1) Do changes in water availability or differences in flowering phenology have larger effects on pollination and plant reproductive success in the same species? and (2) Do the impacts of changes in flowering phenology on pollination and reproductive success vary with changes in water availability? To answer these questions, we manipulated both flowering onset and water availability to the tall-fringed bluebell, Mertensia ciliata (Boraginaceae), in a factorial experiment and measured effects on pollinator visitation and female reproductive success (i.e., seed set and seed mass). To aid in interpreting mechanisms behind changes in visitation, we also measured floral display size and floral morphology.
Materials and Methods
Study System
Fieldwork was conducted on Mertensia ciliata (James ex Torr.) G. Don (Boraginaceae) in a subalpine meadow along Rustler Gulch in Gunnison National Forest (38°59′32.68″ N, 107°00′23.16″ W; 3,009 m.a.s.l.) located 4.3 km from the Rocky Mountain Biological Laboratory (RMBL) in Gothic, Gunnison County, Colorado, United States. Between 1973 and 2006, mean spring (April–June) temperatures at RMBL have increased by 2.0°C, and the average date of spring snowmelt has advanced by nearly 2 weeks (Miller-Rushing and Inouye, 2009). In many subalpine systems, both flowering phenology and summer water availability are largely driven by spring temperatures, snowpack depth, and snowmelt timing (Wielgolaski and Inouye, 2013). In the southern Rocky Mountains, over the next century, temperatures are expected to continue to increase, while both winter snow fall and total precipitation are expected to decrease (Overpeck and Udall, 2010; Pederson et al., 2011), resulting in earlier snowmelt timing (Saunders et al., 2008) and earlier, longer dry seasons prior to mid-summer thundershowers.
Mertensia ciliata, the tall-fringed bluebell, is an herbaceous, rhizomatous perennial of the subalpine and lower alpine zones of the Rocky and Sierra Nevada Mountains. Plants form compact clones of a few to several hundred flowering ramets and are commonly found along streams and in wet meadows (Pelton, 1961). The flowers are pendant and tubular, expanding to a wider, lobed mouth, and are borne in dense clusters of cymes along leafy stems. Flowers are typically open for 6 days, with receptive stigmas throughout flowering and can produce a maximum of four one-seeded nutlets (hereafter seeds). The seeds have elaisomes and so are likely ant-dispersed.
Pollen is usually removed within 24–48 h of anther dehiscence by medium and long-tongued bumblebees, including Bombus balteatus (Dahlbom), B. bifarius (Cresson), B. flavifrons (Cresson), and B. frigidus (Smith) (Geber, 1985; Suzuki, 1994; Gallagher and Campbell, 2017). Mertensia ciliata flowers are also visited by flies (Bombyliidae, Muscoidea, and Syrphidae) and solitary bees (Colletidae: Colletes p. paniscus Vier. and Megachilidae: Osmia spp.) (Pelton, 1961; Gallagher and Campbell, 2017). Although M. ciliata is self-compatible, seed set is dependent on insect pollination, with flowers prevented from receiving an insect visit rarely producing seeds and averaging only 8% as many seeds as those open to insect pollination (Geber, 1985).
Mertensia ciliata flowers from late June through early August in the subalpine meadows around RMBL. An individual plant flowers for 3–5 weeks (Geber, 1985). As with many species in this region, M. ciliata’s flowering phenology is strongly correlated with the timing of snowmelt (Miller-Rushing and Inouye, 2009; Wielgolaski and Inouye, 2013). In fact, between 1973 and 2006, the average date of first bloom (DFB) has advanced by 3.3 days per decade (Miller-Rushing and Inouye, 2009). Over the same 34-year period, M. ciliata has become less common at lower elevations (≤2,900 m a.s.l.), and observed declines in peak floral abundance (15 fewer flowers per decade) correlate with earlier snowmelt timing (1.6 fewer flowers per day earlier snowmelt) (Miller-Rushing and Inouye, 2009). In the plant communities surrounding RMBL, phenological responses to warmer spring temperatures and early snowmelt are producing a longer mid-season dip in floral abundance (Aldridge et al., 2011), which may impact pollinator abundance and pollination success of summer-blooming plants like M. ciliata. Over a somewhat longer record of 39 years, its date of peak bloom advanced by an amount (1.6 days per decade) fairly similar to the average advance in peak bloom near RMBL (2.5 days per decade; CaraDonna et al., 2014). With some species advancing quickly and others less so, M. ciliata will overlap more with some species and less with others in the future. Overall, these patterns suggest that changes in spring temperatures and snowmelt timing may alter M. ciliata pollination and reproductive success through changes in water availability and flowering phenology.
Previous field experiments with M. ciliata revealed that both changes in water availability and changes in flowering phenology can independently affect pollination success in this species. Floral responses to experimental changes in water availability altered pollinator visitation rates, but the effects were non-linear, with visitation peaking at intermediate water levels (Gallagher and Campbell, 2017). In a separate experiment, shifts in timing of flowering onset affected the pollination of plants, such that early-flowering plants received a higher frequency and diversity of pollinator visitors than did late-flowering plants. Those pollinators that visited late-flowering plants were more effective pollinators than their early-season counterparts, resulting in no net difference in seed set between early- and late-flowering plants (Gallagher and Campbell, 2020). In this system we expected that water availability would have less effect on pollinator visitation early in the season, when pollinators are abundant and diverse, allowing visitation to all size flowers and perhaps less choosy visitors due to competition for nectar. But later in the season, when visits are dominated by worker bumblebees, including B. flavifrons which shows preferences based on flower size (Campbell et al., 2014), we predicted that differences in water-mediated floral traits (e.g., size, nectar) would more likely impact pollinator visitation rates.
Experimental Design
To test the extent to which effects of phenology on pollination and reproductive success vary with co-occurring changes in water availability, we manipulated both flowering onset and water availability in a factorial experiment using potted M. ciliata plants. Between 2012 and 2015, 120 plants were collected from a large M. ciliata population in Rustler Gulch and potted using native soil in 2-gallon plastic pots (actual volume: 1.593 Gallons, Nursery Supplies, Inc.). A portion of the plants were used for other studies in 2013 and 2015, but otherwise remained in trenches and overwintered in the ground under snow at RMBL until their use for this experiment. In 2016, potted plants were randomly assigned to one of three water treatments, dry, average, and wet. To inhibit flowering, potted plants were moved to Schofield Pass (39°00′54.98″ N, 107° 2′49.40″ W; 3,263 m.a.s.l.) in early June, where they were placed in a shaded snowbank under a mesh shade-shelter. Each week, 30 randomly selected plants, 10 per water treatment, were moved back to RMBL, where the higher light and warmer temperatures at low elevation induced them to flower at the experimentally chosen time (typically within 5–7 days after being moved to RMBL).
Each week, 30 plants in their first week of flowering (10 per water treatment) were moved from RMBL to a meadow near the original source population in Rustler Gulch. Plants were arranged 30 cm apart into five randomized arrays of six plants, set 30 cm apart in a single line, with 2 m between arrays. Each array included two plants of each water treatment. In week 4, 12 plants stopped flowering mid-week and therefore we re-randomized the plants that had flowers remaining into three new arrays with six plants each. Where appropriate, we calculated the mean values per array of week four plants before and after the plants were rearranged, and then averaged those two values for each plant. To create distinct experimental populations, arrays were located 50 meters away from unmanipulated M. ciliata populations. Plants remained in the arrays for 1 week before being replaced by the next group. This period was the only time when their flowers were available for pollination. A total of 114 plants flowered and were included in the experiment, for a total of four phenology treatment groups spanning 4 weeks (June 20–July 17).
The water manipulations were maintained through the growing season (June 10–August 1) and discontinued once seeds were collected. We watered pots manually with watering cans slowly and evenly to avoid pooling, in the mid to late afternoon to coincide with the timing of July thundershowers. Throughout the experiment, we measured soil moisture as volumetric water content (VWC) every third day using a 12 cm Campbell Scientific “HydroSense” probe inserted into the center of each pot (if done on the day of watering, always before applying water). We used these VWC measurements to maintain soil moistures within the pots at levels that correspond with VWC levels in a previous water manipulation experiment with M. ciliata (Gallagher and Campbell, 2017) performed at a nearby site with similar soil. In that study, plants within naturally occurring populations received either 50% reduction in precipitation (hereafter “dry”), additional rainfall equal to the historic average rainfall during July from 1990 to 2009 (hereafter “wet”; based on long-term data reported in Campbell and Wendlandt, 2013), or ambient conditions (“control”). In that previous field study, VWC had averaged 9.4, 11.7, and 15.4%, respectively. In the end, we watered wet pots daily, control pots every other day, and dry pots every third day, achieving 10.4 ± 0.4%, 12.7 ± 0.4%, and 17.5 ± 0.6% average VWC in the soil for dry, control, and wet pots respectively (Mean ± SEM). Whereas these values for VWC resembled those for in situ plants in our earlier study, the measured values may slightly underestimate actual average soil moisture depending on the relationship between soil moisture and time between watering and measurement, as well as the impact of variable rain events. Average VWC values for plots were analyzed with a linear mixed model with the main and interactive effects of water treatment and phenology week as fixed effects, and array nested in phenology week as a random effect. The resultant gradient in soil moisture did not vary significantly among phenology weeks [Water: χ2(2) = 106.3, P < 0.0001, Phenology: χ2(3) = 5.2, P = 0.2, Water × Phenology: χ2(6) = 1.44, P = 0.96, Figure 1A].
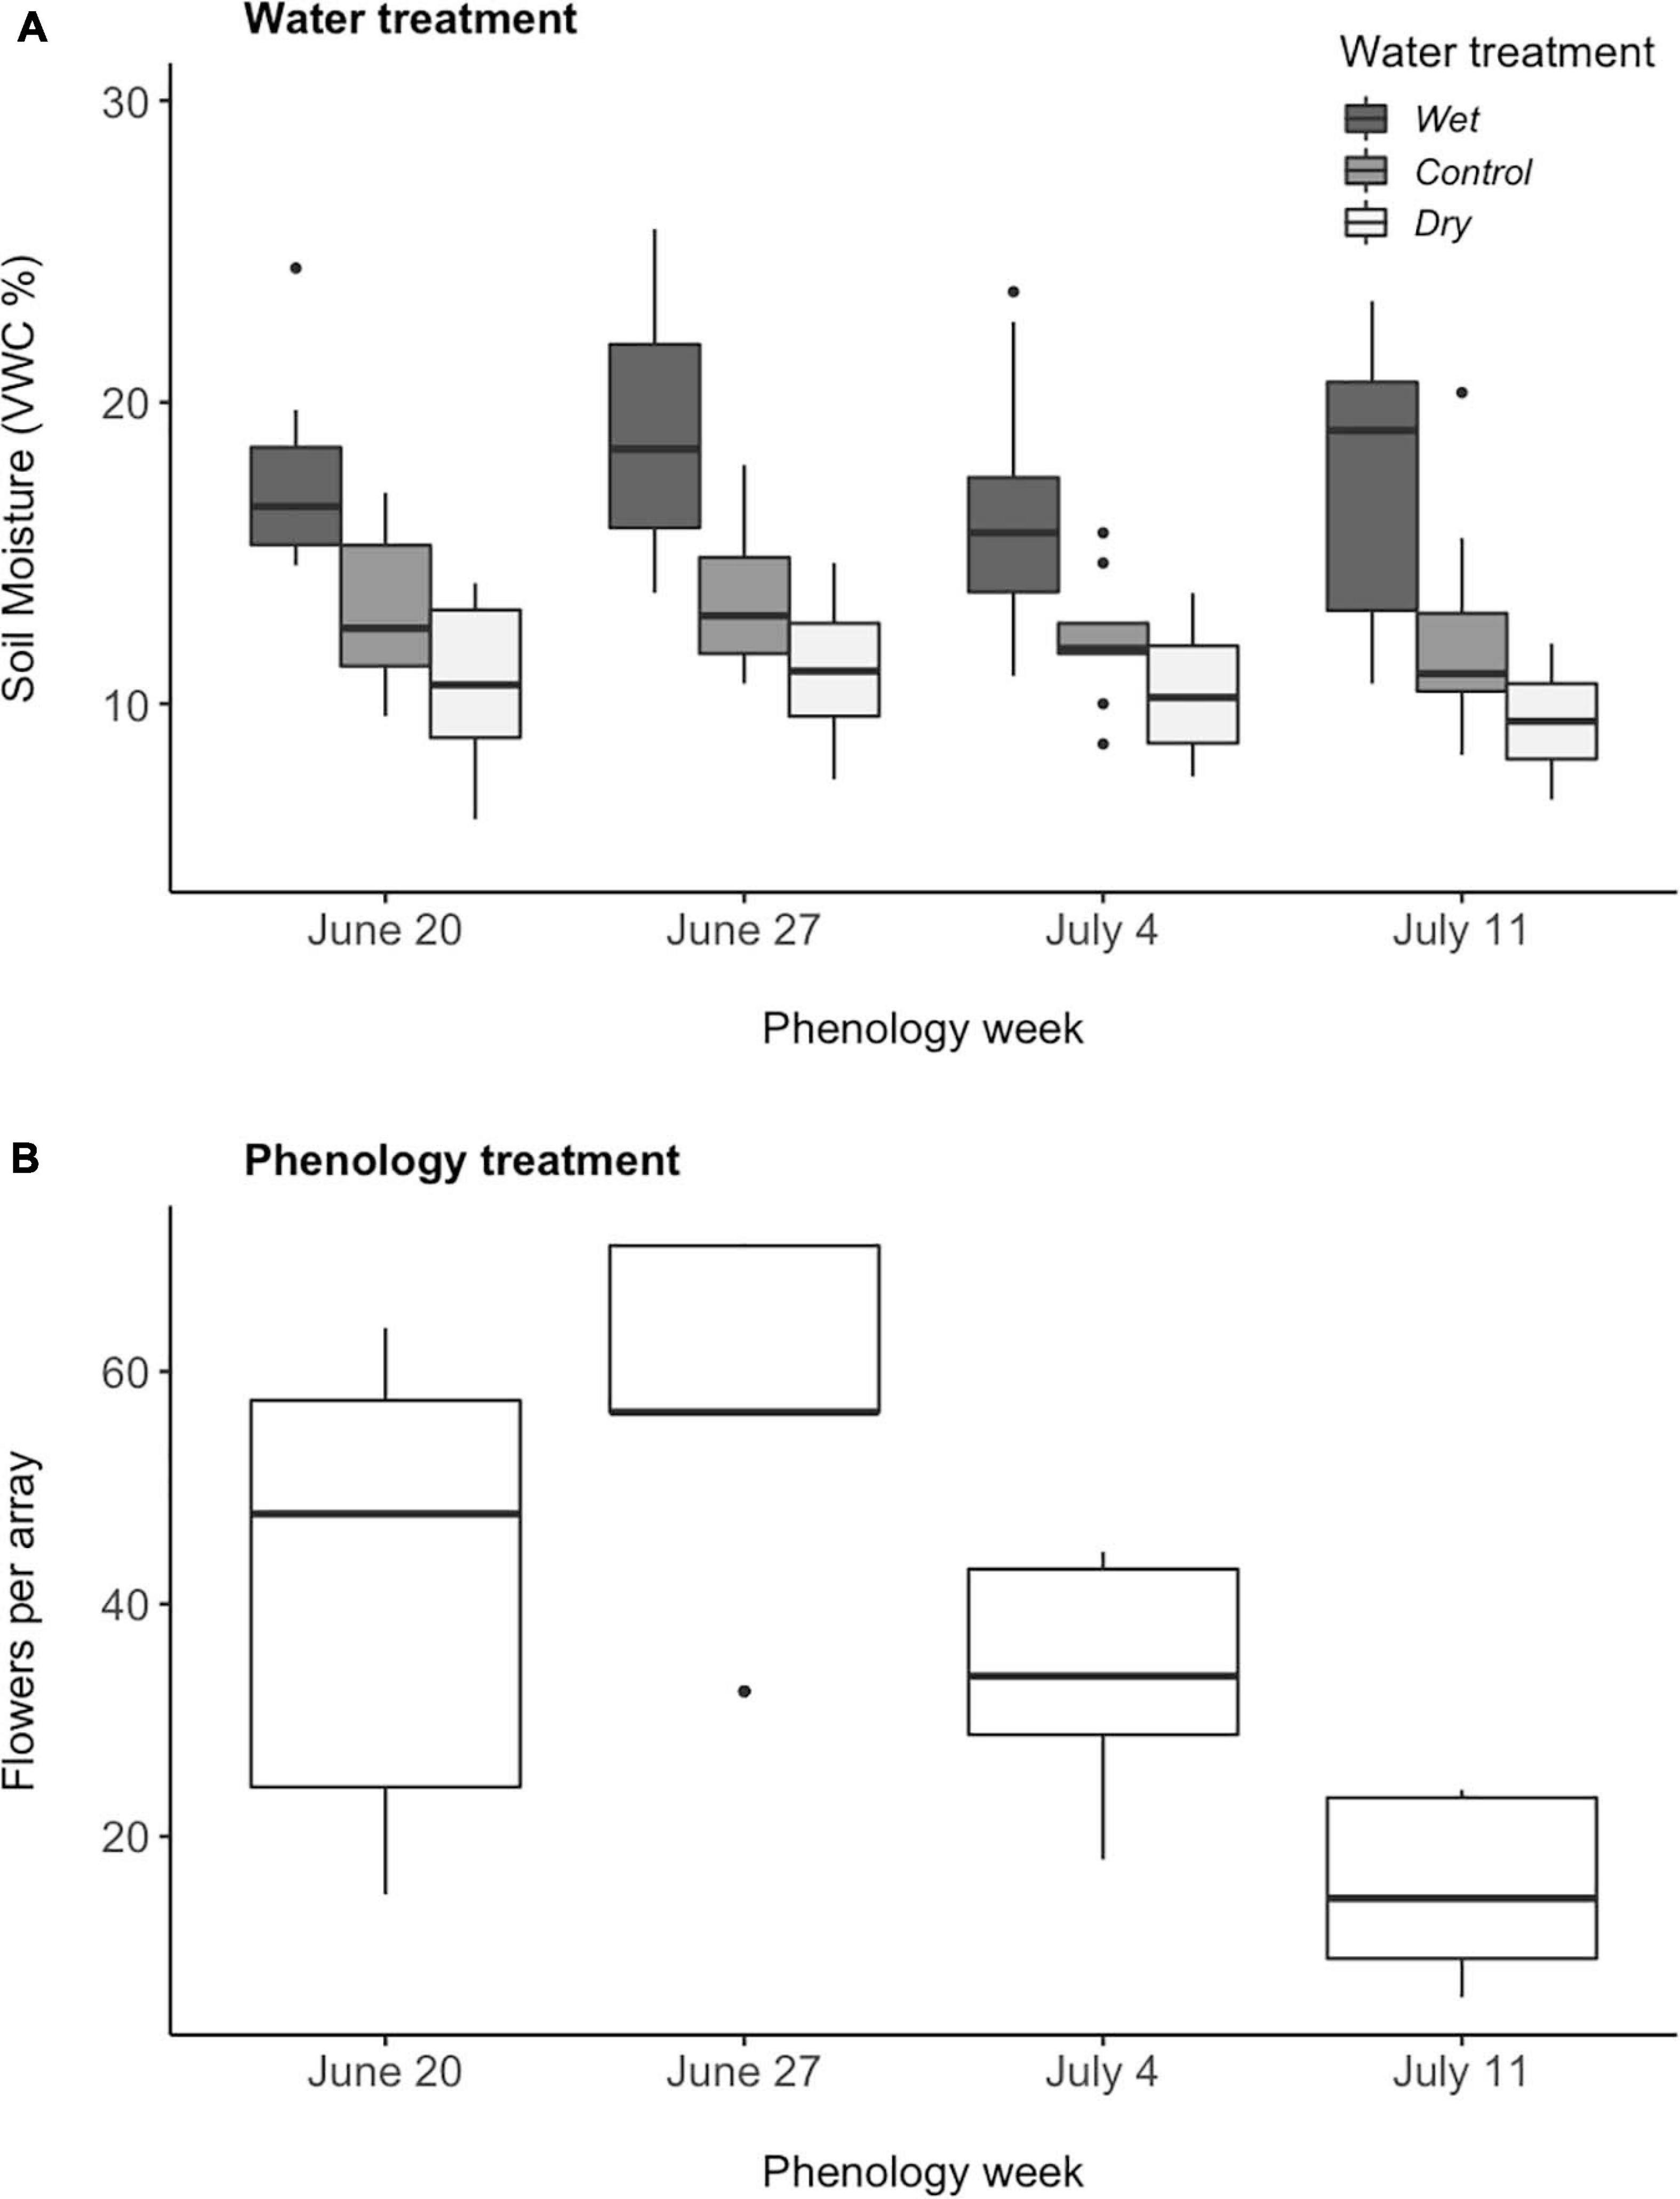
Figure 1. Mean (A) soil moisture of three water treatments and (B) floral abundance per array of Mertensia ciliata plants across four phenology weeks (N = 114). Soil moisture was measured as volumetric water content (VWC), assessed every third day, and when applicable, always before applying water. The center of the boxplot represents the median value, the edges of the box indicate the 25th and 75th percentiles, the whiskers represent the 5th and 95th percentiles of the distributions, and the points indicate outlaying values.
Note that we manipulated both factors within a realistic range of natural variation. The four phenology weeks corresponded closely with the range of flowering time onset in nearby natural populations (Gallagher and Campbell, 2020). The water treatments of adding 100% or subtracting 50% of average rainfall fell within the range of summer precipitation over the past few decades (Campbell and Wendlandt, 2013).
Measurements of Reproductive Traits, Pollinator Visitation, and Reproduction
For each phenology week, we measured reproductive traits, including total abundance of flowers open during the phenology week, corolla size, and nectar volume and sugar concentration. We measured corolla width at the opening of the tube and corolla length from the base of the calyx to a randomly chosen corolla lobe for an average of 4.4 ± 0.4 flowers per plant. Corollas were measured on the second or third day of each phenology week. All flowers within an array were measured at the same time, and the order in which arrays were measured was randomized each week. At the end of each week, after pollination observations were complete, individual flowers in each phenology group were labeled and all flowering stems were bagged with fine mesh jewelry bags (Uline, Pleasant Prairie, WI, United States) to prevent further pollination and loss of seeds, and to provide a count of the total number of flowers open during that phenology week. For plants with flowers remaining at the end of each week, we measured nectar volume and percent sugar concentration 48 h after plants were bagged (N = 71 plants). For an average of 2.6 ± 0.2 flowers per plant, we measured nectar volume using 5 μl microcapillary tubes (Kearns and Inouye, 1993) and percent sugar concentration using a handheld nectar refractometer (Bellingham + Stanley Ltd., Basingstoke, Hants, United Kingdom). No flowers remained for nectar measurements in week 4; therefore, we only include nectar data from phenology weeks 1–3 in our analyses. To select which flowers to measure, we marked the calyx of buds to track when flowers opened and then chose at random among available flowers of the same age. For each floral trait, we calculated the mean trait value of each potted plant, to be used as the response variable in our analyses.
Plants in each phenology group were open to pollination for 1 week. During that time, we conducted pollinator observations and tracked pollinator identity and the number of flowers visited during multiple 30 min observation periods between the hours of 9:00 and 16:00. At the beginning of each observation period, we counted the number of open flowers per potted plant. We calculated mean pollinator visitation rate per plant as (total number of flowers visited)/(number of flowers available per hour of observations) averaged across the phenology week. Visitors were counted as pollinators if they crawled inside the flower corolla. For each 150 min round of observations to the five arrays we randomized the order of observations among arrays. In total, we completed 25 h of pollinator observations per phenology group.
During 100 h of pollinator observations to six plants at a time, we observed 340 floral visitors to experimental plants. The most common pollinators, bumblebees (Bombus spp.) and solitary bees (Osmia spp.), accounted for 92.6% of floral visitors, with flies (Muscoidea and Syrphidae 7.1%) and a moth (0.3%) making up the rest. We excluded the moth from our analyses. For a metric of pollinator type, for each potted plant we calculated mean percent of visitors that were bumblebees as (100% × number of visitors that were bumblebees)/(total number of flower visitors per hour of observation) averaged across the phenology week.
All plants remained in the field until seeds were collected to standardize conditions after pollination exposure. We counted the total number of seeds produced per marked flower (as described by Forrest and Thomson, 2010). We calculated the average seeds per flower for each potted plant as (number of mature seeds/number of flowers). Mature seeds from tagged flowers were collected in coin envelopes and transported to the University of California, Irvine to be weighed. We calculated mean seed mass for each plant as (mass of collected seeds/number of collected seeds). Seed mass included the mass of the elaiosome. All field procedures followed RMBL permitting guidelines.
Statistical Analysis
We tested whether experimental changes in flowering phenology and water availability had interactive effects on floral traits, pollinator visitation and percent of visitors that were bumblebees (i.e., pollinator type), and seed set. For each response variable, we tested whether the effects of flowering timing varied with changes in water availability using a model with main and interactive effects of water treatment and phenology week as fixed effects, and array nested in phenology week as a random effect. Both water and phenology treatments were treated as factors.
Residuals of the analyses for flowers per array, corolla width and length, nectar concentration, seed set, and seed mass were all approximately normally distributed, and we used linear mixed model (LMM) analyses to test whether changes in those traits resulting from differences in water availability differed among phenology weeks. We used generalized linear mixed models (GLMM) with a Poisson distribution (log link) to test for main and interactive effects of phenology week and water treatment on floral abundance per plant (i.e., flowers per plant) and nectar volume, the latter after multiplying by 100 and rounding to an integer.
We first attempted to test the fixed effects of phenology week and water treatment and the random effect of array on pollinator visitation using zero-inflated mixed models due to excess zeroes. Employing the glmmTMB package in R (Brooks et al., 2017), models using conditional distributions of Poisson or truncated generalized Poisson (on integer data) failed to converge even when the random effect of array was removed from the zero-inflated portion to reduce over-parameterization, and negative binomial distributions gave poor fits judging by Q-Q plots. We therefore ran separate analyses of the probability that a plant would receive a visit and the visitation rate to plants that received at least one visit. These analyses were performed using Proc Glimmix in SAS (v 9.3; SAS Institute, Inc., Cary, NC, United States). We tested whether the likelihood of receiving a pollinator visit differed among treatments in a GLMM with a binomial distribution and logit link. For plants receiving at least one visit, we tested the effects of water treatment and phenology week on pollinator visitation rate using a log-normal distribution, which provided a better fit than a Poisson, negative binomial, or normal distribution, based on a low value for Aikake’s information criterion (AIC), a low ratio of Pearson chi-square to df, and lack of pattern to a plot of residuals vs. predicted values.
For the analysis of pollinator type, we used the mean percent of visitors that were bumblebees for the two plants in each array that belonged to the same water treatment, as the response variable in our analyses. This averaging eliminated the need to designate array nested in phenology week as a random effect and allowed us to test the effects of phenology week and water treatment on pollinator type using a model with normally distributed residuals, which provided a good fit based on a plot of residuals vs. predicted values.
The floral abundance among arrays during the first three weeks ranged from 15 to 71, with a mean of 44.26 ± 1.9 (Mean ± SEM) flowers per array (Figure 1B). The floral abundance per array for week four plants, however, averaged 15 ± 1.3 flowers and was significantly lower than in the previous 3 weeks [χ2(3) = 29.47, P < 0.0001]. We assessed whether these differences in floral abundance influenced pollination by repeating the analyses on pollination with floral abundance per array added to each of the models.
Seed set is expected to be positively correlated with both pollinator visitation rate (Engel and Irwin, 2003; Sahli and Conner, 2007) and soil moisture (Burkle and Irwin, 2009; Berdanier and Klein, 2011). To test whether seed set increased with pollinator visitation rate, and whether the influence of pollinator visitation rate on seed set differed among water treatments, we performed a second analysis on seed set, adding mean pollinator visitation rate and the interaction between mean pollinator visitation rate and water treatment to the model. Because the interaction between mean pollinator visitation rate and water treatment was not significant (P > 0.05), we reran the model without the interaction to simplify interpretation.
Analyses were conducted using R (R Core Team, 2016), except where noted otherwise. We used the lme4 package in R (Bates et al., 2015) for all GLMM and LMM analyses and tested the models with type III Wald likelihood ratio tests using the car package in R (Fox and Weisberg, 2011). In the event of significant main effects, we performed Tukey post hoc comparisons across the levels of each effect using the lsmeans package (Lenth, 2016). For analyses of pollinator visitation, we used Proc Genmod and Proc Glimmix (when a random effect was included) in SAS (v 9.3; SAS Institute, Inc., Cary, NC, United States).
Results
Effects on Reproductive Traits
Water availability influenced corolla and nectar traits the same way regardless of phenology week (P > 0.05 for phenology x water interaction in all cases, Table 1). The dry treatment reduced corolla length, corolla width, and nectar volume compared to the other water treatments (Tukey pairwise comparison among water treatments, P < 0.05, Figures 2A–C), with no significant effect on nectar concentration (Figure 2D). Late season plants (week 4) also produced flowers that were 1.24 ± 0.01 mm shorter than those in week two (Tukey pairwise comparison among phenology weeks, P < 0.01), but corolla width and nectar volume did not differ among phenology weeks.
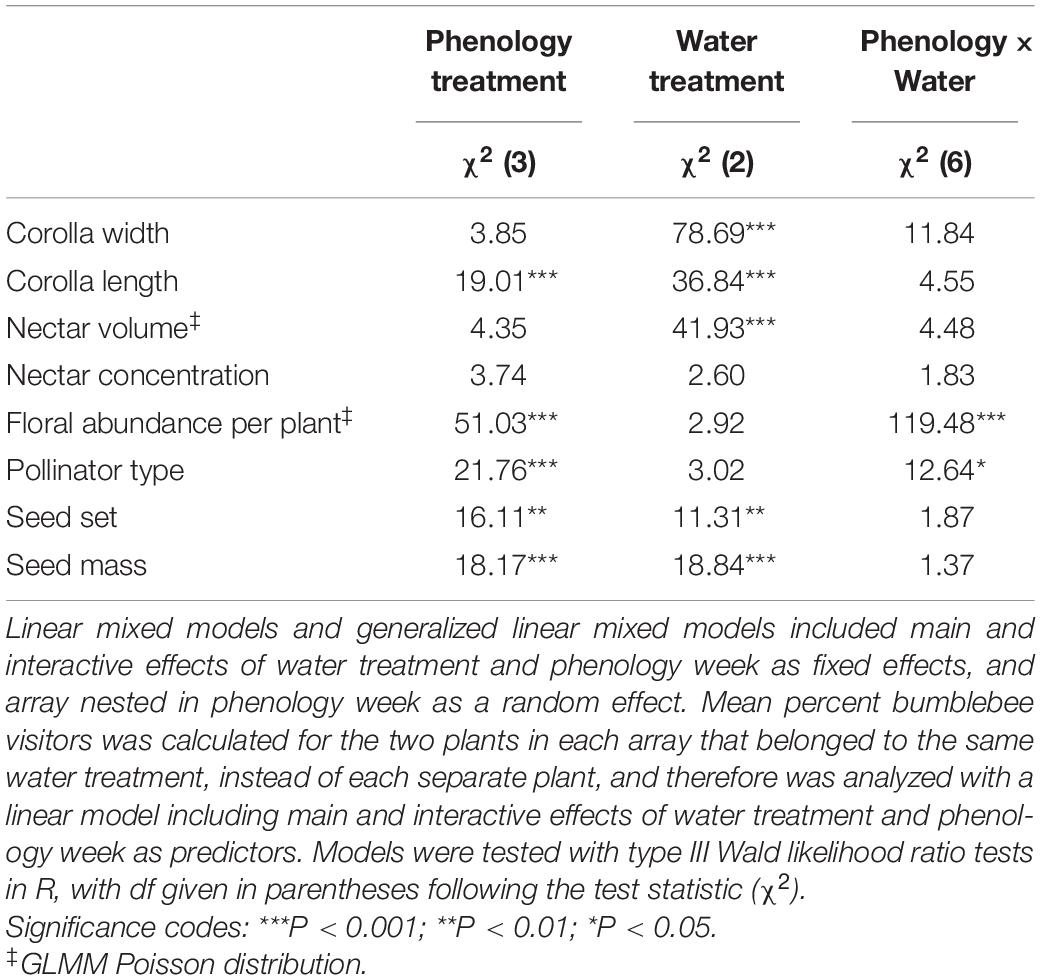
Table 1. Results from analyses testing the effects ofexperimental variation in phenology and water treatments on floraltraits, percent of visitors that were bumblebees (i.e., pollinatortype), seed set, and seed mass.
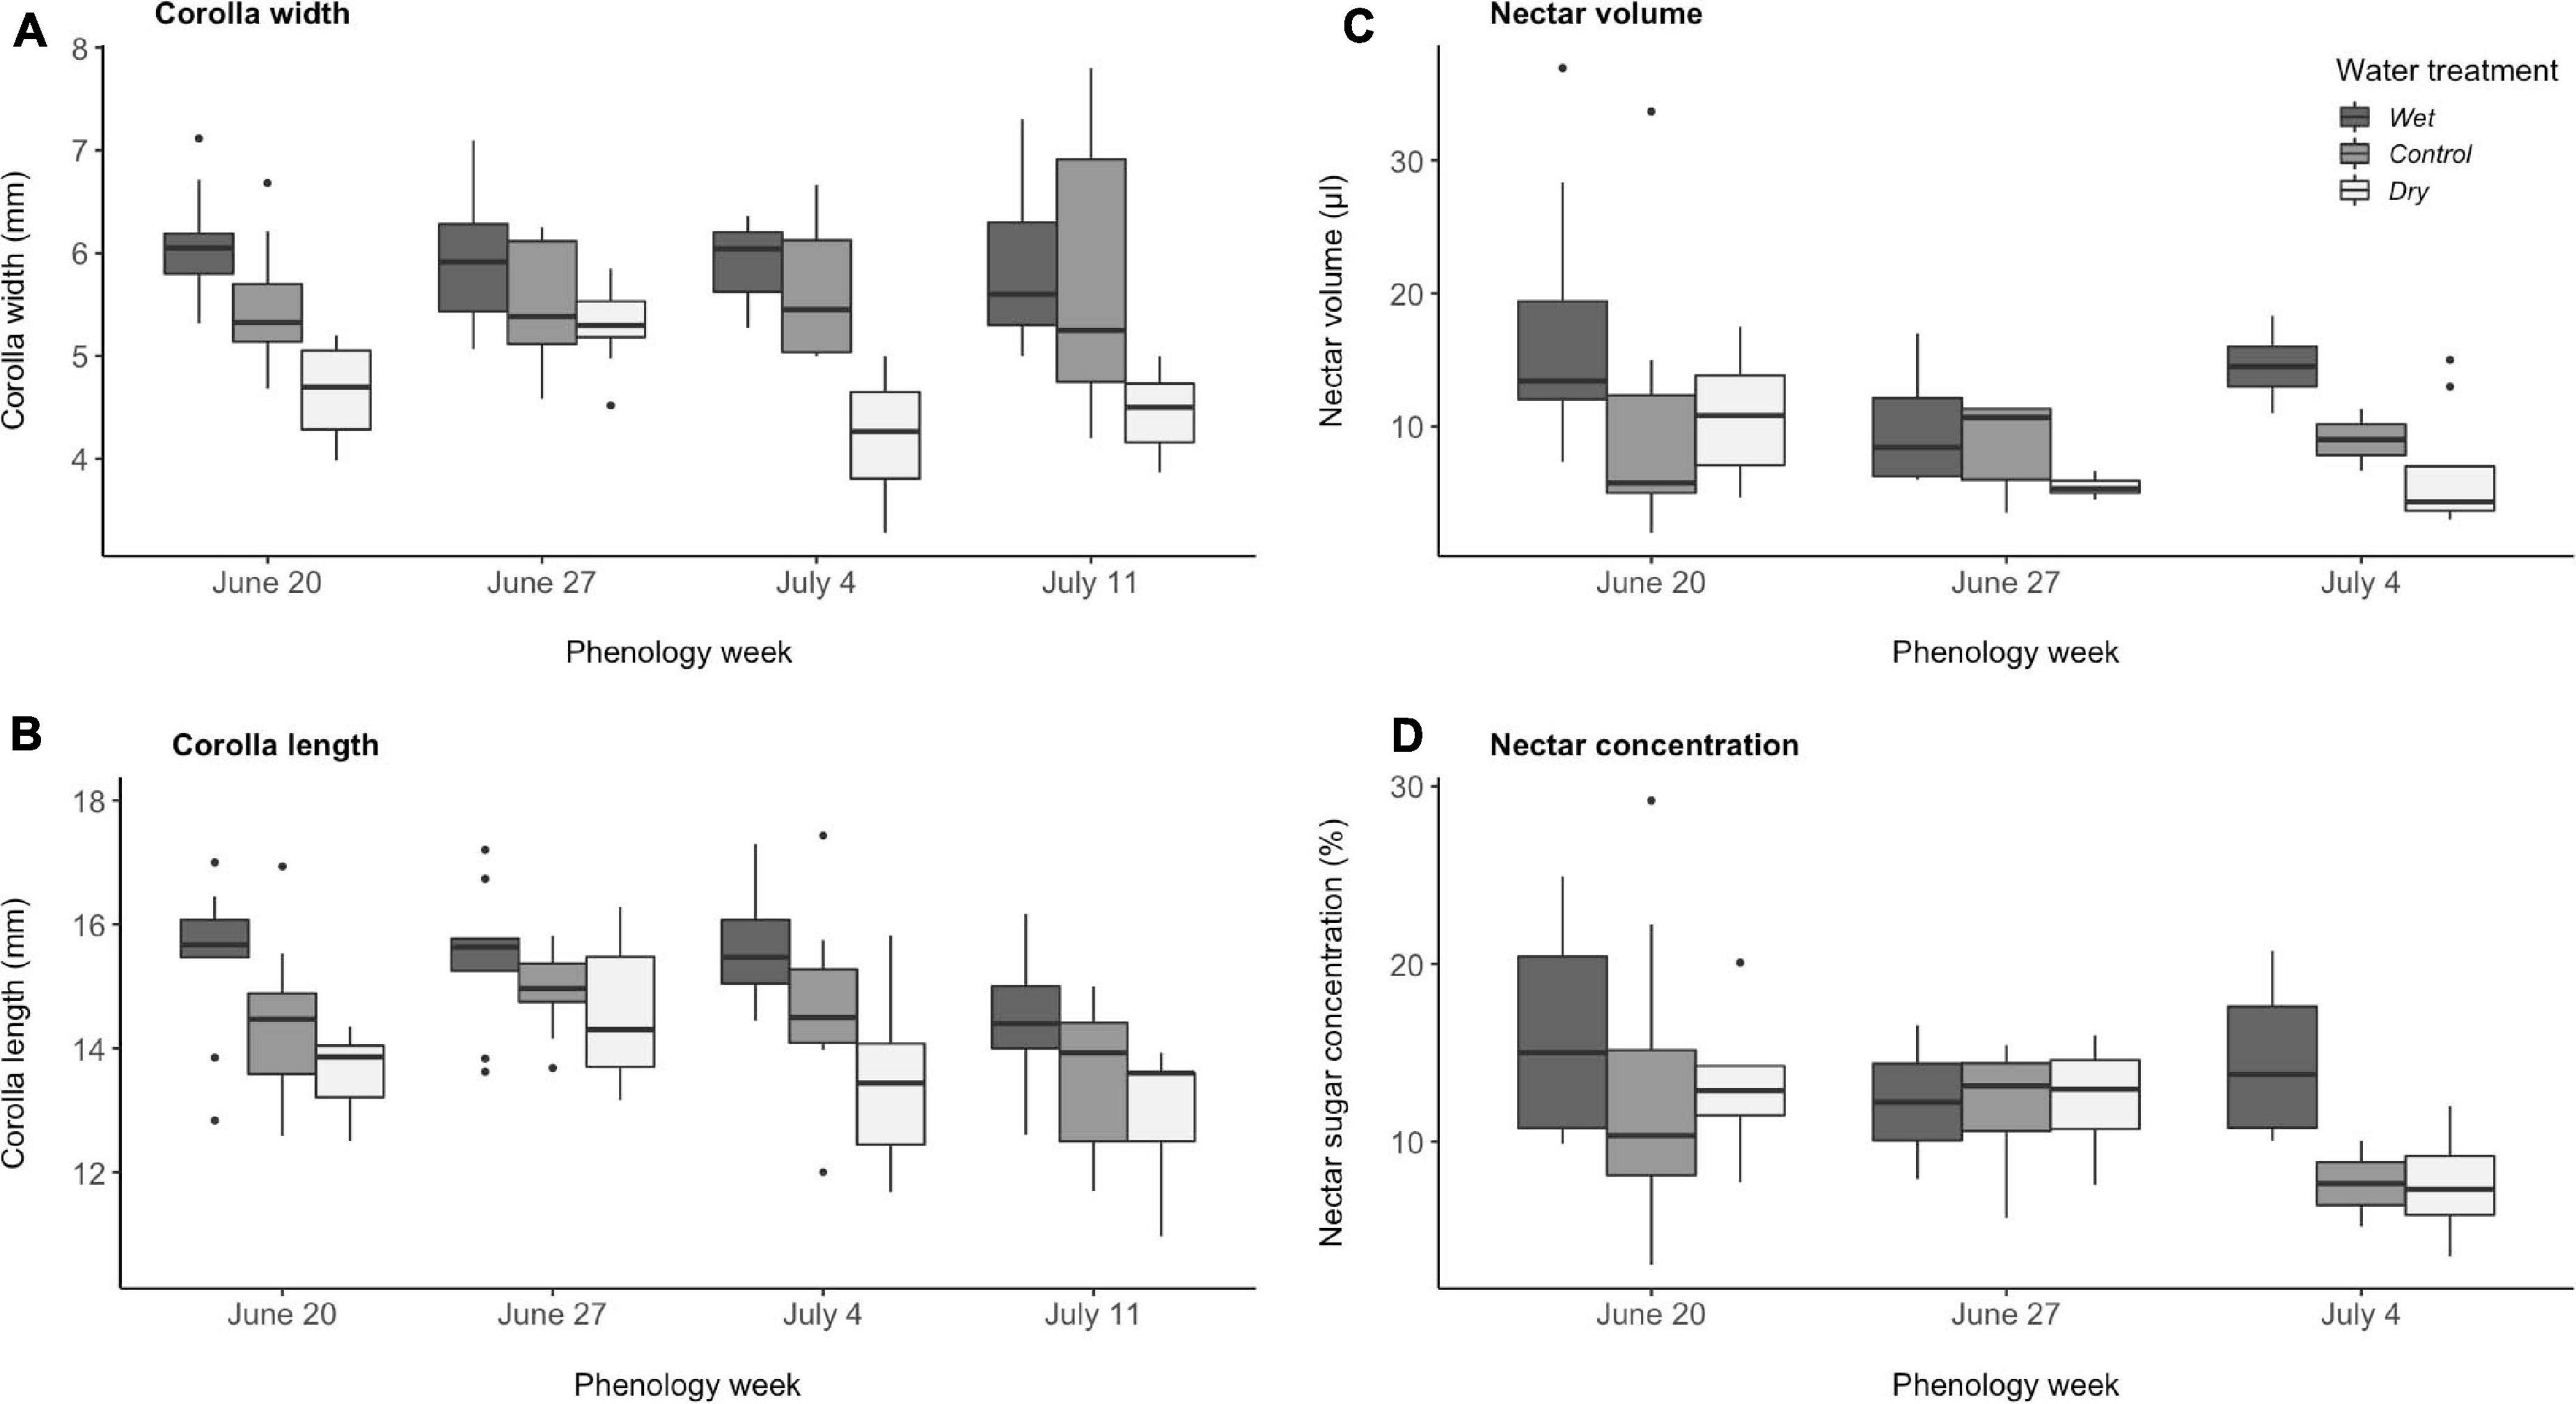
Figure 2. Effects of experimental variation in soil moisture and flowering phenology on (A) corolla width, (B) corolla length, (C) nectar volume, and (D) nectar sugar concentration of Mertensia ciliata. Corolla traits include all four phenology weeks (N = 106), whereas nectar measurements were only collected for three phenology weeks (N = 63). (A–C) Wet differed from control and dry treatments (Tukey pairwise comparison among water treatments, P < 0.05). (B) Week 4 (July 11) differed from the earlier 3 weeks (Tukey pairwise comparison among phenology weeks, P < 0.01). Boxplots follow the same conventions as in Figure 1.
The number of flowers that plants produced (i.e., floral abundance per plant) differed among phenology weeks, and that effect of phenology week differed among water treatments (Figure 3), as illustrated by a significant interaction (P < 0.001, Table 1). Floral abundance peaked in week two, with plants producing an average of 52% more flowers than plants in other weeks. Week four plants produced fewer flowers than those in the other phenology weeks (Tukey pairwise comparison among phenology weeks, P < 0.001, Figure 3). Control plants made 65% more flowers than plants in the dry treatment in week 1, but dry plants made 61% more than control plants in week 4 (Tukey pairwise comparison of water x phenology interaction, P < 0.001, Figure 3).
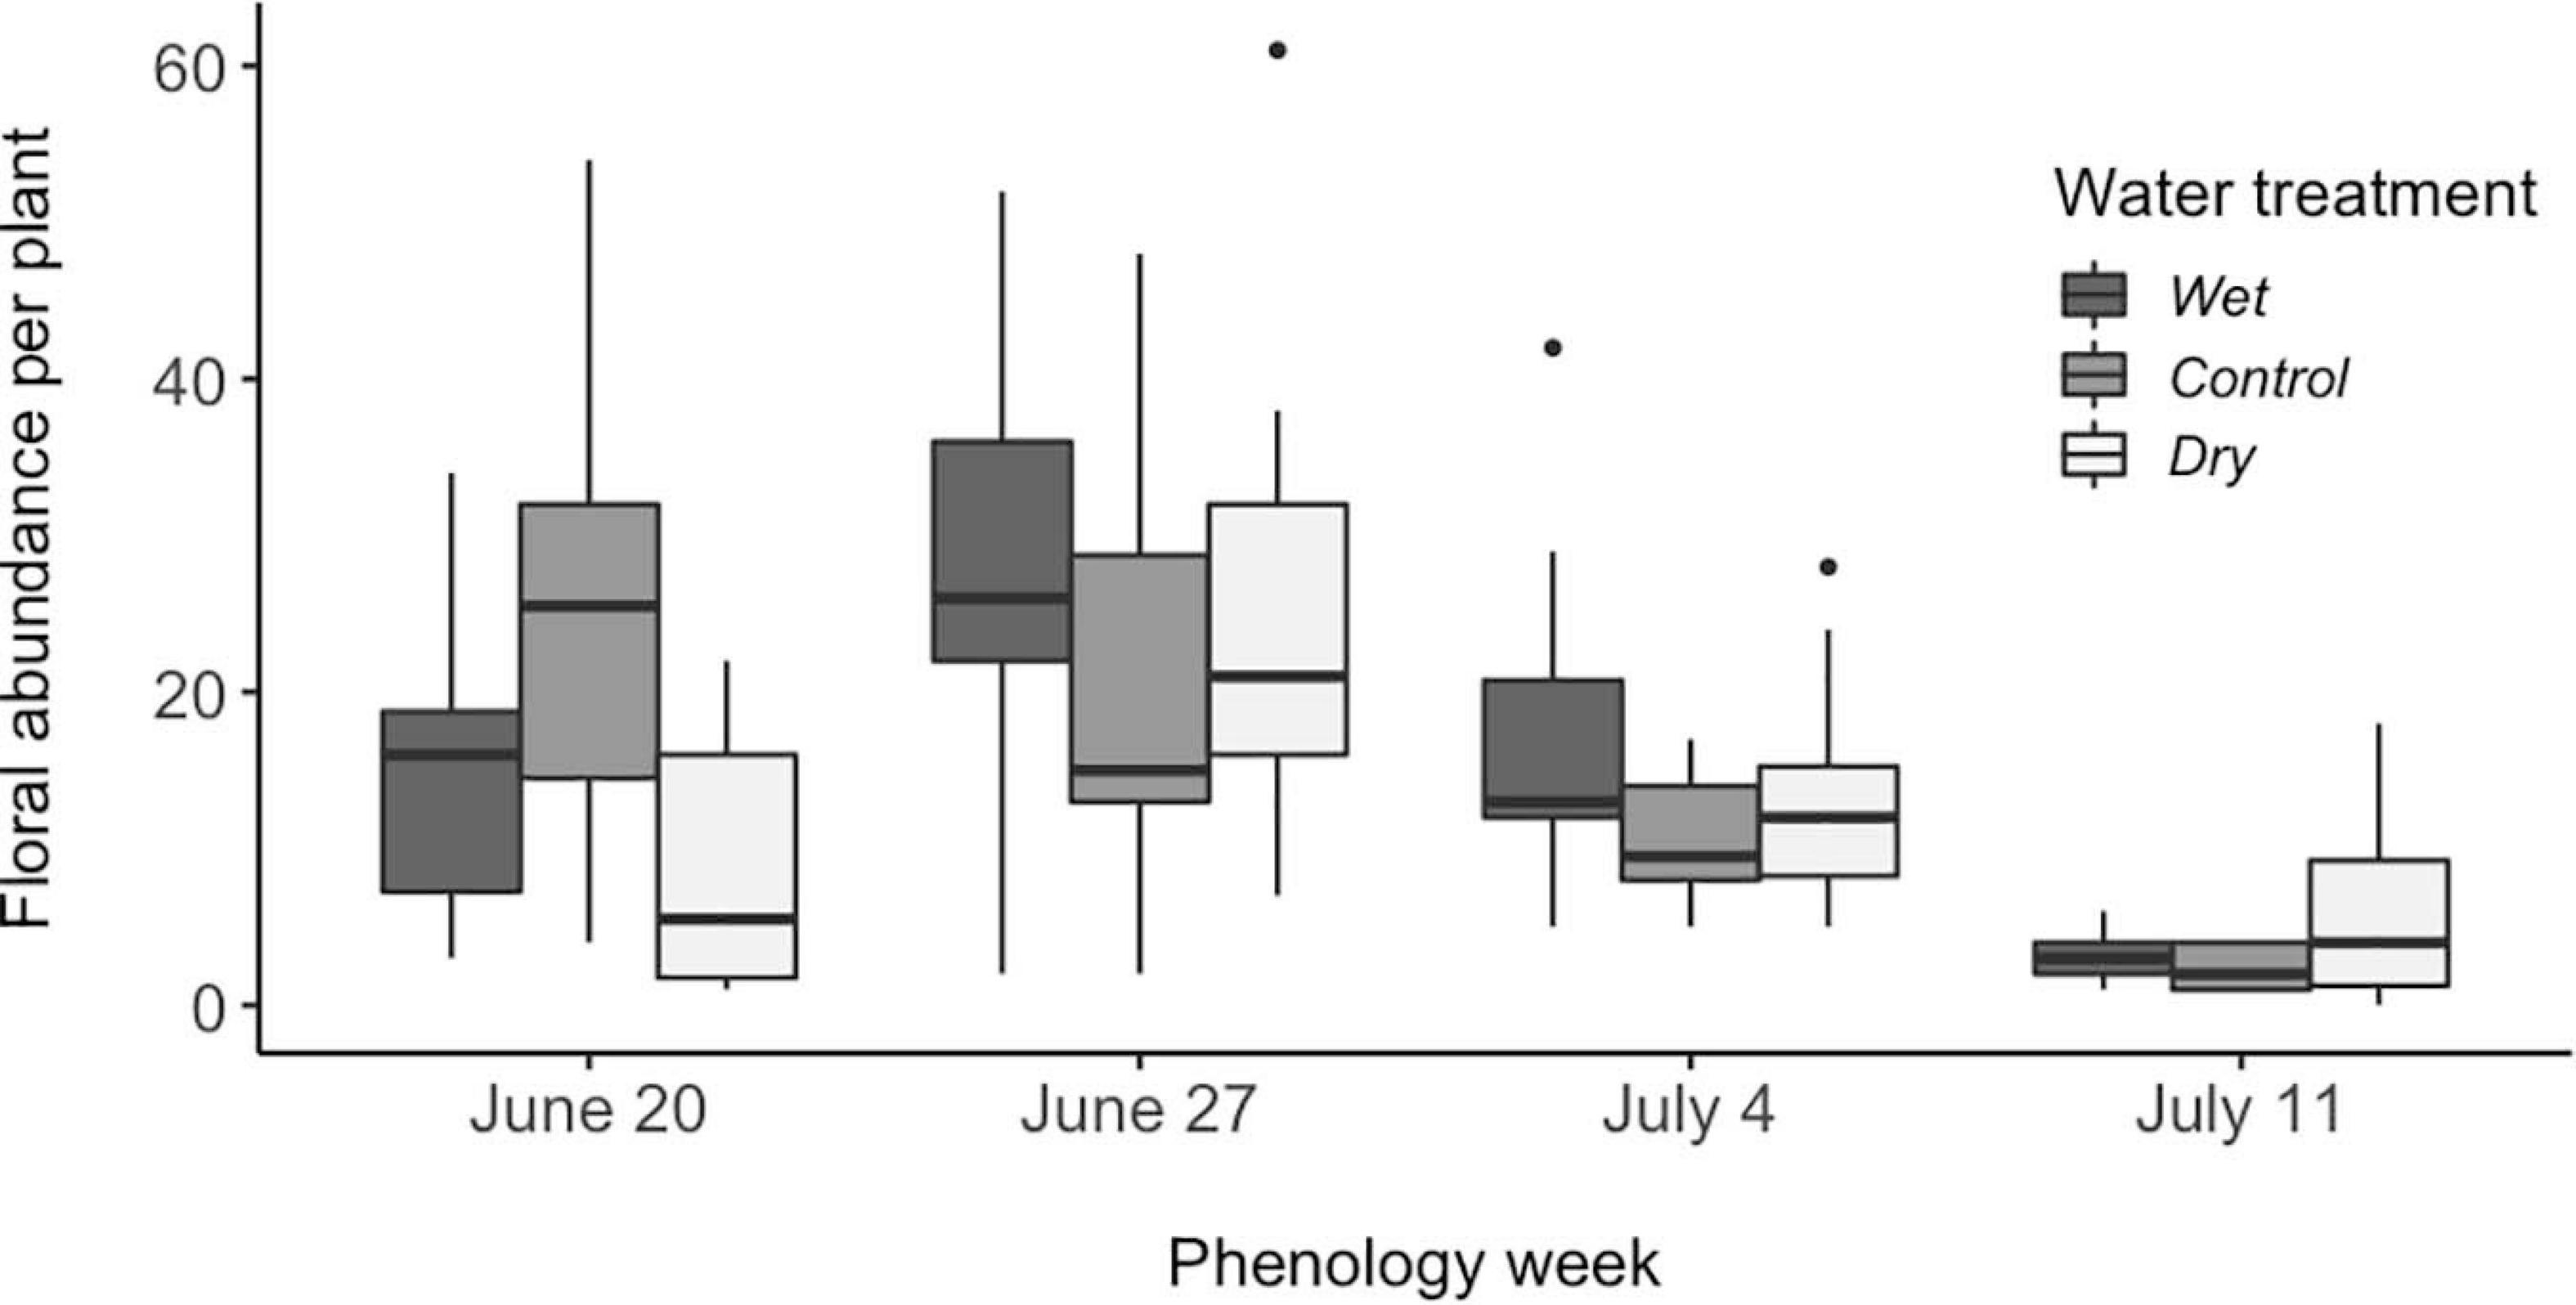
Figure 3. Effects of experimental variation in soil moisture and flowering phenology on Mertensia ciliata floral abundance per plant (N = 114). Week 4 (July 11) differed from the other 3 weeks (Tukey pairwise comparison among phenology weeks, P < 0.001). Significant interaction terms (P < 0.05) were: week 1 vs. week 4 in wet vs. control, as well as control vs. dry treatments; week 1 vs. 2 in dry vs. wet as well as dry vs. control treatments; week 2 vs. 3 in wet vs. control; all treatment combinations in week 2 vs. 4; all treatment combinations in week 3 vs. 4. Boxplots follow the same conventions as in Figure 1.
Effects on Pollinator Visitation
The probability that a plant received a pollinator visit differed among phenology weeks and water treatments, but these effects were approximately additive (Table 2 and Figure 4A). Between week 2 and 4, the likelihood of receiving a visit decreased by an average of 61% among plants in all water treatments (Figure 4A). Across all weeks, plants in the wet treatment were 11% more likely to receive a visit than plants in the other water treatments (Figure 4A). In a separate model that also included floral abundance per array, the probability that a plant received a pollinator visit increased with the number of flowers in the array [F(1, 86) = 5.8, P = 0.02], but in this model, the effects of phenology week and water treatment were no longer significant (P > 0.7). The decline in the probability of receiving a visit after week 2 (Figure 4A) coincided with the decline in floral abundance in the arrays (Figure 1B). These data suggest that pollinators were attracted to arrays based on the overall floral abundance, which differed among phenology weeks [χ2(3) = 29.47, P < 0.0001].
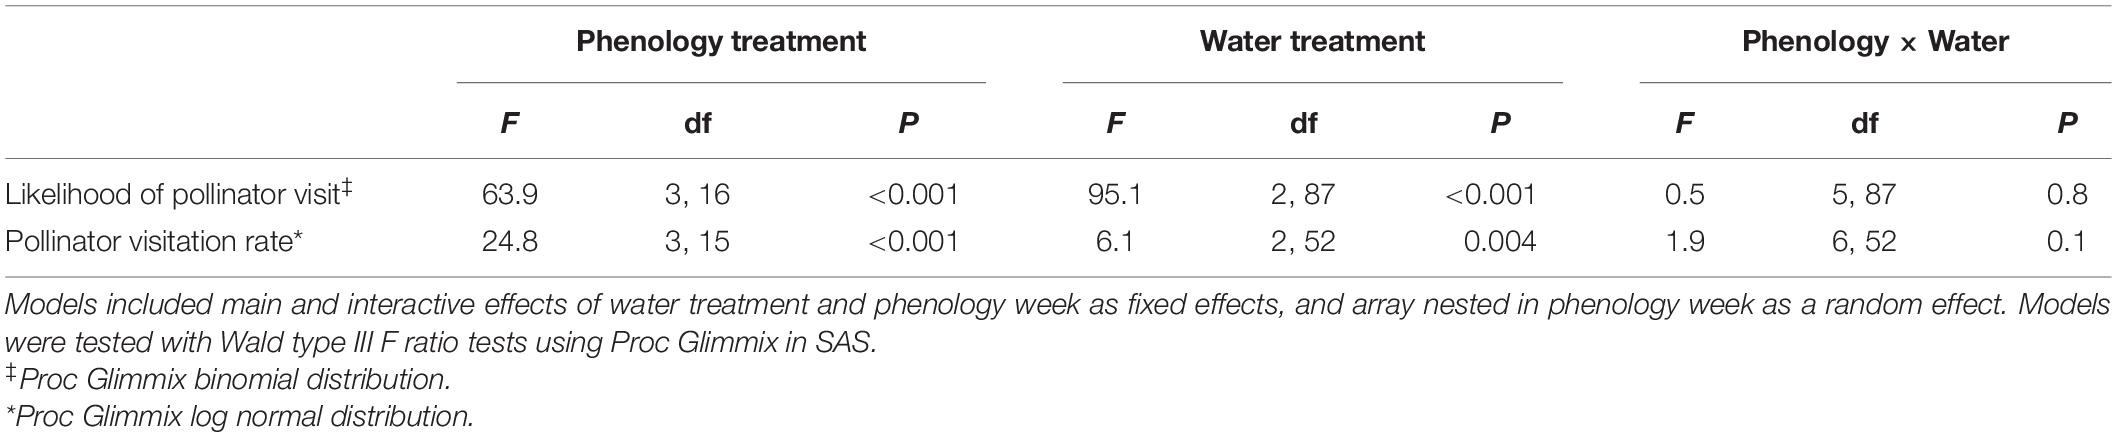
Table 2. Results from analyses testing the effects of experimental variation in phenology and water treatments on the likelihood that a plant received a pollinator visit and the pollinator visitation rate to plants that received at least one visit, calculated as (total number of flowers visited/number of flowers available per hour of observation) averaged across the phenology week.
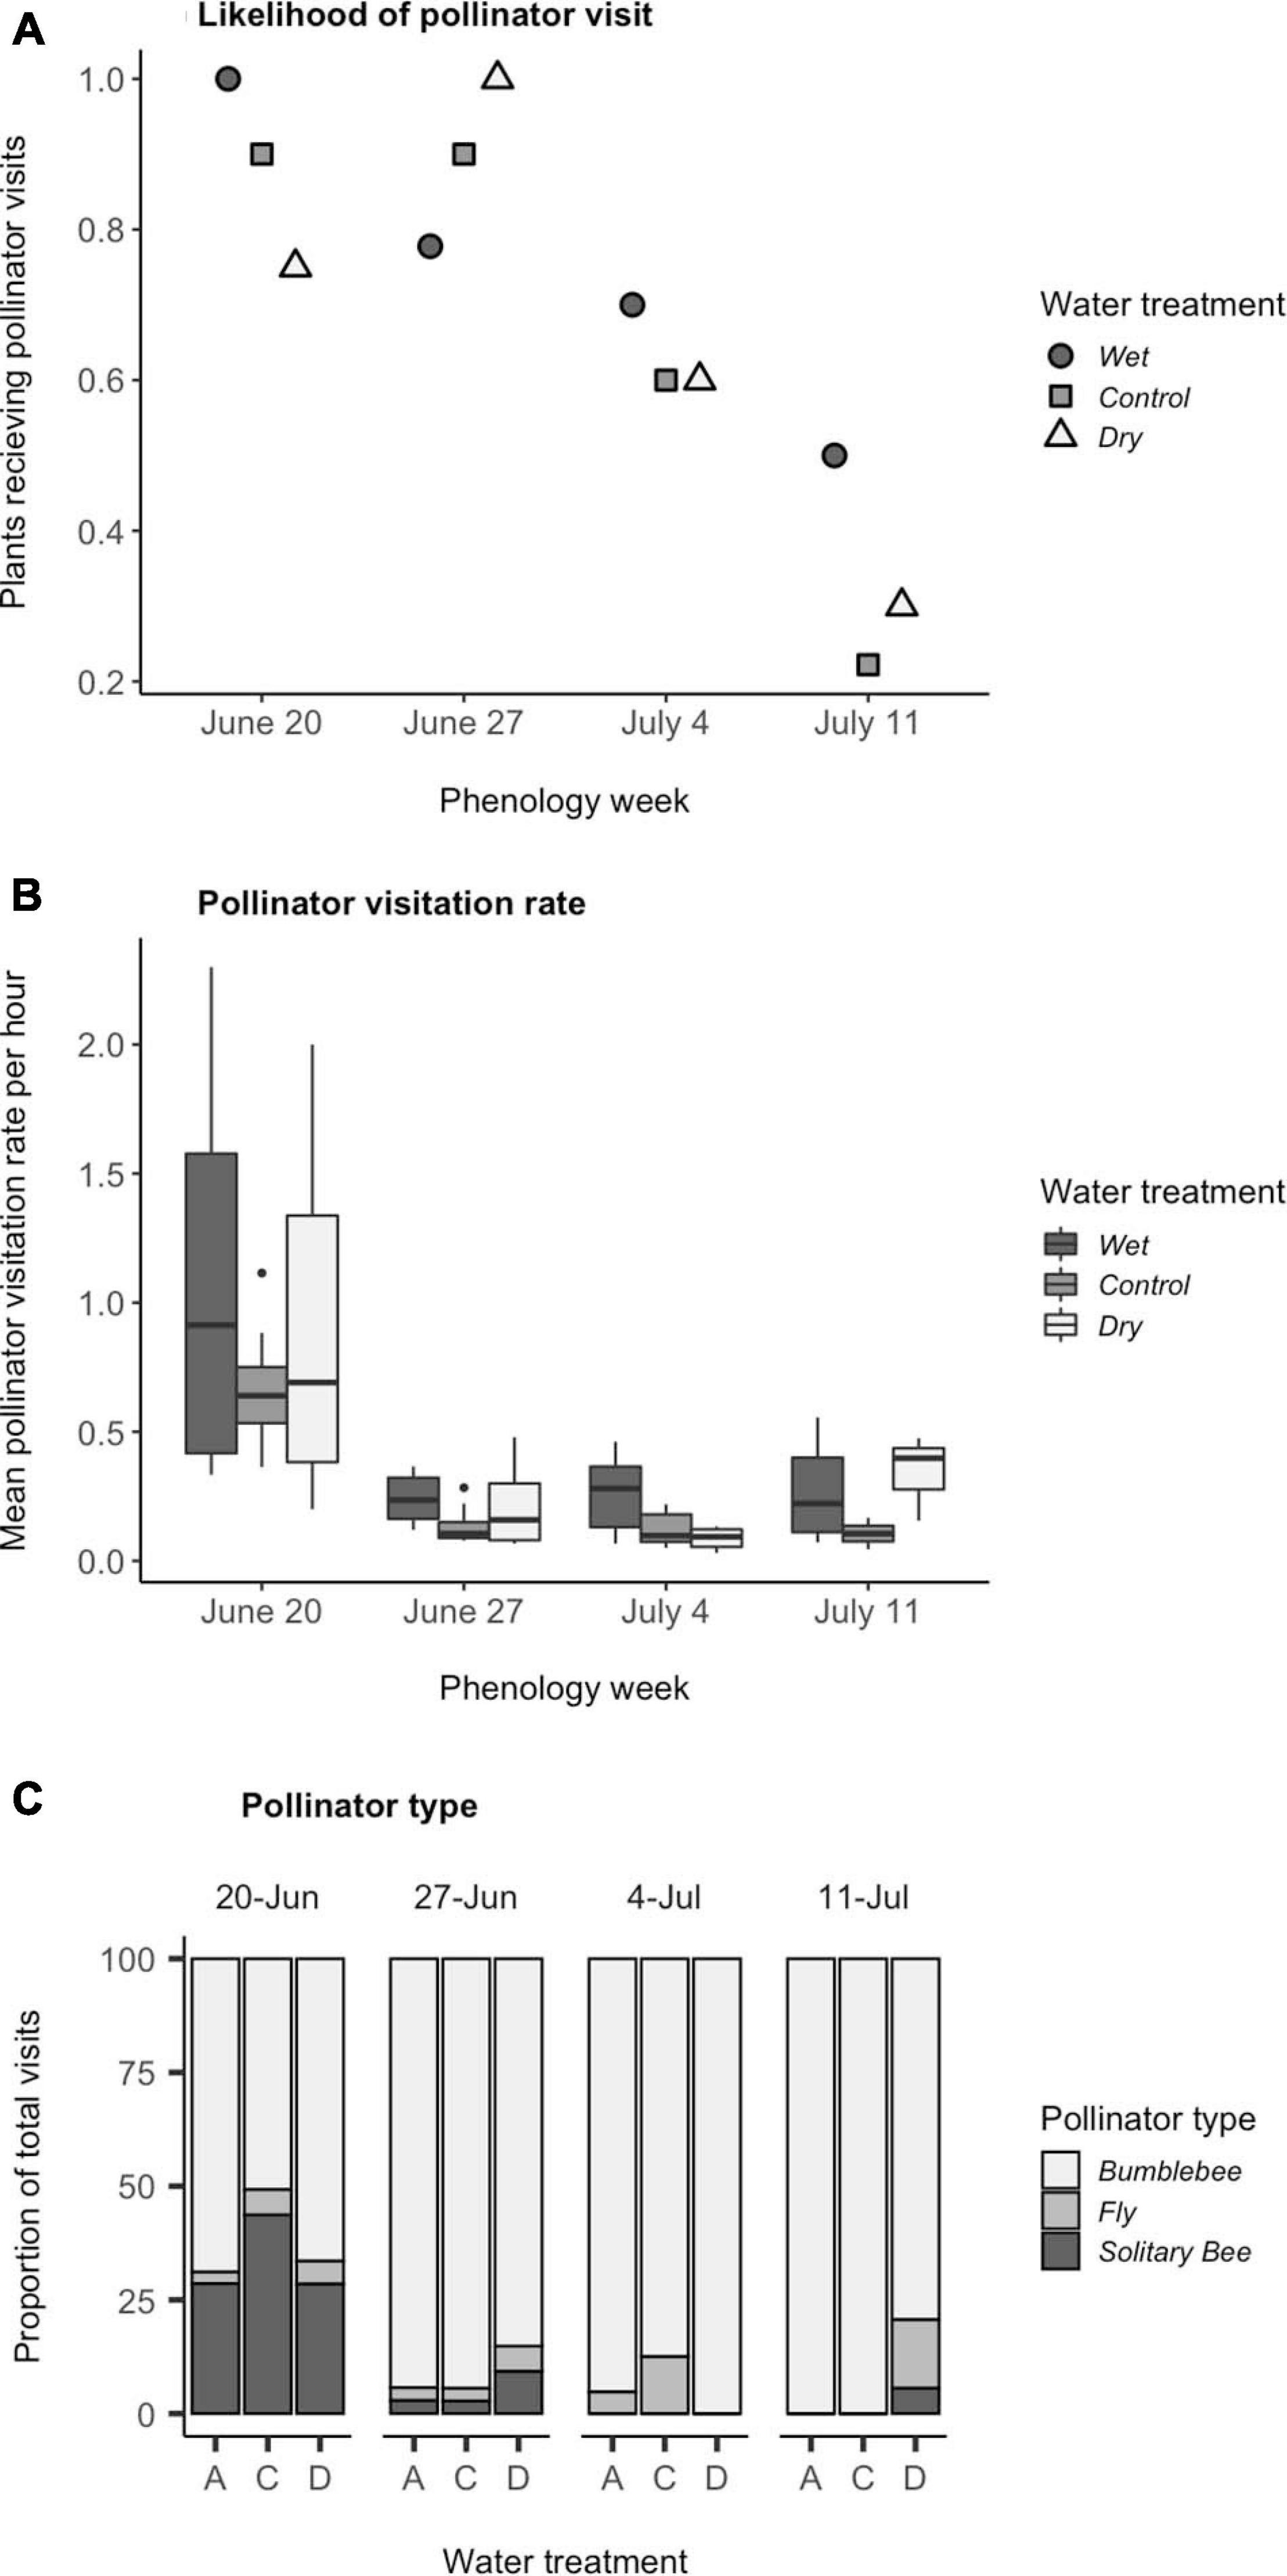
Figure 4. Effects of experimental variation in soil moisture and flowering phenology on visitation. (A) The likelihood that a plant received a pollinator visit. Wet differed from control (Tukey pairwise comparison among water treatments, P < 0.0001). Week 1 differed from weeks 3 and 4 (Tukey pairwise comparison among phenology weeks, P < 0.0001). (B) The mean pollinator visitation rate per plant among plants that received at least one visit, calculated as (total number of flowers visited/number of flowers available per hour of observation) averaged across the phenology week. Wet differed from control (P < 0.010). Week 1 differed from all other weeks (P < 0.001). (C) The percent of total pollinator visits that were comprised of bumblebees, flies, and solitary bees (N = 114). Significant interaction terms (P < 0.05) were: week 1 vs. 2 in control vs. dry treatment, week 1 vs. 2 in wet vs. dry treatment, and week 1 vs. 4 in control vs. dry treatment. Boxplots follow the same conventions as in Figure 1.
Once a pollinator visited a plant in the arrays, floral abundance no longer had a significant influence on pollinator visitation rates [F(1, 52) = 0.96, P = 0.3]. Among those plants that received visits, timing of flowering and water treatment had significant, additive effects on pollinator visitation rates (Table 2 and Figure 4B). Visitation rates decreased by an average of 77% after the first phenology week for plants in all water treatments (Tukey pairwise comparison among phenology weeks, P < 0.001), and remained consistently low until the final week, when dry treatment plants alone experienced a non-significant resurgence in pollinator visits (Table 2). On average across all 4 weeks, plants in the wet treatment were visited at a 40% higher rate than those in the control treatment (Tukey pairwise comparison among water treatments, P < 0.003). Visitation to dry plants had higher variance, which meant that differences in visitation between plants in dry and wet treatments could only be detected in week 3 (Tukey pairwise comparison among water treatments in a given week, P < 0.05).
Water availability and flowering time had a significant interactive effect on the types of pollinator visitors, as measured by percent bumblebees (Table 1). Over the four phenology weeks, the composition of pollinator visitors generally shifted from a diverse array of solitary bees, flies and bumblebees to 100% bumblebees among all water treatments, except for dry plants which received a resurgence of visits by flies and solitary bees in week four and to a lesser extent in week 2 (Table 1 and Figure 4C). We separated contributions to the interaction by re-running the model with a single fixed factor with 12 levels corresponding to the combinations of weeks and water availability, and using the contrast statement in Proc Genmod to specify individual contrasts. Differences between week 1 and week 2 and 4 were smaller for the dry treatment than for the other treatments (P < 0.05; details in legend to Figure 4C). The percent of pollinator visitors that were bumblebees was not significantly influenced by the number of flowers available in the array (χ2 = 1.01, P = 0.3).
Effects on Seed Set
In a model with fixed factors of flowering phenology and water availability and a random effect of array, both fixed factors influenced M. ciliata reproductive success, however, there was no significant interaction between the two factors for either seed set or seed mass (Table 1). Flowering phenology affected both the number of seeds produced per flower as well as seed mass (Table 1). Over 4 weeks, seed set decreased by an average of 15% (Figure 5A). While this decline in seed set coincided with the decline in pollinator visitation rate (Figure 4B), the relationship of seed set to visitation rate was not significant (χ2 = 3.14, P = 0.08). Seeds from week 4 plants were 0.54 ± 0.09 mg heavier those produced by plants in the previous 2 weeks (Tukey pairwise comparison among phenology weeks, P < 0.05, Figure 5B). Water availability had a significant, positive effect on both metrics of Mertensia ciliata reproductive success (Table 1). Plants in the wet treatment produced an average of 40% more seeds per flower, which were an average of 0.74 ± 0.02 mg heavier than seeds produced by plants in the dry treatment (Tukey pairwise comparison among water treatments, P < 0.001, Figure 5).
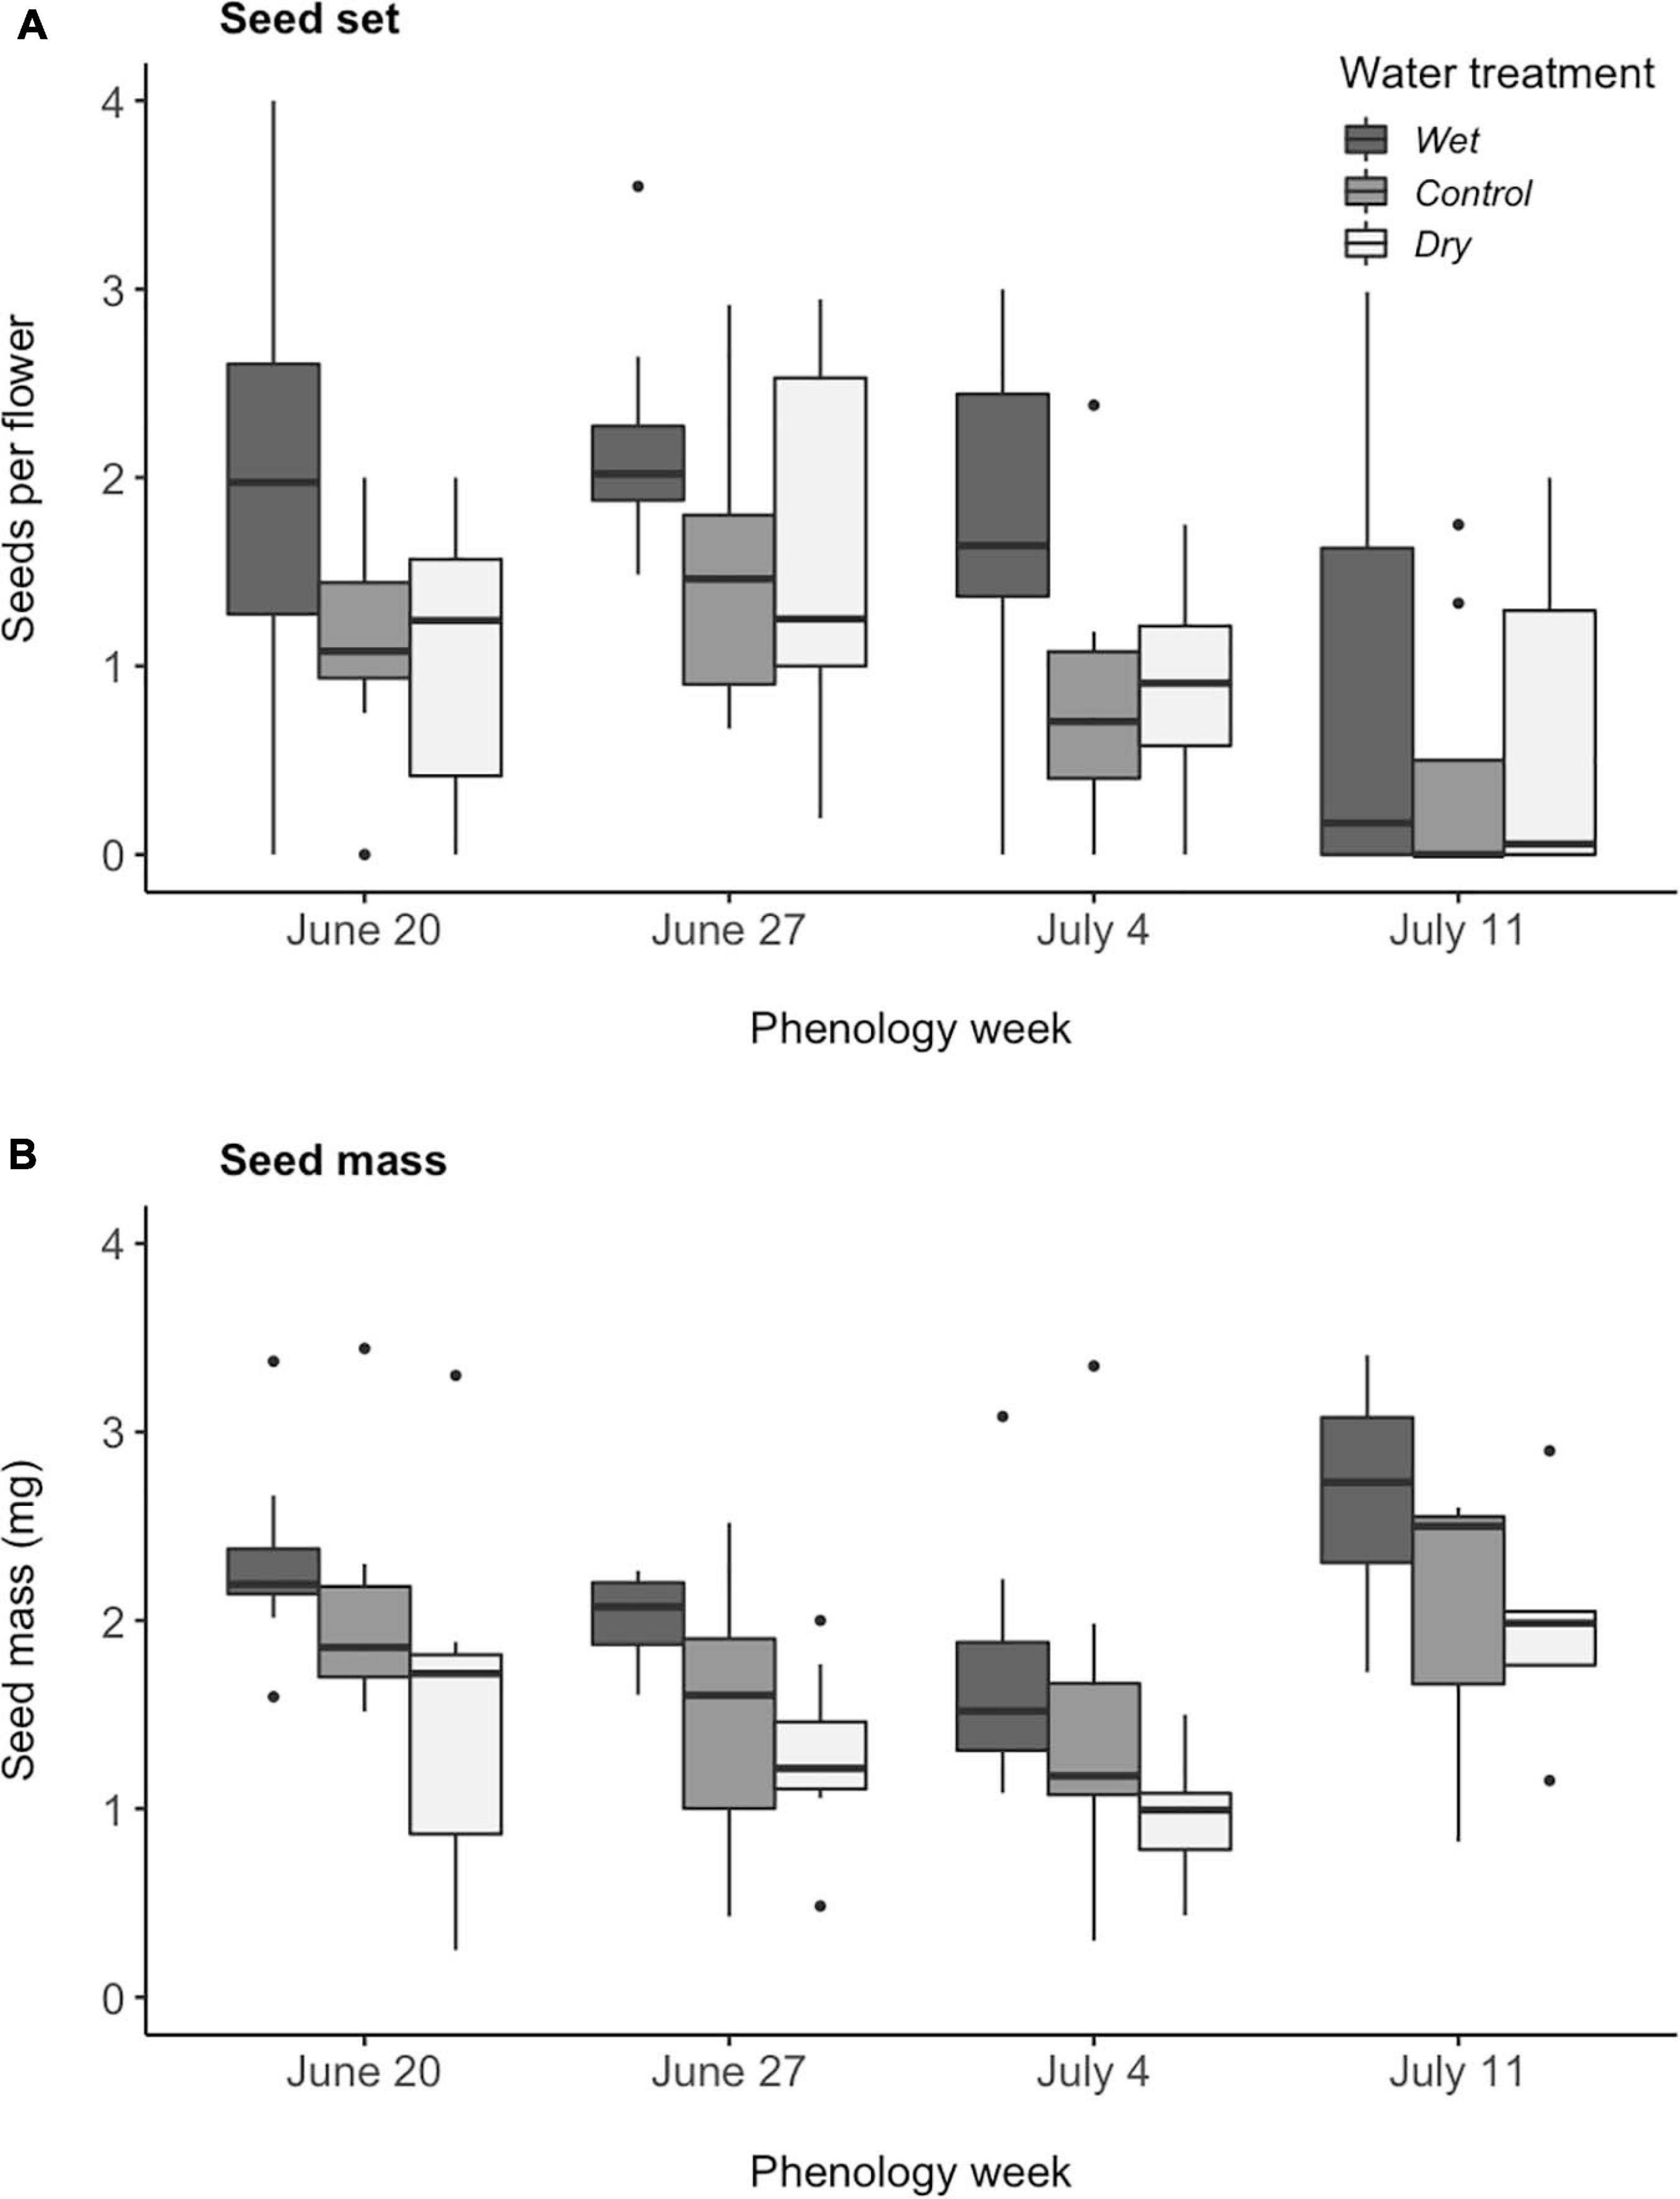
Figure 5. Effects of experimental variation in soil moisture and flowering phenology on (A) seeds set per flower, calculated as (number of mature seeds/number of flowers), and (B) seed mass, calculated as (mass of collected seeds/number of collected seeds) (N = 114). (A,B) Wet differed from control and dry treatments (Tukey pairwise comparison among water treatments, P < 0.005). (A) Week 4 (July 11) differed from the first 2 weeks (June 20 and 27) (Tukey pairwise comparison among phenology weeks, P < 0.05). Boxplots follow the same conventions as in Figure 1.
Discussion
Changes in flowering phenology and water availability for plants are two likely co-occurring responses to anthropogenic global change, but have been rarely, if ever, manipulated together. By manipulating flowering onset and water availability in factorial combination for the same subalpine plant species, we generated two major results. First, whereas flowering onset had a stronger impact on pollinator visitation than did water availability, the reverse was true for seed production and seed mass in this system. Second, these two factors had additive impacts on major fitness components such as seed production, even though an interaction was observed for composition of floral visitors. One caveat is that our manipulation of phenology focused on a specific aspect, the timing of onset of blooming, and we measured visitation only during the first week of bloom for each plant. It is possible that other aspects of flowering phenology would have impacts different from those observed here.
Comparative Impacts of Phenology and Water Availability on Pollinator Visitation
By manipulating both factors together, we found that flowering onset time had a stronger average effect on pollinator visitation, while water availability more strongly affected seed production. The impact on both the probability of a plant receiving a visit and the per-flower visitation rate was greater for the manipulation of flowering onset, even though increased water availability had strong effects on floral traits. This result suggests that the frequently observed impacts of water availability on floral traits might not always translate into substantial effects on pollinator visitation. In the few other systems that have investigated this question, drought reduced pollinator visitation in three of five species (Burkle and Runyon, 2016; Glenny et al., 2018; Rering et al., 2020).
In M. ciliata the likelihood that a plant would receive a pollinator visit declined over the course of 4 weeks and was influenced by the July decline in the number of flowers per plant, as also seen in our previous work (Gallagher and Campbell, 2020). This positive relationship between the density and diversity of floral resources and flower visitor activity is common (Rathcke, 1983; Ghazoul, 2006; Hegland and Boeke, 2006; Feldman, 2008). The decline in visits, however, also coincided with an increase in floral abundance and diversity throughout the surrounding plant community (Gallagher and Campbell, 2020). Although Mertensia ciliata is a summer-blooming subalpine perennial, at our study site, its onset of flowering begins about a week earlier than most other summer-blooming species (Gallagher and Campbell, 2020). It is possible that M. ciliata receives more frequent pollinator visits early in the season, because it is one of the few floral resources available at that time. As floral abundance increases in the entire community, pollinators may become more selective when visiting different plant species (Schmitt, 1983; Lázaro et al., 2013), which may account not only for the decline in the number of plants in our arrays that received visits, but also the change in visitation rates and assemblages of pollinators once they were in the arrays. Among plants that received at least one visit, pollinator visitation rates also declined greatly over the course of the flowering season, although this change in per flower visit rate was not influenced by the number of flowers in the array. Water-mediated changes in pollinator visitation were not only less pronounced than those due to flowering onset, they also coincided with simultaneous changes in individual floral traits, including corolla width and nectar production. In an earlier study in this system, pollinator visitation peaked at an intermediate value for both corolla length and corolla width at the site most similar in elevation to the current one (Gallagher and Campbell, 2017).
Comparative Effects of Phenology and Water on Seed Set and Mass
In contrast to pollinator visitation, both seed set and seed mass were more strongly affected by water availability than by flowering time. Seed set declined over the 4 weeks, with fewer, heavier seeds in week 4 compared to all other weeks. This decline in seed set over the 4 weeks was not well explained by the coincident decrease in pollinator visitation rate, however. In fact, plants in the wet treatment made significantly more seeds than dry plants, even in week 4 when dry plants received more visits than wet plants. Examinations of pollen receipt from single visits to virgin flowers revealed that flowers likely require very few visits to receive enough pollen to develop all four ovules in each M. ciliata flower (Gallagher and Campbell, 2020). In a previous study of this system, seed set depended on pollinator visitation only when those rates were low, with seed set leveling off strongly at higher visitation levels (Gallagher and Campbell, 2017). Plants in the current study experienced higher pollinator visitation rates than those in our previous study, which may explain why we did not detect an effect of pollinator visitation on seed set. We maintained similar soil moisture levels across treatments in both experiments, which resulted in similar effects on floral attractants. The differences in pollinator visitation rates among years, therefore, can likely be attributed to natural variation in pollinator availability across years and sites.
Another potential explanation for the decrease in seed set over the 4 weeks is differences in pollinator effectiveness, that is the capacity of different pollinators to deposit sufficient, compatible pollen on the stigmas of flowers (Ne’eman et al., 2010). Single-visit pollinator effectiveness studies revealed differences in the amount of pollen deposited and seed set among the various pollinator taxa that visit M. ciliata. Bumblebee and solitary bee visitors contribute more per visit to the reproductive success of plants, than do flies (Gallagher and Campbell, 2020). Differences in effectiveness cannot however, explain why seed set of wet plants was higher than for dry plants in week 1, as the proportion of total visits by bumblebees, solitary bees, and flies for plants in wet and dry treatments were nearly equal (Figure 4C). This pattern further supports the hypothesis that water availability, and not pollinator visitation or composition, has a larger effect on seed set in M. ciliata.
It is possible that changes in water availability may have an outsized effect on seed set in this system because plants are not highly pollen-limited. In systems where plants are more pollen-limited, and the majority of tested plant species show some pollen-limitation (Knight et al., 2005), changes in pollinator visitation and pollinator effectiveness can have substantial effects on seed set. For example, experimental shifts in flowering phenology of the spring-blooming, subalpine herb, Claytonia lanceolata, altered both the assemblage and visitation rates of pollinators with the result that late-flowering plants experienced higher levels of pollen-limitation and lower seed set (Gezon et al., 2016). Thus, the potential for changes in flowering phenology to affect seed set may increase in systems that are more pollen limited.
Not only seed set but also seed mass was enhanced by increasing water availability. Seed mass included the elaiosome in our study, and although ant-dispersal of seeds has not been studied in M. ciliata, the ant Formica sp. removes seeds from its congener M. fusiformis in similar locales (Turnbull et al., 1983). In some other species with elaiosomes, the chance that ants remove seeds for dispersal is greater for larger seeds (Mark and Olesen, 1996). These observations suggest the hypothesis that drought associated with climate change may reduce the chance of seed dispersal for M. ciliata. To test that hypothesis and others about combined effects of pollination and water availability on plant reproductive success, we need more studies of impacts on the whole pathway from floral traits to pollinator visitation to seed production to seed dispersal and seedling establishment.
Interactions Between Flowering Time and Water Availability
In this system, effects of phenology and water availability on total pollinator visitation were additive, but the percent of visitors that were bumblebees did show an interaction. Plants in the dry treatment experienced a resurgence in relative visitation by small insects late in the season (week 4) while plants in other water treatments received visits during week 4 only by bumblebees. This resurgence in visits by small insects was unexpected, as in a previous study of phenology in which water was not manipulated, such late-blooming plants had only been visited by worker bumblebees (Gallagher and Campbell, 2017). Flowers declined monotonically in corolla length over the season, suggesting that a generalist plant, like M. ciliata, may be able to attract pollinators of different taxa or castes, both when flowers are small or large.
Despite the interaction in effects on visitor assemblage, we saw no interaction in the effects of phenology and water availability on either total pollinator visitation or seed set. We had predicted that water availability would have less effect on pollinator visitation for plants that bloom early in the season when a diverse array of pollinators are available, whereas later in the season when visits are dominated by worker bumblebees, water-mediated changes in floral traits would have a stronger effect on pollinator visitation rate. Instead, dry plants with short corollas proved unexpectedly attractive to small insects at the end of the season, so that their visitation was relatively high, just as it had been early in the season, compared to well-watered plants that were visited only by bumblebees. Regardless of the interactive effect on visitor assemblage, we detected no interaction in the effect on total visitation. The weak or non-existent interactions on seed set and seed mass further suggest that impacts of climate change on plant reproduction may often be predictable through separate studies of flowering time and water availability. At the same time, both phenology and direct effects of abiotic factors are potentially critical factors in climate change, and so neither should be assumed more important to pollination-mediated changes in reproduction. Since we didn’t detect an interaction on seed set, it is worth considering the potential for situations where such an interaction might occur. One example would be in a generalized pollinator system in which pollinator type changes systematically across the season, such that one pollinator type is available only early in the season and a different one, with different responses to water-mediated floral traits, is available only late. In many cases, different pollinators of the same plant species differ in visitation responses to flower size, as seen for bees vs. flies (Galen et al., 1987; Strauss et al., 1996), and bees vs. butterflies and moths (Thompson, 2001), making this mechanism plausible although not yet demonstrated. Another potential mechanism is a change in the flowering or pollinator community over the season, causing a pollinator to change its preference for large vs. small flowers seasonally. Seasonal changes in competition with other pollinators can influence a bumblebee’s use of plant species (Shibata and Kudo, 2020). Whether that extends to changes in trait preferences within a natural plant population is unknown, but competition with other pollinators sometimes affects trait preferences of hummingbirds (Temeles et al., 2016). Finally, the extent of pollen limitation could vary between plants that bloom early vs. those that bloom late (Campbell, 1985; Gezon et al., 2016), potentially altering the response of seed production to water availability.
Interactive effects on plant-animal interactions between any two factors likely to change with climate change are not often studied. We are unaware of other such studies involving plant phenology and water, and results are mixed for combinations of other factors. Herbivory and warming had non-additive effects on seed mass of Oenothera biennis (Lemoine et al., 2017), as did herbivory and drought for yield in Vicia minor (Raderschall et al., 2020) while having only additive effects on seed production in Centaurea stoeba (Ortega et al., 2012). To consider joint effects of multiple species interactions, such as pollination and seed dispersal, it will be especially important to consider multiple aspects of environmental change because each species interaction could be more responsive to a different abiotic factor.
Implications for Climate Change
Pollinator responses to both phenology and water availability are likely to differ depending on the magnitude of changes in those factors. We manipulated both factors within a realistic range of natural variation over the past few decades, but future climate change will likely eventually push conditions outside of the historical envelope. Furthermore, climate change will likely impact other plant species and pollinators in ways that we did not manipulate in this study. Nevertheless, we can make an estimate of how flowering onset and water availability to M. ciliatia in the absence of other impacts might affect pollinator visitation under near-term climate change. Note that we are not here attempting to predict the integrated effects of climate change, which could also depend on other factors such as change in phenologies of other plant species. Furthermore, we are assuming that pollinators would respond to changes to conditions for M. ciliata over a wide spatial range in the same way that they responded to a small set of potted plants near a larger unmanipulated population. That assumption may not hold, as the Bombus spp. and Osmia spp. that were common pollinators typically forage over a range of nearly a km (Greenleaf et al., 2007). In that simplified scenario with an absence of changes in pollinators, the difference between week 2 control plants and week 1 dry plants in our experiment would approximate the expected effect of two decades of climate change, for the following reasons. Week 2 corresponds approximately with the current peak flowering time (Gallagher and Campbell, 2020). Since the onset of first bloom for M. ciliata has advanced by 3.3 days per decade over the past three decades (Miller-Rushing and Inouye, 2009), week 1 corresponds to expected peak blooming in two decades. At the same time, climate projections for the Colorado River headlands, which includes this location, indicate that surface water will decline by 0 to 0.1 mm/day per decade in the near future (Seager et al., 2012), which is comparable over two decades to the difference of 0.175 mm/day between our dry and control treatments. Climate change over two decades may then approximate the shift from week 2 control plants to week 1 dry plants, implying a short-term increase in the probability of receiving a pollinator visit and rate of pollinator visitation and little change in either seed set or seed mass, in the absence of changes in other factors.
For a summer-blooming, generalist perennial, like M. ciliata, there may be a significant benefit to flowering early in terms of pollination success, but an increased risk that reproductive success may be affected by changes in water availability, depending on the severity of the drought. Spring-blooming plants can face a similar trade-off when flowering early, between increased pollinator visitation and an increased risk of exposure to late spring storms or frost events (Inouye, 2008; Gezon et al., 2016). With further climate change and earlier snowmelt, not only would M. ciliata plants flower earlier (Miller-Rushing and Inouye, 2009), but those early-flowering plants may be more likely to have shorter, smaller corollas with less nectar due to lower water availability in the soil prior to mid-summer thundershowers (Blankinship et al., 2014).
The impact of climate change will ultimately depend on how it influences other species that interact with M. ciliata. We only manipulated conditions for the focal plant species in our study and not for other plant species in the community, nor for the pollinators. In our study, pollinators had the option to visit flowers of other species that were not water limited. But if the entire region were to undergo early snowmelt or drought, floral traits throughout the community might be affected, which may drive pollinators to make different choices about which plant species to visit. Of the 10 other plant species reported to overlap in blooming time and share pollinators with M. ciliata at our study site (Gallagher and Campbell, 2020), four species are expected to move toward more overlap in flowering time with M. ciliata over the short-term and six species toward less overlap (Supplementary Table S1). Because of this mixed response, and because little is known about the potential for competition for pollination with M. ciliata, it is difficult to predict how changes in community phenology would alter visitation to M. ciliata. More studies of community-wide manipulation of climatic factors would be very informative. In one rare community-wide manipulation of water in mesocosms, plant species richness was altered, and pollinators visited both flooded and dry mesocosms less often than intermediate ones (Walter, 2020).
Climate change can also influence abundance or phenology of the insect pollinator populations themselves in this locality, in part due to indirect effects of floral resource phenology (Ogilvie et al., 2017), and climate-induced changes in insect populations were not included in our manipulations. Comparisons of bee phenology across time in this locality suggest that emergence of solitary bees is advancing by 4.9 days per decade (Stemkovski et al., 2020), which may be faster than that of M. ciliata. Syrphid fly emergence responds to date of snowmelt, making earlier emergence likely in the future even though it has not yet been demonstrated (Iler et al., 2013). On the other hand, timing of bumblebees has not shifted appreciably (Pyke et al., 2016). Given that most visits to M. ciliata are by bumblebees, with solitary bees common only early in the season, our manipulation of phenology for the plant but not its pollinators likely captured the main essence of how the phenological relationship will be disrupted under climate change.
Conclusion
Climate change may affect plant-pollinator interactions through a variety of mechanisms, including direct effects of precipitation patterns, temperature, and CO2 levels, as well as indirect effects of those abiotic factors on phenology (Hoover et al., 2012; Gornish and Tylianakis, 2013; Forrest, 2015). Here we considered the simultaneous effects that two of these, potentially co-occurring mechanisms have on the pollination and seed set of a subalpine wildflower. We found that changes in water availability interacted with differences in flowering time in their effects on pollinator taxonomic composition, but their effects on pollinator visitation and seed set were additive. Moreover, in our system, the strength of these two mechanisms differed, with phenological shifts having a greater effect on the likelihood and frequency of pollinator visits and water availability having a greater effect on seed set and seed mass. This study illustrates the necessity of examining the relative strength and potential interactive effects of co-occurring mechanisms, and monitoring multiple fitness components, to address the potential reproductive consequences of climate change.
Data Availability Statement
The datasets presented in this study can be found in online repositories. The names of the repository/repositories and accession number(s) can be found below: Dryad Digital Repository: https://doi.org/10.7280/D16D7Z.
Author Contributions
MG and DC designed the study, and revised and edited the manuscript. MG performed the experiments, collected and analyzed the data, and drafted the manuscript. Both authors contributed to the article and approved the submitted version.
Conflict of Interest
The authors declare that the research was conducted in the absence of any commercial or financial relationships that could be construed as a potential conflict of interest.
Acknowledgments
We thank A. Barth, H. Clements, A. Faidiga, A. Hacker, S. Haque, and W. Recart for assistance with field and laboratory work and J. Kuppler, T. Huxman, J. Martiny, K. Mooney, J. Powers, W. Recart, A. Sakai, S. Weller, and two reviewers for comments on the manuscript.
Supplementary Material
The Supplementary Material for this article can be found online at: https://www.frontiersin.org/articles/10.3389/fevo.2021.641693/full#supplementary-material
References
Abrol, D. P. (2012). Pollination Biology: Biodiversity Conservation and Agricultural Production. Dordrecht: Springer Science & Business Media.
Aizen, M. A., Garibaldi, L. A., Cunningham, S. A., and Klein, A. M. (2009). How much does agriculture depend on pollinators? Lessons from long-term trends in crop production. Ann. Bot. 103, 1579–1588. doi: 10.1093/aob/mcp076
Aldridge, G., Inouye, D. W., Forrest, J. R., Barr, W. A., and Miller-Rushing, A. J. (2011). Emergence of a mid-season period of low floral resources in a montane meadow ecosystem associated with climate change. J. Ecol. 99, 905–913. doi: 10.1111/j.1365-2745.2011.01826.x
Barber, N. A., and Soper Gorden, N. L. (2014). How do belowground organisms influence plant–pollinator interactions? J. Plant Ecol. 8, 1–11. doi: 10.1093/jpe/rtu012
Bartomeus, I., Ascher, J. S., Wagner, D., Danforth, B. N., Colla, S., Kornbluth, S., et al. (2011). Climate-associated phenological advances in bee pollinators and bee-pollinated plants. Proc. Natl. Acad. Sci. U.S.A. 108, 20645–20649. doi: 10.1073/pnas.1115559108
Bates, D., Maechler, M., Bolker, B., and Walker, S. (2015). Fitting linear mixed-effects models using lme4. J. Stat. Softw. 67, 1–48.
Berdanier, A. B., and Klein, J. A. (2011). Growing season length and soil moisture interactively constrain high elevation aboveground net primary production. Ecosystems 14, 963–974. doi: 10.1007/s10021-011-9459-1
Blankinship, J. C., Meadows, M. W., Lucas, R. G., and Hart, S. C. (2014). Snowmelt timing alters shallow but not deep soil moisture in the Sierra Nevada. Water Resour. Res. 50, 1448–1456. doi: 10.1002/2013wr014541
Brooks, M. E., Kristensen, K., van Benthem, K. J., Magnusson, A., Berg, C. W., Nielsen, A., et al. (2017). glmmTMB balances speed and flexibility among packages for zero-inflated generalized linear mixed modeling. R J. 9, 378–400. doi: 10.32614/rj-2017-066
Bruckman, D., and Campbell, D. R. (2014). Floral neighborhood influences pollinator assemblages and effective pollination in a native plant. Oecologia 176, 465–476. doi: 10.1007/s00442-014-3023-6
Burkle, L. A., and Irwin, R. E. (2009). The effects of nutrient addition on floral characters and pollination in two subalpine plants, Ipomopsis aggregata and Linum lewisii. Plant Ecol. 203, 83–98. doi: 10.1007/s11258-008-9512-0
Burkle, L. A., and Runyon, J. B. (2016). Drought and leaf herbivory influence floral volatiles and pollinator attraction. Glob. Chang. Biol. 22, 1644–1654. doi: 10.1111/gcb.13149
Campbell, D. R. (1985). Pollinator sharing and seed set of Stellaria pubera: competition for pollination. Ecology 66, 544–553. doi: 10.2307/1940403
Campbell, D. R., Forster, M., and Bischoff, M. (2014). Selection of trait combinations through bee and fly visitation to flowers of Polemonium foliosissimum. J. Evol. Biol. 27, 325–336. doi: 10.1111/jeb.12295
Campbell, D. R., and Wendlandt, C. (2013). Altered precipitation affects plant hybrids differently than their parental species. Am. J. Bot. 100, 1322–1331. doi: 10.3732/ajb.1200473
CaraDonna, P. J., Iler, A. M., and Inouye, D. W. (2014). Shifts in flowering phenology reshape a subalpine plant community. Proc. Natl. Acad. Sci. U.S.A. 111, 4916–4921. doi: 10.1073/pnas.1323073111
Cardinale, B. J., Duffy, J. E., Gonzalez, A., Hooper, D. U., Perrings, C., Venail, P., et al. (2012). Biodiversity loss and its impact on humanity. Nature 486, 59–67. doi: 10.1038/nature11148
Carroll, A. B., Pallardy, S. G., and Galen, C. (2001). Drought stress, plant water status, and floral trait expression in fireweed, Epilobium angustifolium (Onagraceae). Am. J. Bot. 88, 438–446. doi: 10.2307/2657108
Caruso, C. M. (2006). Plasticity of inflorescence traits in Lobelia siphilitica (Lobeliaceae) in response to soil water availability. Am. J. Bot. 93, 531–538. doi: 10.3732/ajb.93.4.531
Caruso, C. M., Remington, D. L., and Ostergren, K. E. (2005). Variation in resource limitation of plant reproduction influences natural selection on floral traits of Asclepias syriaca. Oecologia 146, 68–76. doi: 10.1007/s00442-005-0183-4
Cleland, E. E., Chuine, I., Menzel, A., Mooney, H. A., and Schwartz, M. D. (2007). Shifting plant phenology in response to global change. Trends Ecol. Evol. 22, 357–365. doi: 10.1016/j.tree.2007.04.003
Eisen, K. E., Campbell, D. R., Richards, E., and Geber, M. A. (2019). Differences in flowering phenology are likely not the product of competition for pollination in Clarkia communities. Int. J. Plant Sci. 180, 974–986. doi: 10.1086/705607
Engel, E. C., and Irwin, R. E. (2003). Linking pollinator visitation rate and pollen receipt. Am. J. Bot. 90, 1612–1618. doi: 10.3732/ajb.90.11.1612
Feldman, T. S. (2008). The plot thickens: does low density affect visitation and reproductive success in a perennial herb, and are these effects altered in the presence of a co-flowering species? Oecologia 156, 807–817. doi: 10.1007/s00442-008-1033-y
Fitter, A. H., and Fitter, R. S. R. (2002). Rapid changes in flowering time in British plants. Science 296, 1689–1691. doi: 10.1126/science.1071617
Forrest, J., Inouye, D. W., and Thomson, J. D. (2010). Flowering phenology in subalpine meadows: does climate variation influence community co-flowering patterns? Ecology 91, 431–440. doi: 10.1890/09-0099.1
Forrest, J., and Miller-Rushing, A. J. (2010). Toward a synthetic understanding of the role of phenology in ecology and evolution. Philos. Trans. R. Soc. B Biol. Sci. 365, 3101–3112. doi: 10.1098/rstb.2010.0145
Forrest, J., and Thomson, J. D. (2010). Consequences of variation in flowering time within and among individuals of Mertensia fusiformis (Boraginaceae), an early spring wildflower. Am. J. Bot. 97, 38–48. doi: 10.3732/ajb.0900083
Forrest, J. R. (2015). Plant–pollinator interactions and phenological change: what can we learn about climate impacts from experiments and observations? Oikos 124, 4–13. doi: 10.1111/oik.01386
Fox, J., and Weisberg, S. (2011). An R Companion to Applied Regression, Ed. 2 Edn. Thousand Oaks, CA: Sage Publications.
Galen, C. (2000). High and dry: drought stress, sex-allocation trade-offs, and selection on flower size in the alpine wildflower Polemonium viscosum (Polemoniaceae). Am. Nat. 156, 72–83. doi: 10.1086/303373
Galen, C., Sherry, R. A., and Carroll, A. B. (1999). Are flowers physiological sinks or faucets? Costs and correlates of water use by flowers of Polemonium viscosum. Oecologia 118, 461–470. doi: 10.1007/s004420050749
Galen, C., Zimmer, K. A., and Newport, M. E. (1987). Pollination in floral scent morphs of Polemonium viscosum: a mechanism for disruptive selection on flower size. Evolution 41, 599–606. doi: 10.2307/2409261
Gallagher, M. K., and Campbell, D. R. (2017). Shifts in water availability mediate plant-pollinator interactions. New Phytol. 215, 792–802. doi: 10.1111/nph.14602
Gallagher, M. K., and Campbell, D. R. (2020). Pollinator visitation and effectiveness vary with flowering phenology. Am. J. Bot. 107, 445-455.
Geber, M. A. (1985). The relationship of plant size to self-pollination in Mertensia ciliata. Ecology 66, 762–772. doi: 10.2307/1940537
Gezon, Z. J., Inouye, D. W., and Irwin, R. E. (2016). Phenological change in a spring ephemeral: implications for pollination and plant reproduction. Glob. Chang. Biol. 22, 1779–1793. doi: 10.1111/gcb.13209
Ghazoul, J. (2006). Floral diversity and the facilitation of pollination. J. Ecol. 94, 295–304. doi: 10.1111/j.1365-2745.2006.01098.x
Glenny, W. R., Runyon, J. B., and Burkle, L. A. (2018). Drought and increased CO2 alter floral visual and olfactory traits with context-dependent effects on pollinator visitation. New Phytol. 220, 785–798. doi: 10.1111/nph.15081
Gorden, N. L. S., and Adler, L. S. (2013). Abiotic conditions affect floral antagonists and mutualists of Impatiens capensis (Balsaminaceae). Am. J. Bot. 100, 679–689. doi: 10.3732/ajb.1200460
Gornish, E. S., and Tylianakis, J. M. (2013). Community shifts under climate change: mechanisms at multiple scales. Am. J. Bot. 100, 1422–1434. doi: 10.3732/ajb.1300046
Greenleaf, S. S., Williams, N. M., Winfree, R., and Kremen, C. (2007). Bee foraging ranges and their relationship to body size. Oecologia 153, 589–596. doi: 10.1007/s00442-007-0752-9
Halpern, S. L., Adler, L. S., and Wink, M. (2010). Leaf herbivory and drought stress affect floral attractive and defensive traits in Nicotiana quadrivalvis. Oecologia 163, 961–971. doi: 10.1007/s00442-010-1651-z
Hegland, S. J., and Boeke, L. (2006). Relationships between the density and diversity of floral resources and flower visitor activity in a temperate grassland community. Ecol. Entomol. 31, 532–538. doi: 10.1111/j.1365-2311.2006.00812.x
Hegland, S. J., Nielsen, A., Lázaro, A., Bjerknes, A. L., and Totland, Ø (2009). How does climate warming affect plant-pollinator interactions? Ecol. Lett. 12, 184–195. doi: 10.1111/j.1461-0248.2008.01269.x
Herrera, C. M. (1995). Floral biology, microclimate, and pollination by ectothermic bees in an early- blooming herb. Ecology 76, 218–228. doi: 10.2307/1940644
Hoover, S. E., Ladley, J. J., Shchepetkina, A. A., Tisch, M., Gieseg, S. P., and Tylianakis, J. M. (2012). Warming, CO2, and nitrogen deposition interactively affect a plant-pollinator mutualism. Ecol. Lett. 15, 227–234. doi: 10.1111/j.1461-0248.2011.01729.x
Iler, A. M., Inouye, D. W., Hoye, T. T., Miller-Rushing, A. J., Burkle, L. A., and Johnston, E. B. (2013). Maintenance of temporal synchrony between syrphid flies and floral resources despite differential phenological responses to climate. Glob. Chang. Biol. 19, 2348–2359. doi: 10.1111/gcb.12246
Inouye, D. W. (2008). Effects of climate change on phenology, frost damage, and floral abundance of montane wildflowers. Ecology 89, 353–362. doi: 10.1890/06-2128.1
Jamieson, M. A., Trowbridge, A. M., Raffa, K. F., and Lindroth, R. L. (2012). Consequences of climate warming and altered precipitation patterns for plant-insect and multitrophic interactions. Plant Physiol. 160, 1719–1727. doi: 10.1104/pp.112.206524
Kearns, C. A., and Inouye, D. W. (1993). Techniques for Pollination Biologists. Niwot, CO: University Press of Colorado.
Knight, T. M., Steets, J. A., Vamosi, J. C., Mazer, S. J., Burd, M., Campbell, D. R., et al. (2005). Pollen limitation of plant reproduction: pattern and process. Annu. Rev. Ecol. Evol. Syst. 36, 467–497. doi: 10.1146/annurev.ecolsys.36.102403.115320
Lázaro, A., Jakobsson, A., and Totland, Ø (2013). How do pollinator visitation rate and seed set relate to species’ floral traits and community context? Oecologia 173, 881–893. doi: 10.1007/s00442-013-2652-5
Lázaro, A., Lundgren, R., and Totland, Ø (2009). Co-flowering neighbors influence the diversity and identity of pollinator groups visiting plant species. Oikos 118, 691–702. doi: 10.1111/j.1600-0706.2008.17168.x
Lázaro, A., and Totland, Ø (2010). Population dependence in the interactions with neighbors for pollination: a field experiment with Taraxacum officinale. Am. J. Bot. 97, 760–769. doi: 10.3732/ajb.0900263
Lemoine, N. P., Doublet, D., Salminen, J., Burkeple, D. E., and Parker, J. D. (2017). Response of plant phenology, growth, defense, and reproduction to interactive effects of warming and insect herbivory. Ecology 98, 1817–1828. doi: 10.1002/ecy.1855
Mal, T. K., and Lovett-Doust, J. (2005). Phenotypic plasticity in vegetative and reproductive traits in an invasive weed, Lythrum salicaria (Lythraceae), in response to soil moisture. Am. J. Bot. 92, 819–825. doi: 10.3732/ajb.92.5.819
Mark, S., and Olesen, J. M. (1996). Importance of elaiosome size to removal of ant-dispersed seeds. Oecologia 107, 95–101. doi: 10.1007/bf00582239
Marshall, J. D., Blair, J. M., Peters, D. P., Okin, G., Rango, A., and Williams, M. (2008). Predicting and understanding ecosystem responses to climate change at continental scales. Front. Ecol. Environ. 6:273–280. doi: 10.1890/070165
Memmott, J., Craze, P. G., Waser, N. M., and Price, M. V. (2007). Global warming and the disruption of plant–pollinator interactions. Ecol. Lett. 10, 710–717. doi: 10.1111/j.1461-0248.2007.01061.x
Miller-Rushing, A. J., and Inouye, D. W. (2009). Variation in the impact of climate change on flowering phenology and abundance: an examination of two pairs of closely related wildflower species. Am. J. Bot. 96, 1821–1829. doi: 10.3732/ajb.0800411
Mitchell, R. J., Flanagan, R. J., Brown, B. J., Waser, N. M., and Karron, J. D. (2009). New frontiers in competition for pollination. Ann. Bot. 103, 1403–1413. doi: 10.1093/aob/mcp062
Moeller, D. A. (2005). Pollinator community structure and sources of spatial variation in plant-pollinator interactions in Clarkia xantiana ssp. xantiana. Oecologia 142, 28–37. doi: 10.1007/s00442-004-1693-1
Ne’eman, G., Jürgens, A., Newstrom-Lloyd, L., Potts, S. G., and Dafni, A. (2010). A framework for comparing pollinator performance: effectiveness and efficiency. Biol. Rev. 85, 435–451.
Ogilvie, J. E., Griffin, S. R., Gezon, Z. J., Inouye, B. D., Underwood, N., Inouye, D. W., et al. (2017). Interannual bumble bee abundance is driven by indirect climate effects on floral resource phenology. Ecol. Lett. 20, 1507–1515. doi: 10.1111/ele.12854
Ortega, Y. K., Pearson, D. W., Waller, L. P., Sturdevan, N. J., and Maron, J. L. (2012). Population-level compensation impedes biological control of an invasive forb and indirect release of a native grass. Ecology 93, 783–792. doi: 10.1890/11-0750.1
Overpeck, J., and Udall, B. (2010). Dry times ahead. Science 328, 1642–1643. doi: 10.1126/science.1186591
Parmesan, C. (2006). Ecological and evolutionary responses to recent climate change. Annu. Rev. Ecol. Evol. Syst. 37, 637–669. doi: 10.1146/annurev.ecolsys.37.091305.110100
Parsche, S., Fründ, J., and Tscharntke, T. (2011). Experimental environmental change and mutualistic vs. antagonistic plant flower–visitor interactions. Perspect. Plant Ecol. Evol. Syst. 13, 27–35. doi: 10.1016/j.ppees.2010.12.001
Pederson, G. T., Gray, S. T., Ault, T., Marsh, W., Fagre, D. B., Bunn, A. G., et al. (2011). Climatic controls on the snowmelt hydrology of the northern Rocky Mountains. J. Clim. 24, 1666–1687. doi: 10.1175/2010jcli3729.1
Pelton, J. (1961). An investigation of the ecology of Mertensia ciliata in Colorado. Ecology 42, 38–52. doi: 10.2307/1933266
Pyke, G., Thomson, J. D., Inouye, D. W., and Miller, T. J. (2016). Effects of climate change on phenologies and distributions of bumble bees and the plants they visit. Ecosphere 7:e01267.
R Core Team (2016). R: A Language and Environment for Statistical Computing. Vienna: R Foundation for Statistical Computing. Available online at: https://www.R-project.org/
Raderschall, C. A., Vico, G., Lundin, O., Taylor, A. R., and Bommarco, R. (2020). Water stress and insect herbivory interactively reduce crop yield while the insect pollination benefit is conserved. Glob. Chang. Biol. 27, 71–83. doi: 10.1111/gcb.15386
Rafferty, N. E., and Ives, A. R. (2011). Effects of experimental shifts in flowering phenology on plant–pollinator interactions. Ecol. Lett. 14, 69–74. doi: 10.1111/j.1461-0248.2010.01557.x
Rafferty, N. E., and Ives, A. R. (2012). Pollinator effectiveness varies with experimental shifts in flowering time. Ecology 93, 803–814. doi: 10.1890/11-0967.1
Rathcke, B. (1983). “Competition and facilitation among plants for pollination,” in Pollination Biology, ed. L. Real (Orlando, FL: Academic Press), 305–329.
Rering, C. C., Franco, J. G., Yeater, K. M., and Mallinger, R. E. (2020). Drought stress alters floral volatiles and reduces floral rewards, pollinator activity, and seed set in a global plant. Ecosphere 11:e03254. doi: 10.1002/ecs2.3254
Sahli, H. F., and Conner, J. K. (2007). Visitation, effectiveness, and efficiency of 15 genera of visitors to wild radish, Raphanus raphanistrum (Brassicaceae). Am. J. Bot. 94, 203–209. doi: 10.3732/ajb.94.2.203
Saunders, S., Montgomery, C., Easley, T., and Spencer, T. (2008). Hotter and Drier: The West’s Changed Climate. New York, NY: Rocky Mountain Climate Organization and the Natural Resources Defense Council (NRDC Publications Department).
Schmitt, J. (1983). Density-dependent pollinator foraging, flowering phenology, and temporal pollen dispersal patterns in Linanthus bicolor. Evolution 37, 1247–1257. doi: 10.2307/2408845
Seager, R., Ting, M., Li, C., Naik, N., Cook, B., Nakamura, J., et al. (2012). Projections of declining surface-water availability for the southwestern United States. Nat. Clim. Change 3, 482–486. doi: 10.1038/nclimate1787
Shibata, A., and Kudo, G. (2020). Floral abundance and bee density affect species-specific foraging patterns of alpine bumble bees. Arthropod Insect Interact. 14, 771–783. doi: 10.1007/s11829-020-09787-0
Sloat, L. L., Henderson, A. N., Lamanna, C., and Enquist, B. J. (2015). The effect of the foresummer drought on carbon exchange in subalpine meadows. Ecosystems 18, 533–545. doi: 10.1007/s10021-015-9845-1
Stemkovski, M., Pearse, W. D., Griffin, S. R., Pardee, G., Gibbs, J., Griswold, T., et al. (2020). Bee phenology is predicted by climatic variation and functional traits. Ecol. Lett. 23, 1589-1598.
Strauss, S. Y., Conner, J. K., and Rush, S. L. (1996). Foliar herbivory affects floral characters and plant attractiveness to pollinators: implications for male and female plant fitness. Am. Nat. 147, 1098–1107. doi: 10.1086/285896
Strauss, S.Y. and Whittall, J. B. (2006). “Non-pollinator agents of selection on floral traits,” in Ecology and Evolution of Flowers, eds L. Harder and S. Barrett (Oxford: Oxford University Press), 120–138.
Suni, S. S., Ainsworth, B., and Hopkins, R. (2020). Local adaptation mediates floral responses to water limitation in an annual wildflower. Am. J. Bot. 107, 209–218. doi: 10.1002/ajb2.1434
Suzuki, K. (1994). Pollinator restriction in the narrow-tube flower type of Mertensia ciliata (James) G. Don (Boraginaceae). Plant Species Biol. 9, 69–73. doi: 10.1111/j.1442-1984.1994.tb00085.x
Temeles, E. J., Newman, J. T., Newman, J. H., Cho, S. Y., Mazzotta, A. R., and Kress, W. J. (2016). Pollinator competition as a driver of floral divergence: an experimental test. PLoS One 11:e0146431. doi: 10.1371/journal.pone.0146431
Thompson, J. D. (2001). How do visitation patterns vary among pollinators in relation to floral display and floral design in a generalist pollination system? Oecologia 126, 386–394. doi: 10.1007/s004420000531
Turnbull, C. L., Beattie, A. J., and Hanzawa, F. M. (1983). Seed dispersal by ants in the Rocky Mountains. Southwest. Nat. 28, 289–293. doi: 10.2307/3670789
Walter, J. (2020). Dryness, wetness and temporary flooding reduce floral resources of plant communities with adverse consequences for pollinator attraction. J. Ecol. 108, 1453–1464. doi: 10.1111/1365-2745.13364
Waser, N. M., and Price, M. V. (2016). Drought, pollen and nectar availability, and pollination success. Ecology 97, 1400–1409. doi: 10.1890/15-1423.1
Wielgolaski, F. E., and Inouye, D. W. (2013). “Phenology at high latitudes,” in Phenology: An Integrative Environmental Science, ed. M. Schwartz (Dordrecht: Springer), 225–247. doi: 10.1007/978-94-007-6925-0_13
Winfree, R. (2013). Global change, biodiversity, and ecosystem services: what can we learn from studies of pollination? Basic Appl. Ecol. 14, 453–460. doi: 10.1016/j.baae.2013.07.004
Keywords: Bombus, Mertensia, mutualism, phenology manipulation, pollinator visitation, seed set, species interactions, water availability
Citation: Gallagher MK and Campbell DR (2021) Experimental Test of the Combined Effects of Water Availability and Flowering Time on Pollinator Visitation and Seed Set. Front. Ecol. Evol. 9:641693. doi: 10.3389/fevo.2021.641693
Received: 14 December 2020; Accepted: 26 February 2021;
Published: 25 March 2021.
Edited by:
Jonas Kuppler, University of Ulm, GermanyReviewed by:
Benjamin Phillips, University of Exeter, United KingdomCarla Essenberg, Bates College, United States
Copyright © 2021 Gallagher and Campbell. This is an open-access article distributed under the terms of the Creative Commons Attribution License (CC BY). The use, distribution or reproduction in other forums is permitted, provided the original author(s) and the copyright owner(s) are credited and that the original publication in this journal is cited, in accordance with accepted academic practice. No use, distribution or reproduction is permitted which does not comply with these terms.
*Correspondence: Diane R. Campbell, drcampbe@uci.edu