Geometric Stoichiometry: Unifying Concepts of Animal Nutrition to Understand How Protein-Rich Diets Can Be “Too Much of a Good Thing”
 Thomas R. Anderson1*
  David Raubenheimer2
  Dag O. Hessen3
  Kim Jensen4
  Wendy C. Gentleman5
  Daniel J. Mayor6
- 1Marine Systems Modelling, National Oceanography Centre, Southampton, United Kingdom
- 2The Charles Perkins Centre, The University of Sydney, Sydney, NSW, Australia
- 3Centre of Biogeochemistry in the Anthropocene and Department of Bioscience, University of Oslo, Oslo, Norway
- 4Department of Bioscience, Soil Fauna Ecology and Ecotoxicology, Aarhus University, Silkeborg, Denmark
- 5Department of Engineering Mathematics and Internetworking, Dalhousie University, Halifax, NS, Canada
- 6Ocean Biogeochemistry and Ecosystems, National Oceanography Centre, Southampton, United Kingdom
Understanding the factors that control the growth of heterotrophic organisms is central to predicting food web interactions and biogeochemical cycling within ecosystems. We present a new framework, Geometric Stoichiometry (GS), that unifies the disciplines of Nutritional Geometry (NG) and Ecological Stoichiometry (ES) by extending the equations of ES to incorporate core NG concepts, including macromolecules as currencies and the ability of animals to select foods that balance deficits and excesses of nutrients. The resulting model is used to investigate regulation of consumer growth by dietary protein:carbohydrate ratio. Growth on protein-poor diets is limited by nitrogen. Likewise, we show that growth is also diminished on protein-rich diets and that this can be mechanistically explained by means of a metabolic penalty that arises when animals use protein for energy generation. These penalties, which are incurred when dealing with the costs of producing and excreting toxic nitrogenous waste, have not hitherto been represented in standard ES theory. In order to incorporate GS within ecosystem and biogeochemical models, a new generation of integrated theoretical and experimental studies based on unified concepts of NG and ES is needed, including measurements of food selection, biomass, growth and associated physiology, and involving metabolic penalties.
Introduction
Understanding the relationship between the growth of consumers and the quantity and quality of their food is essential to quantifying the transfer of carbon and nutrient elements between trophic levels in ecosystems and associated nutrient cycling to the environment (Hessen et al., 2004). It is also required by industries such as agriculture and aquaculture in order to maximize animal growth and fitness in response to the feed supplied (e.g., Villalba and Provenza, 1999; Skalli et al., 2004). Two major frameworks have developed in parallel over the last two to three decades to address this important challenge: the Geometric Framework for nutrition, also known as Nutritional Geometry (NG), and Ecological Stoichiometry (ES). It is perhaps surprising that these two disciplines have operated independently of each other, with the notable exception of articles by Sperfeld et al. (2016, 2017) that discuss bridging concepts including shared approaches to nutrient budgets and consumer recycling.
NG provides a graphical means of understanding dietary choice that integrates fitness-related and mechanistic aspects of nutrition with food selection (Figure 1; Raubenheimer and Simpson, 1999; Raubenheimer et al., 2009; Simpson and Raubenheimer, 2012). In this framework, nutrition is described in terms of macromolecules that are represented in two-dimensional nutrient space, in our hypothetical example as protein and carbohydrate, where the axes quantify progressive intake by an animal over time (starting from the origin). Trajectories representing different foods, each with its own constant protein:carbohydrate ratio, are shown as nutritional rails. Thus, for example, an animal feeding only on leaves will progress along the leaf nutrient rail over the time course of an experiment, with total ingestion after a given time being the sum of the x- and y-axis (which is more than the length of the rail itself). Optimal nutrition, in terms of both food quality and quantity, occurs at the intake target, at which point fitness costs are minimized. The intake array of points shows how intake is regulated when different nutritionally imbalanced foods are offered in isolation. The shapes of the arrays, which can be linear, concave or convex, indicate how the intakes of different macronutrients are prioritized relative to each other. Much of NG is based around laboratory experiments that investigate how animals, when presented with a range of different food types, select for diets that achieve an optimal balance of protein and carbohydrate or lipid (e.g., Raubenheimer and Jones, 2006; Lee et al., 2008; Jensen et al., 2012). In practice, individual food types are often sub-optimal, in which case animals may ingest an excess of some macronutrients and/or a deficit of others in order to achieve a specific combination of excesses and deficits that minimizes the overall fitness costs of this predicament, termed a rule of compromise (Raubenheimer and Simpson, 1999, 2018; Simpson et al., 2004).
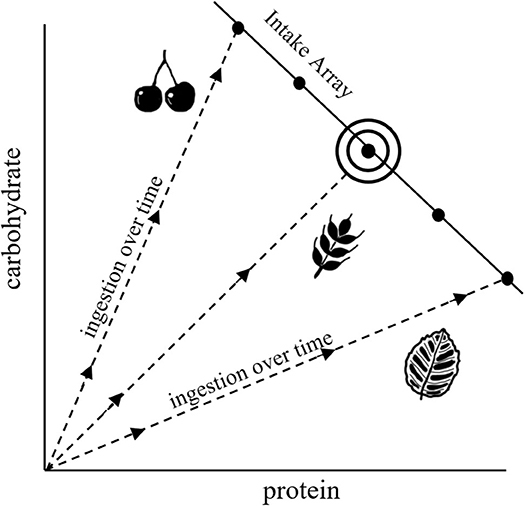
Figure 1. Characteristic diagram for NG, illustrating nutrient rails for different food types (dashed lines), an intake array that shows regulation of intake when confined to different nutritionally imbalanced foods, and an intake target (the bullseye) that represents the nutritional optimum.
Ecological Stoichiometry (ES) usually operates in terms of elements, rather than macromolecules, to track flows of carbon (C), nitrogen (N), and phosphorus through organisms and ecosystems (Sterner and Elser, 2002). The equations of ES compare the elemental demands of a consumer organism to those supplied in food and, taking into account growth efficiencies, identifies a limiting element. Optimal nutrition occurs when the elemental composition of the food is equal to the Threshold Elemental Ratio (TER) which defines the point of cross-over from limitation by one element to another. Non-limiting elements are in excess and are lost to the environment to maintain homeostasis of biomass. The approach is appealing in its simplicity and ability to apply mass balance for intake, growth and release of excess elements.
Protein is essential to animal nutrition, providing the building blocks for new tissue, enzymes, etc., and it is therefore unsurprising that animals in their natural environment commonly favor N-rich diets (Mattson, 1980). In many cases, however, consumers may be constrained to diets that are richer in protein relative to carbohydrate and lipid than is optimal (Rothman et al., 2011; Jensen et al., 2014; Nyffeler et al., 2016; Remonti et al., 2016; Wiggins and Wilder, 2018). Animals must then use protein as a source of energy, potentially leading to the onset of toxicity via deamination and release of ammonia and incurring various energetic and other costs associated with metabolic transformations, synthesis of reduced forms of N and excretion (Bender, 2012; Piper et al., 2017; Reed et al., 2017; Jennings et al., 2018). High dietary nutrient content can thus be “too much of a good thing” (Boersma and Elser, 2006). Experimental studies, albeit focusing on ratios of C:phosphorus, have shown a stoichiometric “knife-edge” in which, on either side of an optimal food composition, growth is negatively impacted when nutrient elements are in either deficit or excess (Elser et al., 2005, 2016; Laspoumaderes et al., 2015). As yet, however, there has been no mathematical exploration of the knife-edge phenomenon, with the exception of theoretical work involving Lotka-Volterra type predatory-prey models in which it was assumed that high phosphorus content in food causes animals to decrease their ingestion rate (Peace et al., 2013, 2014).
We have two main aims. First, we present and demonstrate a unified mathematical framework, Geometric Stoichiometry (GS), that has as its basis the equations of ES, adapted to generate the nutrient-space diagrams of NG (Figure 1) by using macromolecules as currencies and incorporating rules of compromise associated with nutritionally imbalanced diets. Note that, as with ES, the equations of GS are readily incorporated into ecosystem and biogeochemical models, thereby extending the implications of NG concepts to understanding and predicting ecosystem-level processes. Second, we use GS to investigate the relationship between consumer growth and dietary protein content and will show that decreased growth on protein-rich diets can be mechanistically explained in terms of a metabolic penalty that is associated with using protein as a source of energy. Such penalties have not hitherto been included in the standard theory and equations of ES.
Model Description
Our new framework GS, uses the ES model of Anderson et al. (2017; hereafter A17) as its mathematical basis. The A17 model was originally parameterized to investigate the nutritional requirements of poikilothermic invertebrates and their response to temperature. It has C and N as currencies and calculates growth, respiration, and excretion based on the C:N ratios of consumer and prey, food quantity, and three metabolic terms: biomass turnover, other basal metabolism and specific dynamic action (SDA; an energetic cost proportional to intake). Biomass turnover necessarily requires both C and N, whereas other basal metabolism and SDA are energetic costs that are met using either non-nitrogenous compounds (preferentially) or protein. We derive the new GS framework via three key developments of ES that are implemented as enhancements to the A17 model, in each case creating synergy with NG: (1) GS currencies are proteins and non-nitrogenous macromolecules (carbohydrates and lipids; we will nominally refer to the former); (2) the equations operate in reverse, i.e., from growth to intake, thereby generating intake arrays as combinations of protein and carbohydrate intake that give rise to a given growth rate; (3) a metabolic penalty is applied when protein is used as a source of energy in metabolism.
Lists of variables and parameters are provided in Tables 1, 2. Note that model equations can also be specified in forward mode, i.e., from intake through to growth, respiration, etc. (Supplementary Appendix 1). Model code, in R, for both the reverse and forward versions of the model, is provided in Supplementary Appendix 4.
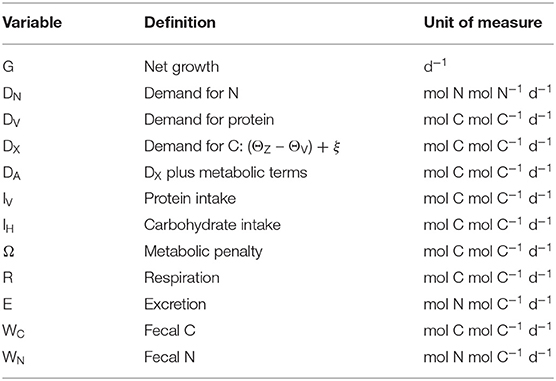
Table 1. Model variables.
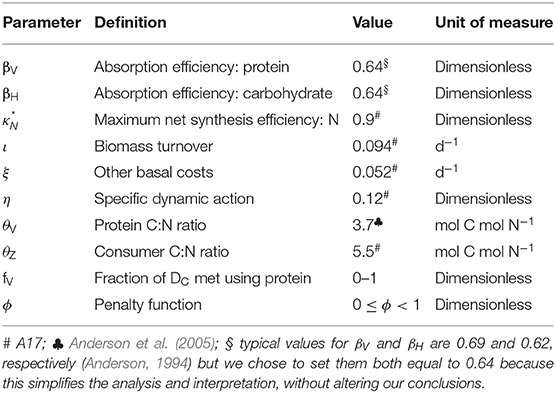
Table 2. Model parameters.
Equations
A key requirement of GS is to generate intake arrays that are predicted as combinations of intakes of protein, IV, and carbohydrate, IH, that give rise to a specified growth rate, G (d−1). Protein is assumed to have a fixed C:N of 3.7 (parameter θV; Anderson et al., 2005), whereas carbohydrate contains no N. The prediction of intake arrays and associated metabolic budgets, involves the following steps:
Step 1. Calculate the demand for absorbed C for synthesis of new and replacement biomass (G and τ) excluding metabolic costs (note that synthesis of G and τ are considered to be equivalent in terms of underlying physiology and model parameterisation: A17).
Biomass contains N and so there is a minimum (obligatory) demand for N from dietary protein, DN (mol N mol N−1 d−1; i.e., N synthesis per unit N biomass):
where parameter is the maximum N synthesis efficiency, which is the conversion efficiency for N when synthesizing G and τ; is ≤1 because the biochemical pathways for protein sparing are not necessarily 100% efficient (Kuijper et al., 2004). Note that we avoid the more usual term net production efficiency because parameter applies to both new and replacement biomass (A17). The corresponding demand for absorbed protein, DV (mol C mol C−1 d−1; note the conversion to C units), is:
where θZ is the fixed (homeostatic) C:N ratio of the consumer. Given that the C:N ratio of biomass is greater than that of protein (θZ > θV), the difference must be made up from either protein or carbohydrate (with deamination of N in case of the former). This extra demand for C, DX, is:
Step 2. Calculate energetic costs, including the metabolic penalty.
Energy is required for basal metabolism, ξ (mol C mol C−1 d−1), and SDA where the latter accounts for the costs of feeding, absorption and assimilation. SDA is expressed as a fixed fraction, η, of the total C intake (Secor, 2009; A17) via protein and carbohydrate (IV + IH). Excluding DV, the demand for absorbed C, DA, is therefore equal to DX plus the costs of ξ and SDA:
The cost of DA can be met using either protein or carbohydrate. A new parameter, fV, is specified that quantifies the relative usage of these two substrates to meet the costs of DA and any other energetic costs including the metabolic penalty (see below). Fraction fV is met using protein, with 1 – fV from carbohydrate. Intake arrays are then generated as the outcome of evaluating the full range of possible usage of carbohydrate and protein, from carbohydrate-only (fV = 0) to protein-only (fV = 1).
Another key aspect of GS is that it is designed to include the rules of compromise that characterize NG, meaning that predicted growth can be adversely affected not only by dietary shortage of nutrients (in our case, high C:N ratios), but also when nutrients are in excess (low C:N ratios). In order to represent the latter in GS, we introduce a metabolic penalty into the analysis which relates to the use of protein for DA and thereby incurs energetic costs that in reality arise from deamination, metabolic transformations and excretion of ammonia that would otherwise become toxic (Bender, 2012; Reed et al., 2017; Jennings et al., 2018). The penalty comes into play when fV > 0 and is quantified by another parameter, φ, such that the cost is φfVDA (mol C mol C−1 d−1; 0 ≤ φ < 1). The C required to meet this cost is itself partitioned according to fV, depending on whether proteins or carbohydrates are used, leading to a recursive infinite series as the penalty compounds on itself. The total penalty cost, Ω (mol C mol C−1 d−1), is then (φ > 0):
Step 3. Calculation of IV and IH
Total absorbed protein and carbohydrate are βVIV and βHIH, respectively (the complement is lost as fecal matter), where βV and βH are the absorption efficiencies. The allocation of absorbed protein and carbohydrate to growth and metabolism (as calculated in DV, DA, and Ω) is then:
The intake of carbohydrate, IH, is now calculated as:
Iv is calculated by rearrangement of Equation (6):
Note that Equations (8), (9) cannot be used for the case where fV = 1 (division by zero). In this instance, all C demands are met using protein such that IH is zero and the equation for IV is:
Step 4. C and N budgets
Once IH and IV are known, budgets for C and N can be calculated in forward mode. Respiration, R, and excretion, E, are:
Finally, the equations for production of fecal C and N, WC, and WN, are:
Results
In this section, we use GS to investigate how relative protein content in the diet affects consumer nutrition and growth. We first demonstrate that the equations of GS successfully generate the nutrient-space diagrams of NG (e.g., Figure 1), notably intake arrays, thereby being the first mathematical framework to achieve this goal. The metabolic penalty is then introduced to the analysis and its influence on the predicted intake arrays investigated, focusing in particular on protein-rich diets. As proof of concept, we present a model-data intercomparison, using data (Jensen et al., 2011) for juvenile wolf spiders (Pardosa prativaga) fed fruit flies (Drosophila melanogaster). Finally, we show that a stoichiometric knife-edge is only predicted when the penalty is imposed, which is significant because penalties have not as yet been formally included in the theory of ES.
Prediction of Intake Arrays
The model is first analyzed in the absence of the metabolic penalty (φ = 0). Intake arrays are successfully predicted that represent the entire range of combinations (0 ≤ fV ≤ 1) for protein and carbohydrate intake that give rise to the specified growth rates, in this case G = 0, 0.25, 0.5 d−1 (Figure 2A). Note that intake is still required when G = 0, in order to meet maintenance demands. The predicted arrays are linear and have the same slope, bHV, which, in the absence of penalties, depends only on the absorption efficiencies for protein and carbohydrate (βV, βH) and SDA (η):
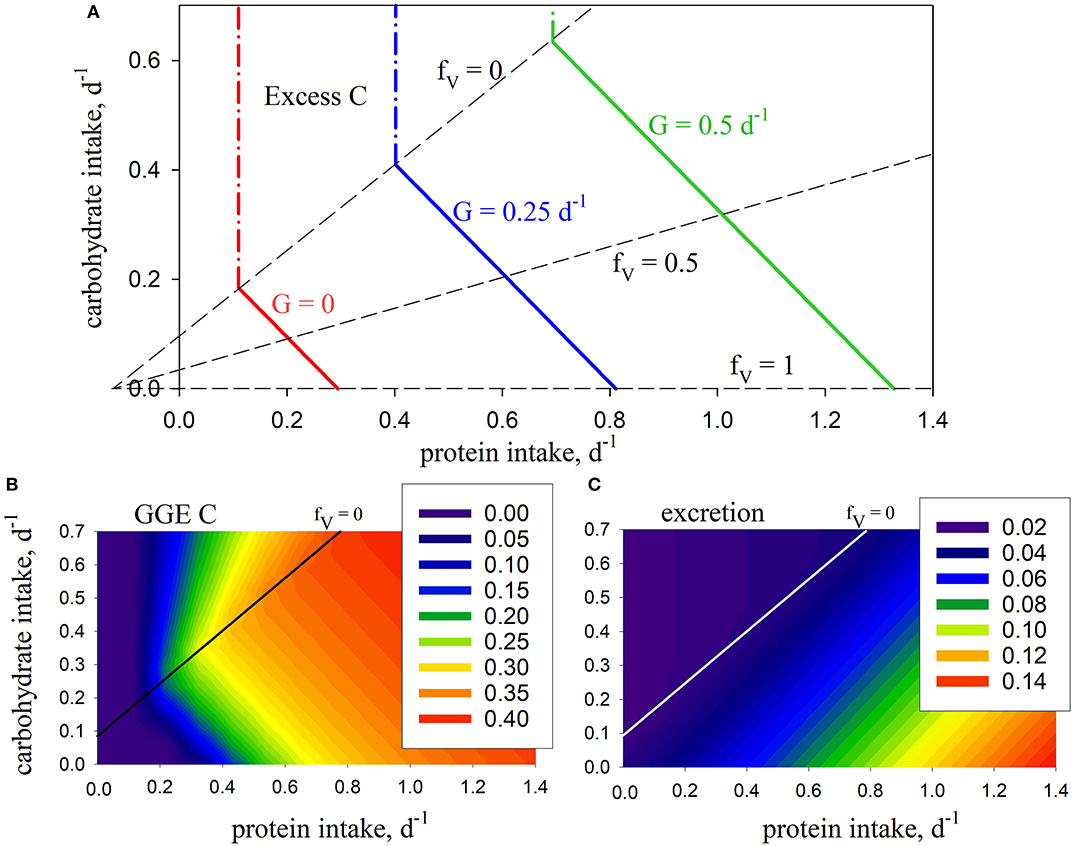
Figure 2. Model predictions using standard parameters (Table 2; no penalty: φ = 0): (A) intake arrays (solid color lines) for consumer growth rate (G) of 0, 0.25, 0.5, d−1 (0 ≤ fV ≤ 1), extended into excess-C phase-space (dash-dot color lines); also shown are isolines for fV = 0, 0.5, 1.0 (dashed lines); (B) carbon gross growth efficiency; (C) excretion (mol N mol C−1 d−1). The fV = 0 isoline represents the case where energetic costs are met solely using carbohydrate, without use of protein.
In this case, the predicted slope is −1 given that βV = βH, meaning that predicted growth efficiency is congruent with the intake arrays because it is the same whether protein or carbohydrates are used for energy (Figure 2B). N excretion increases with increasing fV as protein is used as a source of energy. It is never zero because of ongoing biomass turnover (Figure 2C). Growth is limited by N when carbohydrate intake exceeds the fV = 0 isoline, in which case C is in stoichiometric excess (Figure 2A). As such, this isoline equates to the concept of TER in ES in that it represents a switch from limitation by C to limitation by N, and vice versa. Note that we describe fV = 0 as an isoline, rather than a rail, because it does not pass through the origin and represent a unique food type (as in Figure 1) but, rather, protein:carbohydrate ratio varies along its length.
Although the nutrient-space diagram in Figure 2A has the same appearance as those typical of NG (Figure 1), there is a subtle but important difference. NG nutrient-space diagrams show cumulative intake (along nutrient rails) over a period of time, e.g., in units of mol C. In contrast, intake in GS (Figure 2A; the x- and y-axis) is expressed as instantaneous rates, in this case with units mol C (mol C)−1 d−1. Both types of diagram tell the same story in that integrating the instantaneous rates over time gives rise to the cumulative intake.
Introducing the metabolic penalty (φ > 0) means that, in order to achieve a given growth rate, animals incur an additional requirement for C (Ω; Equation 5) when using protein as a source of energy. The resulting intake arrays have a decreased slope, as well as slightly convex curvature (Figure 3). The impact of the penalty is nonlinear, e.g., for G = 0.5 d−1, increasing φ from zero to 0.2 and 0.5 results in an increased demand for C of 16 and 76% respectively, for an animal consuming a diet of pure protein (fV = 1). The arrays for different values of φ merge at fV = 0. Growth efficiency is maximized at this isoline (for φ > 0), which is then, as a concept, equivalent to the TER in ES, with all energetic costs met using carbohydrates. Additional analysis of the C and N budgets shown in Figures 2, 3 is presented in Supplementary Appendix 3.
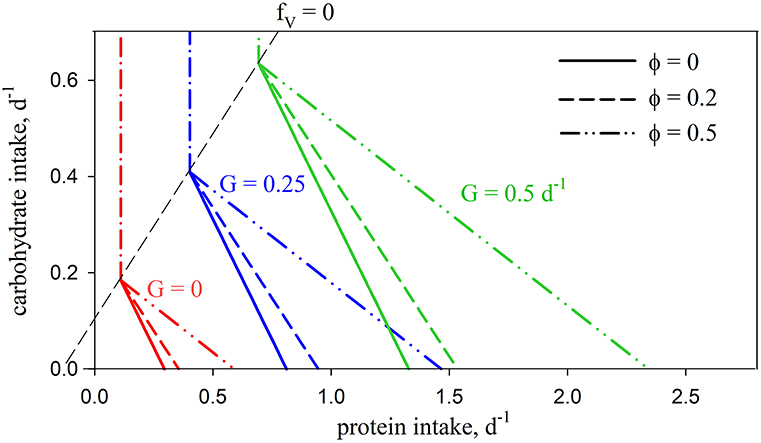
Figure 3. Predicted intake arrays using standard parameters (Table 2) for no penalty (φ = 0; solid lines; as in Figure 2A) and with penalties of φ = 0.2 (dashed lines) and φ = 0.5 (dash-double-dot lines).
Comparison With Data
We compare the model to data for two reasons. First, it provides a practical example of linking GS to the experimental results of NG. Second, the exercise of comparing with data was inherently informative because, despite there being many published NG studies, it was not easy to find a data set that was suitable for this purpose. The problem in this regard is that GS requires biomass-specific units for model parameterization, i.e., rates normalized to consumer biomass, which are not the norm in reporting of NG experiments. In the event, we chose data for juvenile wolf spiders (Pardosa prativaga) fed fruit flies (Drosophila melanogaster) with lipid:protein ratios ranging between 0.10 and 0.89 mg mg−1 over the course of their second instar (Jensen et al., 2011). This data set is unusual in that spiders are atypical predators. They masticate their prey while regurgitating digestive fluid over it in a process known as extra-oral digestion (e.g., Wilder, 2011), after which the nutrient-laden liquid is sucked up using a muscular stomach (Eberhard et al., 2006). The advantage of the spider data is that spider biomass was recorded from which biomass-specific rates can be calculated, and that multiple arrays are presented for flies killed, extracted nutrients and growth. Flies killed and extracted nutrients may be considered to be equivalent to intake (handled prey) and absorbed nutrients, respectively. Note that the non-protein macronutrient in this case is lipid, rather than carbohydrate.
Spider C:N does not exhibit strict homeostasis, with average values (for each fly diet; over the 2nd instar) varying between 4.4 and 6.0 mol C mol N−1, depending on the lipid content of the flies (derived from the original data using C per dry weight of 0.038 and 0.063 mol C mg−1 for proteins and lipids, respectively: Anderson, 1992). We use an overall average value for spider C:N, θZ = 5.2; model sensitivity to this parameter is relatively low for the range 4.4 ≤ θZ ≤ 6.0 (see Supplementary Appendix 2). Average spider dry weight (during the course of the experiment) was 0.41 mg (range 0.39–0.42 mg across fly treatments), equivalent to 0.017 mmol C (units converted as above). The second instar lasted an average 13.1 days (range 12.9–13.4 days). These values of spider mass and experiment duration permit conversion of the results shown in Jensen et al. (2011) to biomass-specific units (mmol C mmol C−1 d−1), thereby aligning with the model.
The (specified) growth rate was set to 0.07 d−1, matching the data. With θZ = 5.2 mol C mol N−1 (above), the values of τ (biomass turnover) and ξ (other basal metabolism) were decreased in order to fit the data. Parameter τ was assigned a value of 0.02 d−1, whereas solutions are shown for ξ = 0.02, 0.01 d−1, in each case with or without the metabolic penalty (φ = 0, 0.2). Predicted arrays for flies killed, extracted nutrients and growth are compared to the data (Jensen et al., 2011; converted units) in Figure 4, showing good general agreement. Both model solutions, i.e., excluding the penalty (φ = 0) and with the penalty (φ = 0.2), fit the data reasonably well, although the model-data intercomparison is not sufficiently well-constrained to be able to say that one or other solution is necessarily better than the other. The curvature in the data nevertheless suggests that penalties exist, in this case when protein in fly kills exceeds ~0.15 mol C mol C−1 d−1.
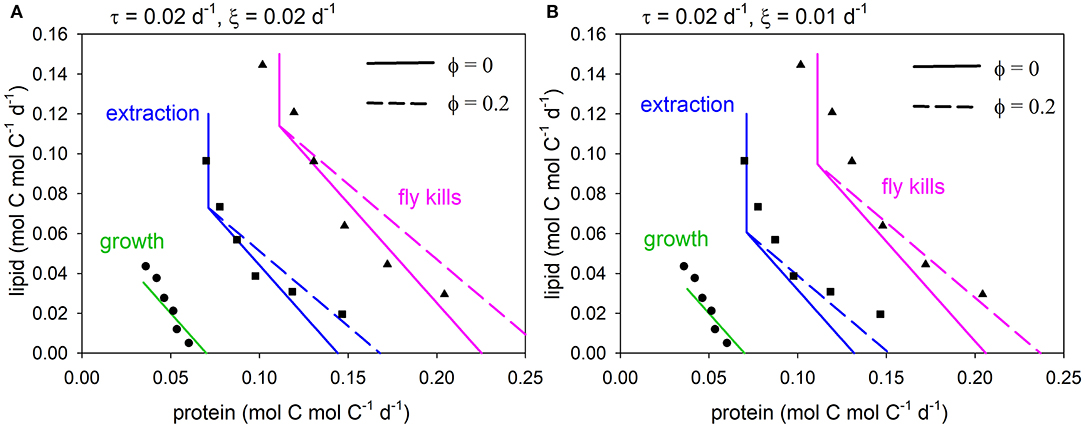
Figure 4. Predicted arrays for fly kills (equivalent to intake as shown in Figures 2, 3; pink), extraction (equivalent to absorption; blue) and growth (green) compared to data (Jensen et al., 2011), for metabolic penalty φ = 0 (solid), 0.2 (dashed): (A) τ = 0.02 d−1, ξ = 0.02 d−1, (B) τ = 0.02 d−1, ξ = 0.01 d−1.
TER and the Stoichiometric Knife-Edge
The relationship between growth, TER (fV = 0) and food C:N ratio (also expressed as % protein), as predicted by the model, is shown in Figure 5 (parameters as in Table 2). The analysis is presented for three different total intake rates, IC = 0.5, 1.0, 1.5 mol C mol C−1 d−1, and for three values of the metabolic penalty, φ = 0, 0.2, 0.5. The predicted TER decreases from 8.2 at IC = 0.5 d−1 to 7.0 at IC = 1.5 d−1 because metabolism has a high C:N ratio relative to growth and dominates an organism's C requirements when resources are scarce.
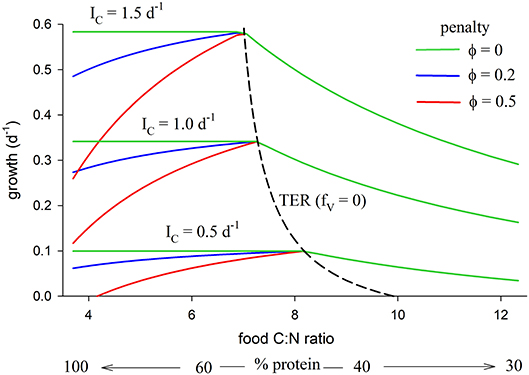
Figure 5. Relationship between growth and food C:N (also expressed as % protein, remainder carbohydrate) for total C intake, IC, of 0.5, 1.0, 1.5 mol C mol C−1 d−1, each for penalty φ = 0, 0.2, 0.5 (parameters as in Table 2). The TER (fV = 0 isoline) is also shown (dashed line), decreasing with increasing intake from a maximum value of 9.9 at G = 0 (maintenance with no growth; IC = 0.29 d−1) to 7.0 at G = 1.5 d−1.
Predicted growth rate is greatest at the TER, but only if metabolic penalties are included in the analysis (φ > 0). Carbohydrate is in excess when food C:N > TER, in which case growth decreases with decreasing protein (increasing C:N) because of limitation by N. The metabolic penalty has no effect in this situation because all energetic costs are met using carbohydrate. When food C:N < TER (relatively protein-rich diets) then, when the penalty is zero (φ = 0), predicted growth shows a constant relationship with intake (horizontal green lines in Figure 5). In this case there is no disadvantage to using protein as a source of energy and predicted growth is the same for an animal consuming a diet of pure protein (C:N of 3.7), vs. a supposedly optimal mix of protein and carbohydrate at the TER, or on any combination of protein and carbohydrate in between. In contrast, when φ > 0 predicted growth is uniquely greatest at the TER because of the cost incurred by the penalty. The TER then represents a unique optimum mix of protein and carbohydrate, with predicted growth declining on either side, thereby generating a stoichiometric knife-edge.
Discussion
Nutritional Geometry and Ecological Stoichiometry constitute two major fields of study that have developed in parallel over recent decades. Both aim to understand the impact of food quality and quantity on animal performance, including our focus here, growth. While NG emphasizes the macromolecular composition of diet, consumer behavior, nutritional choice and evolutionary fitness, ES usually operates on the basis of elements, calculating growth and recycling to the environment on a mass-balance basis. Here, for the first time, we present a unified framework, Geometric Stoichiometry (GS), that merges key concepts of NG, notably the rules of compromise associated with diet selection, with those of ES, notably Threshold Elemental Ratio (Figure 6). The mathematical underpinning of GS is derived from ES, with three important developments: (i) currencies are macromolecules such as proteins and carbohydrates, rather than elements, (ii) equations are derived in reverse mode, involving calculation of the required intake for a given growth rate, and (iii) costs of dealing with excess nutrients are introduced into the analysis by means of a metabolic penalty. We show that GS successfully reproduces the nutrient-space diagrams of NG, being the first mathematical framework to do so.
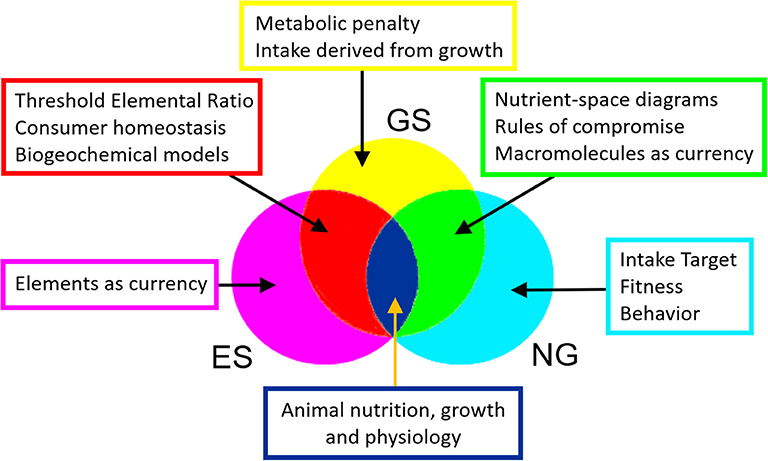
Figure 6. Venn diagram illustrating how GS merges key concepts in ES and NG.
We use GS to investigate the relationship between consumer growth and food protein content, focusing in particular on diets with a surplus of protein relative to non-protein energy. Model results acknowledge the existence of an optimal protein:carbohydrate or protein:lipid ratio where fitness, in our case quantified as growth, is maximized. At the optimum (the fV = 0 isoline in Figure 2), energetic costs are met solely by metabolizing carbohydrates and lipids. This optimum is equivalent to the TER in ES in that it defines the point of transition from limitation by N to limitation by C. The optimal ratio varies with intake, being more carbohydrate- and lipid-biased when food is scarce because the requirement for energy is then at its maximum (Jensen et al., 2012). Even strict carnivores, such as cats and mink, select for an optimal diet that contains not only protein, but also significant quantities of lipid (Mayntz et al., 2009; Plantinga et al., 2011; Jensen et al., 2014; Kohl et al., 2015). Likewise, many primarily carnivorous animals benefit from omnivory in which protein-rich food is supplemented with carbohydrate-rich items such as fruits and foliage (Robbins et al., 2007; Rothman et al., 2011; Nyffeler et al., 2016; Remonti et al., 2016; Ugine et al., 2019; Christensen et al., 2020).
Animals regularly experience considerable variability in the nutritional content of their diet, on a geographical or seasonal basis (Raubenheimer et al., 2012; Williams et al., 2017). To cope with this, they have evolved metabolic flexibility that enables them to switch between the macronutrients they use as substrates for energy to fuel metabolism (Smith et al., 2018). For many, if not all, animals this includes the capacity to utilize ingested amino acids in energy metabolism via a process called gluconeogenesis (Miyamoto and Amrein, 2017). Typically, however, this is an emergency measure invoked when diets are imbalanced with surplus protein relative to the primary energetic macronutrients carbohydrates and fats. In such circumstances, fitness and growth may be directly impacted by a deficit of carbohydrates and fats, as well as metabolic penalties associated with the energetic and toxicity costs of metabolizing amino acids (Solon-Biet et al., 2014; Piper et al., 2017; Raubenheimer and Simpson, 2019). Such dietary imbalance is frequently encountered in the wild, not only by herbivores (e.g., Rothman et al., 2011; Cui et al., 2018) and omnivores (Remonti et al., 2016), including humans (Speth and Spielmann, 1983), but also carnivores (Wilder et al., 2013; Jensen et al., 2014; Kohl et al., 2015; Wiggins and Wilder, 2018). The results of our model show that growth is diminished when protein is in either shortage or excess. The former represents N limitation when food protein content is low (high C:N ratio), in common with many other studies that describe limitation by N or phosphorus, both theoretical (e.g., Hessen, 1992; Anderson and Hessen, 1995) and empirical (e.g., Urabe et al., 1997; DeMott et al., 1998; Elser et al., 2001; Malzahn et al., 2010). Predicted growth rate also decreases on protein-rich diets (low C:N ratio) in which case the excess nutrient (N) in protein is “too much of a good thing” (Boersma and Elser, 2006). These results are consistent with experimental studies that have shown an optimal C:nutrient ratio where growth is maximized, decreasing on either side, thereby generating a stoichiometric “knife-edge” (Elser et al., 2005, 2016; Laspoumaderes et al., 2015). Other studies have likewise shown that the fitness of insect herbivores is adversely affected when fed not only nutrient-deplete food, but also on diets enriched in N (Lee et al., 2003; Cease et al., 2012; Zhu et al., 2019).
Our model is the first to provide a quantitative mechanistic explanation of the knife-edge, notably the decrease in growth rate on nutrient-rich food, based on underlying physiology. The key to this prediction is that we introduce a metabolic penalty into the model that is associated with using protein as a source of energy. Protein must necessarily be used for energy generation when the carbohydrate and lipid content in food is relatively low, in which case animals expend energy associated with transformations and excretion that occur during deamination of protein and the prevention of toxicity (Reed et al., 2017; Jennings et al., 2018). The penalty associated with these processes is quantified as a C demand that comes into play when protein is used, at least in part, as a source of energy. An interesting parallel occurs in plants and algae under conditions of eutrophication that can lead to nutrient “supersaturation” and metabolic imbalances (Britto et al., 2001; Britto and Kronzucker, 2002; Wang et al., 2008; Glibert et al., 2013, 2016; Glibert, 2017). For example, excess ammonium may cause “ammonium syndrome” (Gerendás et al., 1997) resulting from toxicity and associated adverse impact on cellular energy and redox balance (Britto and Kronzucker, 2002; Collos and Harrison, 2014; Glibert et al., 2016). Detoxification is then achieved via assimilation of ammonium, incurring energetic costs (Givan, 1979; Britto and Kronzucker, 2013).
It is not in itself surprising that animal growth is predicted to decrease on nutrient-rich diets when a metabolic penalty is imposed. It should be noted, however, that metabolic penalties have not hitherto been represented in the mathematical theory of ES. Without the penalty, there is no adverse impact of nutrient-rich diets on growth and therefore no prediction of a stoichiometric knife-edge, meaning that animals could then focus solely on obtaining diets that maximize limiting nutrients. In reality, however, animals use complicated nutrient balancing strategies that also involve dealing with nutrient excess (Raubenheimer and Simpson, 2018). Penalties associated with excess nutrients may be highly variable and are by no means straightforward to parameterize in models. The extent to which animals are adversely impacted by protein-rich diets varies between species (Raubenheimer and Simpson, 2003) and developmental stages (Al Shareefi and Cotter, 2019). Penalties need not be related to toxicity, e.g., the processing of peptide bonds incurs high energetic costs, be it for growth or metabolism (Conceição et al., 1997; Carter and Mente, 2014). The stoichiometric knife edge studies (Elser et al., 2005, 2016; Laspoumaderes et al., 2015) indicate that penalties are also incurred on phosphorus-rich diets, as proposed by Boersma and Elser (2006), although the underlying physiology is not well-understood. The principle of metabolic penalties applies to any nutrient that imposes costs when ingested in excess, of which there are many (Raubenheimer et al., 2005). Our work highlights the need for further study to better characterize and quantify metabolic penalties and for their incorporation into stoichiometric theory.
The development of GS highlights the advantage of understanding nutrition and growth in terms of macromolecules, noting that most ES studies are based on elemental mass balance. Although the equations are more complex, the move from elements to molecules allows for a more realistic representation of metabolism and animal physiology, i.e., “metabolic stoichiometry” (Anderson et al., 2005). A prime example is the metabolic penalty, which is based on the use of protein for energy, a concept that cannot be readily described using an elemental approach. The use of macromolecular currencies also permits direct comparison with NG experiments. We caveat these statements by noting that the cycling of phosphorus, which has been a major focus in ES (e.g., Elser and Urabe, 1999), is different to that of N in that it makes up <1% of body mass and has various roles in constructing nucleic acids, phospholipids and ATP (Sterner and Elser, 2002).
Our work focused on the impact of food quality, especially protein content, on consumer growth. It should be emphasized that, as a central theme within NG, animals forage to maximize overall fitness, rather than necessarily growth, which involves other factors including survival, longevity, fecundity, sexual attractiveness, etc. (Simpson and Raubenheimer, 2012). For example, animals that are subject to high-protein diets are shown to often have shorter lifespan (Hamilton and Schal, 1988; Lee et al., 2008; Solon-Biet et al., 2014; Raubenheimer et al., 2016).
ES is strongly rooted in mathematics and, as a consequence, has been incorporated into ecosystem and biogeochemical models (e.g., Anderson et al., 2013; Zhang et al., 2018). A major advantage of GS is that, as with ES, it can be directly incorporated within differential equations, thereby extending the implications of NG concepts by including them in models used to study trophic transfer and carbon cycling in food webs. As always, there is a need for robust parameterisation underpinned by observation and experiment. We compared our model with data for wolf spiders consuming a diet of fruit flies with different protein:lipid ratios (Jensen et al., 2011; Supplementary Appendix 2). Model results showed good general agreement with the data, although the data set involved was not ideal because spiders are atypical predators regarding their modes of feeding and digestion. Despite the large NG literature, it was difficult to find suitable data for model comparison and parameterisation. GS operates on a biomass-specific basis, i.e., growth and metabolic parameters (biomass turnover, τ, and basal metabolism, ξ) are specified per unit consumer biomass. We chose the spider data set because it includes not only intake (fly kills), but also extracted nutrients, growth and biomass, allowing for the calculation of biomass-specific growth rates that provide synergy with GS. In order to incorporate and parameterize GS within ecosystem and biogeochemical models, our work emphasizes the need for a new generation of integrated theoretical and experimental studies that include measurements of food selection, consumer biomass, growth, metabolism, excretion, and related physiological processes. The experimental studies within ES that have addressed the stoichiometric knife-edge (Elser et al., 2005, 2016; Laspoumaderes et al., 2015) have focused on food C:phosphorus and are few in number. There is therefore also a need for further studies on the knife-edge, in particular focusing on protein (N) intake and associated metabolic penalties.
In conclusion, GS has, for the first time, provided a mathematical unification of NG and ES that allows the equations of ES to be extended to incorporate NG concepts, notably the rules of compromise associated with balancing dietary nutrient deficits and excesses. We use the new framework to analyze the regulation of consumer growth by protein and show that decreased growth rate on protein-rich diets can be mechanistically explained by means of a metabolic penalty that is incurred when protein is used as a source of energy. A stoichiometric knife-edge is only predicted when the metabolic penalty is imposed, noting that penalties have not hitherto been represented in standard ES theory. In order to incorporate GS into ecosystem and biogeochemical models, our work highlights the need for new theoretical and experimental studies that include measurements of food selection, consumer biomass, metabolism and associated physiology.
Data Availability Statement
The data analyzed here in are published in Jensen et al. (2011) and are publicly available (doi: 10.13140/RG.2.2.34458.47047).
Author Contributions
All authors made a substantial, direct, and intellectual contribution. TA led the work. DR and KJ are experts in Nutritional Geometry, with KJ providing the spider data. TA and DM are experts in Ecological Stoichiometry, while WG contributed to the development of the model and associated equations.
Funding
TA and DM received funding from the Natural Environment Research Council, UK, programmes CLASS (Award No. NE/R015953/1) and DIAPOD (NE/P006353/1). DR was funded by Australian Research Council Discovery Project Grant No. DP200102585. WG was funded the by Natural Sciences and Engineering Research Council of Canada.
Conflict of Interest
The authors declare that the research was conducted in the absence of any commercial or financial relationships that could be construed as a potential conflict of interest.
Supplementary Material
The Supplementary Material for this article can be found online at: https://www.frontiersin.org/articles/10.3389/fevo.2020.00196/full#supplementary-material
References
Al Shareefi, E., and Cotter, S. C. (2019). The nutritional ecology of maturation in a carnivorous insect. Behav. Ecol. 30, 256–266. doi: 10.1093/beheco/ary142
Anderson, T. R. (1992). Modelling the influence of food C:N ratio, and respiration on growth and nitrogen excretion in marine zooplankton and bacteria. J. Plankton Res. 14, 1645–1671. doi: 10.1093/plankt/14.12.1645
Anderson, T. R. (1994). Relating C:N ratios is zooplankton food and faecal pellets using a biochemical model. J. Exp. Mar. Biol. Ecol. 184, 183–199. doi: 10.1016/0022-0981(94)90004-3
Anderson, T. R., and Hessen, D. O. (1995). Carbon or nitrogen limitation of marine copepods? J. Plankton Res. 17, 317–331. doi: 10.1093/plankt/17.2.317
Anderson, T. R., Hessen, D. O., Boersma, M., Urabe, J., and Mayor, D. J. (2017). Will invertebrates require increasingly carbon-rich food in a warming world? Amer. Nat. 190, 725–742. doi: 10.1086/694122
Anderson, T. R., Hessen, D. O., Elser, J. J., and Urabe, J. (2005). Metabolic stoichiometry and the fate of excess carbon and nutrients in consumers. Amer. Nat. 165, 1–15. doi: 10.1086/426598
Anderson, T. R., Hessen, D. O., Mitra, A., Mayor, D. J., and Yool, A. (2013). Sensitivity of secondary production and export flux to choice of trophic transfer formulation in marine ecosystem models. J. Mar. Syst. 125, 41–53. doi: 10.1016/j.jmarsys.2012.09.008
Bender, D. A. (2012). The metabolism of “surplus” amino acids. Br. J. Nutr. 108, S113–S121. doi: 10.1017/S0007114512002292
Boersma, M., and Elser, J. J. (2006). Too much of a good thing: on stoichiometrically balanced diets and maximal growth. Ecology 87, 1325–1330. doi: 10.1890/0012-9658(2006)87[1325:TMOAGT]2.0.CO;2
Britto, D. T., and Kronzucker, H. J. (2002). toxicity in higher plants: a critical review. J. Plant Physiol. 159, 567–584. doi: 10.1078/0176-1617-0774
Britto, D. T., and Kronzucker, H. J. (2013). Ecological significance and complexity of N-source preference in plants. Ann. Bot. 112, 957–963. doi: 10.1093/aob/mct157
Britto, D. T., Siddiqi, M. Y., Glass, A. D. M., and Kronzucker, H. J. (2001). Futile transmembrane cycling: a cellular hypothesis to explain ammonium toxicity in plants. Proc. Natl. Acad. Sci. U.S.A. 98, 4255–4258. doi: 10.1073/pnas.061034698
Carter, C. G., and Mente, E. (2014). Protein synthesis in crustaceans: a review focused on feeding and nutrition. Cent. Eur. J. Biol. 9, 1–10. doi: 10.2478/s11535-013-0134-0
Cease, A. J., Elser, J. J., Ford, C. F., Hao, S., Kang, S. L., and Harrison, J. F. (2012). Heavy livestock grazing promotes locust outbreaks by lowering plant nitrogen content. Science 335, 467–469. doi: 10.1126/science.1214433
Christensen, J., Nielsen, S. M. B., and Toft, S. (2020). The three-dimensional macronutrient niche of an invasive generalist predator. Ecol. Entomol. 45, 644–651. doi: 10.1111/een.12840
Collos, Y., and Harrison, P. J. (2014). Acclimation and toxicity of high ammonium concentrations to unicellular algae. Mar. Poll. Bull. 80, 8–23. doi: 10.1016/j.marpolbul.2014.01.006
Conceição, L. E. C., Houlihan, D. F., and Verreth, J. A. J. (1997). Fast growth, protein turnover and costs of protein metabolism in yolk-sac larvae of the African catfish (Clarias gariepinus). Fish Physiol. Biochem. 16, 291–302. doi: 10.1023/A:1007751130768
Cui, Z.-W., Wang, Z.-L., Shao, Q., Raubenheimer, D., and Lu, J.-Q. (2018). Macronutrient signature of dietary generalism in an ecologically diverse primate in the wild. Behav. Ecol. 29, 804–813. doi: 10.1093/beheco/ary003
DeMott, W. R., Gulati, R. D., and Siewertsen, K. (1998). Effects of phosphorus-deficient diets on the carbon and phosphorus balance of Daphnia magna. Limnol. Oceanogr. 43, 1147–1161. doi: 10.4319/lo.1998.43.6.1147
Eberhard, W. G., Barrantes, G., and Weng, J.-L. (2006). The mystery of how spiders extract food without masticating prey. Bull. Br. Arachnol. Soc. 13, 372–376.
Elser, J. J., Hayakawa, K., and Urabe, J. (2001). Nutrient limitation reduces food quality for zooplankton: Daphnia response to seston phosphorus enrichment. Ecology 82, 898–903. doi: 10.1890/0012-9658(2001)082[0898:NLRFQF]2.0.CO;2
Elser, J. J., Kyle, M., Learned, J., McCrackin, M. L., Peace, A., and Steger, L. (2016). Life on the stoichiometric knife-edge: effects of high and low food C:P ratio on growth, feeding, and respiration in three Daphnia species. Inland Waters 6, 136–146. doi: 10.5268/IW-6.2.908
Elser, J. J., Schampel, J. H., Kyle, M., Watts, J., Carson, E. W., Dowling, T. E., et al. (2005). Response of grazing snails to phosphorus enrichment of modern stromatolitic microbial communities. Freshw. Biol. 50, 1826–1835. doi: 10.1111/j.1365-2427.2005.01453.x
Elser, J. J., and Urabe, J. (1999). The stoichiometry of consumer-driven nutrient recycling: theory, observations, and consequences. Ecology 80, 735–751. doi: 10.1890/0012-9658(1999)080[0735:TSOCDN]2.0.CO;2
Gerendás, J., Zhu, Z., Bendixen, R., Ratcliffe, R. G., and Sattelmacher, B. (1997). Physiological and biochemical processes related to ammonium toxicity in higher plants. Z. Pflanzenernähr. Bodenkd. 160, 239–251. doi: 10.1002/jpln.19971600218
Givan, C. V. (1979). Metabolic detoxification of ammonia in tissues of higher plants. Phytochemistry 18, 375–382. doi: 10.1016/S0031-9422(00)81870-1
Glibert, P. M. (2017). Eutrophication, harmful algae and biodiversity—challenging paradigms in a world of complex nutrient changes. Mar. Poll. Bull. 124, 591–606. doi: 10.1016/j.marpolbul.2017.04.027
Glibert, P. M., Kana, T. M., and Brown, K. (2013). From limitation to excess: the consequences of substrate excess and stoichiometry for phytoplankton physiology, trophodynamics and biogeochemistry, and the implications for modeling. J. Mar. Syst. 125, 14–28. doi: 10.1016/j.jmarsys.2012.10.004
Glibert, P. M., Wilkerson, F. P., Dugdale, R. C., Raven, J. A., Dupont, C. L., Leavitt, P. R., et al. (2016). Pluses and minuses of ammonium and nitrate uptake and assimilation by phytoplankton and implications for productivity and community composition, with emphasis on nitrogen-enriched conditions. Limnol. Oceanogr. 61, 165–197. doi: 10.1002/lno.10203
Hamilton, R. L., and Schal, C. (1988). Effects of dietary protein levels on reproduction and food consumption in the German cockroach (Dictyoptera: Blattellidae). Ann. Entomol. Soc. Amer. 81, 969–976. doi: 10.1093/aesa/81.6.969
Hessen, D. O. (1992). Nutrient element limitation of zooplankton production. Amer. Nat. 140, 799–814. doi: 10.1086/285441
Hessen, D. O., Ågren, G. I., Anderson, T. R., Elser, J. J., and de Ruiter, P. (2004). Carbon sequestration in ecosystems: the role of stoichiometry. Ecology 85, 1179–1192. doi: 10.1890/02-0251
Jennings, J. S., Meyer, B. E., Guiroy, P. J., and Cole, N. A. (2018). Energy costs of feeding excess protein from corn-based by-products to finishing cattle. J. Anim. Sci. 96, 653–669. doi: 10.1093/jas/sky021
Jensen, K., Mayntz, D., Toft, S., Raubenheimer, D., and Simpson, S. J. (2011). Nutrient regulation in a predator, the wolf spider Pardosa prativaga. Anim. Behav. 81, 993–999. doi: 10.1016/j.anbehav.2011.01.035
Jensen, K., Mayntz, D., Toft, S., Clissold, F. J., Hunt, J., Raubenheimer, D., et al. (2012). Optimal foraging for specific nutrients in predatory beetles. Proc. R. Soc. B 279, 2212–2218. doi: 10.1098/rspb.2011.2410
Jensen, K., Simpson, S. J., Nielsen, V. H., Hunt, J., Raubenheimer, D., and Mayntz, D. (2014). Nutrient-specific compensatory feeding in a mammalian carnivore, the mink, Neovison vison. Br. J. Nutr. 112, 1226–1233. doi: 10.1017/S0007114514001664
Kohl, K. D., Coogan, S. C. P., and Raubenheimer, D. (2015). Do wild carnivores forage for prey or for nutrients?: evidence for nutrient-specific foraging in vertebrate predators. Bioessays 37, 701–709. doi: 10.1002/bies.201400171
Kuijper, L. D. J., Anderson, T. R., and Kooijman, S. A. L. M. (2004). C and N gross growth efficiencies of copepod egg production studied using a dynamic energy budget model. J. Plankton Res. 26, 213–226. doi: 10.1093/plankt/fbh020
Laspoumaderes, C., Modenutti, B., Elser, J. J., and Balseiro, E. (2015). Does the stoichiometric carbon:phosphorus knife edge apply for predaceous copepods? Oecologia 178, 557–569. doi: 10.1007/s00442-014-3155-8
Lee, K. P., Raubenheimer, D., Behmer, S. T., and Simpson, S. J. (2003). A correlation between macronutrient balancing and insect host-plant range: evidence from the specialist caterpillar Spodoptera exempta (Walker). J. Insect Physiol. 49, 1161–1171. doi: 10.1016/j.jinsphys.2003.08.013
Lee, K. P., Simpson, S. J., Clissold, F. J., Brooks, R., Ballard, J. W. O., Taylor, P. W., et al. (2008). Lifespan and reproduction in Drosophila: new insights from nutritional geometry. Proc. Natl. Acad. Sci. U.S.A. 105, 2498–2503. doi: 10.1073/pnas.0710787105
Malzahn, A. M., Hantzsche, F., Schoo, K. L., Boersma, M., and Aberle, N. (2010). Differential effects of nutrient-limited primary production on primary, secondary or tertiary consumers. Oecologia 162, 35–48. doi: 10.1007/s00442-009-1458-y
Mattson, W. J. Jr. (1980). Herbivory in relation to plant nitrogen content. Ann. Rev. Ecol. Syst. 11, 119–161. doi: 10.1146/annurev.es.11.110180.001003
Mayntz, D., Nielsen, V. H., Sørensen, A., Toft, S., Raubenheimer, D., Hejlesen, C., et al. (2009). Balancing of protein and lipid intake by a mammalian carnivore, the mink, Mustela vison. Anim. Behav. 77, 349–355. doi: 10.1016/j.anbehav.2008.09.036
Miyamoto, T., and Amrein, H. (2017). Gluconeogenesis: an ancient biochemical pathway with a new twist. Fly 11, 218–223. doi: 10.1080/19336934.2017.1283081
Nyffeler, M., Olson, E. J., and Symondson, W. O. (2016). Plant-eating by spiders. J. Arachnol. 44, 15–27. doi: 10.1636/P15-45.1
Peace, A., Wang, H., and Kuang, Y. (2014). Dynamics of a producer–grazer model incorporating the effects of excess food nutrient content on grazer's growth. Bull. Math. Biol. 76, 2175–2197. doi: 10.1007/s11538-014-0006-z
Peace, A., Zhao, Y., Loladze, I., Elser, J. J., and Kuang, Y. (2013). A stoichiometric producer-grazer model incorporating the effects of excess food-nutrient content on consumer dynamics. Math. Biosci. 244, 107–115. doi: 10.1016/j.mbs.2013.04.011
Piper, M. D. W., Soultoukis, G. A., Blanc, E., Mesaros, A., Herbert, S. L., Juricic, P., et al. (2017). Matching dietary amino acid balance to the in silico-translated exome optimizes growth and reproduction without cost to lifespan. Cell Metab. 25, 610–621. doi: 10.1016/j.cmet.2017.02.005
Plantinga, E. A., Bosch, G., and Hendriks, W. H. (2011). Estimation of the dietary nutrient profile of free-roaming feral cats: possible implications for nutrition of domestic cats. Br. J. Nutr. 106, S35–S48. doi: 10.1017/S0007114511002285
Raubenheimer, D., and Jones, S. A. (2006). Nutritional imbalance in an extreme generalist omnivore: tolerance and recovery through complementary food selection. Anim. Behav. 71, 1253–1262. doi: 10.1016/j.anbehav.2005.07.024
Raubenheimer, D., Lee, K. P., and Simpson, S. J. (2005). Does Bertrand's rule apply to macronutrients? Proc. R. Soc. B 272, 2429–2434. doi: 10.1098/rspb.2005.3271
Raubenheimer, D., and Simpson, S. J. (1999). Integrating nutrition: a geometrical approach. Ent. Exp. Appl. 91, 67–82. doi: 10.1046/j.1570-7458.1999.00467.x
Raubenheimer, D., and Simpson, S. J. (2003). Nutrient balancing in grasshoppers: behavioural and physiological correlates of dietary breadth. J. Exp. Biol. 206, 1669–1681. doi: 10.1242/jeb.00336
Raubenheimer, D., and Simpson, S. J. (2018). Nutritional ecology and foraging theory. Curr. Opin. Insect Sci. 27, 38–45. doi: 10.1016/j.cois.2018.02.002
Raubenheimer, D., and Simpson, S. J. (2019). Protein leverage: theoretical foundations and ten points of clarification. Obesity 27, 1225–1238. doi: 10.1002/oby.22531
Raubenheimer, D., Simpson, S. J., Le Couteur, D. G., Solon-Biet, S. M., and Coogan, S. C. P. (2016). Nutritional ecology and the evolution of aging. Exp. Gerontol. 86, 50–61. doi: 10.1016/j.exger.2016.04.007
Raubenheimer, D., Simpson, S. J., and Mayntz, D. (2009). Nutrition, ecology and nutritional ecology: toward an integrated framework. Funct. Ecol. 23, 4–16. doi: 10.1111/j.1365-2435.2009.01522.x
Raubenheimer, D., Simpson, S. J., and Tait, A. H. (2012). Match and mismatch: conservation physiology, nutritional ecology and the timescales of biological adaptation. Philos. Trans. R. Soc. Lond. B 367, 1628–1646. doi: 10.1098/rstb.2012.0007
Reed, K. F., Bonfá, H. C., Disjstra, J., Casper, D. P., and Kebreab, E. (2017). Estimating the energetic cost of feeding excess dietary nitrogen to dairy cows. J. Dairy Sci. 100, 7116–7126. doi: 10.3168/jds.2017-12584
Remonti, L., Balestrieri, A., Raubenheimer, D., and Saino, N. (2016). Functional implications of omnivory for dietary nutrient balance. Oikos 125, 1233–1240. doi: 10.1111/oik.02801
Robbins, C. T., Fortin, J. K., Rode, K. D., Farley, S. D., Shipley, L. A., and Felicetti, L. A. (2007). Optimizing protein intake as a foraging strategy to maximize mass gain in an omnivore. Oikos 116, 1675–1682. doi: 10.1111/j.0030-1299.2007.16140.x
Rothman, J. M., Raubenheimer, D., and Chapman, C. A. (2011). Nutritional geometry: gorillas prioritize non-protein energy while consuming surplus protein. Biol. Lett. 7, 847–849. doi: 10.1098/rsbl.2011.0321
Secor, S. M. (2009). Specific dynamic action: a review of the postprandial metabolic response. J. Comp. Physiol. B 179, 1–56. doi: 10.1007/s00360-008-0283-7
Simpson, S. J., and Raubenheimer, D. (2012). The Nature of Nutrition: A Unifying Framework From Animal Nutrition to Human Obesity. Princeton, NJ: Princeton University Press. doi: 10.1515/9781400842803
Simpson, S. J., Sibly, R. M., Lee, K. P., Behmer, S. T., and Raubenheimer, D. (2004). Optimal foraging when regulating intake of multiple nutrients. Anim. Behav. 68, 1299–1311. doi: 10.1016/j.anbehav.2004.03.003
Skalli, A., Hidalgo, M. C., Abellán, E., Arizcun, M., and Cardenete, G. (2004). Effects of the dietary protein/lipid ratio on growth and nutrient utilization in common dentex (Dentex dentex L.) at different growth stages. Aquaculture 235, 1–11. doi: 10.1016/j.aquaculture.2004.01.014
Smith, R. L., Soeters, M. R., Wüst, R. C. I., and Houtkooper, R. H. (2018). Metabolic flexibility as an adaptation to energy resources and requirements in health and disease. Endocr. Rev. 39, 489–517. doi: 10.1210/er.2017-00211
Solon-Biet, S. M., McMahon, A. C., Ballard, J. W. O., Ruohonen, K., Wu, L. E., Cogger, V. C., et al. (2014). The ratio of macronutrients, not caloric intake, dictates cardiometabolic health, aging, and longevity in ad libitum-fed mice. Cell Metab. 19, 418–430. doi: 10.1016/j.cmet.2014.02.009
Sperfeld, E., Halvorson, H. M., Malishev, M., Clissold, F. J., and Wagner, N. D. (2016). Woodstoich III: integrating tools of nutritional geometry and ecological stoichiometry to advance nutrient budgeting and the prediction of consumer-driven nutrient recycling. Oikos 125, 1539–1553. doi: 10.1111/oik.03529
Sperfeld, E., Wagner, N. D., Halvorson, H. M., Malishev, M., and Raubenheimer, D. (2017). Bridging ecological stoichiometry and nutritional geometry with homeostasis concepts and integrative models of organism nutrition. Funct. Ecol. 31, 286–296. doi: 10.1111/1365-2435.12707
Speth, J. D., and Spielmann, K. A. (1983). Energy source, protein metabolism, and hunter-gatherer subsistence strategies. J. Anthropol. Archaeol. 2, 1–31. doi: 10.1016/0278-4165(83)90006-5
Sterner, R. W., and Elser, J. J. (2002). Ecological Stoichiometry: the Biology of Elements from Molecules to the Biosphere. Princeton, NJ: Princeton University Press. doi: 10.1515/9781400885695
Ugine, T. A., Krasnoff, S. B., Grebenok, R. J., Behmer, S. T., and Losey, J. E. (2019). Prey nutrient content creates omnivores out of predators. Ecol. Lett. 22, 275–283. doi: 10.1111/ele.13186
Urabe, J., Clasen, J., and Sterner, R. W. (1997). Phosphorus limitation of Daphnia growth: is it real? Limnol. Oceanogr. 42, 1436–1443. doi: 10.4319/lo.1997.42.6.1436
Villalba, J. J., and Provenza, F. D. (1999). Effects of food structure and nutritional quality and animal nutritional state on intake behaviour and food preferences of sheep. Appl. Anim. Behav. Sci. 63, 145–163. doi: 10.1016/S0168-1591(98)00238-X
Wang, C., Zhang, S. H., Wang, P. F., Hou, J., Li, W., and Zhang, W. J. (2008). Metabolic adaptations to ammonia-induced oxidative stress in leaves of the submerged macrophyte Vallisneria natans (Lour.) Hara. Aquat. Toxicol. 87, 88–98. doi: 10.1016/j.aquatox.2008.01.009
Wiggins, W. D., and Wilder, S. M. (2018). Mismatch between dietary requirements for lipid by a predator and availability of lipid in prey. Oikos 127, 1024–1032. doi: 10.1111/oik.04766
Wilder, S. M. (2011). Spider nutrition: an integrative perspective. Adv. Insect Physiol. 40, 87–136. doi: 10.1016/B978-0-12-387668-3.00002-7
Wilder, S. M., Norris, M., Lee, R. W., Raubenheimer, D., and Simpson, S. J. (2013). Arthropod food webs become increasingly lipid-limited at higher trophic levels. Ecol. Lett. 16, 895–902. doi: 10.1111/ele.12116
Williams, C. M., Ragland, G. J., Betini, G., Buckley, L. B., Cheviron, Z. A., Donohue, K., et al. (2017). Understanding evolutionary impacts of seasonality: an introduction to the symposium. Integr. Comp. Biol. 57, 921–933. doi: 10.1093/icb/icx122
Zhang, H., Goll, D. S., Manzoni, S., Ciais, P., Guenet, B., and Huang, Y. (2018). Modeling the effects of litter stoichiometry and soil mineral N availability on soil organic matter formation using CENTURY-CUE (v1.0). Geosci. Mod. Dev. 11, 4779–4796. doi: 10.5194/gmd-11-4779-2018
Keywords: geometric framework, ecological stoichiometry, metabolic penalty, growth efficiency, protein, nutrition, stoichiometric knife-edge
Citation: Anderson TR, Raubenheimer D, Hessen DO, Jensen K, Gentleman WC and Mayor DJ (2020) Geometric Stoichiometry: Unifying Concepts of Animal Nutrition to Understand How Protein-Rich Diets Can Be “Too Much of a Good Thing”. Front. Ecol. Evol. 8:196. doi: 10.3389/fevo.2020.00196
Received: 18 March 2020; Accepted: 29 May 2020;
Published: 24 July 2020.
Edited by:
Bradley S. Case, Auckland University of Technology, New ZealandReviewed by:
Patricia M. Glibert, University of Maryland Center for Environmental Science (UMCES), United StatesMarion Le Gall, Arizona State University, United States
Copyright © 2020 Anderson, Raubenheimer, Hessen, Jensen, Gentleman and Mayor. This is an open-access article distributed under the terms of the Creative Commons Attribution License (CC BY). The use, distribution or reproduction in other forums is permitted, provided the original author(s) and the copyright owner(s) are credited and that the original publication in this journal is cited, in accordance with accepted academic practice. No use, distribution or reproduction is permitted which does not comply with these terms.
*Correspondence: Thomas R. Anderson, tra@noc.ac.uk