Never Ending Analysis of a Century Old Evolutionary Debate: “Unringing” the Urmetazoon Bell
 Bernd Schierwater1,2*
  Peter W. H. Holland3
  David J. Miller4
  Peter F. Stadler5
  Brian M. Wiegmann1,6
  Gert Wörheide7,8
  Gregory A. Wray1,9
  Rob DeSalle10
- 1National Evolutionary Synthesis Center, Duke University, Durham, NC, USA
- 2ITZ Ecology & Evolution, TiHo Hannover, Hannover, Germany
- 3Department of Zoology, University of Oxford, Oxford, UK
- 4ARC Centre of Excellence for Coral Reef Studies, James Cook University, Townsville, QLD, Australia
- 5Bioinformatics Group, Department of Computer Science, and Interdisciplinary Center for Bioinformatics, University of Leipzig, Leipzig, Germany
- 6Department of Entomology, North Carolina State University at Raleigh, Raleigh, NC, USA
- 7Division of Paleontology & Geobiology, Ludwig-Maximilians-Universität München, München, Germany
- 8Bavarian State Collections for Palaeontology and Geology, München, Germany
- 9Department of Biology, Duke University, Durham, NC, USA
- 10Department of Invertebrate Zoology, American Museum of Natural History, New York, NY, USA
Our understanding of the early evolution of animals will be greatly improved if a final solution can be found to the evolutionary relationships between Porifera, Placozoa, Ctenophora, Cnidaria, and Bilateria. There have been many recent attempts to solve this key issue at the base of the metazoan tree of life, and these have sparked heated discussions and highlighted fundamental analytical problems. We argue that solving this problem will necessitate analysis of disparate data types, including phylogenomic data, larger scale genomic characters, developmental data, and morphological characters. At the least, morphological and developmental data must be used to cross-validate phylogenomic conclusions, but ideally solutions should be sought to the problems of combining disparate data sources with appropriate character weighting and algorithm choice.
Introduction
The base of the metazoan tree of life is one of those phylogenetic enigmas that has charm, appeal, and unfortunately elusiveness. While a considerable amount of, in recent years predominantly molecular, phylogenetic information has been collected to address the relationships in this part of the tree of life, there is still a great deal of mystery surrounding relationships at the base of the Metazoa. And hence answering the lingering question “what did the urmetazoon look like?” is still enigmatic.
The five major players at the level of phylum in the quest for the urmetazoon (Porifera [Pf], Cnidaria [Cn], Placozoa [Pl], Ctenophora [Ct], and Bilateria [B]) are more than likely each monophyletic (Schierwater et al., 2009), although there has been some controversy as to whether Porifera are such (Wörheide et al., 2012). So the question becomes a simple five taxon statement with outgroups which are usually Choanoflagellates (C) followed by other unicellular protists (Pr) and Fungi (F). With five taxa, there are 105 discrete fully bifurcating hypotheses that can accommodate the five taxa with an outgroup (Schierwater et al., 2009). Many of these have been discussed (Figure 1) in the context of past research (Collins et al., 2005; Ryan et al., 2013), and the great majority of them can be eliminated on the basis of research over the past two decades. For instance, hypotheses that postulate Porifera as the sister to Bilateria can be rejected soundly based on a number of sources of data. However, there are still a number of hypotheses that linger in the literature, with no single one winning over the majority of researchers (cf. Figure 1).
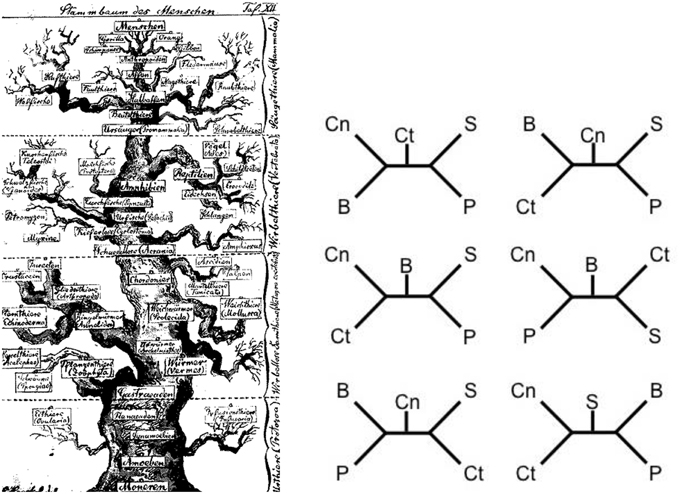
Figure 1. One of the first evolutionary scenarios for the animal tree of life (on the left; Haeckel, 1874) and some current “hypotheses” for the relationships at the base of the metazoan tree of life (on the right; from Schierwater et al., 2009). In the very early days the first metazoan branch harbors the sponges and coelenterates, so do some scenarios on the right. The main difference being that Haeckel drew a very natural looking tree to highlight the speculative nature of the relationships while the modern trees are drawn as distinct linear branching patterns. In the latter the speculative nature often only becomes visible if different trees from different studies are compared, as shown in six examples on the right. Remarkably, all shown scenarios can claim high support values between 90 and 100% for the critical branches. Cn, Cnidaria; Ct, Ctenophora; S, Sponges; P, Placozoa; B, Bilateria.
Several recent studies have presented themselves as authoritative, but we would argue it is too early to be dogmatic since the available data are incomplete and the inferences from them highly sensitive to methodological settings (see e.g., Philippe et al., 2011b and Pisani et al., 2015). A large amount of organismal data suggest what some feel is a clear answer (or a small number of possible answers) but a diversity of molecular data-based analyses gives further possible answers not all of which are obviously compatible with morphological data. While we do not doubt the scientific intention or the methodological and analytical elegance of the studies that have been published in the last 5 years on this subject, we merely point out that no matter how carefully the data are analyzed, interjection of subjectivity1 into the analysis of data has created a shroud of uncertainty on inferences made in this part of the tree of life as pointed out by Siddall (2010), who called this oscillation between championing and then rejecting hypotheses “unringing the bell.” A consequence of this approach is that the most recently published hypothesis in the literature is given much attention and tacitly accepted by many, until a new data set or a reanalysis is published that overturns the reigning champion.
Some of us believe that this approach to science is unfortunate and that a traditional—but slower—approach has its merits. In this approach, a new idea has to be well supported before it can be called a preliminary “working hypothesis.” If this idea subsequently garners additional support from other studies it becomes a “hypothesis.” The difference between the traditional and contemporary use of terminology is substantial, and we note that making the headlines in high-impact journals and media reports would be much harder if one adopts the traditional approach.
In order to understand the dynamics of the current situation, we need to examine what the relevant data are and how different data sets and different analytical approaches can lead to conflicting inferences. We also need to discuss if there ever will be either (a) an unquestioned dataset and analysis, or (b) a middle ground where researchers will settle. Addressing these questions requires that we examine multiple sources of data for two reasons. First, such an examination might tell us why the controversy here is so pointed and sensitive to data input, and secondly to understand why the outcome of major studies addressing this problem are so prone to data handling and analytical approaches. The problem with resolving this part of the tree of life is not an isolated case. Other parts of the tree of life are equally contentious and we hope by placing this problem under the microscope that researchers facing similar phylogenetic/systematic problems will benefit from our discussion.
Crucial Questions
Which Phylogenetic Approach Should We Use?
If we want a solution to the problem of resolving the phylogeny and evolution of non-bilaterian metazoans and their relationships to Bilateria then we will need to play by the “rules” of modern phylogenetics to get to the hypothesis best supported by the data. We need not hash out the controversial nature or philosophical aspects of phylogenetic analysis here, but suffice to say the many variables that can be infused into phylogenetic analyses make the generation of a best supported hypothesis a challenge. At one level, the optimization procedure for constructing the hypothesis can be varied. It is well known that distance, parsimony, likelihood, and Bayesian approaches often times give disparate results. At another level, variables such as outgroup choice, character weighting, character inclusion and exclusion, model parameters, choice of search parameters, and method of assessing robustness all complicate matters greatly. And still at a third level, the argument as to whether data should be concatenated or treated in a coalescent context have crept into the debate about contentious phylogenetic problems (e.g., Edwards, 2009; Gatesy and Springer, 2014). Thus, which phylogenetic approach should we use?
There exist at least two principally different opinions. I. Some say: Since the problems involved in this phylogenetic conundrum encompass a wide array of analytical freedom and uncertainty it seems debatable whether a further increase in any kind of data can solve this century old debate, which could become a touchstone for modern evolutionary biology. II. Others say: While the sophistication and rigor of modern phylogenetics has improved dramatically in recent years, continued theoretical and methodological developments enhance and reveal the limitations in our current interpretation of new and existing evidence. If we succeed with integrating the enormous new data sets from comparative genomics and transcriptomics with other character systems we may solve the current problem.
In either case, a detailed re-examination of the evidence and argumentation surrounding the “elusive urmetazoon” is especially timely and we suggest that a detailed examination of the nuances of our approaches to the elusive urmetazoon is an important step before more data are “thrown” at the problem.
One of the major reasons that certain hypotheses are rejected outright is because they require unique explanations for the repeated origin of complex features. These interpretations can violate preconceived notions of how specific character systems or complexities have evolved. This reluctance to accept a specific hypothesis based on a single character system, like the nervous system, in most cases is logical, but in the light of additional data the logic erodes. In this context we are reminded of an ancient fable that describes six blind men examining the same thing. Each used the sense of touch to gather data about the object. Each came to different conclusions about the thing because they were examining only a small part of the overall object. A snake, a spear, a fan, a tree trunk, a rope, and a wall were the individual conclusions. All made different inferences from their data, all were convinced they were right and all were happy they were right. But by combining their data they came to the correct conclusion that they were indeed confronted with an elephant (the snake was the trunk of the elephant, the spear the tusks, the fan its ears, the tree trunk the legs, the rope the tail, and the wall was the side of the elephant). In short, data combination and cross-corroboration to test for (biological) plausibility seems to be the most reasonable way to approach the problem of the metazoan radiation.
The question then becomes how do we combine the data? Again the controversial nature of this question has been explored in the literature. There are two major approaches to the problem of data combination. Supertree methods involve quantitative meta-analysis of existing trees to come to a consensus on the tree topologies from different studies. Combined data methods simply concatenate existing information into a single large matrix that is then analyzed with one or several optimality criteria. The supertree approach has been criticized at length (Gatesy et al., 2002, 2003, 2004) and so we will not discuss this approach further, although we recognize that this approach is still debated. Within the combined data approach there are two further ways to analyze the combined matrix. The first is the supermatrix approach and the second is the “short cut” coalescence method (Gatesy and Springer, 2014; Springer and Gatesy, 2016) also called concatalescence. The concatalescence method has its problems as outlined by Gatesy and Springer (Gatesy and Springer, 2014; Springer and Gatesy, 2016). So in the opinion of most authors here, the supermatrix concatenation method is what we are left with for the problem of the deep Metazoan relationships.
Which Characters Should We Use?
Concatenation then seems to be the best approach to the problem, but which characters do we concatenate? Philosophically this question seems easily answered—all of the characters should be used (Kluge, 1989). But arguments have been made for a deeper consideration of the “quality” of the characters involved in this problem (Osigus et al., 2013b), especially regarding the potential contribution of systematic error (bias) and random error (noise) in specific character systems (see Whelan et al., 2015a, and references therein).
Some of the character systems that are involved in producing the multiple hypotheses we are faced with are arguments about the origin of complexity. Can evolution produce a jump from a basic and simple bauplan (protists) to a relatively derived and complex bauplan (e.g., sponges or ctenophores)? Related to this issue is whether we need to view evolution as simply the addition of complexity or do we explicitly accept that loss of characters is commonplace in evolution? Concerning complexity, one of the main principles of modern phylogenetics is to minimize interpretations that require independent gain of complex character systems. Cases of secondarily reduced complexity are usually found in derived parasitic or endosymbiontic lineages such as the Myxozoa and Dicyemida (cf. Canning and Okamura, 2004). Another open question concerns the use of key developmental genes as indicators of phylogenetic position, such as the Hox gene system (Kuhn et al., 1999; Schierwater and Desalle, 2001; Kamm et al., 2006; Schierwater et al., 2008) or the mesodermal gene system (Ryan et al., 2013). These approaches will need to be considered if the now classical view of evolution and development, where a genetic toolbox exists in the common ancestor of organisms, is a valid one for this part of the tree of life. With whole genomes exist at the phylum level for all of the five major players in this phylogenetic conundrum one would think that a precise description of the “toolbox” would be possible. And indeed there has been some progress on this front, with comparative gene studies for nervous system genes, Hox genes, and mesodermal genes among many having been established.
For a meaningful comparative biology the integration of comparative data from different fields must be a conditio sine qua non. Presently, however, mostly analyses of large DNA sequence data sets (“quantitative” phylogenomics data) make the headlines (e.g., Maxmen, 2013), while so-called “qualitative” characters, like development or morphology, are seemingly outnumbered by sequence data. Thus, the question arises whether one can give adequate relative weight to the different characters in concatenated analyses (Osigus et al., 2013a). One might argue that an A vs. a C in position 431 in the HSP 70 gene should be given less weight than the presence vs. absence of a nervous system or a coelom. But how much less? Furthermore, should gain of a qualitative character be weighted the same as loss of that character? For some researchers, however, character weighting is not an issue. They argue that there are many ways to include, exclude or compare the results of data elements and warn against hallowed interpretations of morphological features. Most researchers admit that it is a limitation of our current methods that we cannot combine radically different data types in an agnostic way.
Complex (“Qualitative”) Characters
Morphological Characters
Anatomical and developmental characters are always outnumbered by molecular characters and at the base of the metazoan ToL this observation reaches it's peak. Here morphology is very different between the key taxa under consideration, and was “frozen” as very subtle and un-interpretable anatomical changes occurred. Hence we are left with very few shared anatomical characters to analyze. In contrast, the more derived Bilateria invented a third germ layer, a centralized nerve cord and a through-gut, which together fueled an explosion of bauplan radiation and new, informative, anatomical characters. But even here the molecular characters outnumber morphological characters by several orders of magnitude. In recent phylogenetic analyses investigating the base of the animal ToL we find several analyses using thousands or even tens of thousands of sequence characters and just one analysis that also includes morphological characters, which number 17 altogether (Schierwater et al., 2009). It is hard to see that we will gain significant amounts of additional morphological characters in the future and it is unclear whether we will ever agree on a rule for weighting morphology for such morphological data to become relevant for the analyses. As it is currently, it comes as no surprise that molecular phylogeneticists usually do not bother to include morphological characters in their analyses (as an exception see O'Leary et al., 2013).
This does not mean, however, that morphological characters are irrelevant. It seems logical to us that, at the very least, one should reflect morphology onto a tree and cross-validate hypotheses derived from phylogenomic data for biological plausibility, in order to detect “non-sense” scenarios. One intriguing example for biological “non-sense” might be putting ctenophores within Ecdysozoans based on the analysis of near intron pairs (Lehmann et al., 2013) as well as the sister to the remaining metazoans (Whelan et al., 2015b). A comparative zoologist immediately shakes his or her head here and ignores the result. Most molecular systematists will do so too, but there is a danger of some becoming excited by the attractive prospect of upset dogma.
Next Generation Progress
Progress seems possible only if (a) the developmental genetics underlying morphological traits are understood in some detail, and if (b) the problem of character weighting is resolved in a way that morphological and developmental characters receive appropriate value. Some authors, however, may argue that we do not need a weighting scheme and instead should evaluate independent sources of evidence on their own merits. But what do we do if independent sources support different phylogenetic hypotheses? It is hard to see that we can escape any comparative evaluation approaches. Wishful thinking would be that we unravel the multi-dimensional genetics behind every relevant morphological structure, quantify this genetics, score it in a character-based matrix, and weight each such character relative to DNA or protein sequence data. Given the exponential increase in transcriptome data from tissues or even single cells we may indeed expect future progress here. On the other hand, if we have such functional genetics data, we may no longer need large sequence matrix-based molecular trees.
EvoDevo Data
According to Ernst Haeckel's biogenetic rule—no matter how much of a simplification it might be—comparative developmental data provide some of the strongest “qualitative data” available to resolve phylogenetic relationships. Many studies on bilaterian animals have emphasized this. At the base of the metazoan ToL, however, comparative EvoDevo from at least two of the four diploblast (i.e., non-bilaterian) phyla are cum grano salis missing. Furthermore, the shared pool of homologous morphological characters between these phyla is highly limited. For example, the most simple metazoan animal bauplan, that of Placozoa, hardly has any of the typical metazoan characters (e.g., placozoans lack a main body axis, organs, endoderm, basal lamina, and extracellular matrix) and there are no morphological indications that these animals may be secondarily reduced (simplified) (c.f. Schierwater, 2005; Srivastava et al., 2008; Schierwater et al., 2010).
Next Generation Progress
The expected progress here will be connected to the expected progress on developmental and morphological data (see above). In the not too far future we may expect to see detailed spatio-temporal maps of gene networks encoding for all principle morphological structures. Such maps will certainly contribute enormously to questions of homology and maybe also open new avenues for character weighting.
The Fossil Record
At the base of the metazoan tree of life few groups had evolved hard structures necessary for extensive fossil records, although the rare preservation of soft part fossils in certain Cambrian and Ediacaran sediments allows for some paleontological data. Since major groups and even phyla have largely escaped the fossil record, such as the Placozoa and Ctenophora during large parts of the Paleozoic, these data are of little value to reconstruct phylogenies and consequently we leave them out here. However, the (even sparse) fossil record can be of prime importance for the temporal resolution of deep clade divergences using a molecular clock approach (reviewed in Wörheide et al., 2015). In addition, further careful analysis (or rather re-analysis) of Ediacaran and Cambrian fossils may yet give clues to ancestral character combinations.
Molecular Morphologies
Genomic and transcriptomic data give many opportunities for comparative analysis beyond inference of single nucleotide substitutions in homologous genes, the method that lies at the core of most current phylogenomic approaches. Larger-scale differences between genomes, for example gene losses, gene duplications, gene fusions, changes to physical gene order, intron position differences, and indels causing structural changes to genes, are all possible sources of data that could provide useful phylogenetic characters. To-date, few robust analytical methods have been developed for data such as these, and they have rarely been exploited systematically, apart from some analyses of gene loss data (which we discuss separately, see below). Secondary structure attributes within ribosomal genes were among the first “molecular morphology” characters used in phylogenetic analyses of Metazoa (Ender and Schierwater, 2003; Edger et al., 2014), but while it is comparatively easy to identify such characters it is clearly not straightforward to score them in a character matrix. The transition between states usually occurs on a continuous scale making the division of discrete character states difficult to delimit. Furthermore, the number of characters generated by secondary structure analyses of ribosomal genes is usually low and thus faces similar problems as other quality data, i.e., they are easily outnumbered by primary sequence data. Other sorts of molecular data, such as gain or loss of genes or introns, provide discrete character states and it should be more straightforward to develop analytical methods.
Gain and loss of introns are phylogenetically informative (Venkatesh et al., 1999; Roy and Irimia, 2008), unless multiple independent gains and losses occur. To alleviate this issue at least in part, Near Intron Positions (NIPs) have been proposed (Krauss et al., 2008) as a relatively homoplasy-free marker. Since exons separating two introns need to have a minimum length, two very close introns cannot coexist in the same sequence so that one has to be lost before the other is inserted, thus establishing a temporal ordering. While NIPs seem to work very well at phylum level, an application to the base of the metazoan tree (Lehmann et al., 2013) was unable to resolve the deepest nodes. Gains of novel genes may be similarly useful, yet difficult to analyze as systematic characters due to homoplasy problems (Rosenfeld and DeSalle, 2012). A recent systematic study, furthermore, reports widespread recurrent evolution of diverse genomic features (Maeso et al., 2012), hinting at so far poorly understood mechanisms of genome evolution that need to be understood before the phylogenetic use of molecular morphologies can be widespread.
From a practical point of view, the community lacks efficient and easy to use computational pipelines to extract molecular/morphological characters from genome and/or transcriptome data that would us to refine and extend published pilot studies in the light of the rapidly increasing set of taxa for which massive NGS data are becoming available.
Next Generation Progress
The exponential increase in sequence data will lead to an exponential increase in data on molecular morphologies. Clearly these data will be valuable once the computational progress to extract and analyse the information from WGSs has been made.
Gene Loss Data
Gene loss data should harbor some of the most robust phylogenetic information (Sharma et al., 2014). Loosing a gene is commonplace in evolution and it seems to have happened regularly in nuclear and most often in mitochondrial genomes. On the other hand, regaining a gene that has been lost before seems to be cum grano salis impossible. We are not aware of a single example that has occurred other than by lateral transfer or gene duplication (both of which are readily recognized). Strong gene loss data will always be outnumbered by other kinds of DNA sequence data but even so they might provide high quality “qualitative characters.” Application of gene loss analysis to mitochondria revealed that the gene-rich mitochondrial genomes are found in placozoans and sponges, and that during course of anagenetic (apomorphic) evolution mitochondria appear to have lost more and more genes until they reached the smaller size seen in ctenophores, cnidarians, and bilaterians. This could have phylogenetic implications, if the probability of shared vs. independent gene loss was better understood, but already there are indications that independent loss of the same genes can occur in different lineages (Lavrov, 2007). Some mitochondrial genomes in calcareous sponges and hydrozoans are linearized and fragmented which also makes phylogenetic interpretation difficult (Voigt et al., 2008; Lavrov et al., 2013). Moving to gene loss in nuclear genomes, the interpretation of comparative data relies on accurate gene models to identify genes in the first place, and robust clustering to identify orthologous genes (Rosenfeld and DeSalle, 2012). Both problems are solvable, but not as straightforward as they sound. Ryan et al. (2013) attempted to test claims of a sister group relationship of Ctenophora to the remaining metazoans (the “Ctenophora-sister” hypothesis) with analysis of a gene presence/absence matrix. However, the analysis failed to resolve some monophyletic groups within Bilateria, such as Annelida and Chordata (see their Figure 2). Pisani et al. (2015) reanalyzed this dataset and corrected for ascertainment bias and were able to reconstruct a phylogeny from this data where Annelida and Chordata were recovered as monophyletic, including Porifera as the sister group to the remaining animals. This suggests that the very difficult methodological problems have not yet been fully overcome.
Next Generation Progress
The number of annotated whole nuclear genomes has increased substantially and will continue to do so rapidly that in theory the potential information on gene losses in taxa should be commonplace. If we can identify and eliminate artifacts of incorrect gene assignment, missed annotations and homoplasy, and if we accept that regaining a formerly lost gene is cum grano salis impossible (by using for example Dollo parsimony or some likelihood model that accommodates this rule), we expect some major contributions from such data to our century old debate. The problem of objective weighting of such characters in phylogenetic analysis will also need tackling, but the potential of gene loss data (and probably other large genomic changes) is clear.
MicroRNAs
MicroRNAs are among the most conserved genetic elements in Bilateria. As a key component in virtually all gene regulatory networks they are deeply linked to lineage-specific adaptations and morphological innovations (Heimberg et al., 2008; Tarver et al., 2013). A least in the Metazoa they fall into hundreds of groups of evolutionarily unrelated groups (Kozomara and Griffiths-Jones, 2014) that in most cases originated de novo from transcribed regions (Hertel et al., 2006; Prochnik et al., 2007). They have been advocated as excellent, nearly homoplasy-free genetic markers and have been claimed to resolve several clades in the ToL (Wheeler et al., 2009; Campo-Paysaa et al., 2011). Nevertheless, microRNAs are not the near-perfect markers for which they are sometimes taken. In some cases they have diverged beyond the point where homology is readily recognized (Schyth et al., 2015). Several clades, in particular Urochordata (Fu et al., 2008) and Platyhelminthes (Fromm et al., 2013), have undergone a massive restructuring of their microRNA repertoire. Recent quantitative studies (Thomson et al., 2014; Hertel and Stadler, 2015) show that loss of microRNAs, including loss of entire families, is not a rare process in metazoan evolution.
Whilst miRNAs are useful for resolving some phylogenetic issues within the Bilateria, their usefulness is far more restricted in non-bilateria. Indeed, animal-type miRNA processing is most likely restricted to bilaterians. Cnidarians have plant-type miRNA pathways (Moran et al., 2013, 2014) and the miRNA machinery is completely absent from Ctenophora (Maxwell et al., 2012) and Placozoa (Hertel et al., 2009; Wheeler et al., 2009). Plant-type miRNA systems have high target specificity and fewer targets and hence may be subject to high evolutionary turnover.
Individual miRNA families therefore may not by conserved beyond closely related early-branching metazoan taxa. Consistent with this, there is no evidence for conservation of miRNA repertoires across major lineages of Porifera (Robinson et al., 2013). MiRNAs are unlikely, therefore, to contribute to resolving the first steps in animal evolution.
Gene Families and Organization
Large and complex groups of genes (superclasses) can provide suites of phylogenetic markers of the types discussed earlier (gene gains, gene losses etc.). Since some well characterized groups of genes, such as homeobox genes, have pivotal roles in development of animal body plans, some of these genomic changes may even be related to morphological change. Complex gene superclasses deserve attention here, therefore, as characters that may give insight not just into phylogeny but possibly also into character evolution. One of the most exciting and intriguing examples for evolutionary relevant genes are in the ANTP class of homeobox genes, which directly link genetic change to bauplan development and transformation and to some degree also allow insight into major evolutionary events (Holland, 2013). The study of the evolution of the structure, genomic organization, and developmental functions of these clustered genes seems straightforward and informative, yet this is somewhat deceptive. Differing interpretations of gene identities and functions make for controversial discussions. Nonetheless, these genes are prime examples if modern genetic qualitative characters and thus deserve a full discussion and are used as the Rosetta Stone example here.
The Origin of Hox Genes and Axial Patterning
The discovery that Hox gene organization, expression, and function is similar between animals as different as insects and vertebrates constitutes one of the most significant discoveries in twentieth century biology (McGinnis and Krumlauf, 1992). It is now clear that the common ancestor of Ecdysozoa, Lophotrochozoa, and Deuterostomia possessed a single genomic cluster of around 10 Hox genes, almost certainly expressed following a spatial colinearity rule and acting to encode and specify position along the anteroposterior axis of the developing embryo. But questions remain. Are Hox genes a character shared by all animals, as proposed 20 years in a speculative concept known as the zootype (Slack et al., 1993)? If not present in all animals, have they been lost in some lineages? In animals possessing Hox genes, are they always deployed in axial patterning or was this role acquired sometime later? How do Hox gene functions relate to roles of ParaHox genes and other related homeobox genes?
Genes containing a homeobox sequence, encoding proteins with a homeodomain, are found across eukaryotes. They can be divided into several gene classes (11 in animals), with the ANTP and PRD classes found in all animals examined, but not in any other taxa studied to date (Galliot et al., 1999; Banerjee-Basu and Baxevanis, 2001; Holland, 2013). The ANTP class is particularly diverse, including Hox genes, ParaHox genes, NK-like genes, and several other homeobox genes. Current genome data suggest that although ANTP class genes are present in all animals, Hox genes specifically are not. Hox (and ParaHox) genes have not yet been found in sponges or ctenophores, although these animals do have NK-like homeobox genes (Larroux et al., 2007; Ryan et al., 2010) [but see Fortunato et al. (2014) who claim to have identified a ParaHox-like gene in sponges, although the divergence of this sequence forces the need for considerable caution in this interpretation]. The subject of whether cnidarians possess true Hox genes remains controversial, analysis of genome synteny suggesting that Nematostella vectensis has a set of genes Hox genes, many of which are the result of independent duplications, and a separate set orthologous to ParaHox genes (Kamm and Schierwater, 2006; Kamm et al., 2006; Ryan et al., 2006; Hui et al., 2008). The simplest explanation of these data is that the oldest ANTP class genes are the NK-like homeobox genes, which date to the origin of animals, and that the Hox and ParaHox genes arose rather later in evolution by tandem duplication and divergence from NK-like genes (Castro and Holland, 2003; Larroux et al., 2007; Schierwater et al., 2008). In this scenario, the birth of Hox genes occurred in the evolutionary lineage leading to cnidarians and bilateria ns, after this lineage had diverged from sponges and ctenophores. The placozoan Trichoplax adhaerens could occupy a pivotal position in this important evolutionary transition, because current data indicates it contains just a single Hox/ParaHox-related gene, Trox-2 (Schierwater and Kuhn, 1998; Monteiro et al., 2006; Schierwater et al., 2008; Srivastava et al., 2008). This gene has a protein sequence similar to the ParaHox gene Gsx, but could conceivably be representative of the elusive progenitor gene, ancestral to Hox and ParaHox, denoted the ProtoHox gene.
Putting these findings together, the “zootype” concept can now be defined more concisely. One approach is to base it on the presence of ANTP class genes, but not Hox genes specifically. To confirm or refute the degree to which the information for these genes would map onto the origin of the Metazoa, more data are needed on homeobox gene diversity in non-animal taxa near the base of the Metazoa, as well as in a broader diversity of sponge, ctenophore, and placozoan species. If the phylogenetic position of placozoans proves to be more basal than sponges or ctenophores, or indeed in a clade with all diplobastic animals, then this scenario would need modification. However, another approach is simply to recognize the zootype concept as applying to the Bilateria rather than the Metazoa as a whole. In this case, the original concept needs no modification, just its phylogenetic scope. Either way, the complement and arrangement of homeobox genes in diploblasts provide insights into the evolutionary origins of the unique genomic organization and developmental roles of homeobox genes that make up the zootype concept.
Absence of a gene or genes can reflect the primitive condition, or it can result from gene loss. Some cases of incomplete Hox clusters almost certainly represent secondary losses because they occur in taxa that are embedded in clades with fuller clusters. Several examples are well documented in insects and nematodes (Aboobaker and Blaxter, 2003a,b). Similarly, many specific paralog absences within the vertebrates are almost certainly cluster-specific losses following whole-genome duplications (Pascual-Anaya et al., 2013).
At present, it is much more difficult to interpret cases where the full complement of Hox genes is not present in diploblasts because there is no clear way to reconstruct the ancestral condition. It has recently been argued that the absence of Hox and ParaHox genes in sponges is a secondary condition, and that the Trox-2 gene of Trichoplax is a ParaHox gene with placozoans having lost Hox genes (Mendivil Ramos et al., 2012). The theory is based on “so-called” ghost loci: genomic regions syntenic to locations containing these genes in other taxa. If true, this conclusion would push back the origin of Hox genes to the base of the animal kingdom, and resurrect the original zootype concept (Slack et al., 1993). However, the claim is controversial and alternative interpretations of the data should also be considered. For example, if duplications of homeobox genes were not coincident in time with generation of the neighbor genes, empty pseudo-syntenic regions could exist before new homeobox genes were transposed to these locations. This controversy clearly needs resolution, and that will require high-quality genome assemblies from taxa representing additional diploblast lineages and close relatives of the Metazoa. For now we put greater weight on the phylogenetic distribution of genes, described above, which suggests that while ANTP class genes date to the base of animals, Hox genes exist only in cnidarians and bilaterians.
Possession of a gene in one species does not necessarily imply it performs the same role as in another. This is particularly true for genes encoding transcription factors, since downstream targets and thus biological function can readily change in evolution. Do Hox genes play the same role in cnidarians and bilaterians? This too has proved a controversial question, and a difficult one to answer. Early indications based on gene expression in Nematostella vectensis suggested that Hox genes were expressed in regional domains along the oral-aboral axis of the polyp (Finnerty et al., 2004), implying that the sea anemone oral cavity was at the homologous end to the bilaterian mouth. However, the pattern does not apply to all Hox genes. Furthermore, Wnt expression, which is a definitive posterior marker in bilaterians, is also expressed in the oral cavity, suggesting the opposite orientation. Compounding the uncertainty, differences also exist between cnidarian species. The diversity of Hox gene expression pattern seen in different cnidarians also seems counter to a conserved role in axial patterning, as does an apparent lack of conserved clustering; thus the working hypothesis must be that Hox genes do not perform the same role in cnidarians as in bilaterians. Thus, Kamm et al. (2006) argued that the “Hox system” does not exist in cnidarians, a term that was used to encapsulate gene function rather than simply gene presence.
Returning to Hox genes of Bilateria, where a role in anteroposterior patterning is uncontroversial, brings up another question. If Hox genes originated from within the ANTP class, how do their functions relate to those of other ANTP class genes? Within this homeobox class, the majority of genes fall into the Hox, ParaHox, and NK-like genes. All ANTP class genes play roles in development, but at first glance the range of roles is both diverse and puzzling. One model to make sense of the apparent confusion notes that Hox, ParaHox, and NK genes are each found in gene clusters in bilaterians, with each predominantly active in a different germ layer of the bilaterian embryo. Thus, Hox genes primarily pattern ectoderm including neural tissue (though mesodermal roles have been added in insects and vertebrates), NK-like genes predominantly pattern mesoderm, and ParaHox genes play roles in the gut (although a role in the mouth has been lost in chordates). Once again, more data are needed from a range of taxa, but it is at least plausible that the ANTP class genes in bilaterians were recruited to pattern the diversity of germ layer derivatives (Brooke et al., 1998; Holland, 2001, 2013; Jagla et al., 2001).
Sequence (“Quantitative”) Characters
With the advent of molecular systematics based on gene sequences (or rather, based on modeling nucleotide substitutions between gene sequences) came the revolution and explosion of new phylogenetic trees in all areas of the ToL. For many taxa, molecular systematics has resolved crucial genealogies and provided new insights into phylogenetic relationships that could not be resolved from morphological data alone [e.g., Wörheide et al. (2012) for Porifera, Eitel et al. (2014) for Placozoa]. At the same time molecular systematics gave birth to some of the most short-lived hypotheses ever seen in biological sciences. For some taxa more than a dozen different trees were published in just a few years, i.e., more than 90% of published “tree hypotheses” were called “wrong” within a few months—the Mollusca are a prime example here (Schrödl and Stöger, 2014). Nonetheless, the various wrongs should not overshadow the spectacular advances that have been made, many of which have stably changed our view of animal evolution—at least within the Bilateria.
The even more recent technical revolution in DNA sequencing has sparked yet another dimension of “quantitative” data, the generation of whole genome sequences in high-throughput. The value of such data will also depend on future progress in bioinformatics handling huge and diverse datasets.
Gene (or Protein) Sequences of Selected Sets of Genes
Without doubt, parallel revolutionary advances in DNA sequencing technology, computational informatics, and phylogenetic methods have enabled rapid progress toward resolving historically challenging areas of the tree of life. Relationships within and among major animal phyla for example have had a similar history of data conflict, partial resolution, and authoritative debate as is detailed above for just the metazoan base (Halanych et al., 2002; Dunn et al., 2008; Campbell et al., 2011; Giribet and Edgecombe, 2012; Nosenko et al., 2013). Early molecular systematic approaches based on PCR amplification of one or a few genes demonstrated (after 20 years of effort) that sampling, choice of genes from among a very limited set, and inadequacy of analytical strategies to account for the effects of model misspecification and/or systematic error accounts for much of the overconfidence placed on any individual smaller study. In recent years, phylogenomic studies allowing simultaneous analysis of hundreds to thousands of gene sequences have dramatically reduced the viable alternatives in consideration for relationships among animal phyla (Dunn et al., 2008; Evans et al., 2010; Philippe and Roure, 2011; Philippe et al., 2011a,b; Bernt et al., 2013a,b), arthropod classes (Meusemann et al., 2010; Regier et al., 2010), and insect orders (Misof et al., 2014), and many other diverse animal (Dunn et al., 2014) and plant (Ruhfel et al., 2014; Wickett et al., 2014) clades. For example, debate over the position of Arthropoda in the animal tree has subsided with genomic data sets supporting Ecdysozoa (Dopazo and Dopazo, 2005; Dunn et al., 2008; Telford et al., 2008; Giribet and Edgecombe, 2012) a group uniting Arthropoda and their extant relatives (Onychophora, Tardigrades) with Nematoda and closely related worm phyla (Nematomorpha, Priapulida, Kinorhyncha, Loricifera). Here, genomic analyses confirm emphasis on shared possession of a molted cuticle over earlier hypotheses that stressed body segmentation of annelids and arthropods. As the complexities of bodyplan evolution are understood in the context of detailed morphology and development, superficial, or limited morphological explanations can be legitimately set aside. The sheer diversity of body forms, complex appendages, lineages, and habits among arthropods made a fully resolved phylogenetic understanding of the major clades an unrealistic dream until just the last few years. Phylogenomic data sets now confirm the monophyly of Pycnogonida, Euchelicerata, Myriapoda, and Mandibulata, and within the latter clade, firmly places the Hexapoda (Insects) within the Tetraconata or Pancrustacea, a view that challenges earlier classifications that would maintain traditional boundaries among major arthropod classes, but is as yet unresolved with respect to the best supported pancrustacean sister-clade for Hexapoda (Giribet and Edgecombe, 2012; Oakley et al., 2013). Insect order-level phylogeny has seen rapid clarification of long-standing controversies over the relationships of the earliest extant insect lineages, the origin of winged insects, the relationships among the polyneopteran orders, and the origin and relationships of the holometabolan orders (Misof et al., 2014; Peters et al., 2014). While these new datasets are enormous and emphasize genetic evidence, their interpretation and analysis in the context of morphological and macroevolutionary evidence provides an example of how data combination and integration of multiple sources of evidence can flourish in a fully integrated phylogenomic research program. Unfortunately, all the above remarkable examples from arthropods and other Bilateria groups do not find any match if it comes to the base of the metazoan ToL and to resolve the relationships between the five diploblast phyla.
Whole Genome Sequences (WGSs)
We suggest that the number of annotated whole genomes from diploblastic animals is insufficient for comparative studies, but we anticipate this will change soon (see below).
Next Generation Progress
This new phylogenomic era of large molecular systematics datasets is fueled by the availability of full genomes from diverse lineages. A rich portfolio of methods of has become available to determine orthology and curated (taxonomically organized) databases make gene histories available for an increasing collection of genomes [e.g., orthodb.org; phylomedb.org; orthologID (Chiu et al., 2006)]. The methods to identify orthology fall into two broad classes with comparable overall accuracies (Altenhoff and Dessimoz, 2009): Many tools start from preliminary estimates of gene trees and species trees and estimate a reconciliation map that defines for each node in the gene tree whether it corresponds to a duplication or speciation node. The second class of tools estimates orthology directly from pairwise comparisons using various refinements of the pairwise best-hit heuristic (Kristensen et al., 2011; Dalquen et al., 2013).
The groups of 1–1 orthologs that are of particular value for phylogenetic reconstruction are obtained as a special case. Even though only a moderate fraction of genes falls into groups of 1–1 orthologs, at the phylogenetic depth of Metazoa, analyses can reach a size far beyond the asymptotic certainty level for phylogenetic reconstruction reached in simulations (or analyses of sequences from full genomes). Recent advances in phylogenetic combinatorics suggest that it might even be feasible to include paralogs in a systematic manner into phylogenetic analysis provided the duplication history of a gene family can be well resolved (Hellmuth et al., 2015).
Expanding genomic resources also allows a conservative approach to using gene harvests with filtering strategies designed to include only single-copy orthologs and thereby significantly reducing noise contributed by paralogs and the complexities of gene family evolution. Computational methods used to assemble, filter, align, assess information content, and apply evolutionary models to ever-more complex assessments of data partitions, make it possible to apply computationally complex analytical approaches to enormous and complex sets of genes, proteins, domains, or in fact, whole chromosomal regions. However, massive sequence data still harbor peculiarities, which are not fully understood and often even the best-fitting evolutionary models might not be able to model the true properties of the data (Philippe et al., 2011b; Nosenko et al., 2013). Many more conceptual and theoretical developments are needed (Philippe and Roure, 2011). Currently these phylogenomic approaches are most feasible for large community-level research collaborations (Jarvis et al., 2014; Misof et al., 2014), but as implementation and customization of analysis pipelines become more standardized and widely feasible, we envision a new molecular systematics that is fully “comparative genomic” that will provide a more robust phylogenetic framework for contextualized EvoDevo, for increasingly precise morphological interpretations, and macro-evolutionary hypothesis testing at an unprecedented scale and resolution.
Suggestions for Future Approaches
Pessimists say we will never be able to resolve the base of the animal tree, no matter how many genomes we sequence and how many ontogenies we describe. Optimists say, NGS and bioinformatics alone or even EvoDevo alone can eventually resolve the question. Here is what we suggest as a way forward.
As a starting point we need to examine possible rules for the variables involved in the phylogenetic analysis of this difficult problem (see Table 1). By discussing the variables and their possible standardization we hope to not only demonstrate the nuances of the phylogenetic approach to this problem, but to also offer suggestions for how to approach this problem.
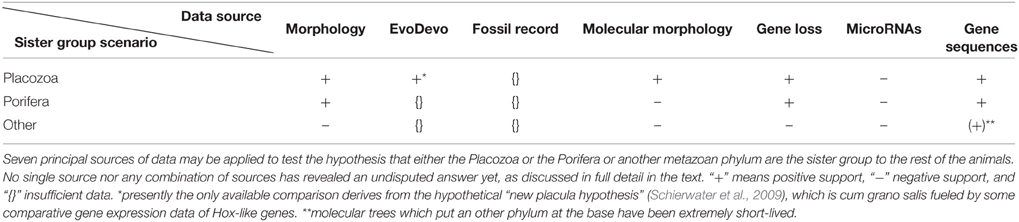
Table 1. Data sources for resolving the root of the metazoan ToL.
Outgroup choice is the easiest and most obvious variable to standardize. Classical notions about outgroup choice logically recommend that multiple outgroups be used and that these outgroups be chosen to be as close to the ingroup as possible. In addition, for genome level data, it has been shown that the further the distance of the outgroup from the ingroup, the more phylogenetic incongruence one will see (Rosenfeld et al., 2012; Tian and Kubatko, 2014) in genome level and individual gene analyses. So outgroup choice for this problem is not trivial. Studies have often used choanoflagellates as the most logical outgroup, and this is most likely a defensible choice, but choanoflagellates are often compositionally heterogeneous in their amino acid composition (Nosenko et al., 2013) which can be a problem for model choice. But what else is down there to do the rooting? The answer is basically only organisms that are further away from the ingroup. A coarse view of this part of the tree of life indicates that choanoflagellates, fungi, and several amoebozoan taxa are the major branches in succession from metazoans. We do not recommend going too far away from the ingroup and so Fungi and Amoebozoa seem to us to be poor choices for outgroups to the metazoan problem. However, there are other organisms closely related to choanoflagellates and metazoans, and these offer good opportunities for additional outgroups. Specifically, the Filasterea (e.g., Capsaspora owczarzaki and Ministeria vibrans), the enigmatic Corallochytrium limacisporum and the Mesomycetozoea (Ichthyosporea) seem to be successfully more distant outgroups to the choanoflagellate plus Metazoa clade (Shalchian-Tabrizi et al., 2008; Paps et al., 2013). Currently, two choanoflagellate species (Monosiga brevocollis and Salpingoeca rosetta) have full genome sequences (King et al., 2008; Fairclough et al., 2013) and the filasterean Capsaspora owczarzaki has been sequenced (Suga et al., 2013). Adding a Mesomycetozoea and more Filasterea should be an immediate priority for outgroup analysis of this problem.
Taxon sampling is also a very straightforward problem for this question. Most of the taxon sampling done to date for the question has been careful and comprehensive. Obviously multiple representatives of the five taxa involved in this problem are desirable. Any of the ingroups (Bilateria, Ctenophore, Cnidaria, Placozoa, and Porifera) that have deep basal members should be especially scrutinized, as these taxa will have a profound impact on the overall hypothesis. For instance, most studies have used a single representative for the Placozoa because its taxonomic status was long thought to be that of a monospecific phylum. It is now evident that this phylum is quite diverse (Voigt et al., 2004; Eitel and Schierwater, 2010; Eitel et al., 2013) and addition of as many lineages of this group as possible is needed. Another aspect of taxon sampling that has been a major part of approaches to this problem is the exclusion of taxa from the analysis because of poor “behavior” of the taxon under certain model criteria. Obviously if the inclusion of one of these “rogue” taxa causes a problem with well accepted taxonomic notions of the groups involved in the study then the inclusion of this taxon should be scrutinized.
Analytical considerations are more difficult to standardize because of the philosophical differences that are fundamental to the different methods. At the risk of oversimplifying the problem we suggest that there are two dimensions to the analysis problem. On one axis we suggest that there is controversy over whether to use a supermatrix (concatenate) or to create a supertree. On the other axis are the different methodological approaches—Parsimony, Likelihood, Bayesian methods (especially if multiple types of data are used). Alternatives to the super matrix approach exist and do show some promise in resolving difficult short internode problems. von Haeseler (2012) has made the most recent arguments that supporters still hold importance in modern phylogenetic analysis and others have suggested short cut coalescent methods that on the surface appear to be useful (Liu et al., 2009a,b; Song et al., 2012). In addition super network approaches have also been suggested to be useful (Leigh et al., 2011; Grünewald et al., 2013). However, we suggest that because of problems with concatelesence (supertree approach or shortcut coalescence) as pointed out by Gatesy and Springer (2014) (Gatesy and Springer, 2014; Springer and Gatesy, 2016) we suggest that concatenated supermatrix approaches be favored for this specific phylogenetic problem and the first axis of the analysis space be narrowed to concatenated approaches. This seems to be the way that most researchers are approaching this specific phylogenetic problem (e.g., Nosenko et al., 2013; Moroz et al., 2014; Whelan et al., 2015b). However, some authors also suggest that data such as morphological, molecular morphological, gene presence or absence, developmental data etc. be concatenated too, (Lienau and DeSalle, 2009; Schierwater et al., 2009). Through concatenation we get a better picture of the overall contribution of different sources of data to a phylogenetic hypothesis, although there is still a major problem of how to adequately partition the data sets and apply appropriate weighting and models of evolutionary change.
This leaves us with the parsimony, likelihood, Bayes axis, to deal with. Because each of these approaches makes different assumptions and accommodates different nuances of data, some of us suggest that accomplishing all three approaches be the standard for studies that approach this problem. Cross comparison of the results from the different analyses might be useful in assessing the assumptions made for the analysis, with unweighted parsimony being used as a baseline or starting point (less assumption laden but poorly parameterized), even if people disagree about the usefulness when it comes to the non-bilaterian root of the ToL. Likelihood and Bayesian analysis can then be used to see how parameterizing the analysis impacts tree topology. The best we can do here is control the parameters that go into the analyses and keep track of them. The repeatability of the analyses is very important. Models need to be assessed for their appropriateness in a ML framework (MODELTEST; Posada and Crandall, 1998; Posada, 2003) or by Bayesian cross-validation (see Pisani et al., 2015; if one does not simply wants to use CAT or CAT-GTR models). The most critical aspect of this axis is simply keeping track of the manipulations accomplished and to not simply jump from one point in the analysis space to another. So for instance if one settles on a Bayesian analysis with removal of specific taxa, then the full course of analysis that led to the choice of the final approach be clear.
Perhaps our goal should not be to determine which of the 105 topologies for this five taxon study is the optimal for isolated data sets and analyses. Rather we should probably be thinking about how the different kinds of data impact the reconstruction of the relationships of these five major groups of animals on the planet. The best way to do this is to concatenate and sort out their impacts using partitioned analysis (Gatesy and Springer, 2014). Once we have determined the impacts of the various kinds of data and analyses we have directed at this question, then we can better understand why a certain degree of chaos has existed in reference to this metazoan mess. We suggest it has in the past been unavoidable for approaches and solutions to this fascinating question about life on our planet to be a bit chaotic. One of the goals of this paper is to introduce some organization to the chaos and to suggest ways to prevent an unringing of the next bell focused on this question.
Funding
BS received a long-term senior sabbatical award from the National Evolutionary Synthesis Center (NESCent) at Duke University and a collaborative research initiative grant from the German Science Foundation (DFG Schi 277727-1) for putting together a synthesis of ideas aiming to resolve the root of the metazoan ToL.
Conflict of Interest Statement
The authors declare that the research was conducted in the absence of any commercial or financial relationships that could be construed as a potential conflict of interest.
Acknowledgments
We thank the National Evolutionary Synthesis Center (NESCent) at Duke University for ideas and support. We are grateful to Kai Kamm for helpful comments.
Footnotes
1. ^The term “subjectivity” here is not meant as an accusation but rather a neutral term to highlight that an author (“subject”) has to pick just a few tools out of a large box with a large number of options. Since many tools seem cum grano salis equally justified “objective” criteria are often unclear and “subjective” criteria are the only option to proceed.
References
Aboobaker, A. A., and Blaxter, M. L. (2003b). Hox gene loss during dynamic evolution of the nematode cluster. Curr. Biol. 13, 37–40. doi: 10.1016/S0960-9822(02)01399-4
Aboobaker, A., and Blaxter, M. (2003a). Hox gene evolution in nematodes: novelty conserved. Curr. Opin. Genet. Dev. 13, 593–598. doi: 10.1016/j.gde.2003.10.009
Altenhoff, A. M., and Dessimoz, C. (2009). Phylogenetic and functional assessment of orthologs inference projects and methods. PLoS Comput. Biol. 5:e1000262. doi: 10.1371/journal.pcbi.1000262
Banerjee-Basu, S., and Baxevanis, A. D. (2001). Molecular evolution of the homeodomain family of transcription factors. Nucleic Acids Res. 29, 3258–3269. doi: 10.1093/nar/29.15.3258
Bernt, M., Bleidorn, C., Braband, A., Dambach, J., Donath, A., Fritzsch, G., et al. (2013a). A comprehensive analysis of bilaterian mitochondrial genomes and phylogeny. Mol. Phylogenet. Evol. 69, 352–364. doi: 10.1016/j.ympev.2013.05.002
Bernt, M., Braband, A., Schierwater, B., and Stadler, P. F. (2013b). Genetic aspects of mitochondrial genome evolution. Mol. Phylogenet. Evol. 69, 328–338. doi: 10.1016/j.ympev.2012.10.020
Brooke, N. M., Garcia-Fernàndez, J., and Holland, P. W. (1998). The ParaHox gene cluster is an evolutionary sister of the Hox gene cluster. Nature 392, 920–922. doi: 10.1038/31933
Campbell, L. I., Rota-Stabelli, O., Edgecombe, G. D., Marchioro, T., Longhorn, S. J., Telford, M. J., et al. (2011). MicroRNAs and phylogenomics resolve the relationships of Tardigrada and suggest that velvet worms are the sister group of Arthropoda. Proc. Natl. Acad. Sci. U.S.A. 108, 15920–15924. doi: 10.1073/pnas.1105499108
Campo-Paysaa, F., Sémon, M., Cameron, R. A., Peterson, K. J., and Schubert, M. (2011). microRNA complements in deuterostomes: origin and evolution of microRNAs. Evol. Dev. 13, 15–27. doi: 10.1111/j.1525-142X.2010.00452.x
Canning, E. U., and Okamura, B. (2004). Biodiversity and evolution of the Myxozoa. Adv. Parasitol. 56, 43–131. doi: 10.1016/S0065-308X(03)56002-X
Castro, L. F., and Holland, P. W. (2003). Chromosomal mapping of ANTP class homeobox genes in amphioxus: piecing together ancestral genomes. Evol. Dev. 5, 459–465. doi: 10.1046/j.1525-142X.2003.03052.x
Chiu, J. C., Lee, E. K., Egan, M. G., Sarkar, I. N., Coruzzi, G. M., and DeSalle, R. (2006). OrthologID: automation of genome-scale ortholog identification within a parsimony framework. Bioinformatics 22, 699–707. doi: 10.1093/bioinformatics/btk040
Collins, A. G., Cartwright, P., McFadden, C. S., and Schierwater, B. (2005). Phylogenetic context and Basal metazoan model systems. Integr. Comp. Biol. 45, 585–594. doi: 10.1093/icb/45.4.585
Dalquen, D. A., Altenhoff, A. M., Gonnet, G. H., and Dessimoz, C. (2013). The impact of gene duplication, insertion, deletion, lateral gene transfer and sequencing error on orthology inference: a simulation study. PLoS ONE 8:e56925. doi: 10.1371/journal.pone.0056925
Dopazo, H., and Dopazo, J. (2005). Genome-scale evidence of the nematode-arthropod clade. Genome Biol. 6:R41. doi: 10.1186/gb-2005-6-5-r41
Dunn, C. W., Giribet, G., Edgecombe, G. D., and Hejnol, A. (2014). Animal phylogeny and its evolutionary implications. Annu. Rev. Ecol. Evol. Syst. 45, 371–395. doi: 10.1146/annurev-ecolsys-120213-091627
Dunn, C. W., Hejnol, A., Matus, D. Q., Pang, K., Browne, W. E., Smith, S. A., et al. (2008). Broad phylogenomic sampling improves resolution of the animal tree of life. Nature 452, 745–749. doi: 10.1038/nature06614
Edger, P. P., Tang, M., Bird, K. A., Mayfield, D. R., Conant, G., Mummenhoff, K., et al. (2014). Secondary structure analyses of the nuclear rRNA internal transcribed spacers and assessment of its phylogenetic utility across the Brassicaceae (mustards). PLoS ONE 9:e101341. doi: 10.1371/journal.pone.0101341
Edwards, S. V. (2009). Is a new and general theory of molecular systematics emerging? Evolution 63, 1–19. doi: 10.1111/j.1558-5646.2008.00549.x
Eitel, M., Jakob, W., Osigus, H.-J., Paknia, O., Chevallerie Karolin von, d., Bergmann, T., et al. (2014). “Phylogenetics and phylogenomics at the root of the Metazoa,” in Deep Metazoan Phylogeny: The Backbone of the Tree of Life. New Insights from Analyses of Molecules, Morphology, and Theory of Data Analysis, eds J. W. Wägele and T. Bartolomaeus (Berlin; Boston, MA: de Gruyter), 23–48.
Eitel, M., Osigus, H. J., DeSalle, R., and Schierwater, B. (2013). Global diversity of the Placozoa. PLoS ONE 8:e57131. doi: 10.1371/journal.pone.0057131
Eitel, M., and Schierwater, B. (2010). The phylogeography of the Placozoa suggests a taxon-rich phylum in tropical and subtropical waters. Mol. Ecol. 19, 2315–2327. doi: 10.1111/j.1365-294X.2010.04617.x
Ender, A., and Schierwater, B. (2003). Placozoa are not derived cnidarians: evidence from molecular morphology. Mol. Biol. Evol. 20, 130–134. doi: 10.1093/molbev/msg018
Evans, N. M., Holder, M. T., Barbeitos, M. S., Okamura, B., and Cartwright, P. (2010). The phylogenetic position of Myxozoa: exploring conflicting signals in phylogenomic and ribosomal data sets. Mol. Biol. Evol. 27, 2733–2746. doi: 10.1093/molbev/msq159
Fairclough, S. R., Chen, Z., Kramer, E., Zeng, Q., Young, S., Robertson, H. M., et al. (2013). Premetazoan genome evolution and the regulation of cell differentiation in the choanoflagellate Salpingoeca rosetta. Genome Biol. 14:R15. doi: 10.1186/gb-2013-14-2-r15
Finnerty, J. R., Pang, K., Burton, P., Paulson, D., and Martindale, M. Q. (2004). Origins of bilateral symmetry: Hox and dpp expression in a sea anemone. Science 304, 1335–1337. doi: 10.1126/science.1091946
Fortunato, S. A., Adamski, M., Ramos, O. M., Leininger, S., Liu, J., Ferrier, D. E., et al. (2014). Calcisponges have a ParaHox gene and dynamic expression of dispersed NK homeobox genes. Nature 514, 620–623. doi: 10.1038/nature13881
Fromm, B., Worren, M. M., Hahn, C., Hovig, E., and Bachmann, L. (2013). Substantial loss of conserved and gain of novel MicroRNA families in flatworms. Mol. Biol. Evol. 30, 2619–2628. doi: 10.1093/molbev/mst155
Fu, X., Adamski, M., and Thompson, E. M. (2008). Altered miRNA repertoire in the simplified chordate, Oikopleura dioica. Mol. Biol. Evol. 25, 1067–1080. doi: 10.1093/molbev/msn060
Galliot, B., de Vargas, C., and Miller, D. (1999). Evolution of homeobox genes: Q50 Paired-like genes founded the Paired class. Dev. Genes Evol. 209, 186–197. doi: 10.1007/s004270050243
Gatesy, J., Amato, G., Norell, M., DeSalle, R., and Hayashi, C. (2003). Combined support for wholesale taxic atavism in gavialine crocodylians. Syst. Biol. 52, 403–422. doi: 10.1080/10635150390197037
Gatesy, J., Baker, R. H., and Hayashi, C. (2004). Inconsistencies in arguments for the supertree approach: supermatrices versus supertrees of Crocodylia. Syst. Biol. 53, 342–355. doi: 10.1080/10635150490423971
Gatesy, J., Matthee, C., DeSalle, R., and Hayashi, C. (2002). Resolution of a supertree/supermatrix paradox. Syst. Biol. 51, 652–664. doi: 10.1080/10635150290102311
Gatesy, J., and Springer, M. S. (2014). Phylogenetic analysis at deep timescales: unreliable gene trees, bypassed hidden support, and the coalescence/concatalescence conundrum. Mol. Phylogenet. Evol. 80, 231–266. doi: 10.1016/j.ympev.2014.08.013
Giribet, G., and Edgecombe, G. D. (2012). Reevaluating the arthropod tree of life. Annu. Rev. Entomol. 57, 167–186. doi: 10.1146/annurev-ento-120710-100659
Grünewald, S., Spillner, A., Bastkowski, S., Bögershausen, A., and Moulton, V. (2013). SuperQ: computing supernetworks from quartets. IEEE/ACM Trans. Comput. Biol. Bioinform. 10, 151–160. doi: 10.1109/TCBB.2013.8
Haeckel, E. (1874). Anthropogenie oder Entwicklungsgeschichte des Menschen. Leipzig: Verlag von Wilhelm Engelmann.
Halanych, K. M., Dahlgren, T. G., and McHugh, D. (2002). Unsegmented annelids? Possible origins of four lophotrochozoan worm taxa. Integr. Comp. Biol. 42, 678–684. doi: 10.1093/icb/42.3.678
Heimberg, A. M., Sempere, L. F., Moy, V. N., Donoghue, P. C., and Peterson, K. J. (2008). MicroRNAs and the advent of vertebrate morphological complexity. Proc. Natl. Acad. Sci. U.S.A. 105, 2946–2950. doi: 10.1073/pnas.0712259105
Hellmuth, M., Wieseke, N., Lechner, M., Lenhof, H. P., Middendorf, M., and Stadler, P. F. (2015). Phylogenomics with paralogs. Proc. Natl. Acad. Sci. U.S.A. 112, 2058–2063. doi: 10.1073/pnas.1412770112
Hertel, J., de Jong, D., Marz, M., Rose, D., Tafer, H., Tanzer, A., et al. (2009). Non-coding RNA annotation of the genome of Trichoplax adhaerens. Nucleic Acids Res. 37, 1602–1615. doi: 10.1093/nar/gkn1084
Hertel, J., Lindemeyer, M., Missal, K., Fried, C., Tanzer, A., Flamm, C., et al. (2006). The expansion of the metazoan microRNA repertoire. BMC Genomics 7:25. doi: 10.1186/1471-2164-7-25
Hertel, J., and Stadler, P. F. (2015). The Expansion of animal MicroRNA families revisited. Life (Basel) 5, 905–920. doi: 10.3390/life5010905
Holland, P. W. (2001). Beyond the Hox: how widespread is homeobox gene clustering? J. Anat. 199, 13–23. doi: 10.1046/j.1469-7580.199.parts1-2.3.x
Holland, P. W. (2013). Evolution of homeobox genes. Wiley Interdiscip. Rev. Dev. Biol. 2, 31–45. doi: 10.1002/wdev.78
Hui, J. H., Holland, P. W., and Ferrier, D. E. (2008). Do cnidarians have a ParaHox cluster? Analysis of synteny around a Nematostella homeobox gene cluster. Evol. Dev. 10, 725–730. doi: 10.1111/j.1525-142X.2008.00286.x
Jagla, K., Bellard, M., and Frasch, M. (2001). A cluster of Drosophila homeobox genes involved in mesoderm differentiation programs. Bioessays 23, 125–133. doi: 10.1002/1521-1878(200102)23:2<125::AID-BIES1019>3.0.CO;2-C
Jarvis, E. D., Mirarab, S., Aberer, A. J., Li, B., Houde, P., Li, C., et al. (2014). Whole-genome analyses resolve early branches in the tree of life of modern birds. Science 346, 1320–1331. doi: 10.1126/science.1253451
Kamm, K., and Schierwater, B. (2006). Ancient complexity of the non-Hox ANTP gene complement in the anthozoan Nematostella vectensis: implications for the evolution of the ANTP superclass. J. Exp. Zool. B Mol. Dev. Evol. 306, 589–596. doi: 10.1002/jez.b.21123
Kamm, K., Schierwater, B., Jakob, W., Dellaporta, S. L., and Miller, D. J. (2006). Axial patterning and diversification in the cnidaria predate the Hox system. Curr. Biol. 16, 920–926. doi: 10.1016/j.cub.2006.03.036
King, N., Westbrook, M. J., Young, S. L., Kuo, A., Abedin, M., Chapman, J., et al. (2008). The genome of the choanoflagellate Monosiga brevicollis and the origin of metazoans. Nature 451, 783–788. doi: 10.1038/nature06617
Kluge, A. G. (1989). A concern for evidence and a phylogenetic hypothesis of relationships among Epicrates (Boidae, Serpentes). Syst. Biol. 38, 7–25. doi: 10.1093/sysbio/38.1.7
Kozomara, A., and Griffiths-Jones, S. (2014). miRBase: annotating high confidence microRNAs using deep sequencing data. Nucleic Acids Res. 42, D68–D73. doi: 10.1093/nar/gkt1181
Krauss, V., Thümmler, C., Georgi, F., Lehmann, J., Stadler, P. F., and Eisenhardt, C. (2008). Near intron positions are reliable phylogenetic markers: an application to holometabolous insects. Mol. Biol. Evol. 25, 821–830. doi: 10.1093/molbev/msn013
Kristensen, D. M., Wolf, Y. I., Mushegian, A. R., and Koonin, E. V. (2011). Computational methods for Gene Orthology inference. Brief. Bioinformatics 12, 379–391. doi: 10.1093/bib/bbr030
Kuhn, K., Streit, B., and Schierwater, B. (1999). Isolation of Hox genes from the scyphozoan Cassiopeia xamachana: implications for the early evolution of Hox genes. J. Exp. Zool. 285, 63–75.
Larroux, C., Fahey, B., Degnan, S. M., Adamski, M., Rokhsar, D. S., and Degnan, B. M. (2007). The NK homeobox gene cluster predates the origin of Hox genes. Curr. Biol. 17, 706–710. doi: 10.1016/j.cub.2007.03.008
Lavrov, D. V. (2007). Key transitions in animal evolution: a mitochondrial DNA perspective. Integr. Comp. Biol. 47, 734–743. doi: 10.1093/icb/icm045
Lavrov, D. V., Pett, W., Voigt, O., Wörheide, G., Forget, L., Lang, B. F., et al. (2013). Mitochondrial DNA of Clathrina clathrus (Calcarea, Calcinea): six linear chromosomes, fragmented rRNAs, tRNA editing, and a novel genetic code. Mol. Biol. Evol. 30, 865–880. doi: 10.1093/molbev/mss274
Lehmann, J., Stadler, P. F., and Krauss, V. (2013). Near intron pairs and the metazoan tree. Mol. Phylogenet. Evol. 66, 811–823. doi: 10.1016/j.ympev.2012.11.012
Leigh, J. W., Schliep, K., Lopez, P., and Bapteste, E. (2011). Let them fall where they may: congruence analysis in massive phylogenetically messy data sets. Mol. Biol. Evol. 28, 2773–2785. doi: 10.1093/molbev/msr110
Lienau, E. K., and DeSalle, R. (2009). Evidence, content and corroboration and the Tree of Life. Acta Biotheor. 57, 187–199. doi: 10.1007/s10441-008-9066-5
Liu, L., Yu, L., Kubatko, L., Pearl, D. K., and Edwards, S. V. (2009a). Coalescent methods for estimating phylogenetic trees. Mol. Phylogenet. Evol. 53, 320–328. doi: 10.1016/j.ympev.2009.05.033
Liu, L., Yu, L., Pearl, D. K., and Edwards, S. V. (2009b). Estimating species phylogenies using coalescence times among sequences. Syst. Biol. 58, 468–477. doi: 10.1093/sysbio/syp031
Maeso, I., Roy, S. W., and Irimia, M. (2012). Widespread recurrent evolution of genomic features. Genome Biol. Evol. 4, 486–500. doi: 10.1093/gbe/evs022
Maxmen, A. (2013). Genome reveals comb jellies' ancient origin. Nature. doi: 10.1038/nature.2013.12176
Maxwell, E. K., Ryan, J. F., Schnitzler, C. E., Browne, W. E., and Baxevanis, A. D. (2012). MicroRNAs and essential components of the microRNA processing machinery are not encoded in the genome of the ctenophore Mnemiopsis leidyi. BMC Genomics 13:714. doi: 10.1186/1471-2164-13-714
McGinnis, W., and Krumlauf, R. (1992). Homeobox genes and axial patterning. Cell 68, 283–302. doi: 10.1016/0092-8674(92)90471-N
Mendivil Ramos, O., Barker, D., and Ferrier, D. E. (2012). Ghost loci imply Hox and ParaHox existence in the last common ancestor of animals. Curr. Biol. 22, 1951–1956. doi: 10.1016/j.cub.2012.08.023
Meusemann, K., von Reumont, B. M., Simon, S., Roeding, F., Strauss, S., Kück, P., et al. (2010). A phylogenomic approach to resolve the arthropod tree of life. Mol. Biol. Evol. 27, 2451–2464. doi: 10.1093/molbev/msq130
Misof, B., Liu, S., Meusemann, K., Peters, R. S., Donath, A., Mayer, C., et al. (2014). Phylogenomics resolves the timing and pattern of insect evolution. Science 346, 763–767. doi: 10.1126/science.1257570
Monteiro, A. S., Schierwater, B., Dellaporta, S. L., and Holland, P. W. (2006). A low diversity of ANTP class homeobox genes in Placozoa. Evol. Dev. 8, 174–182. doi: 10.1111/j.1525-142X.2006.00087.x
Moran, Y., Fredman, D., Praher, D., Li, X. Z., Wee, L. M., Rentzsch, F., et al. (2014). Cnidarian microRNAs frequently regulate targets by cleavage. Genome Res. 24, 651–663. doi: 10.1101/gr.162503.113
Moran, Y., Praher, D., Fredman, D., and Technau, U. (2013). The evolution of microRNA pathway protein components in Cnidaria. Mol. Biol. Evol. 30, 2541–2552. doi: 10.1093/molbev/mst159
Moroz, L. L., Kocot, K. M., Citarella, M. R., Dosung, S., Norekian, T. P., Povolotskaya, I. S., et al. (2014). The ctenophore genome and the evolutionary origins of neural systems. Nature 510, 109–114. doi: 10.1038/nature13400
Nosenko, T., Schreiber, F., Adamska, M., Adamski, M., Eitel, M., Hammel, J., et al. (2013). Deep metazoan phylogeny: when different genes tell different stories. Mol. Phylogenet. Evol. 67, 223–233. doi: 10.1016/j.ympev.2013.01.010
Oakley, T. H., Wolfe, J. M., Lindgren, A. R., and Zaharoff, A. K. (2013). Phylotranscriptomics to bring the understudied into the fold: monophyletic ostracoda, fossil placement, and pancrustacean phylogeny. Mol. Biol. Evol. 30, 215–233. doi: 10.1093/molbev/mss216
O'Leary, M. A., Bloch, J. I., Flynn, J. J., Gaudin, T. J., Giallombardo, A., Giannini, N. P., et al. (2013). The placental mammal ancestor and the post-K-Pg radiation of placentals. Science 339, 662–667. doi: 10.1126/science.1229237
Osigus, H. J., Eitel, M., and Schierwater, B. (2013a). Chasing the urmetazoon: striking a blow for quality data? Mol. Phylogenet. Evol. 66, 551–557. doi: 10.1016/j.ympev.2012.05.028
Osigus, H. J., Eitel, M., and Schierwater, B. (2013b). Chasing the urmetazoon: striking a blow for quality data? Mol. Phylogenet. Evol. 66, 551–557. doi: 10.1016/j.ympev.2012.05.028
Paps, J., Medina-Chacón, L. A., Marshall, W., Suga, H., and Ruiz-Trillo, I. (2013). Molecular phylogeny of unikonts: new insights into the position of apusomonads and ancyromonads and the internal relationships of opisthokonts. Protist 164, 2–12. doi: 10.1016/j.protis.2012.09.002
Pascual-Anaya, J., D'Aniello, S., Kuratani, S., and Garcia-Fernàndez, J. (2013). Evolution of Hox gene clusters in deuterostomes. BMC Dev. Biol. 13:26. doi: 10.1186/1471-213X-13-26
Peters, R. S., Meusemann, K., Petersen, M., Mayer, C., Wilbrandt, J., Ziesmann, T., et al. (2014). The evolutionary history of holometabolous insects inferred from transcriptome-based phylogeny and comprehensive morphological data. BMC Evol. Biol. 14:52. doi: 10.1186/1471-2148-14-52
Philippe, H., Brinkmann, H., Copley, R. R., Moroz, L. L., Nakano, H., Poustka, A. J., et al. (2011a). Acoelomorph flatworms are deuterostomes related to Xenoturbella. Nature 470, 255–258. doi: 10.1038/nature09676
Philippe, H., Brinkmann, H., Lavrov, D. V., Littlewood, D. T., Manuel, M., Wörheide, G., et al. (2011b). Resolving difficult phylogenetic questions: why more sequences are not enough. PLoS Biol. 9:e1000602. doi: 10.1371/journal.pbio.1000602
Philippe, H., and Roure, B. (2011). Difficult phylogenetic questions: more data, maybe; better methods, certainly. BMC Biol. 9:91. doi: 10.1186/1741-7007-9-91
Pisani, D., Pett, W., Dohrmann, M., Feuda, R., Rota-Stabelli, O., Philippe, H., et al. (2015). Genomic data do not support comb jellies as the sister group to all other animals. Proc. Natl. Acad. Sci. U.S.A. 112, 15402–15407. doi: 10.1073/pnas.1518127112
Posada, D. (2003). Using MODELTEST and PAUP* to select a model of nucleotide substitution. Curr. Protoc. Bioinformatics Chapter 6, Unit 6 5. doi: 10.1002/0471250953.bi0605s00
Posada, D., and Crandall, K. A. (1998). MODELTEST: testing the model of DNA substitution. Bioinformatics 14, 817–818. doi: 10.1093/bioinformatics/14.9.817
Prochnik, S. E., Rokhsar, D. S., and Aboobaker, A. A. (2007). Evidence for a microRNA expansion in the bilaterian ancestor. Dev. Genes Evol. 217, 73–77. doi: 10.1007/s00427-006-0116-1
Regier, J. C., Shultz, J. W., Zwick, A., Hussey, A., Ball, B., Wetzer, R., et al. (2010). Arthropod relationships revealed by phylogenomic analysis of nuclear protein-coding sequences. Nature 463, 1079–1083. doi: 10.1038/nature08742
Robinson, J. M., Sperling, E. A., Bergum, B., Adamski, M., Nichols, S. A., Adamska, M., et al. (2013). The identification of microRNAs in calcisponges: independent evolution of microRNAs in basal metazoans. J. Exp. Zool. B Mol. Dev. Evol. 320, 84–93. doi: 10.1002/jez.b.22485
Rosenfeld, J. A., and DeSalle, R. (2012). E value cutoff and eukaryotic genome content phylogenetics. Mol. Phylogenet. Evol. 63, 342–350. doi: 10.1016/j.ympev.2012.01.003
Rosenfeld, J. A., Payne, A., and DeSalle, R. (2012). Random roots and lineage sorting. Mol. Phylogenet. Evol. 64, 12–20. doi: 10.1016/j.ympev.2012.02.029
Roy, S. W., and Irimia, M. (2008). Rare genomic characters do not support Coelomata: intron loss/gain. Mol. Biol. Evol. 25, 620–623. doi: 10.1093/molbev/msn035
Ruhfel, B. R., Gitzendanner, M. A., Soltis, P. S., Soltis, D. E., and Burleigh, J. G. (2014). From algae to angiosperms-inferring the phylogeny of green plants (Viridiplantae) from 360 plastid genomes. BMC Evol. Biol. 14:23. doi: 10.1186/1471-2148-14-23
Ryan, J. F., Burton, P. M., Mazza, M. E., Kwong, G. K., Mullikin, J. C., and Finnerty, J. R. (2006). The cnidarian-bilaterian ancestor possessed at least 56 homeoboxes: evidence from the starlet sea anemone, Nematostella vectensis. Genome Biol. 7:R64. doi: 10.1186/gb-2006-7-7-r64
Ryan, J. F., Pang, K., Program, N. C. S., Mullikin, J. C., Martindale, M. Q., and Baxevanis, A. D. (2010). The homeodomain complement of the ctenophore Mnemiopsis leidyi suggests that Ctenophora and Porifera diverged prior to the ParaHoxozoa. Evodevo 1:9. doi: 10.1186/2041-9139-1-9
Ryan, J. F., Pang, K., Schnitzler, C. E., Nguyen, A. D., Moreland, R. T., Simmons, D. K., et al. (2013). The genome of the ctenophore Mnemiopsis leidyi and its implications for cell type evolution. Science 342:1242592. doi: 10.1126/science.1242592
Schierwater, B. (2005). My favorite animal, Trichoplax adhaerens. Bioessays 27, 1294–1302. doi: 10.1002/bies.20320
Schierwater, B., and Desalle, R. (2001). Current problems with the zootype and the early evolution of Hox genes. J. Exp. Zool. 291, 169–174. doi: 10.1002/jez.1066
Schierwater, B., Eitel, M., Jakob, W., Osigus, H. J., Hadrys, H., Dellaporta, S. L., et al. (2009). Concatenated analysis sheds light on early metazoan evolution and fuels a modern “urmetazoon” hypothesis. PLoS Biol. 7:e20. doi: 10.1371/journal.pbio.1000020
Schierwater, B., Eitel, M., Osigus, H. J., von der Chevallerie, K., Bergmann, T., Hadrys, H., et al. (2010). Trichoplax and Placozoa: One of the Crucial Keys to Understanding Metazoan Evolution. Enfield, NH: Science Publishers; CRC Press. doi: 10.1201/b10425-17
Schierwater, B., Kamm, K., Srivastava, M., Rokhsar, D., Rosengarten, R. D., and Dellaporta, S. L. (2008). The early ANTP gene repertoire: insights from the placozoan genome. PLoS ONE 3:e2457. doi: 10.1371/journal.pone.0002457
Schierwater, B., and Kuhn, K. (1998). Homology of Hox genes and the zootype concept in early metazoan evolution. Mol. Phylogenet. Evol. 9, 375–381. doi: 10.1006/mpev.1998.0489
Schrödl, M., and Stöger, I. (2014). A review on deep molluscan phylogeny: old markers, integrative approaches, persistent problems. J. Nat. Hist. 48, 2773–2804. doi: 10.1080/00222933.2014.963184
Schyth, B. D., Bela-Ong, D. B., Jalali, S. A., Kristensen, L. B., Einer-Jensen, K., Pedersen, F. S., et al. (2015). Two virus-induced MicroRNAs known only from teleost fishes are orthologues of MicroRNAs involved in cell cycle control in humans. PLoS ONE 10:e0132434. doi: 10.1371/journal.pone.0132434
Shalchian-Tabrizi, K., Minge, M. A., Espelund, M., Orr, R., Ruden, T., Jakobsen, K. S., et al. (2008). Multigene phylogeny of choanozoa and the origin of animals. PLoS ONE 3:e2098. doi: 10.1371/journal.pone.0002098
Sharma, R., Mishra, B., Runge, F., and Thines, M. (2014). Gene loss rather than gene gain is associated with a host jump from Monocots to Dicots in the Smut Fungus Melanopsichium pennsylvanicum. Genome Biol. Evol. 6, 2034–2049. doi: 10.1093/gbe/evu148
Siddall, M. E. (2010). Unringing a bell: metazoan phylogenomics and the partition bootstrap. Cladistics 26, 444–452. doi: 10.1111/j.1096-0031.2009.00295.x
Slack, J. M., Holland, P. W., and Graham, C. F. (1993). The zootype and the phylotypic stage. Nature 361, 490–492. doi: 10.1038/361490a0
Song, S., Liu, L., Edwards, S. V., and Wu, S. (2012). Resolving conflict in eutherian mammal phylogeny using phylogenomics and the multispecies coalescent model. Proc. Natl. Acad. Sci. U.S.A. 109, 14942–14947. doi: 10.1073/pnas.1211733109
Springer, M. S., and Gatesy, J. (2016). The gene tree delusion. Mol. Phylogenet. Evol. 94, 1–33. doi: 10.1016/j.ympev.2015.07.018
Srivastava, M., Begovic, E., Chapman, J., Putnam, N. H., Hellsten, U., Kawashima, T., et al. (2008). The Trichoplax genome and the nature of placozoans. Nature 454, 955–960. doi: 10.1038/nature07191
Suga, H., Chen, Z., de Mendoza, A., Sebé-Pedrós, A., Brown, M. W., Kramer, E., et al. (2013). The Capsaspora genome reveals a complex unicellular prehistory of animals. Nat. Commun. 4, 2325. doi: 10.1038/ncomms3325
Tarver, J. E., Sperling, E. A., Nailor, A., Heimberg, A. M., Robinson, J. M., King, B. L., et al. (2013). miRNAs: small genes with big potential in metazoan phylogenetics. Mol. Biol. Evol. 30, 2369–2382. doi: 10.1093/molbev/mst133
Telford, M. J., Bourlat, S. J., Economou, A., Papillon, D., and Rota-Stabelli, O. (2008). The evolution of the Ecdysozoa. Philos. Trans. R. Soc. Lond. B Biol. Sci. 363, 1529–1537. doi: 10.1098/rstb.2007.2243
Thomson, R. C., Plachetzki, D. C., Mahler, D. L., and Moore, B. R. (2014). A critical appraisal of the use of microRNA data in phylogenetics. Proc. Natl. Acad. Sci. U.S.A. 111, E3659–E3668. doi: 10.1073/pnas.1407207111
Tian, Y., and Kubatko, L. S. (2014). Gene tree rooting methods give distributions that mimic the coalescent process. Mol. Phylogenet. Evol. 70, 63–69. doi: 10.1016/j.ympev.2013.09.004
Venkatesh, B., Ning, Y., and Brenner, S. (1999). Late changes in spliceosomal introns define clades in vertebrate evolution. Proc. Natl. Acad. Sci. U.S.A. 96, 10267–10271. doi: 10.1073/pnas.96.18.10267
Voigt, O., Collins, A. G., Pearse, V. B., Pearse, J. S., Ender, A., Hadrys, H., et al. (2004). Placozoa – no longer a phylum of one. Curr. Biol. 14, R944–R945. doi: 10.1016/j.cub.2004.10.036
Voigt, O., Erpenbeck, D., and Wörheide, G. (2008). A fragmented metazoan organellar genome: the two mitochondrial chromosomes of Hydra magnipapillata. BMC Genomics 9:350. doi: 10.1186/1471-2164-9-350
von Haeseler, A. (2012). Do we still need supertrees? BMC Biol. 10:13. doi: 10.1186/PREACCEPT-2146874722677283
Wheeler, B. M., Heimberg, A. M., Moy, V. N., Sperling, E. A., Holstein, T. W., Heber, S., et al. (2009). The deep evolution of metazoan microRNAs. Evol. Dev. 11, 50–68. doi: 10.1111/j.1525-142X.2008.00302.x
Whelan, N. V., Kocot, K. M., and Halanych, K. M. (2015a). Employing Phylogenomics to Resolve the Relationships among Cnidarians, Ctenophores, Sponges, Placozoans, and Bilaterians. Integr. Comp. Biol. 55, 1084–1095. doi: 10.1093/icb/icv037
Whelan, N. V., Kocot, K. M., Moroz, L. L., and Halanych, K. M. (2015b). Error, signal, and the placement of Ctenophora sister to all other animals. Proc. Natl. Acad. Sci. U.S.A. 112, 5773–5778. doi: 10.1073/pnas.1503453112
Wickett, N. J., Mirarab, S., Nguyen, N., Warnow, T., Carpenter, E., Matasci, N., et al. (2014). Phylotranscriptomic analysis of the origin and early diversification of land plants. Proc. Natl. Acad. Sci. U.S.A. 111, E4859–E4868. doi: 10.1073/pnas.1323926111
Wörheide, G., Dohrmann, M., Erpenbeck, D., Larroux, C., Maldonado, M., Voigt, O., et al. (2012). Deep phylogeny and evolution of sponges (phylum Porifera). Adv. Mar. Biol. 61, 1–78. doi: 10.1016/B978-0-12-387787-1.00007-6
Keywords: urmetazoon, tree of life (ToL), phylogenetic approaches, concatenated analyses, most short-lived hypotheses, character weighting, diploblastic animals, Bilateria
Citation: Schierwater B, Holland PWH, Miller DJ, Stadler PF, Wiegmann BM, Wörheide G, Wray GA and DeSalle R (2016) Never Ending Analysis of a Century Old Evolutionary Debate: “Unringing” the Urmetazoon Bell. Front. Ecol. Evol. 4:5. doi: 10.3389/fevo.2016.00005
Received: 18 August 2015; Accepted: 15 January 2016;
Published: 04 February 2016.
Edited by:
Enrique P. Lessa, Universidad de la República, UruguayReviewed by:
Federico Guillermo Hoffmann, Mississippi State University, USARosa M. Fernandez, Harvard University, USA
Copyright © 2016 Schierwater, Holland, Miller, Stadler, Wiegmann, Wörheide, Wray and DeSalle. This is an open-access article distributed under the terms of the Creative Commons Attribution License (CC BY). The use, distribution or reproduction in other forums is permitted, provided the original author(s) or licensor are credited and that the original publication in this journal is cited, in accordance with accepted academic practice. No use, distribution or reproduction is permitted which does not comply with these terms.
*Correspondence: Bernd Schierwater, bernd.schierwater@ecolevol.de