Characterization of the atmospheric circulation near the Empty Quarter Desert during major weather events
 Narendra Nelli1
  Diana Francis1*
  Ricardo Fonseca1
  Emmanuel Bosc2
  Yacine Addad3 Marouane Temimi4
  Rachid Abida3 Michael Weston1
  Charfeddine Cherif1
- 1Environmental and Geophysical Sciences (ENGEOS) Lab, Khalifa University of Science and Technology, Abu Dhabi, United Arab Emirates
- 2Federal Authority for Nuclear Regulation (FANR), Abu Dhabi, United Arab Emirates
- 3Department of Nuclear Engineering, Emirates Nuclear Technology Center, Khalifa University of Science and Technology, Abu Dhabi, United Arab Emirates
- 4Department of Civil, Environmental and Ocean Engineering (CEOE), Stevens Institute of Technology, Hoboken, NJ, United States
In this study, we characterize the meteorological conditions and planetary boundary layer dynamics in western United Arab Emirates based on 2012–2020 in-situ measurements. This multi-year analysis is then complemented by an intensive field-campaign in winter 2021 from which we address the main patterns of the atmospheric circulation and the boundary layer structure during typical weather events identified in the long-term analysis. We found that, 10-m and 60-m wind speeds are generally below 5 m s−1 and 8 m s−1, respectively, blowing predominantly from a northerly direction. They peak in intensity at around 12–18 Local Time (LT) and 02–09 LT in association with the sea-breeze and the downward mixing of momentum from the nighttime low-level jet, respectively. The wind is stronger in the cold season, varying mostly in response to mid-latitude baroclinic systems, while the proximity of the site to the core of the Arabian Heat Low leads to more quiescent conditions in the summer. Radiation fog is a regular occurrence mostly from December to February owing to the colder nights and weaker wind speeds, with a peak fog occurrence around local sunrise. Sea fog, which develops when the hotter desert air is transported over the cooler Arabian Gulf waters, is advected to the site in the summer. Deep and very deep convective clouds are more common in March-April in association with organized convective systems, with generally reduced cloud cover from May to October. The region of interest exhibits a monthly-mean aerosol optical depth ranging from ∼0.3 in December-January to ∼1.2 in July due to its increased exposure to dust storms in the summer season. Dust activity is also found to peak during winter and spring associated with the intrusion of cold fronts from mid-latitudes.
1 Introduction
The sparsely populated arid and semi-arid regions are characterized by a dearth of in-situ ground-based observations (Fonseca et al., 2019; Nelli et al., 2020a). Here, satellite-derived estimates exhibit large biases for fields such as temperature (e.g. Yu et al., 2014), precipitation (e.g. Wehbe and Temimi, 2021), aerosols’ radiative impact (e.g., Francis et al., 2020), and numerical models underperform (e.g. Branch et al., 2021). As desert regions are likely to expand in a warming climate (e.g. Huang et al., 2017), with the Arabian Peninsula particularly sensitive to climate change (Almazroui et al., 2012; Zittis et al., 2022), it is crucial to have a good understanding of the local conditions so as to better predict the future climate. This can be achieved through the deployment of ground-based weather sensors, which will also allow for a comprehensive description of the local-scale circulations that is vital for applications such as commercial and industrial activities (e.g. Lakovic et al., 2012; Abdelmohimen and Algarni, 2018; Khan and Islam, 2019) and weather modification (e.g. Branch and Wulfmeyer, 2019). Good quality in-situ measurements are also vital to evaluate and calibrate numerical models (e.g. Nelli et al., 2020b) as well as satellite-derived products (e.g. Griesfeller et al., 2016) and reanalysis datasets (e.g. Ma et al., 2009), which are used to conduct long-term studies and to drive numerical model simulations. This is particularly true for the western United Arab Emirates (UAE; Figures 1A,B), a desertic region at the fringes of the Empty quarter desert that has been far less researched than the eastern side of the country as it is far away from any of the major cities.
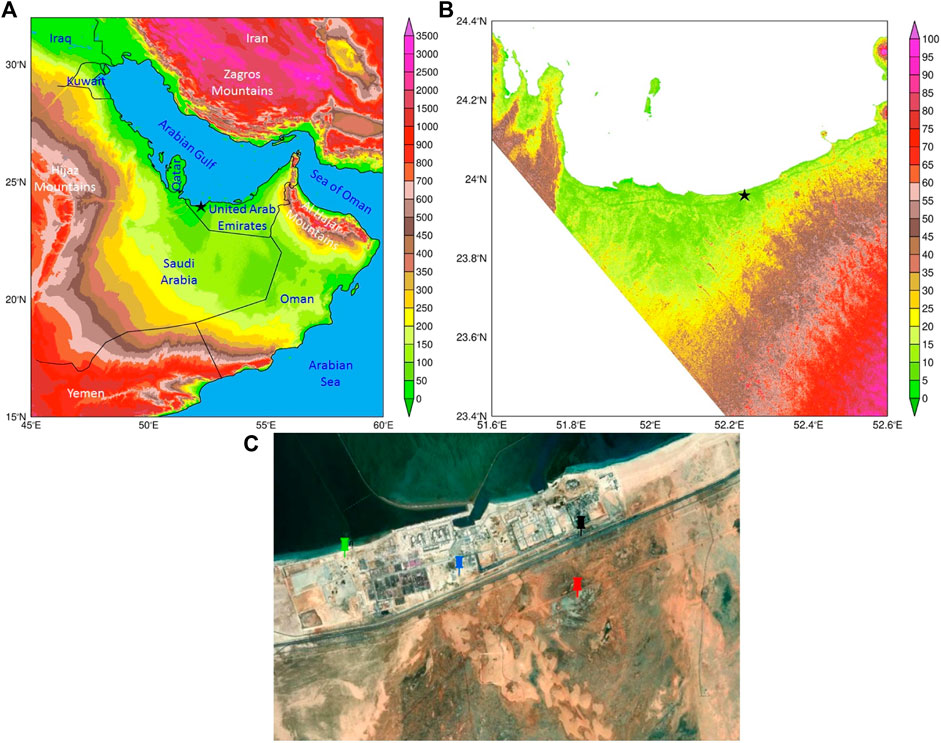
FIGURE 1. (A) Orography (m) of the eastern Arabian Peninsula at 1 km spatial resolution generated from the United States Geological Survey dataset at 30’’ (∼927 m) resolution. The star indicates the approximate location of the Barakah site, with the labels indicating the major features in the region. (B) The orography of the region around Barakah from a 30-m digital elevation model (Hulley et al., 2015). (C) Close-up view of the study area. The green pin gives the location of the 10-m meteorological tower (23.96333°N, 52.21185°E); the blue pin indicates where the 60-m meteorological tower is placed (23.959849°N, 52.238733°E); the black pin is the Visitor’s Badging Office (VBO; 23.968052°N, 52.267309°E), where the majority of the instruments were deployed during the field campaign; the red pin gives the site of the National Center for Meteorology’s meteorological tower (23.955277°N, 52.2663888°E) whose measurements are available for comparison with those collected at the other sites.
The UAE has a hyper-arid climate, with annual precipitation amounts generally under 100 mm except over the Al Hajar mountains on the eastern side where it can exceed 120 mm, the vast majority of which falling from November to March (Wehbe et al., 2017, 2018, 2020; Nelli et al., 2020a). Surface winds peak during morning hours as a result of the downward mixing of momentum from the nighttime low-level jet to the surface (Bou Karam Francis et al., 2017) which often lead to dust emissions (Francis et al., 2020, 2022) and reduced visibility. The large-scale winds in the UAE blow predominantly from the northwest (Naizghi and Ouarda, 2017). In winter, mid-latitude baroclinic systems regularly affect the Arabian Gulf, with the background northwesterly winds strengthening after the passage of a cold front owing to the steep pressure gradient between the subtropical high to the west and the low pressure to the east. These episodes are known as winter Shamal events (Al Senafi and Anis, 2015). They occur on average twice to three times a month from December to early March, and have a time-scales of 24–36 h or 3–5 days, depending on whether an upper-level trough stalls in the region around the Strait of Hormuz or shifts quickly eastward (Abdi Vishkaee et al., 2012).
In the summer season, on the other hand, the pressure gradient between the monsoon trough extending from India to Pakistan and Iran and the subtropical high over northern parts of the Arabian Peninsula gives rise to the summer Shamal events (Yu et al., 2016). While the winter Shamal events are generally stronger than their summer counterparts, the latter play a larger role in the dust activities in the Arabian Peninsula (Yu et al., 2016; Bou Karam Francis et al., 2017; Francis et al., 2022). Further insight into the wind speed variability in the UAE is given in Naizghi and Ouarda (2017) who carried out a wavelet analysis at six ground stations in the UAE. They concluded that the May-July wind speed at Abu Dhabi is positively correlated with the North Atlantic Oscillation (NAO; Hurrell et al., 2001) with a period of 6–7 years, as the positive NAO phase is associated with stronger westerly winds in the mid-latitudes. The positive phase of the El Nino-Southern Oscillation (ENSO; Rasmusson and Carpenter, 1982) is associated with weaker wind speeds at Abu Dhabi in the period September to November, as also noted by Thota et al. (2020), with a period of 5–6 years. The Indian Ocean Dipole (IOD; Saji et al., 1999) is positively correlated with the wind speed at Abu Dhabi for the period November to January, with a period of 2–3 years. However, these correlations are not present throughout the full analysis period, and are not consistent for all stations considered, suggesting that the effects of the referred modes of variability exhibit a strong spatial dependence.
Although rare, summertime precipitation is not unheard of in western UAE, resulting from the interaction of the Arabian heat low (AHL; Fonseca et al., 2021) and the daytime sea-breeze circulation, with one of such events discussed in Steinhoff et al. (2018). As noted by both studies, there is considerable intraseasonal variability in the strength of the AHL in response to active/break phases of the Indian monsoon, with the annual precipitation also exhibiting a pronounced inter-annual variability with wetter conditions in El Nino and drier in La Nina years (Niranjan Kumar and Ouarda, 2014). All in all, and despite the flatter terrain, the atmospheric conditions in western UAE are very complex. Given the recent increase in population in the region and the predicted expansion of the deserts with climate change, it is vital to understand the local meteorological environment and its variability on different time-scales.
In this study, the weather conditions around Barakah in western UAE are characterized using in-situ observational data from a meteorological tower over an 8-year period (2012–2019), and a dedicated field campaign which started in October 2020. In-situ observations have only been collected on a regular basis here since the early 2010s, and preliminary analysis for a 3-year period revealed that the wind field at the site is primarily controlled by the passage of weather systems and the occurrence of the sea-/land-breeze circulations (Lee et al., 2013, 2015). However, a long-term investigation is required to generate seasonal means and better understand the local-scale meteorology, and how it is linked to the boundary layer dynamics. The findings of this work will improve our current understanding of the atmospheric environment in coastal hyperarid regions around the Arabian Gulf where there is a lack of ground-based measurements (Ghasem et al., 2012; Almazroui et al., 2014; Temimi et al., 2020a; Branch et al., 2021; Karami et al., 2021), in particular of collocated in-situ observations. In addition, they will aid in the evaluation and calibration of numerical models and support fog and dust studies and forecasts in the region.
This paper is structured as follows. In Section 2, the observational data and reanalysis datasets employed in this study are summarized. The 8-years data collected at the 60-m meteorological tower is discussed in Section 3, while in Section 4 a fog, convective and dust events that took place during the field campaign are analyzed. The main findings are outlined in Section 5.
2 Measurement site and instrumentation
The western UAE has some of the lowest-elevation terrains in the country (Figures 1A,B), which may allow for a deeper inland penetration of maritime air, as noted by Nelli et al. (2021b). The seasonal mean local sea surface temperature (SST) ranges from about 21°C in winter to 33°C in the summer, being a few degrees lower than those further east around Abu Dhabi and Dubai (Nesterov et al., 2021). This may lead to a steeper land-sea temperature gradient and hence stronger sea-breeze circulations at the site. The area around Barakah is also more exposed to the background Shamal winds, which strengthen as they flow through the narrow gap between the Zagros mountains in Iran and the Hijaz mountains in Saudi Arabia, compared to coastal areas in northeastern UAE (Nesterov et al., 2021).
An overview of the site where the instruments are deployed is given in Figure 1C and Figure 2. All instruments are within 2 km of the Arabian Gulf, in a developing urban region. Apart from the meteorological towers, all instruments are deployed at the rooftop of the Visitor’s Badging Office (VBO) which is roughly 10-m above the surface, black pin in Figure 1C. This building is far away from major construction structures and hence the measurements are unlikely to be affected by their deployment on its rooftop. The fields measured and the period over which data is available for analysis is summarized in Supplementary Table S1. A long-term description of the in-situ weather conditions is achieved with the 10-min measurements collected at the 60-m meteorological tower, blue pin in Figure 1C, from 2012 to 2019. For precipitation, the daily accumulations from the National Center of Meteorology’s (NCM’s) Barakah (red pin in Figure 1C) and Al Ruwais (located ∼60 km east of Barakah) weather stations are used in this analysis. The observations collected during the field campaign, which started in October 2020, are used to investigate in detail the three-dimensional atmospheric state for a few selected events. These comprise fog, convective and dusty weather conditions.
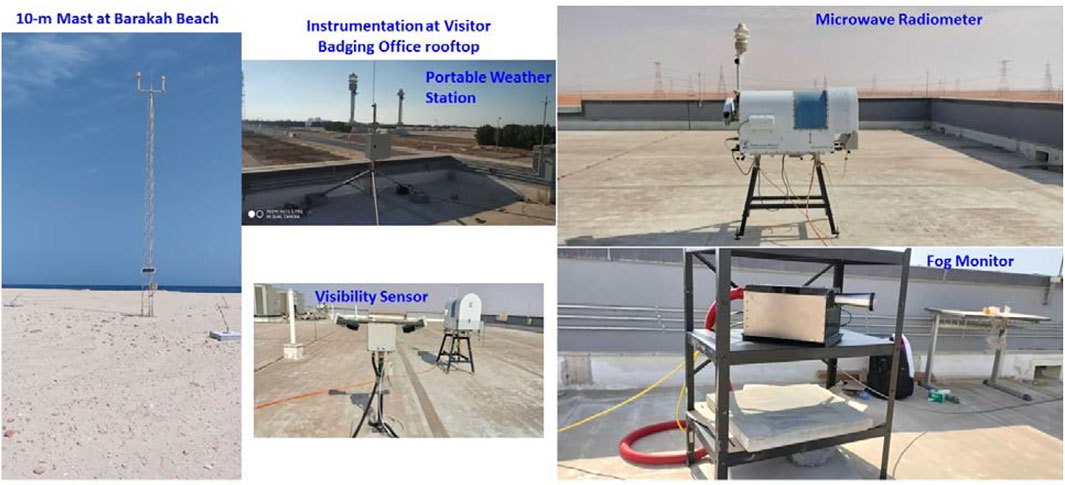
FIGURE 2. Overview of the instruments deployed at Barakah, United Arab Emirates.
Besides the in-situ observations, three satellite-derived and one reanalysis products used in this work are summarized in Table 1. Satellite-derived Infrared Brightness Temperature (IRBT) maps, available every 30 min on a 4 km grid for 60ºS-60°N and from January 1998 to present, are used to assess the evolution of convective events and identify the vertical development of clouds following Reddy and Rao (2018). In order to inspect the spatial extent of fog events, 15-min satellite images from the Spinning Enhanced Visible and Infrared Imager (SEVIRI) instrument onboard the Meteosat Second Generation spacecraft at 0.05° resolution (∼5.6 km) are analysed from 2012 to 2019. To check for dust episodes, daily 550 nm aerosol optical depth (AOD) estimates on a 10 km grid from the Moderate Resolution Imaging Spectroradiometer (MODIS) instrument aboard Terra and Aqua satellites from 2000 to 2020 are considered. The AOD is computed using the dark target algorithm (Kaufman et al., 1997) for land regions and the deep blue algorithm (Hsu et al., 2004) for water bodies. The presence of dust layers is also confirmed through an inspection of the Cloud Aerosol Lidar and Infrared Pathfinder Satellite Observation (CALIPSO; Winker et al., 2003) overpass profiles around Barakah for selected events. The ERA-5 (Hersbach et al., 2020) reanalysis data which has good performance over the Arabian Peninsula (e.g. Al Senafi et al., 2019; Fonseca et al., 2021) is also considered. ERA-5 data is available on a 0.25° × 0.25° (∼27 km) grid on an hourly basis from 1950 to present, and is used to summarize the large-scale atmospheric conditions for the case studies considered in this work.
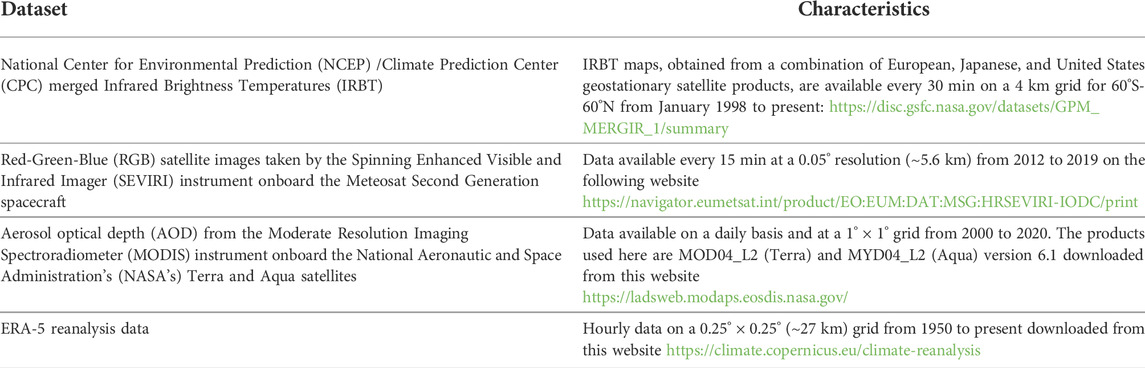
TABLE 1. List of the satellite-derived and reanalysis products used in this work.
3 Characterization of the near-surface layer
In this section, the roughly 8-years measurements collected at the meteorological tower are analyzed. In Section 3.1 the focus is on the annual variability of the diurnal cycles of the surface layer parameters, while the temporal variability of the wind speed is discussed in Section 3.2 through a wavelet analysis.
3.1 Near-surface layer vertical structure
The air temperature (Figure 3A) exhibits a gradual transition from the cold to the warm season, with the longer daylight hours and higher solar zenith angle, together with an increased effect of the subtropical anticyclones (Spinks et al., 2015), leading to progressively hotter days and warmer nights. Daylight hours and solar zenith angle at Barakah (23.959849° N, 52.238733° E) are estimated and shown month wise in Supplementary Tables S3, S4. Daytime highs in excess of 35°C are typically observed from early May to mid-October, while nighttime temperatures are generally above 30°C from June to September. The temperature ranges are broadly similar to those seen at Al Ain (Nelli et al., 2020a), an inland site over eastern UAE, and representative of the prevailing hot desert climate in the country. While the daily minimum occurs around 07–08 LT, as at Al Ain, the maximum temperatures at Barakah take place roughly 5 hours earlier, at about 11–12 LT while at Al Ain they are recorded at 16–17 LT. The former is expected, as the minimum temperature normally occurs around sunrise which hardly varies over the country at a given day, while the latter reflects the coastal location of Barakah. Being right on the water means an earlier arrival of the sea-breeze, with the associated cooler and more moist air preventing the temperature from increasing further in the afternoon. What is more, the sea-breeze is stronger and penetrates further inland on the western side of the country compared to the eastern side (Nelli et al., 2021b), which further exacerbates this effect. A similar timing is noted by Branch et al. (2021) for marine stations in the UAE. The annual maximum temperature occurs in mid-July (Figure 3A), in line with the fact that July is the warmest month in the country (Branch et al., 2020), while the minimum takes place in early February (Figure 3A), when the coldest air temperatures are typically seen (Nesterov et al., 2021).
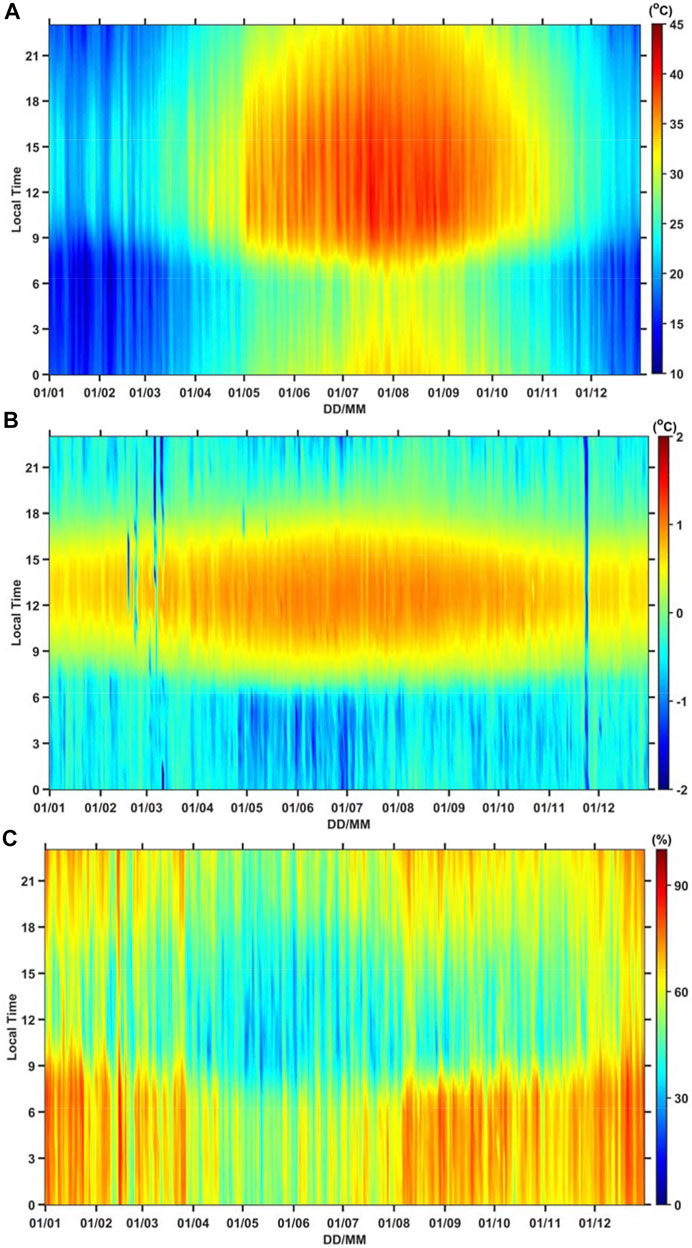
FIGURE 3. Diurnal cycle averaged over 2012–2019 for all days of the year for (A) 1.5-m temperature (°C), (B) temperature difference (°C) between 1.5 and 60 m as an indication of the stability of the near-surface atmosphere, (C) relative humidity (RH) at 1.5-m (%).
An important aspect of the local meteorological conditions with wide implications for modelling studies is the stability of the low-level atmosphere. This can be gauged by looking at the difference between the 1.5-m and 60-m air temperatures (Figure 3B). Negative values indicate an increase in temperature with height and hence the presence of an inversion, while positive values occur in association with strong surface heating. The temperature difference is positive during daytime, in particular from 09 to 16 LT, and negative at night, mostly from 00 to 06 LT. On a few days, in particular in the cold season, the nighttime temperature inversion persists during the day. This is typically due to the presence of one or more dust/cloud layers that prevent the surface from heating up much, leading to a muted diurnal cycle. The timing of the occurrences, February-March, is also consistent with the secondary peak in dust loading over the UAE noted by Nelli et al. (2021b). Besides dust, cloud cover and/or persistently strong onshore winds can also ensure a stable atmospheric profile throughout the day. The largest negative temperature differences are seen in the summer months, in particular in May-July. This is the time when the air at the site is the driest (Figure 3C), which allows for enhanced nighttime radiative cooling and a stronger daytime surface heating. As a result, the steepest negative nighttime and positive daytime 1.5-m to 60-m temperature differences occur at this time of the year. On a few instances the atmosphere is unstable at night, in particular in the months of January - March and August - September. The first may be linked to the passage of mid-latitude weather systems, as the vast majority of the annual precipitation falls in those months (Niranjan Kumar and Ouarda, 2014). The latter coincides with the period when the Intertropical Discontinuity (ITD; Fonseca et al., 2021), the boundary between the hotter and drier desert air and the cooler and more moist marine air, is over the UAE. It is possible that enhanced turbulence and upward vertical motion associated with the presence of the ITD make the environment less stable at night. In addition, from late-August the SSTs exceed the air temperatures around Barakah (Nesterov et al., 2021), with the upward sensible heat flux potentially destabilizing the atmosphere.
The third panel in Figure 3 gives the relative humidity (RH) at the site. This field is strongly controlled by the air temperature (Figure 3A) with higher temperatures leading to lower values of RH and vice-versa. However, other factors are also at play. For example, the highest nighttime temperatures are seen in July and August, but from June to August there is a steady increase in the nighttime RH suggesting an increase in the water vapour mixing ratio. This can be explained by the gradual rise in the SSTs around Barakah (Nesterov et al., 2021), which peak in late August to early September, with the increased latent heat flux helping to moisten the near-surface atmosphere. In fact, the driest conditions, with RHs dropping below 20% during daytime, are experienced in May-July, with the onset of the summer Shamal winds in May-June (Yu et al., 2016) promoting the inland advection of the more moist marine air and explaining the steady increase of the RH. The highest values of RH are typically observed in the cold season from December to February, and occur in association with the passage of mid-latitude baroclinic systems, with the major moisture sources for the region being the Arabian Gulf, Red Sea and Arabian Sea (Taraphdar et al., 2021).
The two panels in Figure 4 give the horizontal wind speed at 10-m and 60-m, respectively, with the respective wind directions given in Supplementary Figures S1, S2. The wind speed at the site is generally below 5 m s−1 at 10-m and 8 m s−1 at 60-m blowing predominantly from a northerly direction. A closer inspection of Supplementary Figures S1, S2 reveals that the wind direction at the site has a more westerly component in the cold season (i.e. it blows from a more northwesterly direction) while in the remaining months it has a more easterly direction. The former is consistent with the passage of mid-latitude baroclinic systems and the occurrence of winter Shamal events, while outside the colder month, the background wind is weaker and local-scale circulations prevail. As Barakah is located in a valley with higher terrain to the west and northwest and to the southeast, as seen in Figure 1B and as noted by Lee et al. (2013), northerly to northeasterly winds are favoured at the site. The maximum wind speeds are typically observed in the afternoon hours between 12 and 18 LT (Figures 4A,B) in association with the daytime sea-breeze circulation. However, and in particular in the cold season, comparable wind speeds are seen in the early hours just before or around sunrise, from 03 to 09 LT. These occurrences are triggered by the downward mixing of momentum of the nighttime low-level jet to the surface (Giannakopoulou and Toumi, 2012). It is interesting to note that, even though the referred low-level jet is stronger in the summer (Bou Karam Francis et al., 2017), such episodes are more evident in the cold season here. In fact, elsewhere in the UAE, such as around Abu Dhabi and Mezaira, both located to the west of Barakah, the signal is more pronounced in the warmer months (Nelli et al., 2021b). A possible explanation is that western UAE is closer to the core of the AHL (Fonseca et al., 2021), which leads to more quiescent conditions at night during the summer. The occurrence of winter Shamal events is consistent with the fact that the highest speeds at Barakah are observed from mid-January to mid-April when, despite the weaker sea-breeze (Nelli et al., 2021b), the constructive interaction of the two leads to stronger winds. As opposed to other sites such as Al Ain (Nelli et al., 2020a), however, offshore wind directions are fairly rare at the site (Supplementary Figures S1, S2). There are two possible explanations for this: 1) in the western UAE the sea-breeze penetrates further inland due to the lower terrain (Nelli et al., 2021b; Nesterov et al., 2021), and the presence of the more moist marine air reduces nighttime cooling inland with the weaker land-sea temperature gradient delaying or even preventing the occurrence of the land-breeze; 2) along the northwestern coastline the SSTs are generally lower on the western side compared to the eastern side (Nesterov et al., 2021), which will naturally make it harder for the land-breeze to develop.
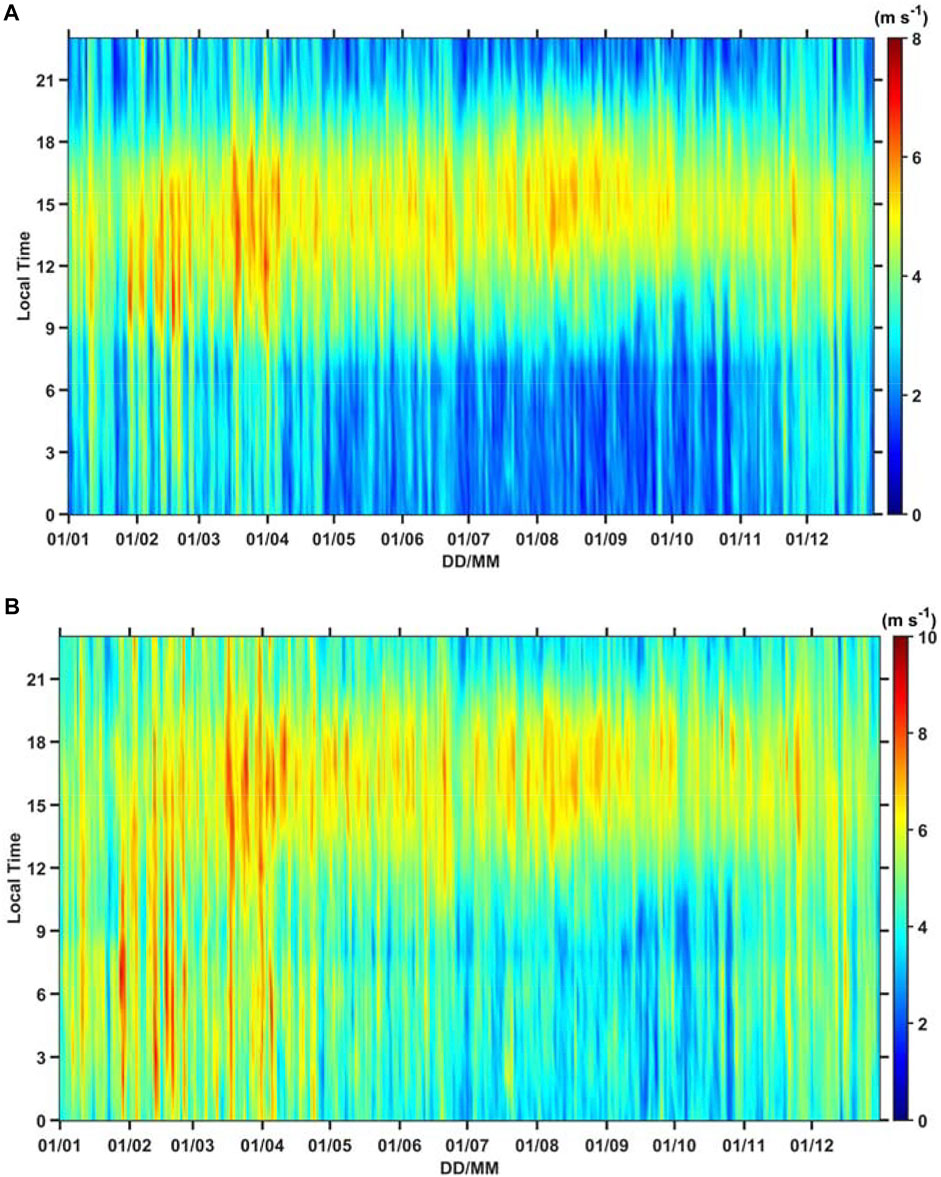
FIGURE 4. Diurnal cycle averaged over 2012–2019 for all days of the year for horizontal wind speed (m s−1) at 10 m (A) and 60 m (B) above ground level. The corresponding wind direction plots are given in Supplementary Figures S1, S2.
3.2 Wind speed variability: Wavelet analysis
In order to gain further insight into the variability of the wind speed at site, Figure 5 shows the time-series for the entire period and corresponding wavelet analysis of the normalized anomalies of daily 60-m wind speed given by the absolute values divided by the 2012–2019 standard deviation,. A visual inspection of the time-series reveals the main features highlighted before: e.g. the strongest winds occur in the cold season, and there is an increased day-to-day variability in winter compared to the summer months (Figure 5A). A better understanding of the main processes responsible for the wind speed variability can be achieved through wavelet analysis.
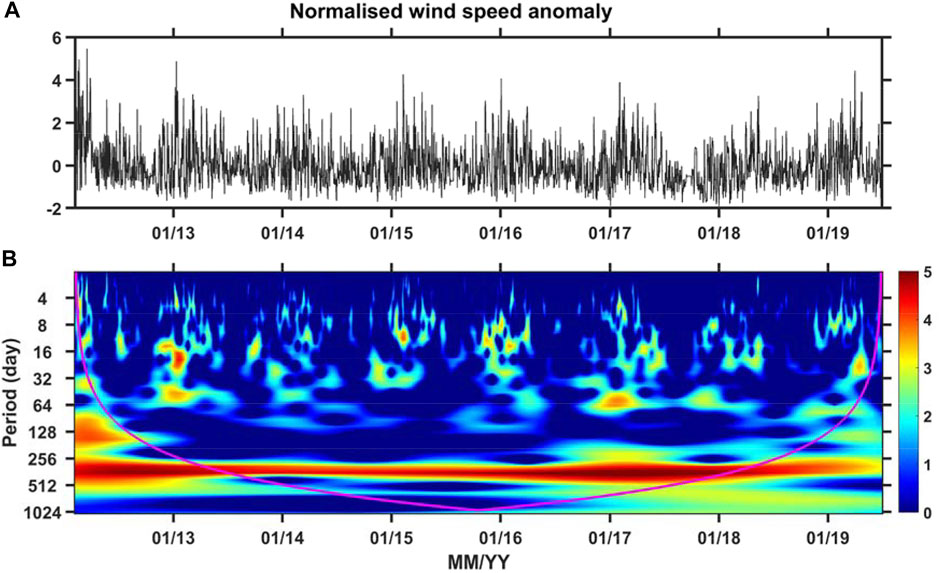
FIGURE 5. (A) Time-series of daily 60-m wind speed normalized anomalies, obtained for the February 2012 - June 2019 daily mean and standard deviation, and (B) corresponding wavelet power spectrum using the Morlet wavelet. The purple line denotes the cone-of- influence, which gives the maximum period of useful information at a particular time.
Besides the higher power for timescale of ∼365 days, which corresponds to the annual cycle, in the cold season there are peaks for time-scales of 3–5 days, which are associated with the passage of mid-latitude baroclinic systems (Abdi Vishkaee et al., 2012). A time-scale that also has higher power in winter is ∼15–50 days, and is more prominent in the winters of 2012–2013, 2016–2017 and 2017–2018. These time-scales match those of winter warm spells in the region discussed in Kumar et al. (2017), that are associated with a Rossby wave train in response to the North Atlantic SSTs mediated by the circulation in the Mediterranean. The warmer surface temperatures inland during such events will strengthen the local mesoscale circulations which, when combined with the anomalous high pressure over northern parts of the Arabian Peninsula, lead to higher wind speeds at Barakah. The fact that the power is higher in the referred three winters that feature neutral to La Nina conditions is not surprising, as the background northwesterly winds are stronger in the Arabian Gulf in La Nina winters (Thota et al., 2020).
The wind speed variability is generally reduced in the warmer months, as seen in both the time-series and the power spectrum, with most of the variability on time-scales of 30–90 days. These are the typical time-scales of the Madden-Julian Oscillation (MJO; Madden and Julian, 1994), which modulates the convection over the Arabian Sea that in turn changes the position and strength of the AHL (Steinhoff et al., 2018; Fonseca et al., 2021) and therefore the wind speed at the site. In particular, enhanced convection over the Arabian Sea leads to anomalous descent over the Arabian Peninsula and hence a stronger AHL that is also shifted northwards. In such cases the wind speed is weaker at Barakah, while when the AHL is weaker and displaced southwards the background northwesterly winds are strengthened. In the summer of 2015 the power in these time-scales is much reduced which is explained by the ongoing El Nino, the only summer El Nino in the period 2012–2018 (Figure 5B). In such events the Indian summer Monsoon is weaker, as anomalous descent over the Maritime Continent lead to easterlies in the Indian Ocean that weaken the monsoon’s southwesterly flow, with reduced deep convection in the Arabian Sea (Hrudya et al., 2020).
Other modes of variability that are known to impact the wind speed in the region are the NAO and IOD. Regarding the NAO, positive phases in the winter season are associated with a northward displacement of the Mediterranean storm track and stronger winds in the Arabian Gulf (Pozo-Vazquez et al., 2011), while in the summer, the positive phase of the summer NAO (Folland et al., 2009) leads to a stronger pressure gradient between the subtropical high and the monsoon trough which also enhances the winds in the Gulf (Chronis et al., 2011; Illes and Hegerl, 2017). Positive phases of the IOD, when the SSTs in the Arabian Sea are above normal, also enhance the heat low by warm air advection inland and/or through anomalous descent in response to enhanced convection over the Arabian Sea (Yu et al., 2015; Steinhoff et al., 2018; Fonseca et al., 2021). As noted before, a stronger thermal-low leads to weaker wind speeds at Barakah. Modes of variability such as the NAO and IOD have longer times-scales of 2–4 years (Feng and Meyers, 2003; Rossi et al., 2011) and hence their signature is not present in the wavelet plot given in Figure 5B.
4 Dynamics and thermodynamics of major weather events
In this section, the statistics of foggy, cloudy/rainy and dusty days at Barakah are presented. They are obtained using the 60-m tower data and NCM’s weather station data combined with satellite-derived estimates: 15-min SEVIRI images for the fog episodes; 30-min IRBT maps for the cloudy days; daily MODIS AOD for dust events. One of each observed during the field campaign is discussed using the observational data collected during a field campaign in winter-spring 2021, with the analysis complemented by satellite-derived and reanalysis data. Figure 6 shows the observed data from the weather sensors placed on the 10-m weather mast located right on the water (green pic Figure 1C) for the entire field campaign period (27 January - 27 April 2021).
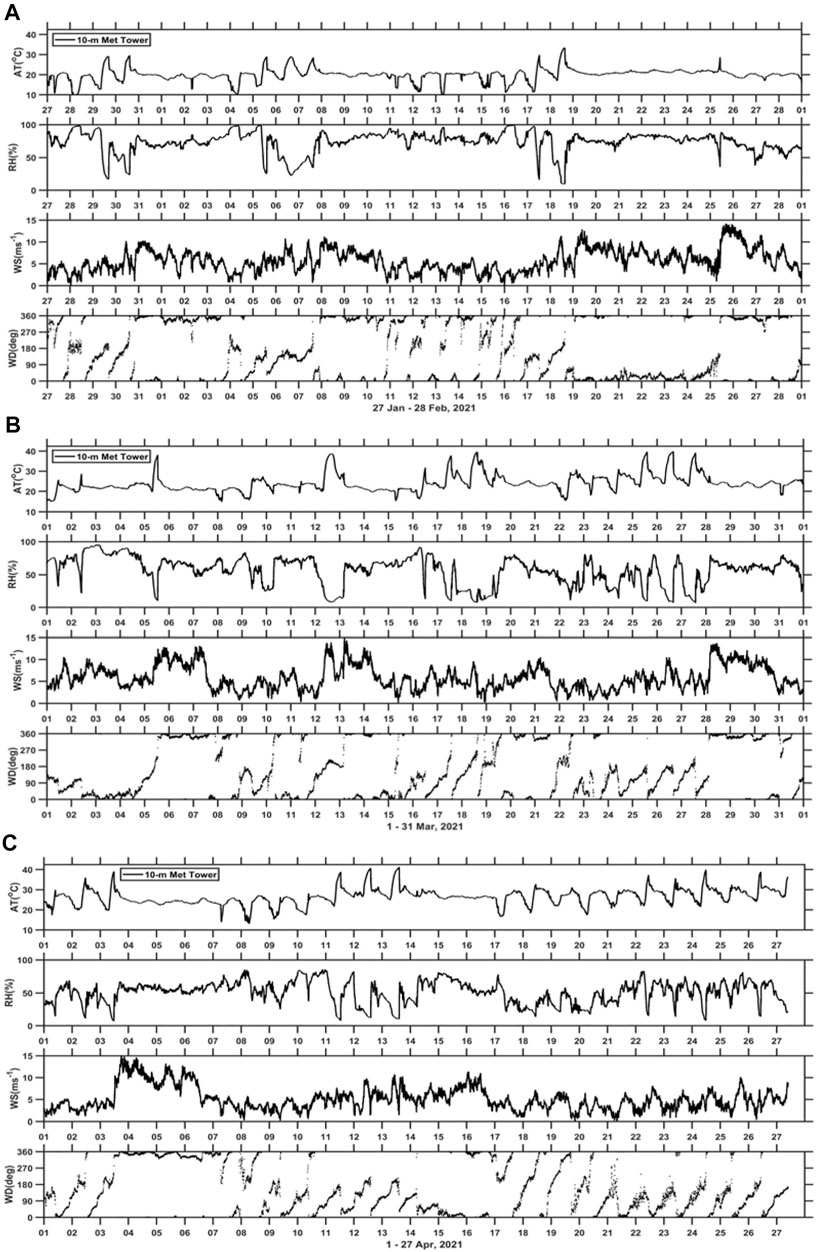
FIGURE 6. Panels from top to bottom: Air temperature (°C), relative humidity (%), horizontal wind speed (m s-1) and wind direction (°) from the 10-m tower (green pin in Fig. 1c) for the periods 27 January to 28 February 2021 (A), 1 to 31 March 2021 (B) and 1 to 27 April 2021 (C).
In line with the results presented in Section 3.1, the prevailing wind direction at the site is onshore ranging from northwest to northeast. The wind speeds are larger during daytime, with peaks values of 15 m s−1, when the background northwesterly wind is reinforced by the sea-breeze circulation. The offshore land-breeze, on the other hand, is absent on several days in particular when the large-scale flow overwhelms the local mesoscale circulations. The air temperature diurnal cycle has a magnitude of up to 20 K which is typical of arid regions that regularly experience radiative cooling at night with the development of a surface-based inversion, and strong surface heating during the day, which typically leads to a superadiabatic profile (Temimi et al., 2020b). In particular, in the colder months, and owing to the longer nights, the relative humidity can reach saturation, while during daytime it can drop below 10%. Due to the presence of dust and/or clouds, however, on some occasions the diurnal cycle at the site is suppressed.
Relevant meteorological events observed during the field campaign are listed in Supplementary Table S2. There were three fog events, two dusty days and two periods when deep convective clouds were present and in one of them precipitation was measured at the site (24 February). Some of these events are discussed in detail in the following subsections. For each meteorological phenomena (fog, convection and dust), first an overview of the frequency of occurrence at the site is given, followed by a detailed discussion of a representative case study.
4.1 Fog
4.1.1 Fog occurrence
Fog is the weather condition during which the horizontal visibility reduces to less than 1 km due to the presence of water droplets. There are several parameterization schemes available in the literature for estimating the visibility by using parameters such as the Liquid water content (LWC), droplet number distribution and RH (Gultepe et al., 2006). It is reported that a multi-variable rule-based method detects fog with relatively higher accuracy than using only the visibility (e.g. Croft et al., 1997; Zhou and Du, 2010; Weston et al., 2021b). In the present study, the fog events are detected based on the 10-min tower measurements, following the criteria of Weston et al. (2021b). In particular, all time-steps for which the 1.5-m RH exceeds 94% and the 10-m wind speed is below 3 m s−1 are labelled as potential fog stamps. Afterwards, a manual inspection of the 15-min SEVIRI images is conducted to check whether fog was indeed present at the site at that particular time. The 30-min IRBT maps are also analyzed to confirm the presence of low-level clouds. The number of fog days per month and the diurnal frequency of fog hours are summarized in Figure 7.
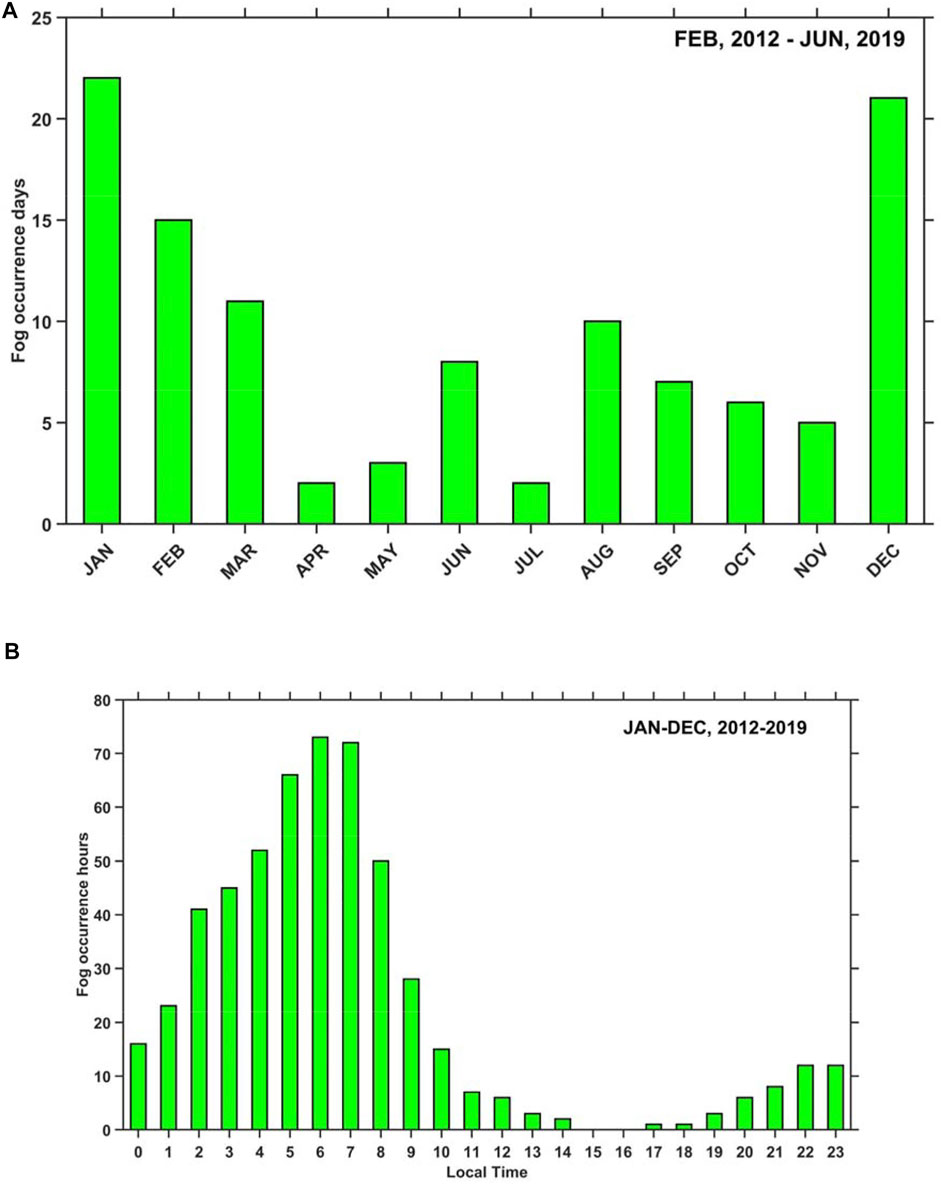
FIGURE 7. (A) Monthly fog occurrence in days for the period February 2012 - June 2019 and (B) diurnal frequency of fog hours for the 8-year period 2012–2019 at Barakah.
The annual cycle of fog occurrence at Barakah exhibits a higher number of events in the cold season, which is consistent with that seen at other sites along the UAE’s northwest coastline such as Abu Dhabi and Dubai, and at the inland station of Al Ain, as discussed in Thota et al. (2020) and Weston et al. (2021a). This arises because the majority of fog events in the UAE are of radiation type, and these are more common in the colder months. The shorter daylight hours and lower solar zenith angle at this time of the year allows for increased nighttime radiative cooling of the surface, which coupled with weak wind speeds preconditions the environment for the development of radiation fog. An inspection of the SEVIRI satellite images revealed that the fog events in the summer are of sea fog type, in particular in the months of June and August when a higher number of occurrences are recorded (Figure 7A). As noted by Nesterov et al. (2021), the SSTs are cooler than the air temperature at the site from roughly mid-March to late September, a requirement for sea fog to develop (Huang et al., 2015). The prevailing offshore winds at the site (Supplementary Figures S1, S2) help advect the fog inland. The fewer fog cases in July compared to June and August may arise from higher amounts of cloud (Figure 9A) in association with the northward advance of the Intertropical Discontinuity (ITD) region (Fonseca et al., 2021) which enhances low-level convergence and the onset of the monsoon season. This, prevents the hotter air from the desert to be cooled down to saturation when advected over the cooler SSTs in the Arabian Gulf. Weston et al. (2021a) reported a decrease in the number of fog events at Abu Dhabi in November when compared to October and December which the authors attributed to a reduced aerosol loading as measured by a field campaign at a site 70 km to the northeast of Dubai (Fillioglou et al., 2020). A similar trend is noted by Thota et al. (2020) at the nearby cities of Al Maktoum, Dubai and Sharjah. At Barakah, there is also a steady decrease in fog days from August to November. This may be explained by the gradual reduction in dust emissions (Nelli et al., 2021b), in line with the decrease in wind speed (Figure 4A), and associated lower amounts of suspended aerosols and therefore available cloud condensation nuclei. The closer proximity of the site to the inland desert when compared to the major UAE cities and reduced anthropogenic emissions likely make fog events more linked to dust emissions. The reduction in fog days from January to April arise due to the gradual warming of the atmosphere and strengthening of the wind speed, both due to enhanced sea-breeze circulations (Eager, et al., 2008) and low-level jet (LLJ) events (Figures 4A,B and Supplementary Figure S3). LLJ occurrence frequency is maximum (minimum) during spring (summer). Changes in large scale circulations associated with the breakdown of monsoon trough into two pressure systems centered over the SE Gulf and Iran (Al Senafi and Anis, 2015) explain the minimum LLJ occurrence during the second half of summer (July-August). Fog at Barakah is most common in the early hours just before or around sunrise, which takes place at ∼06–07 LT. It normally develops in the evening to early morning hours between 22 and 02 LT, and dissipates rapidly after 07 LT in response to the strong surface heating and enhanced turbulent mixing. The distribution of fog hours in Figure 7B further confirms that the dominant fog type at the site is radiation fog.
4.1.2 Fog event on 15–16 february 2021
On 15–16 February 2021, a widespread fog event occurred in the UAE including at Barakah. Figure 8A gives satellite snapshots which show the spatial extent of the fog. As discussed in Weston and Temimi (2021) and Weston et al. (2020), fog in coastal UAE typically forms as a combination of advective and radiative processes: during daytime the sea breeze brings the more moist marine air inland, while at night the strong radiative cooling, in particular in the coldest months, allows fog to form. The fog is then advected coastward by the land breeze. At 08 LT on 16 February fog blanketed nearly the entire UAE’s northwest coastline, with the presence of the Al Hajar mountains (Figure 1A) blocking it from reaching the east coast. Figures 8B,C give the measurements by the MWR and attached weather station. During the fog event, which lasted from about 00:30 to 09 LT, the wind speed did not exceed 2 m s−1 with the wind blowing from an easterly to southeasterly (offshore) direction. It is interesting to note that the temperature and wind variations during the foggy hours are positively correlated: stronger winds generally lead to increased turbulent mixing and therefore higher air temperatures, with the ∼1 m s−1 drop in wind speed around 05 LT roughly coinciding with the ∼1 K decrease in temperature. The wind direction also plays a role, with offshore winds advecting cooler air to the site while onshore winds bring in the warmer maritime air. In addition, latent heat release due to condensation and the increased downward longwave radiation flux warm up the surface during a fog event (Steeneveld and Bode, 2018), with the air temperature here rising by about 6 K from 00 to 09 LT. The relative humidity exceeded 95% during the event (Figure 8B).
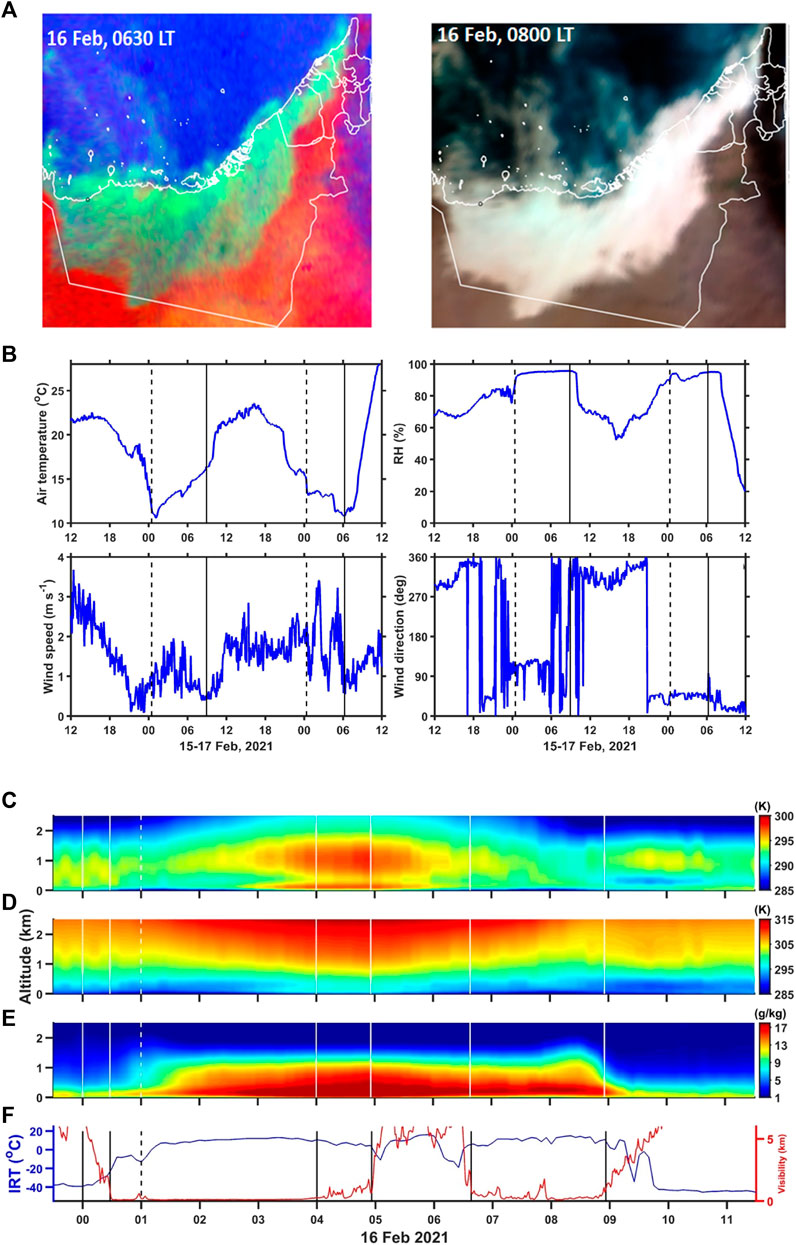
FIGURE 8. (A) SEVIRI Satellite images on 16 February 2021 at 06:30 and 08:00 Local Time (LT) over the UAE. In the nighttime images fog is highlighted in light green while in the daytime images it is shaded in white. (B) Air temperature (°C), relative humidity (%) and horizontal wind speed (m s−1) and direction (°) from 12 LT on 15 February to 12 LT on 17 February 2021. The onset and termination of fog is indicated by dashed and solid vertical lines, respectively. (C) Air temperature (K), (D) potential temperature (K) and (E) specific humidity (g kg−1) in the bottom 2.5 km of the atmosphere derived from the MWR measurements on 15 February 2021 between 0 and 11 LT. (F) Brightness temperature (K; blue curve) from the Infrared Temperature Sensor (IRTS) attached to the instrument and visibility estimates from the visiometer (km; red curve) during the same period.
Further insight into the evolution of the atmosphere during the episode is given in Figures 8C–E which shows the vertical profiles as measured by the MWR from about 00 to 11 LT on 16 February. Besides through an inspection of the near-surface weather variables in Figure 8B, fog can be detected by looking at brightness temperature measured by the IRTS attached to the MWR. In the absence of clouds, the instrument will see higher up in the atmosphere where it is colder, while in the presence of fog the estimated temperature will be much higher, more comparable with the air temperature. Figure 8F shows the expected anti-correlation between the visibility and brightness temperature. The temperature profile in the bottom 2.5 km, Figure 8C, presents the development of the nighttime stable layer from about 00:30 LT with a maximum lapse rate in the bottom 250 m of roughly 110 K km−1, in excess of the 30 K km−1 found by Temimi et al. (2020a) to be required for fog to form at Abu Dhabi. Once fog starts to develop around 01–02 LT, as indicated by the relative humidity profile, the latent heat release leads to a warmer layer just above the surface, in line with the increase in the air temperature seen in Figure 8B. What is more, a steep temperature inversion is seen around 1 km peaking at 04–05 LT, which could arise from the nighttime radiative cooling and subsidence warming associated with the subtropical anticyclones that are ubiquitous in the region (Spinks et al., 2015). Between roughly 05 and 06:30 LT, and likely due to an increase in wind speed and shift to a more onshore wind direction, the fog temporarily lifted, with a gradual weakening of the warmer layer closer to the surface. The strong inversion around 1 km also gradually faded in particular after 06 LT at the beginning of daylight hours (Figures 8C,D). Fog redeveloped around 06:40 to 09 LT when the wind speed dropped (Figure 8B) before dissipating completely afterwards. It is interesting to note that the more moist low-level layer extended upwards beyond 1 km between 08 and 09 LT just before the fog dissipated (Figure 8E). This coincided with the descending of the warmer air in the residual boundary layer downwards just after local sunrise, and is likely triggered by vertical mixing and the erosion of the nighttime stable layer. After 10 LT the typical daytime temperature profile returned with warmer air just above the surface and colder air above. As expected, once the fog cleared, the air temperature increased at a much higher rate (Figure 8C) reaching 23.5°C in the afternoon hours.
Fog also developed in the early hours of 17 February (Figure 3 of Weston et al., 2022) but did not last as long, probably because of the rapid changes in the strength of the wind with speeds as high as 3.5 m s−1 and a prevailing onshore (north to northeast) direction. The microphysics of the fog events that occurred during this field campaign are reported in Weston et al. (2022).
4.2 Convection
4.2.1 Cloud occurrence and rainfall statistics
Due to the absence of cloud observations at the site, the characterization of cloud occurrence and type of clouds is conducted through an analysis of the 30-min IRBT maps for the period 2000–2020. The IRBT thresholds given by Rao et al. (2012) and Reddy and Rao (2018) are used to identify the type of clouds at Barakah. Values of IRBT below 210 K indicate highly convective clouds; values between 210 and 235 K are associated with very deep convective clouds; IRBT in the range 235–260 K is an indication of deep convective clouds; values of 260–270 K are a sign of mid-level clouds; IRBT in the range 270–280 K is associated with cirrus or low-level clouds; and IRBT values higher than 280 K indicate clear skies. Fog clouds are excluded due to the rather small difference in IRBT between the cloud and surrounding environment. The results are presented in Figures 9A,B.
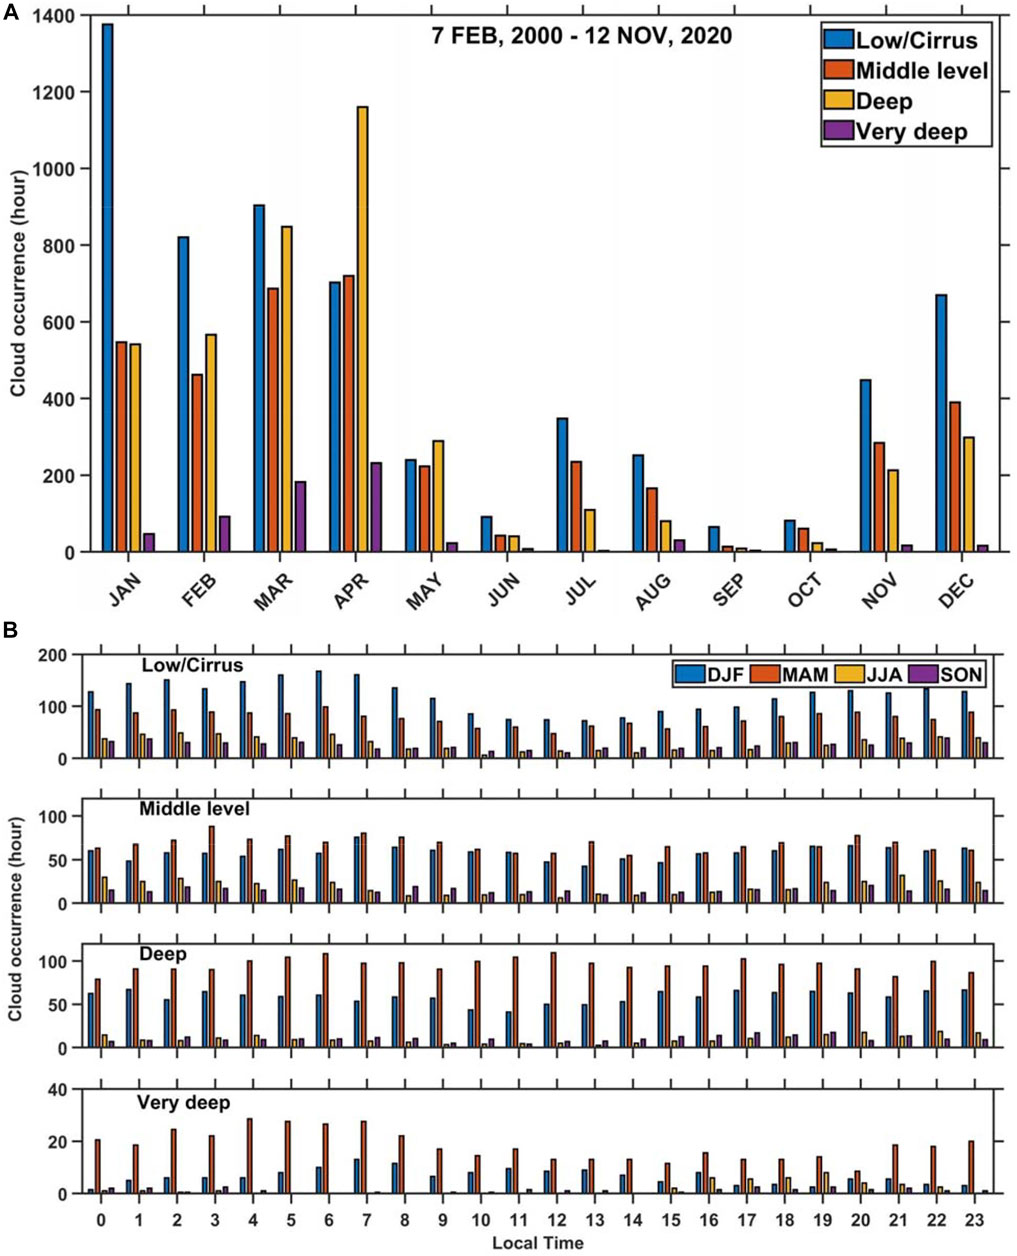
FIGURE 9. (A) Monthly occurrence (hours) of low-level/cirrus, mid-level, deep and very deep convective clouds following Reddy and Rao (2018) for the period 07 February 2000–12 November 2020 at Barakah. (B) gives the diurnal frequency of each cloud type for each season.
A discussion of the cloud climatology and variability in the Arabian Peninsula is given in Yousef et al. (2019, 2020). In the UAE, cloud cover is higher in winter and spring, when the region is under the influence of mid-latitude baroclinic systems, and lower in the summer-autumn months, when the weather is generally hot and sunny. In the warm season the majority of the clouds are seen on the eastern side in association with convection that develops around the Al Hajar mountains (Branch et al., 2020). Organized convection, in the form of mesoscale convective systems (MCSs) is more frequent in March and April, followed by January and February, as reported by Nelli et al. (2021a). The occurrence of different cloud types given in Figure 9A is broadly in line with the findings of the referred studies, with deep/very deep clouds prevailing mostly in the first 4 months of the year, and low-level clouds being more common in the cold season from November to April. It is interesting to note the secondary peak in cloud cover in the summer, in particular of low- and mid-level clouds for the month of July and August. These are the months when convection around the Al Hajar mountain is most frequent (Branch et al., 2020). It is possible that the remnants of such events are advected to the site by the cyclonic circulation associated with the AHL (Fonseca et al., 2021). In addition, and although rare, summertime convective events also develop in western UAE and are often triggered by the low-level convergence of the AHL’s circulation with the daytime sea-breeze (Steinhoff et al., 2018). Figure 9B presents the diurnal cycle of cloud cover for each season. Nelli et al. (2021a) noted that the peak in MCS occurrence in the UAE in March-April is at 02 LT, with high values from local nighttime to early morning hours. The diurnal cycle of very deep convection largely reflects this, with very deep convective events in the summer more likely in the late afternoon to evening hours as they result from the strong daytime surface heating and the interaction between the AHL and afternoon sea-breeze and southerlies along the ITD. Deep convective events occur almost exclusively in winter and spring months and do not exhibit a clear diurnal cycle, an indication that they result from larger-scale systems that are advected to the region by the background flow. Similar results are seen for mid-level clouds, although these occur more frequently in the warmer months. Low-level/cirrus clouds at the site are more frequent from the evening to early morning hours and in the winter and spring months. These likely comprise 1) low-level/cirrus clouds that are part of MCSs, which also prevail at night; 2) cirrus clouds that accompany cold fronts, usually found behind them; 3) clouds that develop when the cooler air, behind a cold-front, moves over the warmer Arabian Gulf SSTs (Perrone, 1979). In terms of the cloud amounts, low-level/cirrus clouds are up to twice more likely to be spotted at Barakah than mid-level and deep convective clouds, for which comparable amounts are observed at the site, and five times more likely than deep convective clouds.
Based on NCM’s daily accumulated precipitation data at Barakah and Al Ruwais during the period when data are available, it is observed that the vast majority of precipitation in the UAE falls during the cold season from December to March in conjunction with the passage of mid-latitude weather systems, with a secondary peak in the summer near the Al Hajar mountains due to convective events that develop locally (Supplementary Figure S3). These results are in line with those reported by Niranjan Kumar and Ouarda (2014) and Wehbe et al. (2017, 2018). The heavier precipitation in the months of March and April is likely associated with the passage of MCSs, as Nelli et al. (2021a) noted that these are the months when they occur most frequently. The mean annual rainfall at Al Ruwais for the full 6-year period is 37.5 mm yr−1 (Supplementary Figure S4), within the range 30–120 mm yr−1 for the UAE estimated from rain gauges and satellite data (Wehbe et al., 2017, 2018). Given the close proximity of the two sites, it is no surprise that the timing of the precipitation events is roughly the same, with at times an earlier peak at Barakah (e.g. for the event in late March 2017) due to its more westward location and the background west-east flow. This also explains why the rainfall is generally heavier at Barakah where at times it rains up to three times more than at Al Ruwais: the interaction of the weather systems with the drier desert air as they push eastwards promotes evaporative cooling and therefore a reduction of the associated rainfall. For the period over which the two datasets are available, August 2016 to December 2019, 327.8 mm of rain fell at Barakah while only 98.6 mm rain occurred at Al Ruwais. In addition, there is a marked inter-annual variability, with El Nino winters (2014/15, 2015/16 and 2018/19) generally featuring wetter conditions than La Nina ones (2017/18). This is in line with a southward displaced subtropical jet and mid-latitude storm track in El Nino years (Niranjan Kumar and Ouarda, 2014). Al Gheweifat (inland) located 67.5 km to the west of Barakah has an annual rate of ∼36.8 mm yr−1, comparable to that seen at Al Ruwais and typical of the annual rainfall measured in western UAE.
4.2.2 Convective event on 24–25 february 2021
Despite the hyperarid conditions, precipitation does occur in the region. A precipitating event over Barakah took place on 24–25 February resulting in 0.5 mm of rain at the site (Figure 10A). The IRBT thresholds used in Rao et al. (2012) and summarized in Section 4.2.1 are employed here to classify the clouds, with the values estimated around Barakah given in Supplementary Figure S5.
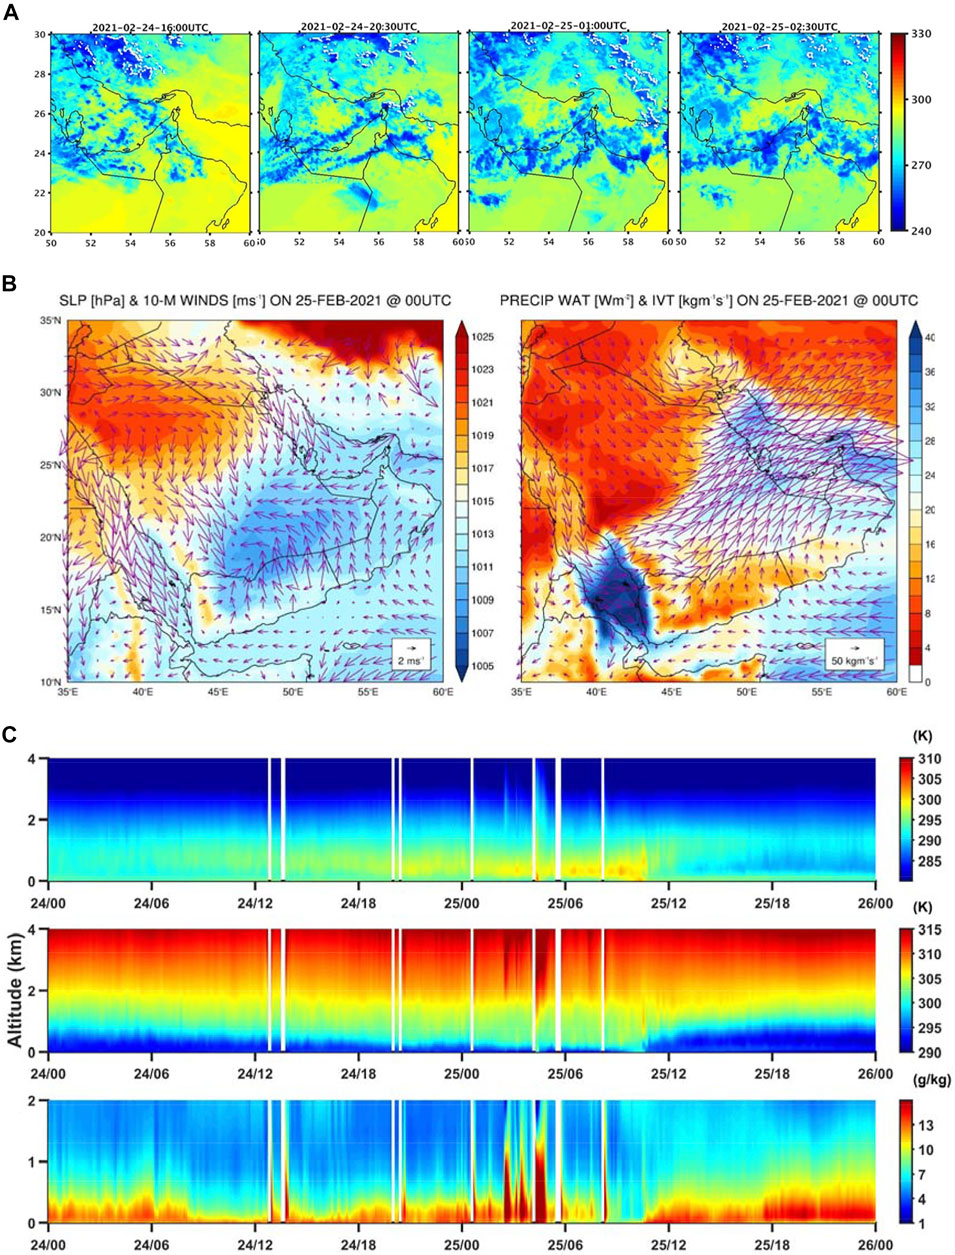
FIGURE 10. (A) IRBT (K) at selected times from 16 UTC on 24 February to 02:30 UTC on 25 February 2021 over the eastern Arabian Peninsula. (B) (left) sea-level pressure (SLP; shading; hPa) and 10-m wind (vectors; m s−1) and (right) precipitable water (shading; kg m−2) and integrated vapour transport (IVT; vectors; kg m−1 s−1) at 00 UTC on 25 February 2021. (C) From top to bottom: Vertical profiles of air temperature (K), potential temperature (K), and specific humidity (g kg−1) below 4 km in altitude for the period 24 to 25 February 2021 derived from the MWR measurements. White gaps denote missing data.
Widespread convection occurred in the UAE in late February 2021 (Figure 10A), with IRBT values dropping to as low as 245 K (Supplementary Figure S5), a sign of deep convective clouds. As a result of the circulation associated with a low pressure over southern Arabian Peninsula, moist air from the Red Sea is advected towards the UAE (Figure 10B), a common moisture source for the country (Niranjan Kumar et al., 2015; Taraphdar et al., 2021). To the north, a ridge is advecting cooler and drier air southwards, with a cold front located around central parts of the Arabian Gulf at this time, where the two flows converge. The front swept through the site on 25 February (cf. Figure 10B), and on 26 February strong northwesterly winds blew over the majority of the UAE as the high pressure over northern Saudi Arabian shifted southwards and expanded in size, with the air getting progressively drier (Figure not shown). This event is known as a “winter Shamal” and is a regular occurrence in the region in the cold season (Abdi Vishkaee, 2012). The passage of the front is clearly evident in the time-series of near-surface weather fields (Figure 6), with this winter event coming in the heels of one that took place on 18 February. The maximum temperature on 25 February was around 303 K with southerly winds ahead of the front, and the rainfall occurring around 04 UTC. Behind the front the wind shifted to a northerly direction, its speed increased to around 15 m s−1 at the tower site, some of the strongest observed during the field campaign. In addition, the temperatures stayed below 296 K in the following 3 days, with the background diurnal cycle only resuming on 1 March. A more in-depth analysis of the changes in the atmospheric state can be gained by inspecting the observations collected by the MWR (Figure 10C). The vertical transport of moisture as a result of the low-level wind convergence on 25 February is clearly seen, with mixing ratios in excess of 13 g kg−1 at more than 1 km above the surface. The warmer temperatures around 1–2 km on 24 February, and in particular between 00 and 10 UTC on 25 February, are probably associated with the presence of clouds and upward advection of warm and moist air, in line with the surface data (Figure 6). The stratification was at times unstable on 25 February ahead of the front as evidenced by the potential temperature profile. As the front sweeps through there is an abrupt decrease in temperature and a drying of the atmosphere. However, the northwesterly winds pick up moisture as they move over the Arabian Gulf, which explains the moist layer up to 500 m from 25 February at 12 UTC extending beyond 26 February at 00 UTC. The presence of a steep temperature inversion confines the moisture to just above the surface, with the temperature and specific humidity between 0.5 and 1.5 km dropping by up to 10 K and 10 g kg−1, respectively, as the front moves through. Despite the clear skies, the fact that this event took place in February when the solar zenith angle is still low, and also because of the persistently strong winds and surface-based inversion, there was a reduced diurnal variability which is also seen at the surface (Figure 6).
4.3 Dust
4.3.1 Aerosol statistics
Figure 11 shows the monthly AOD from the combined MODIS Terra and Aqua daily product around Barakah (20 km radius, land only) for the period 2000–2020. The AOD reaches its highest value in the summer, in line with the studies of Filioglou et al. (2020) and Nelli et al. (2021b). This is consistent with the fact that dust is the prevailing aerosol type in the UAE, and dust emissions are more frequent in the warmer months (Nelli et al., 2021b). As shown in a dedicated field campaign, in coastal UAE dust and sulfates dominate over sea salt, with the latter playing a minor role in the regional aerosol chemistry (Kaku et al., 2016) due to low wind speed over the southern Arabian Gulf preventing the uplift of a significant amount of sea salt aerosols. Even though the 10-m and 60-m wind speeds are larger in the cold season (Figures 4A,B) and the winter Shamal winds are stronger than their summertime counterparts, as noted by Yu et al. (2016), in the Arabian Peninsula summertime Shamal events occur more frequently and are more closely related to dust activities in the region (Bou Karam Francis et al., 2017). As both the atmosphere inland and the soil is drier in the warmer months, summertime dust emissions exceed those of wintertime months in the UAE and surrounding region (Nelli et al., 2021b). Additionally, the dust activity can be higher during summer due to 1) increased gustiness arising from the development of local convection and resulting cold pools (e.g., Bou Karam et al., 2014; Francis et al., 2019); 2) northward propagation of the ITD and associated near-surface turbulent mixing (Bou Karam et al., 2008, 2009); 3) development of dry cyclones from cut-off lows over the Arabian Peninsula (Francis et al., 2019) and strong convergence along the ITD (Francis et al., 2020). The secondary peak in February, associated with the intrusion of cold fronts from mid-latitudes (Kaskaoutis et al., 2019) reported by Nelli et al. (2021b), is not seen at the location of Barakah. Instead, there is a steady increase in AOD throughout the winter season at a rate of roughly 0.2 months−1 consistent with the strengthening of the winds (Figures 4A,B), and the gradual drying of the surface. From April to June, the AOD continues to increase albeit at a slower rate of 0.15 months−1, as local emissions are likely reduced owing to the weaker wind speeds due to the development of the AHL whose main core extends into western UAE (Fonseca et al., 2021).
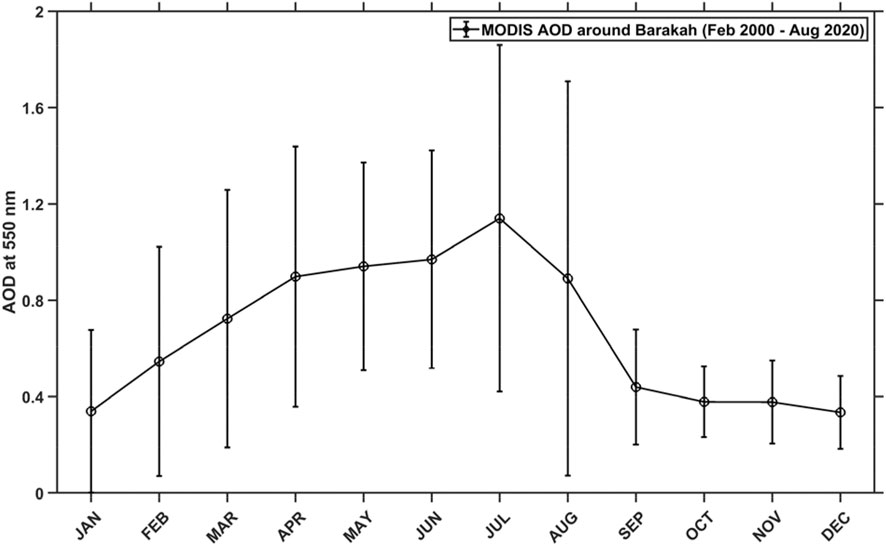
FIGURE 11. Monthly-averaged daily AOD at 550 nm from the MODIS instruments onboard the Terra (February 2000–August 2020, MOD04_L2; v6.1) and Aqua (July 2002–August 2020, MYD04_L2; v6.1) satellites around Barakah location (20 km radius, land only). Error bar denotes the one standard deviation from the mean.
July is the month when the land surface temperature reaches its maximum annual value (Figure 3A). The subsequent enhanced sea-breeze circulation, reinforced by the Shamal winds, and gustiness from convective events and along the ITD (Nelli et al., 2021a; Fonseca et al., 2021), leads to the advection and lifting higher amounts of dust at the site. This explains the peak of AOD in the month of July as also reported by Nelli et al. (2021b) for the UAE. As the surface temperature drops and the summertime Shamal events fade (the Shamal season usually terminates around mid-August, as found by Yu et al. (2016), the air becomes clearer around Barakah, with the AOD dropping from about 0.9 in August to a wintertime value of 0.4 in September. The gradual decrease in the later months of the year can be explained by the more moist and cooler conditions. The range of AOD values around Barakah given in Figure 11, about 0.3–1.2, is larger than that measured in-situ at Al Dhaid located next to Dubai during a 1-year field campaign, where monthly-mean values of 0.10–0.32 with a maximum value of 1.04 at 532 nm were observed (Filioglou et al., 2020). This can be explained by the closer proximity of Barakah to the interior desert, which has the largest contribution to the AOD in the UAE at both coastal and inland stations (Nelli et al., 2021b). In fact, the AODs at Barakah are more comparable to those measured in-situ at the city of Mezaira located deep in the UAE desert (Nelli et al., 2021b). The dustier environment at Barakah compared to major cities further to the east has implications for weather and climate studies, and stresses the need to measure the AOD and other relevant aerosol properties for a better characterization of the local environment.
4.3.2 Dust storm on 13 march 2021
Being adjacent to a major dust source, the Empty Quarter Desert of the UAE, dust events are common in the UAE, peaking in the summer season but with a secondary maximum in late winter in association with the cold fronts (Kaskaoutis et al., 2019). One of such events is summarized in Figure 12. The two snapshots of SEVIRI dust RGB on 13 March 2021 in Figure 12A show a cold front propagating south-eastward over the southern Arabian Peninsula into the UAE associated with a low pressure over Iran. Besides the horizontal advection of the front, it is interesting to see its expansion in the vertical. In particular, at 04 UTC (left snapshot) dust is lifted near the surface by the density current associated with the cold front, given by the purple shading in the SEVIRI image. At 10 UTC, dust is mixed up vertically and the shading turns pink. The location of the front can be seen in the ERA-5 plots (Figure 12B): note the convergence of the southerly winds from the Arabian Sea and the northwesterly winds associated with a high-pressure located over northern Saudi Arabia extending from western Saudi Arabia to western UAE and the Arabian Gulf. The cyclonic circulation linked with the low pressure over Iran is drawing the more moist air from the Arabian Gulf and Sea of Oman inland into the country, as confirmed by the integrated water vapour transport vectors. On 14 March 2021, the front was over the Saudi Arabia borders with Oman and Yemen, with moist air from the Red Sea and the Arabian Gulf converging into the UAE (Supplementary Figure S6). As seen in the time-series in Figure 6, with the arrival of the cold front the air temperature at the site dropped from about 38°C on 12 March to 30°C on 13 March and to 23°C on 14 and 15 March. This marked change is accompanied by a shift in wind direction to northerly and a strengthening of its speed up to 15 m s−1 (Figure 6). The relative humidity more than tripled from about 15% ahead of the front on 12 March to values in the range 50–90% on 13–15 March (Figure 6).
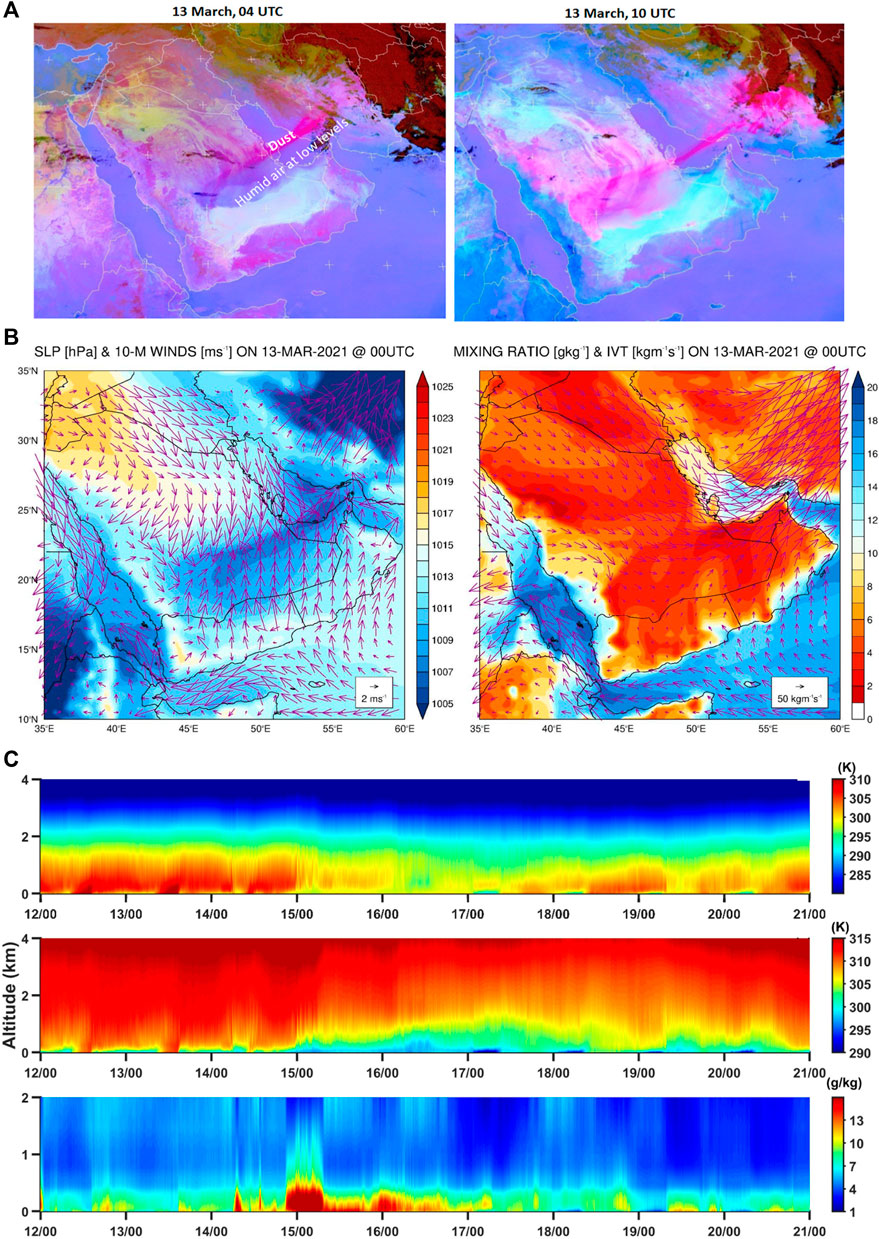
FIGURE 12. (A) False colour Red-Green-Blue (RGB) images from SEVIRI (Banks et al., 2019) on 13 March 2021 at 04 and 10 UTC. In both panels, thick high-level clouds are shaded in orange or brown while thin high-level clouds are shaded in black; dust is given in magenta or pink, and sandy regions are highlighted in white; dry land is shaded in pale blue during daytime and pale green at night. (B) (left) sea-level pressure (SLP; shading; hPa) and 10-m wind (vectors; m s−1) and (right) 2-m water vapour mixing ratio (shading; g kg−1) and integrated vapour transport (IVT; vectors; kg m−1 s−1) at 00 UTC on 13 March. (C) From top to bottom: Vertical profiles of air temperature (K), potential temperature (K) and specific humidity (g kg−1) below 4 km in altitudes for the period 12 to 21 March 2021 derived from the MWR measurements.
In order to gain further insight into this event, Figure 12C gives the MWR temperature, potential temperature and specific humidity profiles in the lowest 4 km from 12 to 21 March 2021. The passage of the dust front is characterized by an abrupt decrease in temperature, by as much as 15 K in particular in the bottom 2 km, and increase in specific humidity, by up to 10 g kg−1 in the lowest 500 m above the surface. These are the characteristics of a density current, which can be seen in the observations and satellite images (Figures 12A,C). During the event itself, which lasted from the beginning of 13 March to the beginning of 16 March, there were two warmer layers, associated with the presence of dust and clouds. This is further confirmed by the CALIPSO overpass on 15 March 2021, which shows dust and clouds over Barakah. From the mean temperature profile between 10 and 12 LT 14 March 2021, the top of two inversions are at 100 m and 1.32 km with maximum lapse rates of 75 K km−1 and 9.3 K km−1, respectively, and with temperatures 6.6 K colder in between. This temperature profile persisted at all times, and prevented the development of the daytime superadiabatic profile seen before (on 12 March) and after (on 17 March) the episode. At the end of 15 March, the upper warmer layer mixed down to the surface and the background atmospheric variability resumed on 16 March. Due to the presence of a steep inversion just above the surface, with lapse rates of up to 75 K km−1, the moist air remained below 500 m during the period. The combined passage of a cold front and associated advection of more moist and cooler air, as well as the reduction in the downward shortwave radiation flux due to the presence of dust and clouds, explains the roughly 15 K decrease in maximum air temperature in 2 days at the site (Figure 6).
5. Discussion and conclusion
The atmospheric conditions at Barakah in western United Arab Emirates (UAE), are characterized using 10-min measurements from a 60-m meteorological tower for the period 2012–2019 and observations collected during a field campaign which began in October 2020. The findings of this work are particularly relevant not just to evaluate and calibrate numerical models, satellite-derived products and reanalysis datasets, but also to further our understanding of the meteorological conditions in a hyperarid region that has been far less researched than eastern parts of the UAE, where all the main cities are located. This is particularly pertinent given the predicted expansion of the arid regions in a warming climate.
An analysis of the 8-years meteorological data revealed that the presence of a dust layer above the surface, cloud cover and/or relentless strong onshore winds can lead to the persistence of the nighttime inversion into daytime hours. Conversely, under the influence of baroclinic systems in the cold season or when the Intertropical Discontinuity is over the area in the warmer months, the atmosphere can be unstable at night. The wind speed is found to be generally under 5 m s−1 at 10-m and 8 m s−1 at 60-m with peaks around 12–18 Local Time (LT), in association with the sea-breeze, and at 02–09 LT, due to the downward mixing of momentum from the nighttime low-level jet. The prevailing wind direction at the site is onshore. The weaker land-breezes compared to other places in the country explained by the 1) flatter terrain and subsequent deeper inland penetration of the sea-breeze, and 2) lower sea surface temperatures compared to those along the northwestern coastline. The passage of mid-latitude weather systems and the circulation anomalies in response to a Rossby wave train are the major modes of variability in the winter season, while in the summer fluctuations in the convection over the Arabian Sea and subsequent impact on the strength of the Arabian Heat Low (AHL) play the largest role in the wind speed variability. Due to its proximity to the core of the AHL, a stronger AHL leads to weaker speeds at the site and vice-versa while during La Nina winds are stronger compared to El Nino episodes.
A statistical analysis of fog, dust and cloudy days at Barakah is performed using ground-based and satellite-derived measurements. The dominant fog type is radiation fog, while summertime fog events are mostly sea-fog advection episodes, which develop as the SSTs over the Gulf are cooler than the atmosphere aloft. Clouds are more frequent in winter and spring when the region is mostly under the influence of mid-latitude baroclinic systems, with deep and very deep convective clouds occurring more often in March and April, the peak months for mesoscale convective systems (MCSs) in the UAE (Nelli et al., 2021a). The aerosol optical depth (AOD) reaches its peak in the summer months, in particular in July, when dust, the prevailing aerosol type in the UAE, is more abundant as a result of the drier conditions and increased gustiness in the region.
During a field campaign in 2021 several weather events were recorded and are investigated here in detail. On 15–16 February 2021 a widespread fog event affected the UAE. It was an advective-radiative fog with the temperature profiles from the radiometer indicating a surface-based inversion in excess of 30 K km−1, above the threshold found to be needed for fog to form in the UAE (Temimi et al., 2020b). The low-level wind convergence associated with the passage of a cold front on 24–25 February 2021 led to a marked vertical moisture transport, with mixing ratios in excess of 13 g kg−1 observed at more than 1 km above the surface. As the front swept through, there was a pronounced cooling and drying of the atmosphere, a typical “winter Shamal” event, with an up to 10 K and 10 g kg−1 drop in temperature and specific humidity of the 0.5–1.5 km layer, respectively. During the dust event on 13 March 2021 a double temperature inversion was present as a result of a dust and cloudy layer whose persistence prevented the development of the daytime superadiabatic lapse rate for several consecutive days. In this case, the air temperature remained below 23°C with northerly wind speeds of up 15 m s−1 continuing for 3 days as a density current moved through the site in association with a cold front.
The long-term analysis and the case studies described here highlight the complex nature of the atmospheric flow at the site and its substantial variability from diurnal to inter-annual time-scales, which has important implications for weather and climate studies. The findings of this work stress the need to have a comprehensive observational network in particular in data-sparse regions such as the UAE for a better understanding of the environment and an accurate representation in numerical models.
Data availability statement
The original contributions presented in the study are included in the article/Supplementary Material, further inquiries can be directed to the corresponding author.
Author contributions
NN. Data acquisition and analysis, manuscript revisions. DF: Conception of the study, interpretation and validation of results, review and revise the manuscript. RF: Writing the original draft, analysis of results. EB: Project management and validation of results. YA: Project management. MT: Validation of results. RA: Contribution to data acquisition. MW: Data processing. CC: Data processing and support. All authors interpreted results and provided input to the final manuscript.
Funding
This research work was supported by FANR through the research project Modeling of Radionuclides Dispersion in the UAE Environment (MORAD).
Acknowledgments
The authors wish to acknowledge the contribution of Khalifa University’s high-performance computing and research computing facilities to the results of this research. We are also grateful to the Federal Authority for Nuclear Regulation (FANR; https://www.fanr.gov.ae/en) and the Nawah Energy Company (https://www.nawah.ae/) for providing the 60-m meteorological tower measurements for February 2012 to June 2019 and invaluable support and assistance in the deployment of the instruments during the field campaigns. We would like to thank the United Arab Emirates’ National Center of Meteorology for providing the weather station observations for the Barakah and Al Ruwais weather stations.
Conflict of interest
The authors declare that the research was conducted in the absence of any commercial or financial relationships that could be construed as a potential conflict of interest.
Publisher’s note
All claims expressed in this article are solely those of the authors and do not necessarily represent those of their affiliated organizations, or those of the publisher, the editors and the reviewers. Any product that may be evaluated in this article, or claim that may be made by its manufacturer, is not guaranteed or endorsed by the publisher.
Supplementary material
The Supplementary Material for this article can be found online at: https://www.frontiersin.org/articles/10.3389/fenvs.2022.972380/full#supplementary-material
References
Abdelmohimen, M. A. H., and Algarni, S. A. (2018). Numerical investigation of solar chimney power plants performance for Saudi Arabia weather conditions. Sustain. Cities Soc. 38, 1–8. doi:10.1016/j.scs.2017.12.013
Abdi Vishkaee, F., Flamant, C., Cuesta, J., Oolman, L., Flamant, P., and Khalesifard, H. R. (2012). Dust transport over Iraq and northwest Iran associated with winter shamal: A case study. J. Geophys. Res. 117. doi:10.1029/2011JD016339
Al Senafi, F., Anis, A., and Menezes, V. (2019). Surface heat Fluxes over the northern Arabian Gulf and the northern Red Sea: Evaluation of ECMWF-ERA5 and NASA-MERRA2 Reanalyses. Atmosphere 10, 504. doi:10.3390/atmos10090504
Al Senafi, F., and Anis, A. (2015). Shamals and climate variability in the northern Arabian/Persian Gulf from 1973 to 2012. Int. J. Climatol. 35, 4509–4528. doi:10.1002/joc.4302
Almazroui, M., Islam, M. N., Dambul, R., and Jones, P. D. (2014). Trends of temperature extremes in Saudi Arabia. Int. J. Climatol. 34, 808–826. doi:10.1002/joc.3722
Almazroui, M., Nazrul Islam, M. N., Athar, H., Jones, P. D., and Rahman, M. A. (2012). Recent climate change in the Arabian Peninsula: Annual rainfall and temperature analysis of Saudi Arabia for 1978-2009. Int. J. Climatol. 32, 953–966. doi:10.1002/joc.3446
Banks, J. R., Hünerbein, A., Heinold, B., Brindley, H. E., Deneke, H., and Schepanski, K. (2019). The sensitivity of the colour of dust in MSG-SEVIRI Desert Dust infrared composite imagery to surface and atmospheric conditions. Atmos. Chem. Phys. 19, 6893–6911. doi:10.5194/acp-19-6893-2019
Bou Karam, D., Flamant, C., Knippertz, P., Reitebuch, O., Pelon, J., Chong, M., et al. (2008). Dust emissions over the Sahel associated with the west African monsoon intertropical discontinuity region: A representative case-study. Q.J.R. Meteorol. Soc. 134, 621–634. doi:10.1002/qj.244
Bou Karam, D., Flamant, C., Tulet, P., Todd, O., Pelon, J., Williams, M., et al. (2009). Dry cyclogenesis and dust mobilization in the intertropical discontinuity of the west African monsoon: A case study. J. Geophys. Res. 114, D05115. doi:10.1029/2008JD010952
Bou Karam, D., Williams, E., Janiga, M., Flamant, C., McGraw-Herdeg, M., Cuesta, J., et al. (2014). Synoptic-scale dust emissions over the Sahara Desert initiated by a moist convective cold pool in early August 2006. Q.J.R. Meteorol. Soc. 140, 2591–2607. doi:10.1002/qj.2326
Bou Karam Francis, D., Flamant, C., Chaboureau, J.-P., Banks, J., Cuesta, J., Brindley, H., et al. (2017). Dust emission and transport over Iraq associated with the summer Shamal winds. Aeolian Res. 24, 15–31. doi:10.1016/j.aeolia.2016.11.001
Branch, O., Behrendt, A., Gong, Z., Schwitalla, T., and Wulfmeyer, V. (2020). Convection Initiation over the eastern Arabian Peninsula. metz 29 (1), 67–77. doi:10.1127/metz/2019/0997
Branch, O., Schwitalla, T., Temimi, M., Fonseca, R., Nelli, N., Weston, M., et al. (2021). Seasonal and diurnal performance of daily forecasts with WRF V3.8.1 over the United Arab Emirates. Geosci. Model Dev. 14, 1615–1637. doi:10.5194/gmd-14-1615-2021
Branch, O., and Wulfmeyer, V. (2019). Deliberate enhancement of rainfall using desert plantations. Proc. Natl. Acad. Sci. U.S.A. 116 (38), 18841–18847. doi:10.1073/pnas.1904754116
Chronis, T., Raitsos, E. R., Kassis, D., and Sarantopoulos, A. (2011). The summer North Atlantic Oscillation influence on the eastern Mediterranean. J. Clim. 24, 5584–5596. doi:10.1175/2011JCLI3839.1
Croft, P. J., Pfost, R. L., Medlin, J. M., and Johnson, G. A. (1997). Fog forecasting for the southern region: A conceptual model approach. Wea. Forecast., 12, 5452–5556. doi:10.1175/1520-0434(1997)012%3C054510.1175/1520-0434(1997)012<0545:ffftsr>2.0.co;2
Eager, R. E., Raman, S., Wootten, A., Westphal, D. L., Reid, J. S., and Al Mandoos, A. (2008). A climatological study of the sea and land breezes in the Arabian Gulf region. J. Geophys. Res. 113, D15106. doi:10.1029/2007JD009710
Feng, M., and Meyers, G. (2003). Interannual variability in the tropical Indian ocean: A two-year time-scale of Indian Ocean Dipole. Deep Sea Res. Part II Top. Stud. Oceanogr. 50 (12-13), 2263–2284. doi:10.1016/S0967-0645(03)00056-0
Filioglou, M., Giannakaki, E., Backman, J., Kesti, J., Hirsikko, A., Engelmann, R., et al. (2020). Optical and geometrical aerosol particle properties over the United Arab Emirates. Atmos. Chem. Phys. 20, 8909–8922. doi:10.5194/acp-20-8909-2020
Folland, C. K., Knight, J., Linderholm, H. W., Fereday, D., Ineson, S., and Hurrell, J. W. (2009). The summer North Atlantic Oscillation: Past, present, and future. J. Clim. 22 (5), 1082–1103. doi:10.1175/2008JCLI2459.1
Fonseca, R., Francis, D., Nelli, N., and Thota, M. (2021). Climatology of the heat low and the intertropical discontinuity in the Arabian Peninsula. Intl J. Climatol. 42, 1092–1117. doi:10.1002/joc.7291
Fonseca, R., Zorzano‐Mier, M.-P., Azua‐Bustos, A., González‐Silva, C., and Martín‐Torres, J. A. (2019). A surface temperature and moisture intercomparison study of the Weather Research and Forecasting model, in‐situ measurements and satellite observations over the Atacama Desert. Q.J.R. Meteorol. Soc. 145, 2202–2220. doi:10.1002/qj.3553
Francis, D., Alshamsi, N., Cuesta, J., Gokcen Isik, A. G., and Dundar, C. (2019). Cyclogenesis and density currents in the Middle East and the associated dust activity in September 2015. Geosciences 9, 376. doi:10.3390/geosciences9090376
Francis, D., Chaboureau, J.-P., Nelli, N., Cuesta, J., Alshamsi, N., Temimi, M., et al. (2021). Summertime dust storms over the Arabian Peninsula and impacts on radiation, circulation, cloud development and rain. Atmos. Res. 250, 105364. doi:10.1016/j.atmosres.2020.105364
Francis, D., Fonseca, R., Nelli, N., Teixido, O., Mohamed, R., and Perry, R. (2022). Increased Shamal winds and dust activity over the Arabian Peninsula during the COVID-19 lockdown period in 2020. Aeolian Res. 55, 100786. doi:10.1016/j.aeolia.2022.100786
Ghasem, A., Shamsipour, M., and Miri, T., (2012) Synoptic and remote sensing analysis of dust events in southwestern Iran. Nat. Hazards 64, 1625–1638. doi:10.1007/s11069-012-0328-9
Giannakopoulou, E. M., and Toumi, R. (2012). The Persian Gulf summertime low-level jet over sloping terrain. Q. J. R. Meteorological Soc. 138, 145–157. doi:10.1002/qj.901
Griesfeller, A., Lahoz, W. A., de Jeu, R. A. M., Dorigo, W., Haugen, L. E., Svendby, T. M., et al. (2016). Evaluation of satellite soil moisture products over Norway using ground-based observations. Int. J. Appl. Earth Observation Geoinformation 45, 155–164. doi:10.1016/j.jag.2015.04.016
Gultepe, I., Muller, D., and Boybeyi, Z. (2006). A New visibility parameterization for warm-fog applications in numerical weather prediction models. J. Appl. Meteorology Climatol. 45 (11), 1469–1480. doi:10.1175/JAM2423.1
Hersbach, H., Bell, B., Berrisford, P., Hirahara, S., Horanyi, A., Munoz-Sabater, J., et al. (2020). The ERA5 global reanalysis. Q. J. R. Meteorological Soc. 146 (730), 1999–2049. doi:10.1002/qj.3803
Hrudya, P. H., Varikoden, H., and Vishnu, R. (2020). A review on the Indian summer monsoon rainfall, variability and its association with ENSO and IOD. Meteorology Atmos. Phys. 133, 1–14. doi:10.1007/s00703-020-00734-5
Hsu, N. C., Tsay, S. C., King, M. D., and Herman, J. R. (2004). Aerosol properties over bright-reflecting source regions. IEEE Trans. Geoscience Remote Sens. 42, 557–569. doi:10.1109/TGRS.2004.824067
Huang, H., Liu, H., Huang, J., Mao, W., and Bi, X. (2015). Atmospheric boundary layer structure and turbulence during sea fog on the southern China Coast. Mon. Weather Rev. 143 (5), 1907–1923. doi:10.1175/MWR-D-14-00207.1
Huang, J., Li, Y., Fu, C., Chen, F., Fu, Q., Dai, A., et al. (2017). Dryland climate change: Recent progress and challenges. Rev. Geophys. 55, 719–778. doi:10.1002/2016RG000550
Hulley, G. C., Hook, S. J., Abbott, E., Malakar, N., Islam, T., and Abrams, M. (2015). The ASTER global Emissivity dataset /(ASTER GED): Mapping Earth’s emissivity at 100 meter spatial scale. Geophys. Res. Lett. 42, 7966–7976. doi:10.1002/2015GL065564
Hurrell, J. W., Kushnir, Y., and Visbkeck, M. (2001). the North Atlantic Oscillation. Science 291 (5504), 603–605. doi:10.1126/science.1058761
Illes, C., and Hegerl, G. (2017). Role of the north Atlantic Oscillation in decadal temperature trends. Environ. Res. Lett. 12, 114010. doi:10.1088/1748-9326/aa9152
Kaku, K. C., Reid, J. S., Reid, E. A., Ross-Langerman, K., Piketh, S., Cliff, S., et al. (2016). Investigation of the relative fine and coarse mode aerosol loadings and properties in the Southern Arabian Gulf region. Atmos. Res. 169, 171–182. doi:10.1016/j.atmosres.2015.09.029
Karami, S., Hamzeh, N. H., Abadi, A. R. S., and Madhavan, B. M. (2021). Investigation of a severe frontal dust storm over the Persian Gulf in February 2020 by CAMS model. Arabian J. Geosciences 14, 2041. doi:10.1007/s12517-021-08382-8
Kaskaoutis, D. G., Francis, D., Rashki, A., Chaboureau, J.-P., and Dumka, U. C. (2019). Atmospheric dynamics from synoptic to local scale during an intense frontal dust storm over the Sistan Basin in Winter 2019. Geosciences 9 (10), 453. doi:10.3390/geosciences9100453
Kaufman, Y. J., Tanre, D., Rmer, L. A., Vermote, E. F., Chu, A., and Holben, B. N. (1997). Operational remote sensing of tropospheric aerosol over land from EOS moderate resolution imaging spectroradiometer. J. Geophys. Res. 102, 17501–17067. doi:10.1029/96JD03988
Khan, A. H., and Islam, Md. Shafiqul (2019). Prediction of thermal efficiency loss in nuclear power plants due to weather conditions in tropical region. Energy Procedia 160, 84–91. doi:10.1016/j.egypro.2019.02.122
Kumar, K. N., Molini, A., Ouarda, T. B. M. J., and Rajeevan, M. N. (2017). North Atlantic controls on wintertime warm extremes and aridification trends in the Middle East. Sci. Rep. 7, 12301. doi:10.1038/s41598-017-12430-3
Lakovic, M. S., Mitrovic, D., Stefanovic, V., and Stojiljkovic, M. (2012). Coal-fired power plant power Output variation due to local weather conditions. Energy Sources, Part A Recovery, Util. Environ. Eff. 34 (23), 2164–2177. doi:10.1080/15567036.2010.495973
Lee, J. K., Kim, J. C., Lee, K. J., Belorid, M., Beeley, P. A., and Un, J.-I. (2013). Assessment of wind characteristics and atmospheric Dispersion modeling of 137Cs on the Barakah NPP area in the UAE. Nucl. Eng. Technol. 46 (4), 557–568. doi:10.5516/NET.09.2014.029
Lee, J. K., Yook, D., Lee, J. J., Yun, J.-Il, and Beeley, P. A. (2015). Weibull parameter calculation and estimation of directional and seasonal wind speeds for the return period: A case study in the Barakah NPP area. Ann. Nucl. Energy 80, 62–69. doi:10.1016/j.anucene.2015.01.030
Ma, L., Zhang, T., Frauenfeld, O. W., Ye, B., Yang, D., and Qin, D. (2009). Evaluation of precipitation from the ERA-40, NCEP-1, and NCEP-2 Reanalysis and CMAP-1, CMAP-2, and GCPC-2 with ground-based measurements in China. J. Geophys. Res. Atmos. 114, D09105. doi:10.1029/2008JD011178
Madden, R. A., and Julian, P. R. (1994). Observations of the 40-50-day tropical Oscillation - a review. Mon. Weather Rev. 122 (5), 814–837. doi:10.1175/1520-0493(1994)122<0814:ootdto>2.0.co;2
Naizghi, M. S., and Ouarda, T. B. M. J. (2017). Teleconnections and analysis of long-term wind speed variability in the UAE. Int. J. Climatol. 37, 230–248. doi:10.1002/joc.4700
Nelli, N., Fissehaye, S., Francis, D., Fonseca, R., Temimi, M., Weston, M., et al. (2021b). Characteristics of atmospheric aerosols over the UAE inferred from CALIPSO and sun photometer aerosol optical depth. Earth Space Sci. 8, e2020EA001360. doi:10.1029/2020EA001360
Nelli, N. R., Francis, D., Fonseca, R., Abida, R., Weston, M., Wehbe, Y., et al. (2021a). The atmospheric controls of extreme convective events over the southern Arabian Peninsula during the spring season. Atmos. Res. 262, 105788. doi:10.1016/j.atmosres.2021.105788
Nelli, N. R., Temimi, M., Fonseca, R. M., Weston, M. J., Thota, M. S., Valappil, V. K., et al. (2020a). Micrometeorological measurements in an arid environment: Diurnal characteristics and surface energy balance closure. Atmos. Res. 234, 104745. doi:10.1016/j.atmosres.2019.104745
Nelli, N. R., Temimi, M., Fonseca, R. M., Weston, M. J., Thota, M. S., Valappil, V. K., et al. (2020b). Impact of roughness length on WRF simulated land-atmosphere interactions over a hyper-arid region. Earth Space Sci. 7, e2020EA001165. doi:10.1029/2020EA001165
Nesterov, O., Temimi, M., Fonseca, R., Nelli, N. R., Addad, Y., Bosc, E., et al. (2021). Validation and statistical analysis of the Group for high resolution sea surface temperature data in the Arabian Gulf. Oceanologia 63 (4), 497–515. doi:10.1016/j.oceano.2021.07.001
Niranjan Kumar, K., Entekhabi, D., and Molini, A. (2015). Hydrological extremes in hyperarid regions: A diagnostic characterization of intense precipitation over the central Arabian Peninsula. J. Geophys. Res. Atmos. 120, 1637–1650. doi:10.1002/2014JD022341
Niranjan Kumar, K., and Ouarda, T. B. M. J. (2014). Precipitation variability over UAE and global SST teleconnections. J. Geophys. Res. Atmos. 119, 10313–10322. doi:10.1002/2014JD021724
Perrone, T. J. (1979). Winter shamal in the Persian Gulf. Naval environmental prediction research facility. Monterey ca. Available at: https://apps.dtic.mil/sti/pdfs/ADA077727.pdf (Accessed 17 November, 2021).
Pozo-Vazquez, D., Santos-Alamillos, F. J., Lara-Fanego, V., Ruiz-Arias, J. A., and Tovar-Pescador, J. (2011). “The impact of the NAO on the solar and wind energy Resources in the Mediterranean area,” in Hydrological, Socioeconomic and Ecological impacts of the north Atlantic Oscillation in the Mediterranean region. Advances in Global change research. Editors S. Vicente-Serrano, and R. Trigo (Dordrecht: Spring), 46. doi:10.1007/978-94-007-1372-7_15
Rao, P. B., Beig, G., Dabas, R. S., Ramkumar, G., Gurubaran, S., Rao, K. G., et al. (2012). An overview of CAWSES-India program with emphasis to equatorial atmospheric coupling processes. J. Atmos. Solar-Terrestrial Phys. 75-76, 98–114. doi:10.1016/j.jastp.2011.08.005
Rasmusson, E. M., and Carpenter, T. H. (1982). Variation in tropical sea surface temperature and surface wind fields associated with the southern Oscillation/El Nino. Mon. Weather Rev. 110 (5), 354–384. doi:10.1175/1520-0493(1982)110<0354:vitsst>2.0.co;2
Reddy, N. N., and Rao, K. G. (2018). Contrasting variations in the surface layer structure between the convective and non-convective periods in the summer monsoon season for Bangalore location during PRWONAM. J. Atmos. Solar-Terrestrial Phys. 167, 156–168. doi:10.1016/j.jastp.2017.11.017
Rossi, A., Massei, N., and Laignel, B. (2011). A synthesis of the time-scale variability of commonly used climate indices using continuous wavelet transform. Glob. Planet. Change 78 (1-2), 1–13. doi:10.1016/j.gloplacha.2011.04.008
Saji, N., Goswami, B., Vinayachandran, P., and Yamagata, T. (1999). A dipole mode in the tropical Indian Ocean. Nature 401, 360–363. doi:10.1038/43854
Spinks, J., Lin, Y.-L., and Mekonnen, A. (2015). Effects of the subtropical anticyclones over north Africa and Arabian Peninsula on the African easterly jet. Int. J. Climatol. 35, 733–745. doi:10.1002/joc.4017
Steeneveld, G.-J., and Bode, M. (2018). Unravelling the relative roles of physical processes in modelling the life cycle of a warm radiation fog. Q. J. R. Meteorological Soc. 144, 1539–1554. doi:10.1002/qj.3300
Steinhoff, D. F., Bruintjes, R., Hacker, J., Keller, T., Williams, C., Jensen, T., et al. (2018). Influences of the monsoon trough and Arabian heat low on summer rainfall over the united Arab Emirates. Mon. Weather Rev. 146 (5), 1383–1403. doi:10.1175/MWR-D-17-0296.1
Taraphdar, S., Pauluis, O. M., Xue, L., Liu, C., Rasmussen, R., Ajayamohan, R. S., et al. (2021). WRF gray zone simulations of precipitation over the Middle-east and the UAE: Impacts of physical parameterizations and resolution. J. Geophys. Res. Atmos. 126, e201JD034648. doi:10.1029/2021JD034648
Temimi, M., Fonseca, R. M., Nelli, N. R., Valappil, V. K., Weston, M. J., Thota, M. S., et al. (2020a). On the analysis of ground-based microwave radiometer data during fog conditions. Atmos. Res. 231, 104652. doi:10.1016/j.atmosres.2019.104652
Temimi, M., Fonseca, R., Nelli, N., Weston, M., Thota, M., Valappil, V., et al. (2020b). Assessing the impact of changes in land surface conditions on WRF Predictions in arid regions. J. Hydrometeorol. 21 (12), 2829–2853. doi:10.1175/JHM-D-20-0083.1
Thota, M. S., Temimi, M., Ajayamohan, R. S., Nelli, N. R., Fonseca, R., Weston, M., et al. (2020). On the investigation of the Typology of fog events in an arid environment and the Link with climate patterns. Mon. Weather Rev. 148 (8), 3182–3202. doi:10.1175/MWR-D-20-0073.1
Wehbe, Y., Ghebreyesus, D., Temimi, M., Milewski, A., and Al Mandous, A. (2017). Assessment of the consistency among global precipitation products over the United Arab Emirates. J. Hydrology Regional Stud. 12, 122–135. doi:10.1016/j.ejrh.2017.05.002
Wehbe, Y., and Temimi, M. (2021). A remote sensing-based Assessment of water Resources in the Arabian Peninsula. Remote Sens. 13 (2), 247. doi:10.3390/rs13020247
Wehbe, Y., Temimi, M., and Adler, R. F. (2020). Enhancing precipitation estimates through the fusion of weather radar, satellite retrievals, and surface parameters. Remote Sens. 12, 1342. doi:10.3390/rsl1208134210.3390/rs12081342
Wehbe, Y., Temimi, M., Ghebreyesus, D. T., Milewski, A., Norouzi, H., and Ibrahim, E. (2018). Consistency of precipitation products over the Arabian Peninsula and interactions with soil moisture and water storage. Hydrological Sci. J. 63, 408–425. doi:10.1080/02626667.2018.1431647
Weston, M., Francis, D., Nelli, N., Fonseca, R., Temimi, M., and Addad, Y. (2022). The first characterization of fog microphysics in the United Arab Emirates, an arid region on the Arabian Peninsula. Earth Space Sci. 9, e2021EA002032. doi:10.1029/2021EA002032
Weston, M. J., Temimi, M., Nelli, N. R., Fonseca, R. M., Thota, M. S., and Valappil, V. K. (2020). On the analysis of the low-level double temperature inversion over the united Arab Emirates: A case study during April 2019. IEEE Geoscience Remote Sens. Lett. 20308979, 346–350. doi:10.1109/LGRS.2020.2972597
Weston, M., Temimi, M., Burger, R., and Piketh, S. (2021a). A fog climatology at Abu Dhabi International Airport. J. Appl. Meteorology Climatol. 60 (2), 223–236. doi:10.1175/JAMC-D-20-0168.1
Weston, M., Temimi, M., Fonseca, R. M., Nelli, N. R., Francis, D., and Piketh, S. (2021b). A rule-based method for diagnosing radiation fog in an arid region from NWP forecasts. J. Hydrology 597, 126189. doi:10.1016/j.hydrol.2021.12618910.1016/j.jhydrol.2021.126189
Winker, D. M., Pelon, J. R., and McCormick, M. P. (2003)). “The CALIPSO mission: Spaceborne lidar for observation of aerosols and clouds,” in Paper presented at the Lidar Remote sensing for Industry and environment Monitoring III. Available online at 10.1117/12.466539, last accessed 25 November 2021. doi:10.1117/12.466539
Yousef, L. A., Temimi, M., Molini, A., Weston, M., Wehbe, Y., and Al Mandous, A. (2020). Cloud cover over the Arabian Peninsula from global remote sensing and reanalysis products. Atmos. Res. 238, 104866. doi:10.1016/j.atmosres.2020.104866
Yousef, L. A., Temimi, M., Wehbe, Y., and Al Mandous, A. (2019). Total cloud cover climatology over the United Arab Emirates. Atmos. Sci. Lett. 20, e883. doi:10.1002/asl.883
Yu, W., Ma, M., Wang, X., Geng, L., Tan, J., and Shi, J. (2014). Evaluation of MODIS LST products using longwave radiation ground measurements in the northern arid region of China. Remote Sens. 6 (11), 11494–11517. doi:10.3390/rs61111494
Yu, Y., Notaro, M., Kalashnikova, V., and Garay, M. J. (2016). Climatology of summer Shamal wind in the Middle East. J. Geophys. Res. Atmos. 121, 289–305. doi:10.1002/2015JD024063
Yu, Y., Notaro, M., Liu, Z., Wang, F., Alkolibi, F., Fadda, E., et al. (2015). Climatic controls on the interannual to decadal variability in Saudi Arabian dust activity: Toward the development of a seasonal dust prediction model. J. Geophys. Res. Atmos. 120, 1739–1758. doi:10.1002/2014JD022611
Zhou, B., and Du, J. (2010). Fog prediction from a multimodel mesoscale ensemble prediction system. Weather Forecast. 25, 303–322. doi:10.1175/2009WAF2222289.1
Keywords: radiation fog, dust storm, synoptic-scale disturbances, boundary layer, sea breeze
Citation: Nelli N, Francis D, Fonseca R, Bosc E, Addad Y, Temimi M, Abida R, Weston M and Cherif C (2022) Characterization of the atmospheric circulation near the Empty Quarter Desert during major weather events. Front. Environ. Sci. 10:972380. doi: 10.3389/fenvs.2022.972380
Received: 18 June 2022; Accepted: 01 August 2022;
Published: 29 August 2022.
Edited by:
Yucong Miao, Chinese Academy of Meteorological Sciences, ChinaCopyright © 2022 Nelli, Francis, Fonseca, Bosc, Addad, Temimi, Abida, Weston and Cherif. This is an open-access article distributed under the terms of the Creative Commons Attribution License (CC BY). The use, distribution or reproduction in other forums is permitted, provided the original author(s) and the copyright owner(s) are credited and that the original publication in this journal is cited, in accordance with accepted academic practice. No use, distribution or reproduction is permitted which does not comply with these terms.
*Correspondence: Diana Francis, diana.francis@ku.ac.ae