Relief of Phosphate Limitation Stimulates Methane Oxidation
 Thomas P. A. Nijman
 André M. Amado
 Paul L. E. Bodelier
 Annelies J. Veraart
- 1Department of Aquatic Ecology and Environmental Biology, Radboud Institute for Biological and Environmental Sciences (RIBES), Radboud University, Nijmegen, Netherlands
- 2Laboratory of Aquatic Ecology, Institute of Biology, Federal University of Juiz de Fora, Juiz de Fora, Brazil
- 3Department of Microbial Ecology, Netherlands Institute of Ecology (NIOO-KNAW), Wageningen, Netherlands
Aquatic ecosystems such as shallow lakes and wetlands are important emitters of the greenhouse gas methane (CH4). Increased phosphorus (P) loading is expected to increase CH4 production in these ecosystems. This increased CH4 production can potentially be mitigated by increased CH4 oxidation, but how P availability affects methane-oxidizing bacterial (MOB) community composition and potential CH4 oxidation remains to be tested. Here, we incubated MOB from sediments of four subtropical lakes of different trophic states for 7 days at different phosphate (PO43-) concentrations to determine the effects of P on MOB community composition and potential CH4 oxidation. We measured CH4 consumption daily and compared CH4 oxidation during the exponential growth phase. Furthermore, we determined MOB community composition at the end of the incubations using qPCR of the pmoA gene. To test for differences in N and P uptake, we determined bacterial biomass N and P content. We found that increases in PO43- concentrations until 10 µM significantly increased CH4 oxidation. PO43- also increased bacterial biomass P content, while N content was not affected. MOB community composition was not affected by PO43- but more strongly correlated to lake of origin, likely due to the short duration of the incubations. Our results show that PO43- can not only stimulate CH4 oxidation indirectly through increased CH4 production, but also directly by increasing MOB growth. Importantly, these effects only occur at low PO43- concentrations, indicating that at high nutrient loads the increased CH4 oxidation will likely not mitigate the increased CH4 production.
Introduction
Methane (CH4) is the second most important greenhouse gas, contributing to 16–25% of global warming (IPCC, 2014). Microbial processes in aquatic ecosystems, such as wetlands and shallow lakes, are the main source of this greenhouse gas, accounting for over 50% of global CH4 emissions (Rosentreter et al., 2021). Currently, the nutrient status of many shallow lake ecosystems is changing because of eutrophication, which is expected to increase shallow lake CH4 emissions (Aben et al., 2017; Davidson et al., 2018), mostly driven by phosphorus (P) and nitrogen (N) enrichment in water and sediment (Correll, 1998). While interactions between N cycling and CH4 emissions have been well studied (Bodelier and Steenbergh, 2014), we still lack understanding about the effects of P on CH4 emissions.
CH4 cycling in shallow lakes is largely driven by the sediment microbiome. In the anoxic zone of the sediment, methanogens produce CH4 (Conrad, 2007). Subsequently, a large part of the produced CH4 is mitigated by methane-oxidizing bacteria (MOB), which consume CH4 mostly aerobically, converting CH4 into CO2. In freshwater ecosystems with high concentrations of alternative electron acceptors, such as nitrate and sulfate, CH4 can also be converted anaerobically (Deutzmann, 2020). This study focuses on aerobic MOB, which belong to the Gammaproteobacteria (type I), Alphaproteobacteria (type II), and Verrucomicrobia, of which type I and type II MOB are dominant in most freshwater lakes. These MOB differ in their phylogeny, physiology, biochemistry, and morphology (Semrau et al., 2010). While both perform the same process—CH4 oxidation—they prefer different environments. Type I MOB are most abundant in stable environments with high substrate availability while type II are most abundant in environments with disturbances such as heat waves and desiccation and low substrate availability (Ho et al., 2013). CH4 oxidation by MOB is the sole biological CH4 sink (Adamsen and King, 1993), and it is therefore important to know how MOB react to disturbances such as eutrophication.
The accumulation of phosphate (PO43-) in aquatic ecosystems can affect CH4 oxidation. In a field study, higher potential CH4 oxidation rates were found in sediments that had higher PO43- concentrations (Veraart et al., 2015). Increased [PO43-] is also hypothesized to indirectly affect CH4 oxidation rates by changing the MOB community. It has been suggested that type I MOB thrive in eutrophic environments with high [PO43-] while type II MOB compete better in more oligotrophic environments with low [PO43-] (Ho et al., 2013). One of the reasons for this is that type II MOB generally harbor more enzymes which liberate P from organic molecules and have membranes with lower P content (Veraart et al., 2015). Changes in the dominant type of MOB can potentially also lead to changes in CH4 oxidation rates (Reis et al., 2020; Nijman et al., 2021), thereby altering the mitigation capacity of the MOB community.
Only one study has addressed the direct relationship between [PO43-] and MOB functioning (Sawakuchi et al., 2021). In this study, surface water MOB from ice-covered lakes oxidized more CH4 at 500 μg/L (∼5 µM) PO43- than without PO43- in long-term incubations at 4 °C. However, the specific conditions of this experiment make it difficult to apply to MOB from other ecosystems. Most important, the dominant MOB in the ice-covered lake experiment are very rare outside of arctic regions (50.3% Methylobacter tundripaludum and 44.6% Methylovulum psychrotolerans). Second, the CH4 oxidation rates were very low (2.5–29.4 µmol CH4 L−1 d−1), compared to many other MOB communities, such as those in lake sediments (e.g. Shelley et al., 2015). Finally, the question arises whether higher PO43- concentrations would further increase potential CH4 oxidation rates, and up to which concentration PO43- could still be the limiting growth factor for MOB.
Therefore, we still lack a good understanding of the direct relationship between [PO43-] and CH4 oxidation. Other studies of MOB, which showed effects of PO43- on CH4 oxidation rates (Veraart et al., 2015) and on the type of MOB (Ho et al., 2013), were based on correlative field observations, and thus only showed an indirect relationship between [PO43-] and MOB functioning. Since many biogeochemical variables are correlated, the relationship between [PO43-] and CH4 oxidation found in these studies could also have been due to other variables, such as organic matter content (Czepiel et al., 1995) or N availability (Bodelier and Laanbroek, 2004). Furthermore, since increased [PO43-] stimulates lake CH4 emissions, likely through enhanced CH4 production (Aben et al., 2017; Davidson et al., 2018), oxidation may also be indirectly stimulated by PO43- due to higher CH4 availability. However, considering that bacteria need P for growth, and especially type I MOB since they contain phospholipid-rich stacked membranes (Bodelier et al., 2009), it is likely that PO43- also directly affects MOB, especially at low PO43- concentrations.
Here, we investigated the effect of PO43- concentration on potential CH4 oxidation and MOB community composition. We expected increases in PO43- concentration would increase potential CH4 oxidation. Furthermore, we expected that increases in PO43- concentration would favor type I MOB over type II MOB.
Methods
To test the effects of [PO43-] on potential CH4 oxidation and MOB community composition, we incubated MOB from four different subtropical lake sediments in 48 microcosms at different [PO43-], analyzing CH4 oxidation rates during exponential growth and final MOB community composition (Figure 1).
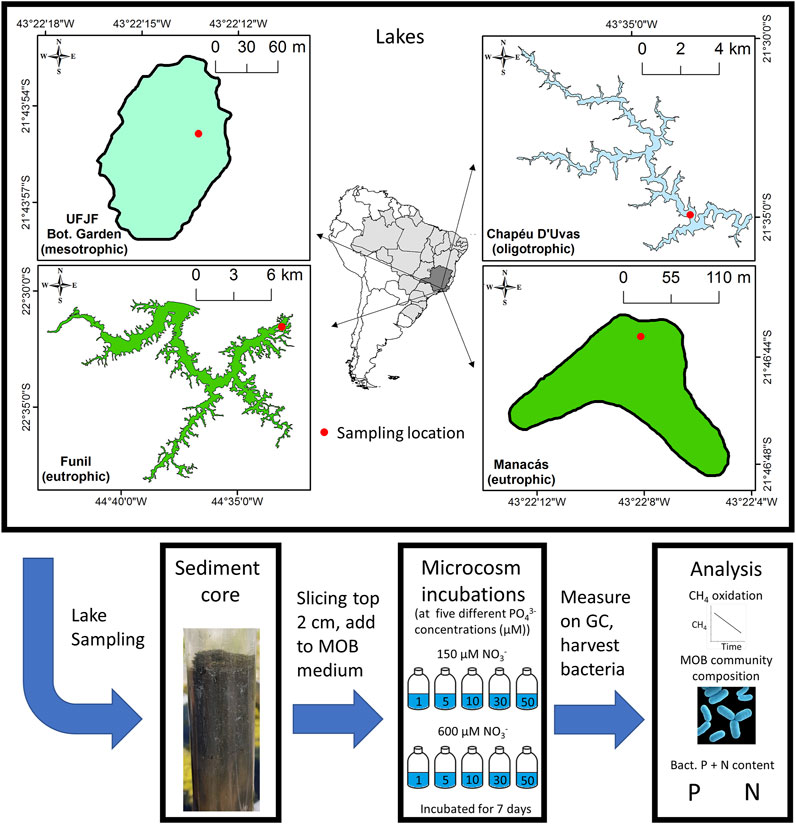
FIGURE 1. Sampling sites and experimental design.
Sediment Sampling and Inoculum Preparation
Four subtropical lake sediments in south-eastern Brazil were sampled in april 2019 to obtain different MOB communities for the microcosms (Supplementary Table S1). We sampled Funil lake (latitude, longitude: 2231′31″S, 44°33′1″W), Manacás lake (2146′43″S, 4322′8″W), Botanical Garden lake of Universidade Federal de Juiz de Fora (UFJF; 2143′55″S, 4322′14″W), and Chapéu D’Uvas lake (CDU; 2134′55″S, 4333′16″W). The lakes were chosen because of their different trophic state. Funil lake (Pacheco et al., 2015) and Manacás lake (Lawall et al., 2005) are eutrophic, UFJF botanical garden lake is mesotrophic (Nunes et al., 2021) and CDU lake is oligotrophic (Almeida et al., 2019). We took one sediment core from each lake with a Uwitech corer (ø 60 mm), of which we sliced off the top 2 cm (∼56.5 ml), and used those for the microcosms. While one core is not enough for a representative picture of the community of a single lake sediment, the use of single cores from four different lakes allowed us to investigate the relationship between [PO43-] and CH4 oxidation for MOB communities with different community composition.
The sediments were used to prepare inocula for the microcosms. The sliced sediment was first diluted with lake water from the corresponding lake to obtain a total volume of 150 ml, and homogenized using a blender. While blending could have lysed some cells, the low speed of the blender was likely not enough to significantly affect the microbial community. After mixing, the suspended sediment was pipetted into 15 ml falcon tubes and centrifuged at 4,000 rpm for 5 min. Then, the supernatant, containing a large number of bacteria, was taken. The supernatant was filtered through 1.2 µm glass fiber filters to remove most protozoa and remaining sediment particles, and the filtrate was used as inoculum for the microcosms.
Microcosms
We used microcosms to test how [PO43-] affected MOB growth and community composition. We prepared Nitrate Mineral Salts (NMS) medium specific for MOB (Whittenbury et al., 1970, ATCC 1306) with 10 µM copper and five different PO43- concentrations (1, 5, 10, 30, and 50 μM, added as KH2PO4 and NaHPO4 in a 1:2.5 ratio). We also used two different NO3− concentrations (150 and 600 μM, added as KNO3) to control for effects of N and N:P ratio, and included a negative control (0 µM PO43- and 0 µM NO3−, no inoculum added) and positive control (1 mM PO43- and 1 mM NO3−), resulting in twelve microcosms per lake. The PO43- and NO3− concentrations were chosen based on comparable concentrations in mesotrophic to eutrophic freshwater sediments (Geurts et al., 2008; Veraart et al., 2015). We ran one series of microcosm experiments per lake, yielding four replicates per combination of [PO43-] and [NO3−]. Microcosms were prepared by adding 57 ml NMS medium and 3 ml inoculum of the respective lake to 120 ml serum bottles. Bottles were closed with butyl stoppers and capped, after which 10% of the total headspace was replaced with CH4 (purity grade 4.5). This left an oxygen (O2) concentration of 18.9%. We incubated the microcosms in the dark for 7 days at 20°C, while stirring continuously. Because MOB use O2 in a 2:1 ratio to oxidize CH4, there was not enough O2 in the microcosms to completely consume all CH4. However, we found that in all microcosms, the [CH4] still decreased after the time of exponential growth, indicating that O2 was not yet depleted. It was also unlikely CH4 decreased because of anaerobic oxidation of methane (AOM), as described below.
Since the microcosms had a much higher O2 concentration than is present in sediments (Wang et al., 2014), we did not aim to show how sediment MOB would respond to increased [PO43-]. Rather, the aim was to show how model MOB communities would respond to different PO43- concentrations. Using an initially high [O2] had two advantages. First, it allowed the MOB to reach exponential growth because they could consume the majority of CH4 before O2 would become limiting. Second, it prevented AOM and methanogenesis. For AOM, 2% O2 decreased CH4 oxidation of ‘Candidatus Methylomirabilis oxyfera’ by 60% within 22 h without recovery (Kampman et al., 2018), while 5% O2 caused ‘Candidatus Methanoperedens nitroreducens’ to be outcompeted by Methylobacter, an aerobic MOB (Guerrero-Cruz et al., 2018). Also, while some methanogens can survive O2 exposure (Peters and Conrad, 1995), these only showed activity after 15 days without O2. Therefore, it is unlikely there was AOM or methanogenesis in the microcosms.
To determine CH4 consumption rates, we measured CH4 concentration in the headspace directly after CH4 addition and once per day afterwards. The CH4 concentration was measured by taking 1 ml of the headspace and injecting into a Bruker 450-GC (Bruker Technologies, Australia) equipped with a flame ionization detector. The concentration was calculated by comparing to a standard curve. Furthermore, 1 ml of medium was taken daily for MOB analysis, although these samples were not used because the number of cells was too low for DNA extractions.
CH4 Oxidation During Exponential Growth
To estimate CH4 oxidation rates, we calculated the rate at which CH4 decreased per day per ml of medium, accounting for removal of water and air from the microcosms (supplementary methods). Surprisingly, there was no CH4 oxidation in the microcosms of mesotrophic UFJF botanical garden lake. Little data on this lake are available thus far, but potential MOB inhibitors such as low pH, high NH4+ and humic substance concentration have not been observed. However, one possibility is the lakes’ high oxygen concentration (11 mg/L, Nunes et al., 2021) may have prevented most CH4 production, exemplified by very low CH4 emissions (3.39 mg CH4 m−2 day−1 September 2021, personal communication Nasário and Barros), and thereby the development of an active MOB community, which remains to be experimentally confirmed. Because of the lack of CH4 oxidation, we removed those microcosms from our analysis. For the remaining microcosms, we used the time of exponential growth to compare CH4 oxidation at different PO43- concentrations, based on the day with the largest decrease. All incubations had >0.75% CH4 (12 µM CH4 in the water) left after this day, which is not yet limiting (Shelley et al., 2015). Exponential growth occurred 1 day earlier for the eutrophic sediments than for the oligotrophic sediment (Supplementary Figure S4).
MOB Community Composition
To evaluate MOB community composition, we harvested the bacteria from the microcosms after 7 days. Thirty ml of the final medium was filtered through 0.2 µm filters, using half for DNA extractions. Filters of the positive control were used to test the DNA extraction method, while the negative control was not filtered as there was no bacterial growth. Four filters were accidently lost during transportation and the remaining 26 filters were used for qPCR. Bacteria were scraped off the filters using sterile cell scrapers (Greiner Bio-One 541070) and DNA was extracted with the DNeasy PowerSoil kit (Qiagen 12888-100) according to manufacturer’s instructions with one modification: bead-beating was performed using a Powerlyzer for 45 s at 2,500 rpm. We then determined copy number of type Ia (Methylobacter, Methylomonas), type Ib (Methylocaldum, Methylococcus) and type II (Methylosinus, Methylocella, Methylocystis) MOB by qPCR using different primers for the pmoA gene, according to Kolb et al. (2003) with some small modifications (Supplementary Table S2), using iQ SYBR® Green Supermix as mastermix. All samples and standards were measured in triplicate on a BioRad iQ5 Multicolour Real-Time PCR detection system (Vers. 2.0, BioRad, Gothenburg Sweden), on which we checked the melt curves.
Bacterial Biomass N and P Content
To investigate whether the PO43- concentrations changed the N and P content of the MOB, we filtered 10 ml of the final medium through two 0.7 µm glass fiber filters per microcosm. Filters were weighted before and after filtering, and bacterial N and P concentration was determined from the bacterial biomass retained on the filters after potassium persulfate digestion (Carmouze, 1994). N concentration in bacterial biomass was measured on a total organic carbon analyzer, equipped with a TNM-1 total nitrogen module (TOC-V CPN, Shimadzu), whereas P in bacterial biomass was measured spectrophotometrically (Lambda 365 UV/VIS, Perkin Elmer) by the ascorbic acid method (Mackereth et al., 1979). Filters were pre-combusted (550°C for 4 h) before filtration and oven dried before analysis (60°C for >24 h). The filtration method for microbial biomass nutrient contents using 0.7 µm pore size filters may not account for all the microbial community - smaller cells may pass through filters - but a previous study showed an average 80% retention of bacterial community using this pore size (They et al., 2017). Because the main available carbon substrate for microbial growth was CH4, and because we used NMS medium specific for MOB, we assumed that MOB were the predominant bacteria, and hence bacterial biomass N and P content was closely related to MOB N and P content. Also, because most CH4 was consumed in all incubations, similar total growth of MOB had taken place, indicating that N and P content per cell were related to total N and P content of the bacterial community. However, these results should be interpreted with caution, because P could also have formed suspended particles, increasing P content of the filters.
Statistical Analysis
Statistical analyses were performed in R 3.6.3 (R Core Team, 2019). To analyze how [PO43-] affected CH4 oxidation during exponential growth, we calculated potential CH4 oxidation rates at different [PO43-] (supplementary methods). Next, we determined which model fit the data best to compare effects of [PO43-] on CH4 consumption for the different lakes. We tested a linear regression, a nonlinear least-squares regression using the nls function, and a segmented regression using the segmented function (Muggeo, 2003). Based on a comparison of AIC values (Supplementary Table S3), the best-fitting model was the nonlinear least-squares regression, which we further analyzed. We also compared the nonlinear least-squares regression for 150 and 600 µM NO3− separately (Supplementary Figure S1), but since the differences between these models were small, we finally used one model combining all data.
To determine at which PO43- concentrations CH4 oxidation rates during exponential growth significantly differed from each other, we determined the confidence intervals (CIs) of CH4 oxidation at different PO43- concentrations and calculated the p-value at which CIs of different concentrations overlapped.
Relative abundance of different MOB types was calculated by dividing the copy number per MOB type by the copy number of all MOB. To achieve normality, the proportions of MOB type Ia and II were logit transformed while the type Ib proportion was log transformed. Linear models were used to test the effects of [PO43-] [NO3−], and lake of origin on relative abundance of different MOB types, and the emmeans function (Lenth et al., 2020) was used for post-hoc between-lake comparisons. We also inspected the relationship between N:P ratio and proportions of MOB (Supplementary Figure S2), but found no clear patterns.
Bacterial P content was log-transformed to achieve normality and linear models were used to test the effects of NO3− and PO43- on bacterial N content and log-transformed bacterial P content. A similar model comparison to CH4 oxidation showed the best fitting model was a linear regression rather than a nonlinear least-squares regression or segmented regression (Supplementary Table S4). Similar to CH4 oxidation, we compared the models for 150 and 600 µM NO3− separately (Supplementary Figure S3), but finally decided to combine all data since the differences between the models were very small.
Results
To investigate the effects of [PO43-] on model MOB communities, 30 microcosms from three different lakes (Manacás, Funil, CDU) were incubated at five different PO43- concentrations (1–50 µM), while a fourth lake (UFJF botanical garden) yielded no MOB growth and was therefore removed from the analysis.
CH4 oxidation increased with [PO43-] (Figure 2). Interestingly, PO43- stimulated CH4 oxidation during exponential growth mostly at low [PO43-] up to 10 μM, as shown by the good fit of the nonlinear least-squares regression to the CH4 oxidation data (Supplementary Table S3). Analysis of confidence intervals showed that CH4 oxidation at 1 µM PO43- was significantly lower than at all higher concentrations (5 µM: p = 0.0036; 10, 30, and 50 µM: p < 0.0001) while CH4 oxidation at 5 µM PO43- was significantly lower than at 30 µM (p = 0.0051) and 50 µM PO43- (p = 0.0039), and slightly lower at 10 µM PO43- than at 50 µM PO43- (p = 0.048). There was no effect of [NO3−] or lake of origin on CH4 oxidation.
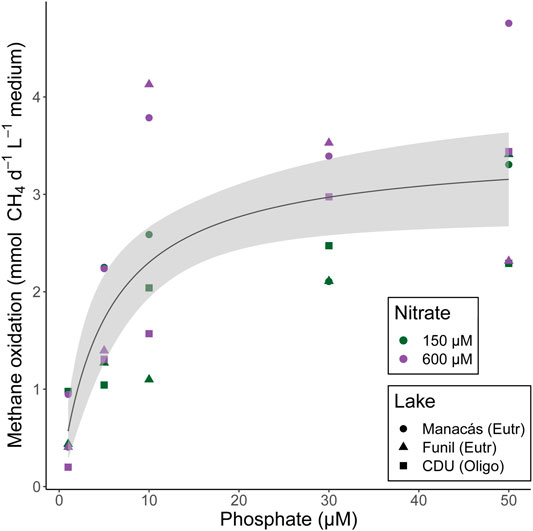
FIGURE 2. CH4 oxidation per day per ml of medium at different [PO43-] and [NO3−] during exponential growth phase of MOB from Manacás lake, Funil lake, and CDU lake. Fitted line according to nonlinear least-squares regression, shading represents 95% confidence interval. Individual measurements are shown, colours represent [NO3−] treatments, shapes represent lake of origin, n = 30.
The change in CH4 oxidation did not coincide with changes in relative abundance of different MOB types, which were mostly influenced by the lake of origin (Supplementary Table S5; Figure 3). Most MOB were either type Ia (58.8%) or type II (39.6%), while only a small percentage was type Ib (1.7%). Type Ia MOB were more abundant in the Manacás microcosms than in the CDU microcosms (p < 0.05) but not influenced by [NO3−] or [PO43-] concentrations. Type II MOB showed the opposite trend and were more abundant in the CDU lake microcosms than in the Manacás microcosms (p < 0.05), while also not being affected by [NO3−] or [PO43-]. Type Ib were more abundant in the Manacás and CDU microcosms than in the Funil microcosms (p < 0.05 for both, Supplementary Table S5). Interestingly, the number of type Ib MOB significantly decreased at higher [NO3−] (p = 0.05, Supplementary Table S5) but since the abundance of type Ib was relatively low, this had little impact on overall community composition.
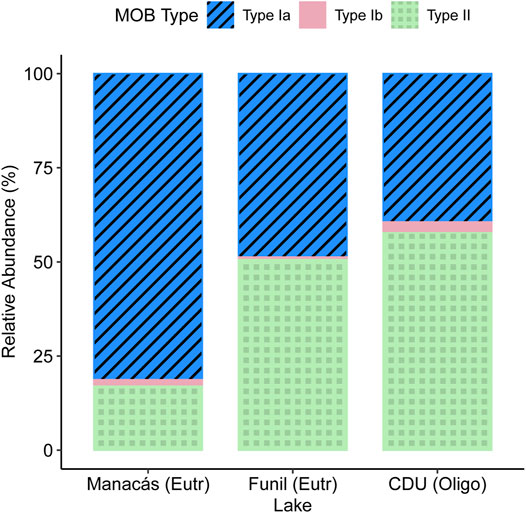
FIGURE 3. proportional abundance of different types of MOB per lake based on qPCR copy number of the pmoA gene at the end of microcosm incubations. Different colours represent different types of MOB, n = 26.
Bacterial P content showed a strong relationship with [PO43-] (p = 0.00047, Figure 4A), while bacterial N content (Figure 4B) was not influenced by either [NO3−] or [PO43-]. In contrast to CH4 oxidation rates, the increase in bacterial P content was also observed at high [PO43-] and not only at low concentrations, as there was a linear relationship between the log transformed bacterial P content and [PO43-].
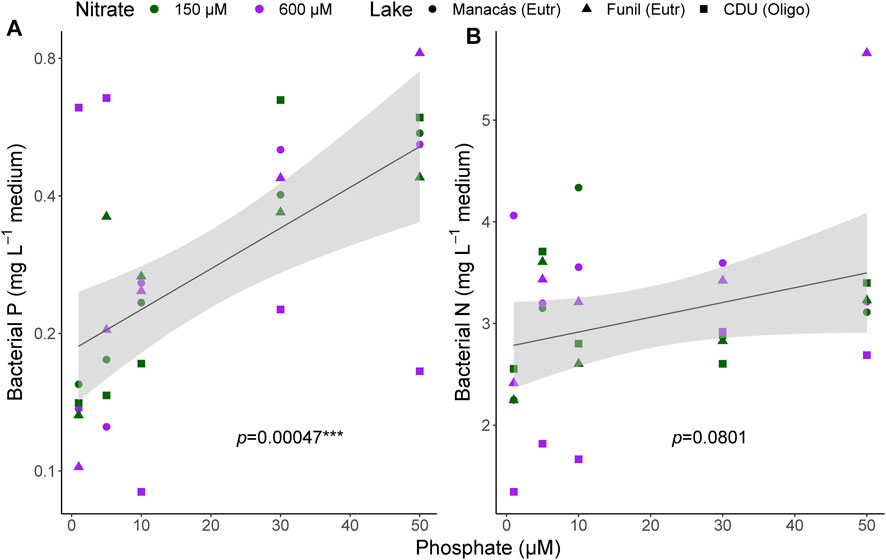
FIGURE 4. Bacterial P (log-transformed, (A) and bacterial N (B) content per litre of medium at the end of the microcosm incubations. Fitted line according to linear regression, shading represents 95% confidence interval. Individual measurements are shown, colours represent [NO3−] treatments, shapes represent lake of origin, n = 30.
Discussion
In our microcosm experiment, we found that increased [PO43-] led to an increase in potential CH4 oxidation rates, in agreement with our hypothesis. This was likely because MOB incorporated more P to increase their growth rates, as shown by the increase in bacterial P biomass content at higher [PO43-]. However, the [PO43-] did not affect the relative abundance of different types of MOB.
PO43- increased CH4 oxidation during exponential growth in a nonlinear way, indicating that PO43- was likely the limiting growth factor for the MOB communities at low concentrations. Increasing PO43- to concentrations up to 10 µM relieved MOB from PO43- limitation and thereby increased their growth. This is in line with previous research showing higher rates of CH4 oxidation in systems with higher PO43- availability (Veraart et al., 2015; Nijman et al., 2021). Increased P content suggested that bacteria used more P at higher PO43-, possibly to invest in rRNA to increase their growth rate - as suggested in the growth rate hypothesis (Elser et al., 2000) - thereby increasing CH4 oxidation rates. At PO43- concentrations above 10 μM, P on the filters still increased but this did not coincide with increased CH4 oxidation, possibly because bacteria stored the excess PO43- in organic and inorganic molecules inside the cytoplasm (Kulakovskaya, 2014) rather than investing in new cells. Likely, another limiting factor was preventing faster growth of MOB, such as copper (Semrau et al., 2010) or maximum growth rate (Ho et al., 2013). Future studies could investigate if PO43- concentrations lower than 1 μM, which are common in surface waters (Geurts et al., 2008), limit CH4 oxidation even more.
It is not clear whether the response of the model MOB communities in our experiment would be comparable to the response of sediment MOB communities, as those generally experience much lower O2 concentrations (Wang et al., 2014). Interestingly, MOB communities in the water column have the highest growth rates at low [O2], and the question remains whether the effects of PO43- that we found in this experiment would also be found at low [O2]. A future experiment at lower initial [O2], in which [O2] is closely monitored and added when necessary, could give further insight into these dynamics.
Since the increased CH4 oxidation in the microcosms was only apparent at low PO43- concentrations, the direct effect of PO43- on CH4 oxidation might contribute little to the CH4 cycle in highly eutrophic lakes. Rather, these lakes might be more strongly influenced by an increase in methanogenesis because of higher algal carbon decomposition (West et al., 2012) and decreased oxygen (Bastviken et al., 2004). If MOB in sediments are stimulated by PO43- in a comparable way to those in the microcosms, that may be one of the reasons why CH4 emissions are higher in eutrophic lakes (Aben et al., 2017; Davidson et al., 2018), while MOB are a more effective CH4 filter in mesotrophic lakes where they still benefit from increased PO43- concentrations (Veraart et al., 2015).
Our results are in line with the increased CH4 oxidation rates found in P-amended incubations of surface water from ice-covered lakes (Sawakuchi et al., 2021). In both studies, adding 5 µM PO43- increased CH4 oxidation rates. In contrast, the rates in our experiment were on average about 100-fold higher (0.19–4.75 mmol CH4 d−1 L−1 vs. 0.0025–0.029 mmol CH4 d−1 L−1), and type II MOB were far more abundant (40% vs. <5%). That is likely because our model communities originated from freshwater sediments, which often harbour highly active MOB communities (Oremland and Culbertson, 1992).
Increased [PO43-] had little effect on MOB community composition, which was more related to the lake of origin. The eutrophic Manacás lake had a higher proportion of type Ia MOB, while the oligotrophic CDU lake had more type II MOB. This is in line with predictions that type I MOB are better competitors and thrive in high nutrient environments, while type II are better stress-tolerators that can deal with low nutrient conditions (Ho et al., 2013). However, the fact that MOB community composition did not change in response to [PO43-] was in contrast with these predictions. Most likely, the short duration of 1 week for our experiment explains this result, which was too short to change MOB community composition. Future research could simulate MOB growth at different [PO43-] for a longer period to see possible shifts in community composition.
The microcosms did not show relationships between N:P ratio and CH4 oxidation, bacterial N and P content, and MOB community composition (Supplementary Figures S1–3). Likely, this was because [PO43-] was limiting and therefore driving most changes in the microcosms, while changes in MOB community composition would require more time. A future experiment using concentrations of NO3− and PO43- that are not limiting, e.g., 100–600 µM NO3− and 10–100 µM PO43-, could provide further insight into the effects of N:P ratio on CH4 oxidation.
To conclude, we show that MOB originating from lake sediments can be PO43- limited and show a nonlinear response to increased PO43- concentrations, indicating that they can potentially mitigate increased methanogenesis in mesotrophic lakes that become more eutrophic.
Data Availability Statement
The datasets presented in this study can be found in online repositories. The names of the repository/repositories and accession number(s) can be found below: (10.17026/dans-x59-warf) (DANS EASY).
Author Contributions
TN, AA, and AV designed the experiment. TN and AA carried out the practical work, with support from PB for the qPCR analyses. All authors discussed the results and contributed to the final manuscript.
Funding
AV was funded by Aquafarm 2.0. This work was partly funded by an Erasmus + Grant awarded to TN, by Brazil’s National Council for Scientific and Technological Development (CNPq), for providing Productivity grants to AA (PQ 310033/2017-9 and PQ 312772/2020-2), and by the PROPP-UFJF Reverse Sandwich Program.
Conflict of Interest
The authors declare that the research was conducted in the absence of any commercial or financial relationships that could be construed as a potential conflict of interest.
Publisher’s Note
All claims expressed in this article are solely those of the authors and do not necessarily represent those of their affiliated organizations, or those of the publisher, the editors and the reviewers. Any product that may be evaluated in this article, or claim that may be made by its manufacturer, is not guaranteed or endorsed by the publisher.
Acknowledgments
We thank Icaro Barbosa for sampling Chapéu D’Uvas and helping with slicing, Layla Fonseca, Alisa Shubina, and Annemiek Tiekstra for help with molecular analyses, José Paranaiba for help plotting the sampling locations, Jonas Nasário and Nathan Barros for providing CH4 emission data of the UFJF botanical garden lake, and Fons Smolders for advising on porewater PO43- concentrations.
Supplementary Material
The Supplementary Material for this article can be found online at: https://www.frontiersin.org/articles/10.3389/fenvs.2022.804512/full#supplementary-material
References
Aben, R. C. H., Barros, N., Van Donk, E., Frenken, T., Hilt, S., Kazanjian, G., et al. (2017). Cross continental Increase in Methane Ebullition under Climate Change. Nat. Commun. 8, 1–8. doi:10.1038/s41467-017-01535-y
Adamsen, A. P. S., and King, G. M. (1993). Methane Consumption in Temperate and Subarctic forest Soils: Rates, Vertical Zonation, and Responses to Water and Nitrogen. Appl. Environ. Microbiol. 59, 485–490. doi:10.1128/aem.59.2.485-490.1993
Almeida, R. M., Paranaíba, J. R., Barbosa, Í., Sobek, S., Kosten, S., Linkhorst, A., et al. (2019). Carbon Dioxide Emission from Drawdown Areas of a Brazilian Reservoir Is Linked to Surrounding Land Cover. Aquat. Sci. 81, 68. doi:10.1007/s00027-019-0665-9
Bastviken, D., Cole, J., Pace, M., and Tranvik, L. (2004). Methane Emissions from Lakes: Dependence of lake Characteristics, Two Regional Assessments, and a Global Estimate. Glob. Biogeochem. Cycles 18, a–n. doi:10.1029/2004GB002238
Bodelier, P. L. E., Bär Gillisen, M.-J., Hordijk, K., Sinninghe Damsté, J. S., Rijpstra, W. I. C., Geenevasen, J. A. J., et al. (2009). A Reanalysis of Phospholipid Fatty Acids as Ecological Biomarkers for Methanotrophic Bacteria. ISME J. 3, 606–617. doi:10.1038/ismej.2009.6
Bodelier, P. L. E., and Laanbroek, H. J. (2004). Nitrogen as a Regulatory Factor of Methane Oxidation in Soils and Sediments. FEMS Microbiol. Ecol. 47, 265–277. doi:10.1016/S0168-6496(03)00304-0
Bodelier, P. L., and Steenbergh, A. K. (2014). Interactions between Methane and the Nitrogen Cycle in Light of Climate Change. Curr. Opin. Environ. Sustainability 9-10, 26–36. doi:10.1016/j.cosust.2014.07.004
Carmouze, J. P. (1994). O metabolismo dos ecossistemas aquáticos: fundamentos teóricos, métodos de estudo e análises químicas. São Paulo: Edgard Blucher.
Caspers, H., Heron, J., and Talling, J. F. (1979). F. J. H. Mackereth, J. Heron & J. F. Talling: Water Analysis: Some Revised Methods for Limnologists. - with 4 fig., 120 Pp. Far Sawrey, Ambleside: Freshwater Biological Association Scientific Publication No. 36. 1978. I SBN 900386 31 2. £ 2. 50. Int. Revue Ges. Hydrobiol. Hydrogr. 64, 456. doi:10.1002/iroh.19790640404
Conrad, R. (2007). Microbial Ecology of Methanogens and Methanotrophs. Adv. Agron. 96, 1–63. doi:10.1016/S0065-2113(07)96005-8
Correll, D. L. (1998). The Role of Phosphorus in the Eutrophication of Receiving Waters: A Review. J. Environ. Qual. 27, 261–266. doi:10.2134/jeq1998.00472425002700020004x
Czepiel, P. M., Crill, P. M., and Harriss, R. C. (1995). Environmental Factors Influencing the Variability of Methane Oxidation in Temperate Zone Soils. J. Geophys. Res. 100, 9359–9364. doi:10.1029/95JD00542
Davidson, T. A., Audet, J., Jeppesen, E., Landkildehus, F., Lauridsen, T. L., Søndergaard, M., et al. (2018). Synergy between Nutrients and Warming Enhances Methane Ebullition from Experimental Lakes. Nat. Clim Change 8, 156–160. doi:10.1038/s41558-017-0063-z
Deutzmann, J. S. (2020). Anaerobic Utilization of Hydrocarbons, Oils, and Lipids. Berlin, Germany: Springer International Publishing AG. doi:10.1007/978-3-319-50391-2
Elser, J. J., Sterner, R. W., Gorokhova, E., Fagan, W. F., Markow, T. A., Cotner, J. B., et al. (2000). Biological Stoichiometry from Genes to Ecosystems. Ecol. Lett. 3, 540–550. doi:10.1046/j.1461-0248.2000.00185.x
Geurts, J. J. M., Smolders, A. J. P., Verhoeven, J. T. A., Roelofs, J. G. M., and Lamers, L. P. M. (2008). Sediment Fe:PO4ratio as a Diagnostic and Prognostic Tool for the Restoration of Macrophyte Biodiversity in Fen Waters. Freshw. Biol. 53, 2101–2116. doi:10.1111/j.1365-2427.2008.02038.x
Guerrero-Cruz, S., Cremers, G., van Alen, T. A., Op den Camp, H. J. M., Jetten, M. S. M., Rasigraf, O., et al. (2018). Response of the Anaerobic Methanotroph " Candidatus Methanoperedens Nitroreducens" to Oxygen Stress. Appl. Environ. Microbiol. 84, 1–17. doi:10.1128/AEM.01832-18
Ho, A., Kerckhof, F.-M., Luke, C., Reim, A., Krause, S., Boon, N., et al. (2013). Conceptualizing Functional Traits and Ecological Characteristics of Methane-Oxidizing Bacteria as Life Strategies. Environ. Microbiol. Rep. 5, 335–345. doi:10.1111/j.1758-2229.2012.00370.x
IPCC (2014). Climate Change 2014: Synthesis Report. Geneva, Switzerland: IPCC. doi:10.1017/CBO9781107415324
Kampman, C., Piai, L., Temmink, H., Hendrickx, T. L. G., Zeeman, G., and Buisman, C. J. N. (2018). Effect of Low Concentrations of Dissolved Oxygen on the Activity of Denitrifying Methanotrophic Bacteria. Water Sci. Technol. 77, 2589–2597. doi:10.2166/wst.2018.219
Kolb, S., Knief, C., Stubner, S., and Conrad, R. (2003). Quantitative Detection of Methanotrophs in Soil by Novel pmoA -Targeted Real-Time PCR Assays. Appl. Environ. Microbiol. 69, 2423–2429. doi:10.1128/AEM.69.5.2423-2429.2003
Kulakovskaya, T. (2014). Phosphorus Storage in Microorganisms: Diversity and Evolutionary Insight. Biochem. Physiol. 04. doi:10.4172/2168-9652.1000e130
Lawall, S., Tamiozzo Pereira Torres, F., and Rocha, G. C. (2005). Diagnostic and proposal of recovery of the lake Manacás watershed, campus of the federal university of Juiz de Fora, Minas Gerais. Soc. Nat. 1, 494–501. Available at: http://www.seer.ufu.br/index.php/sociedadenatureza/article/view/9726/5842.
Lenth, R., Buerkner, P., Herve, M., Love, J., Riebl, H., and Singmann, H. (2020). Emmeans: Estimated Marginal Means, Aka Least-Squares Means. Aka Least-Squares Means. Available at: https://cran.r-project.org/package=emmeans.
Muggeo, V. M. R. (2003). Estimating Regression Models with Unknown Break-Points. Statist. Med. 22, 3055–3071. doi:10.1002/sim.1545
Nijman, T. P. A., Davidson, T. A., Weideveld, S. T. J., Audet, J., Esposito, C., Levi, E. E., et al. (2021). Warming and Eutrophication Interactively Drive Changes in the Methane-Oxidizing Community of Shallow Lakes. Isme Commun. 1, 3–6. doi:10.1038/s43705-021-00026-y
Nunes, P., Roland, F., Amado, A. M., da Silva Resende, N., and Cardoso, S. J. (2022). Responses of Phytoplanktonic Chlorophyll-A Composition to Inorganic Turbidity Caused by Mine Tailings. Front. Environ. Sci. 9, 605838. doi:10.3389/fenvs.2021.605838
Oremland, R. S., and Culbertson, C. W. (1992). Importance of Methane-Oxidizing Bacteria in the Methane Budget as Revealed by the Use of a Specific Inhibitor. Nature 356, 421–423. doi:10.1038/356421a0
Pacheco, F. S., Soares, M. C. S., Assireu, A. T., Curtarelli, M. P., Roland, F., Abril, G., et al. (2015). The Effects of River Inflow and Retention Time on the Spatial Heterogeneity of Chlorophyll and Water-Air CO2 Fluxes in a Tropical Hydropower Reservoir. Biogeosciences 12, 147–162. doi:10.5194/bg-12-147-2015
Peters, V., and Conrad, R. (1995). Methanogenic and Other Strictly Anaerobic Bacteria in Desert Soil and Other Oxic Soils. Appl. Environ. Microbiol. 61, 1673–1676. doi:10.1128/aem.61.4.1673-1676.1995
R Core Team (2019). R: A Language and Environment for Statistical Computing. Vienna, Austria: R Core Team. Available at: http://www.r-project.org.
Reis, P. C. J., Thottathil, S. D., Ruiz‐González, C., and Prairie, Y. T. (2020). Niche Separation within Aerobic Methanotrophic Bacteria across Lakes and its Link to Methane Oxidation Rates. Environ. Microbiol. 22, 738–751. doi:10.1111/1462-2920.14877
Rosentreter, J. A., Borges, A. V., Deemer, B. R., Holgerson, M. A., Liu, S., Song, C., et al. (2021). Half of Global Methane Emissions Come from Highly Variable Aquatic Ecosystem Sources. Nat. Geosci. 14, 225–230. doi:10.1038/s41561-021-00715-2
Sawakuchi, H. O., Martin, G., Peura, S., Bertilsson, S., Karlsson, J., and Bastviken, D. (2021). Phosphorus Regulation of Methane Oxidation in Water from Ice‐Covered Lakes. J. Geophys. Res. Biogeosci 126, 1–13. doi:10.1029/2020jg006190
Semrau, J. D., Dispirito, A. A., and Yoon, S. (2010). Methanotrophs and Copper. FEMS Microbiol. Rev. 34, 496–531. doi:10.1111/j.1574-6976.2010.00212.x
Shelley, F., Abdullahi, F., Grey, J., and Trimmer, M. (2015). Microbial Methane Cycling in the Bed of a Chalk River: Oxidation Has the Potential to Match Methanogenesis Enhanced by Warming. Freshw. Biol. 60, 150–160. doi:10.1111/fwb.12480
They, N. H., Amado, A. M., and Cotner, J. B. (2017). Redfield Ratios in Inland Waters: Higher Biological Control of C:N:P Ratios in Tropical Semi-arid High Water Residence Time Lakes. Front. Microbiol. 8, 1505. doi:10.3389/fmicb.2017.01505
Veraart, A. J., Steenbergh, A. K., Ho, A., Kim, S. Y., and Bodelier, P. L. E. (2015). Beyond Nitrogen: The Importance of Phosphorus for CH 4 Oxidation in Soils and Sediments. Geoderma 259-260, 337–346. doi:10.1016/j.geoderma.2015.03.025
Wang, C., Shan, B., Zhang, H., and Rong, N. (2014). Analyzing Sediment Dissolved Oxygen Based on Microprofile Modeling. Environ. Sci. Pollut. Res. 21, 10320–10328. doi:10.1007/s11356-014-2875-y
West, W. E., Coloso, J. J., and Jones, S. E. (2012). Effects of Algal and Terrestrial Carbon on Methane Production Rates and Methanogen Community Structure in a Temperate lake Sediment. Freshw. Biol. 57, 949–955. doi:10.1111/j.1365-2427.2012.02755.x
Keywords: methane oxidation, phosphate, eutrophication, methane, aquatic sediment, freshwater, methanotroph, microbial community composition
Citation: Nijman TPA, Amado AM, Bodelier PLE and Veraart AJ (2022) Relief of Phosphate Limitation Stimulates Methane Oxidation. Front. Environ. Sci. 10:804512. doi: 10.3389/fenvs.2022.804512
Received: 29 October 2021; Accepted: 17 February 2022;
Published: 01 April 2022.
Edited by:
Yves T. Prairie, Université du Québec à Montréal, CanadaReviewed by:
Malak M. Tfaily, University of Arizona, United StatesTapan Kumar Adhya, KIIT University, India
Copyright © 2022 Nijman, Amado, Bodelier and Veraart. This is an open-access article distributed under the terms of the Creative Commons Attribution License (CC BY). The use, distribution or reproduction in other forums is permitted, provided the original author(s) and the copyright owner(s) are credited and that the original publication in this journal is cited, in accordance with accepted academic practice. No use, distribution or reproduction is permitted which does not comply with these terms.
*Correspondence: Thomas P. A. Nijman, tom.nijman@ru.nl