Detecting Native Freshwater Fishes Using Novel Non-invasive Methods
 Rowshyra A. Castañeda1,2,3*
  Alexander Van Nynatten2
  Steven Crookes4,5 Bruce R. Ellender6
  Daniel D. Heath4 Hugh J. MacIsaac4 Nicholas E. Mandrak1,2,6
  Olaf L. F. Weyl3,6
- 1Department of Ecology and Evolutionary Biology, University of Toronto, Toronto, ON, Canada
- 2Department of Biological Sciences, University of Toronto Scarborough, Toronto, ON, Canada
- 3DSI/NRF Research Chair in Inland Fisheries and Freshwater Ecology, South African Institute for Aquatic Biodiversity, Makhanda, South Africa
- 4Great Lakes Institute for Environmental Research, University of Windsor, Windsor, ON, Canada
- 5Department of Integrative Biology, University of Guelph, Guelph, ON, Canada
- 6South African Institute for Aquatic Biodiversity, Makhanda, South Africa
Improving the ability to detect and quantify rare freshwater fishes in remote locations is of growing conservation concern, as the distributions of many native fishes are contracting to such locations where there are reduced anthropogenic and invasive species pressures. However, conventional sampling methods, e.g., backpack electrofishing and seines, tend to be heavy and bulky, thereby making them difficult to transport into remote areas with no road access. These conventional sampling methods also require physical handling of fishes, which may cause stress, harm, and mortality–all undesirable side effects for rare fishes. Thus, visual observation methods, such as underwater camera and snorkel surveys, and environmental DNA (eDNA), that are easily transportable and do not require physical handling of fishes, are being more frequently used in freshwater ecosystems. However, there have been few studies on the relative effectiveness of these three methods for detecting and quantifying freshwater fishes. In this study, the species-specific detection probabilities between the three methods, and abundance estimates derived from the visual observation methods were compared, and their utility for sampling rare fishes in remote locations in South Africa was evaluated. Underwater cameras and snorkel surveys detected slightly different species within a fish community. For the redfins, the detection probability using underwater cameras (0.96, SD = 0.03) was highest, followed by snorkel surveys (0.93, SD = 0.05), and eDNA (0.70, SD = 0.21). The visual observation methods were positively correlated with pool length, while eDNA was negatively correlated with turbidity. For Cape Kurper, the detection probability using underwater cameras (0.75, SD = 0.15) was highest, followed by snorkel surveys (0.68, SD = 0.16), and eDNA (0.64, SD = 0.19); all three methods were negatively affected by water turbidity. It is recommended that decisions on which sampling method to use in remote locations should depend on whether the study requires population- or community-level information, spatial scale required, and resource availability, as each method has its own strengths and weaknesses. Generally, eDNA is the most expensive method and requires specialized facilities and equipment, while underwater cameras require video analyses that are more time consuming to analyze than snorkel surveys.
Introduction
Imperfect detection of species biases our ability to quantify community richness and population abundances (Guillera-Arroita, 2017). The magnitude of this imperfect detection varies based on the rarity and behavior of a species, while our ability to detect the species will vary based on sampling methods (MacKenzie et al., 2018). This is further complicated when the focal species are endangered as most conventional sampling methods require capture and physical handling of animals, inducing stress on and, at times, causing mortality of, target species and by-catch (Putman, 1995; Romero, 2004; Ellender et al., 2016). This is especially true when sampling and monitoring freshwater fishes. For example, electrofishing can have a mortality rate of 3–10% and cause other injuries, such as spinal fractures, that would affect the fish's ability to survive (Snyder, 2003; Dolan and Miranda, 2004). A 3% mortality rate may be acceptable for widely distributed fishes with large population sizes but may have a population-level effect on endangered species with restricted distribution ranges. In addition, the distributions of many endangered fishes have been contracting into headwater areas, into refuges from invasive species and other anthropogenic disturbances that have yet to reach (Lowe and Likens, 2005; Colvin et al., 2019). In many places, headwater refuges are in remote locations with little to no road access where bulky conventional sampling equipment, such as backpack electrofishers and seine nets, may be impossible to transport (Thurow et al., 2012; Ebner et al., 2015). Therefore, readily-transportable, non-harmful sampling techniques are required to offset stress and injury to endangered fishes and by-catch in remote areas (Costello et al., 2016). In freshwater systems, visual observation and environmental DNA (eDNA) are increasingly popular non-invasive sampling methods (Janosik and Johnston, 2015; Struthers et al., 2015). Visual observation techniques can be undertaken using underwater cameras or snorkeling (Ellender et al., 2012; Struthers et al., 2015) and eDNA tests for the DNA of organisms in water samples to assess species presence (Lacoursière-Roussel et al., 2016a).
Underwater camera recordings are frequently used in freshwater and marine ecosystems (e.g., Struthers et al., 2015; King et al., 2018; Castañeda et al., 2020); this method has many advantages and some disadvantages (Mallet and Pelletier, 2014). Underwater cameras can be used to estimate relative abundance and species richness and study the behavior of fishes in their natural environment but require clear water to do so. Recordings can be stored and verified by other investigators. However, cameras require accessories for power and memory (Friesen and Chivers, 2006; Thurow et al., 2012; Assis et al., 2013; Ebner and Morgan, 2013; Domenici et al., 2014; Mallet and Pelletier, 2014; Struthers et al., 2015). If electricity is not accessible, as in many remote areas, extra batteries or alternate power sources (e.g., generators, solar panels) and memory cards are required. These specialized electronics may be expensive or unfeasible to purchase for some researchers working in remote areas; hence, snorkeling surveys may be better suited in these situations.
Snorkeling is another visual observation method that has been used to detect and estimate fish densities in small headwater streams (Weyl et al., 2013; Chamberland et al., 2014; Ellender et al., 2018). Snorkel surveys generally outperform seining and electrofishing, except when sampling cryptic species (Brock, 1982; Jordan et al., 2008; Saunders et al., 2011). Generally, snorkel surveys tend to be the most simple and cost-efficient method for observing fishes, as it requires very little equipment. Information on community composition, population size structure, and habitat use can be collected using snorkel surveys (Thurow and Schill, 1996; Ebner et al., 2015; Macnaughton et al., 2015). However, snorkel surveys could be limited by water depth, water clarity, and snorkeler training and experience, factors that could reduce consistency in, and reproducibility of, the data collected (Thurow et al., 2012). In marine environments, there has been much debate as to whether underwater cameras or snorkel surveys collect the most accurate and precise data on fish populations and communities (Langlois et al., 2010; Pelletier et al., 2010; Watson et al., 2010); however, comparative studies between the two visual observation methods are rare in freshwater habitats (Ebner et al., 2015). Although underwater cameras and snorkel surveys are becoming more widely used in freshwater ecology, we know little about the relative efficiencies of detecting rare fishes.
Environmental DNA is an increasingly used non-invasive method for surveilling invasive and endangered fishes in freshwater ecosystems. eDNA protocols concentrate DNA molecules that have been shed into their local environment (e.g., water, soil, snow, air) to detectable levels using PCR (Ficetola et al., 2008; Thomsen and Willerslev, 2015). PCR-based assays may target individual species with high specificity (Baker et al., 2018; Fernández et al., 2018; Mauvisseau et al., 2019), or facilitate the holistic screening of entire biotic communities through the massively parallel DNA sequencing of diagnostic genetic markers (Harper et al., 2018), and have made it possible to detect DNA from water samples even at very low quantities (Ficetola et al., 2008; Thomsen and Willerslev, 2015; Harper et al., 2018). However, the high sensitivity of eDNA increases the risk of false positives from contamination, requiring specialized tools for collecting water samples in the field and a clean laboratory set up for extracting DNA separate from the PCR/sequencing facility (Goldberg et al., 2016). Despite these costly hurdles, the economies of scale associated with a high-throughput method like eDNA has led to its application in many large-scale monitoring projects (Jerde et al., 2013; Biggs et al., 2015; Balasingham et al., 2018). However, the effectiveness of eDNA studies may depend on the hydrological and physical aspects of the habitat (Jane et al., 2015; Balasingham et al., 2017; Harper et al., 2018), and species-specific differences in shedding, behavior, and abundance (Thomsen and Willerslev, 2015). In addition, eDNA studies have predominantly focused on temperate species, and the utility of these studies in warmer tropical and subtropical conditions may differ (Eichmiller et al., 2016; Cantera et al., 2019; Doble et al., 2019).
The purpose of this study is to compare the detection probabilities and abundance estimates of the two visual observation methods and eDNA for fish communities in remote locations and to assess which method is best suited in different situations. The study focuses on the Eastern Cape Redfin (Pseudobarbus afer), Gamtoos River Redfin (Pseudobarbus swartzi), and Cape Kurper (Sandelia capensis) in a remote area of Eastern Cape Province of South Africa. Eastern Cape Redfin is listed as Endangered by IUCN (Chakona et al., 2017a), the closely related Gamtoos River Redfin is listed as Vulnerable by IUCN (Chakona et al., 2017b), and Cape Kurper is Data Deficient but has a declining population trend (Chakona, 2018). We hypothesize that the detection probabilities of all three methods will decrease with increasing spatial scale of the pools sampled within the streams (length, width, depth) and with increasing water turbidity.
Materials and Methods
Study System
The study was conducted in four clear headwater streams in Eastern Cape Province, South Africa typical of headwater stream refugia for native fishes in the eastern part of the Cape Fold Ecoregion (Ellender et al., 2017). Three streams, Fernkloof, Waterkloof, Blindekloof, tributaries to the Swartkops River, are within the Groendal Wilderness Area (Figure 1A) and the Bos River tributary of the Kouga River which runs in part through the Skilderkrantz Private Nature Reserve (Figure 1B). Both the Skilderkrantz Private Nature Reserve and the Groendal Wilderness Area are within the Baviaanskloof Mega Reserve and are part of the Cape Floral Region Protected Areas World Heritage Site (UNESCO, 2015). The tributaries run through mountainous areas, bounded by indigenous forest, with few roads or maintained trails to provide access to them. Reaching the sampling sites requires hours of hiking through rugged terrain and wading and swimming through pools (Figure 2). Both watersheds have low native freshwater fish species richness (Ellender et al., 2017). Fish faunas contain African Longfin Eel (Anguilla mossambica), Cape Kurper, Goldie Barb (Enteromius pallidus), and River Goby (Glossogobius callidus), Eastern Cape Redfin and Gamtoos River Redfin (Supplementary Table 1) (Chakona and Skelton, 2017; Ellender et al., 2017). Both watersheds have had intentional and unintentional introduction and establishment of non-native fishes. Non-native faunas include Common Carp (Cyprinus carpio), African Sharptooth Catfish (Clarias gariepinus), Largemouth Bass (Micropterus salmoides), Smallmouth Bass (Micropterus dolomieu), Spotted Bass (Micropterus punctulatus), and Banded Tilapia (Tilapia sparmanii) (Supplementary Table 1) (Ellender et al., 2011). Because Eastern Cape Redfin and Gamtoos River Redfin were, until recently (Chakona and Skelton, 2017), considered the same species within the Pseudobarbus afer complex throughout the sampling period and exhibit very similar ecologies, the data from the two species were combined in the study and termed redfins.
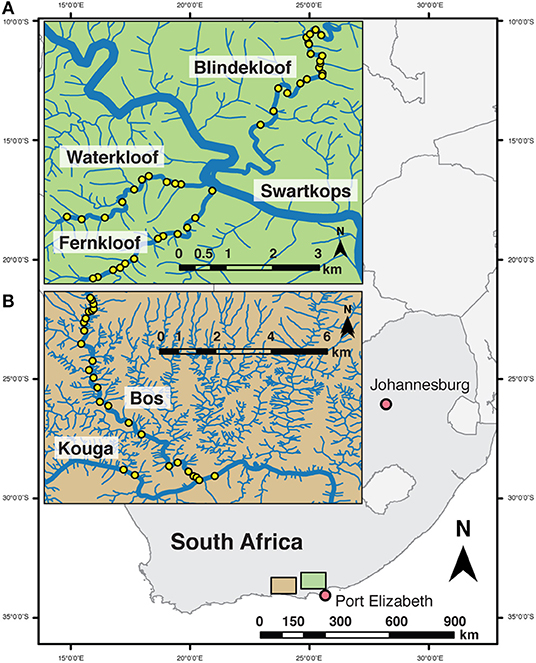
Figure 1. Location of sampling sites (yellow points) across two watersheds in Eastern Cape, South Africa; (A) Swartkops watershed within the Groendal Nature Reserve; and (B) Kouga watershed, Bos River tributary within the Skilderkrantz Nature Reserve.
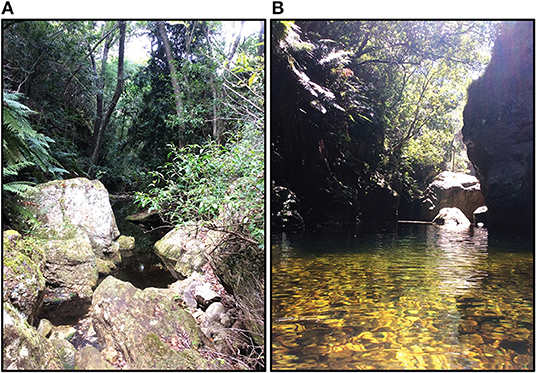
Figure 2. Headwater tributaries in the Swartkops River watershed. Example of: (A) no trail through the rugged terrain and thick forest typical across sites; (B) steep overhanging cliffs framing the tributary requiring wading and swimming across the pool to access upstream sites.
Data Collection
In February and March 2015, sampling for freshwater fishes using cameras, snorkel, and eDNA snorkel surveys was conducted in isolated pools along the length of the streams. For cameras and snorkel surveys, 23 pools were sampled spanning 8 km in the Bos River, 4 pools spanning 3 km in the Kouga River, 13 pools spanning 3 km in the Fernkloof, 10 pools spanning 3 km in the Waterkloof, and 19 pools spanning 5 km in the Blindekloof (Figure 1). For eDNA, water samples were taken at seven sites in the Bos River, three sites in the Kouga, four sites in the Fernkloof, four sites in the Waterkloof, and four sites in the Blindekloof, which were all a minimum of 500 m apart.
Water samples for eDNA analysis were taken before any field personnel waded through the stream and before deploying other sampling gear to prevent contamination from field clothing and equipment that had been in contact with stream water downstream. Three 2-L water samples were taken within 5 cm of the surface of each pool using pre-sterilized Nalgene polycarbonate plastic collection bottles. Sterilization of the collection bottles and carrying dry-bags was done at the field station before sampling by soaking them in a 10% bleach solution (of 6% w/v sodium hypochlorite) for at least 10 min, then air dried. All collected water samples were packed in ice and after three or four pools were sampled, they were carried immediately downstream to the field station for filtration. All eDNA water samples were collected in <5 field days.
Upon returning from the sampling area, water samples were filtered on the same day at the field station in a room dedicated to filtration that was cool and sterilized. A vacuum pump and tripartite manifold filtration system were used to filter the water samples through glass microfiber filter papers [47 mm diameter, 1.2 μm pore size (VWR 696-filter, product No: 28333-139)]. Sterile forceps were used to manipulate the filter papers onto the funnels and into microcentrifuge tubes. Approximately half of the water was processed per filter paper resulting in two filter papers per water sample, which were stored in separate microcentrifuge tubes and filled with molecular grade ethanol (> 95%). The process was repeated for each water sample where all equipment was sterilized and dried between samples. Controls were conducted using the same procedure with distilled water between sample runs.
eDNA samples and the environmental controls were extracted in a UV cabinet in a building separate from the facility used for PCR using a modified DNeasy Blood & Tissue Kit (Qiagen) protocol designed for eDNA samples (Goldberg et al., 2011; Lacoursière-Roussel et al., 2016b). DNA concentrations were taken for a subset of the eDNA samples, environmental controls, and extraction controls using a Qubit 4 Fluorometer (Invitrogen) to ensure extraction success.
Forward and reverse primers were designed to target a <200 bp region of the cytochrome b mitochondrial gene of both redfins (P. afer and P. swartzi) and Cape Kurper (S. capensis) ensuring at least 6 nucleotides differ between the target species and other co-occurring species in the localities sampled (Supplementary Table 1). The specificity of these primers (Supplementary Table 2) for solely the target species was tested in vitro using conventional PCR with genomic DNA from each target species and other co-occurring species as the template. Genomic DNA was extracted from tissue samples preserved in ethanol extracted using a DNeasy Blood & Tissue Kit (Qiagen). Each PCR reaction contained 6 μL of 2X Phusion Hot Start II High-Fidelity DNA Polymerase, 600 nM of forward and reverse primers, 2 μL of template DNA, and ddH2O for a final volume of 12 μL. Following an initial denaturation phase at 95°C for 3 min, DNA was amplified for 40 cycles of 98°C (20 s), 60°C (15 s), and 72°C (15 s), followed by a 5 min extension phase at 72°C. PCR products were visualized on a 2% agarose gel and were compared to an 100 bp ladder to check that amplicons were the correct size. At least one amplicon from each watershed was purified and sequenced using Sanger sequencing to further ensure the specificity of each primer pair.
All eDNA samples, environmental controls, and extraction controls were tested for the presence of redfins and Cape Kurper using quantitative PCR (qPCR). Each qPCR reaction contained 10 μL of Power SYBR Green Master mix (Applied Biosystems), 200 nM of the species-specific forward and reverse primers (Supplementary Table 2), 4 μL of template (diluted in ddH2O 1:10), and ddH2O for a final volume of 20 μL. Each sample was assayed in triplicate on a 96 well plate alongside at least three no template controls (NTCs) containing ddH2O instead of template. All plates were analyzed on a QuantStudio™ 3 Real-Time PCR System (Applied Biosystems). Thermocycler conditions were set to the manufacture's defaults (50°C for 2 min; 95°C for 2 min; followed by 40 cycles of a 15 s 95°C denaturation step and an annealing/extension step of 1 min at 60°C). Cq values, a measure of when the fluorescent signal passes the threshold for detection, were calculated using the second derivative method. Amplification of the correct target sequence and absence of primer-dimers was confirmed by a comparison of a melt-curve assay (from 60 to 95°C). Positive sequence identity of the qPCR products was also confirmed with a BLAST search of the Genbank nucleotide database with query sequences from a subset of PCR products sequenced at the TCAG sequencing facility at the Hospital for Sick Children, Toronto. The limit of detection (LOD) and the efficiency of the qPCR reaction was determined using a standard curve, as MIQE guidelines [Minimum Information for the Publication of Quantitative PCR Experiments (Bustin et al., 2009)], generated using 10-fold dilutions of genomic DNA from 1 to 1 × 10⁻⁶ ng/μL for P. swartzi and 10 to 1 × 10⁻⁶ ng/μL for S. capensis. A positive hit for each target species in the eDNA and control samples was assigned to a sampling site if the fluorescent signal of any of the three technical replicates surpassed the threshold for detection and if melt temperatures were within the range of temperatures observed in analysis of genomic DNA samples (78–79°C for the S. capensis and 75–76°C for P. swartzi). We removed any eDNA samples from the analysis if any hits were detected in an environmental control taken from the same site.
After collecting eDNA samples, a GoPRO (Hero4 Black) was mounted on a flexible tripod (GorillaPod) and placed at the end of each pool facing upstream. The camera recorded video for 30 min (video resolution 1080p, 30 frames per second, ultra-wide frame of view, and 1,920 × 1,080 screen resolution) (Ellender et al., 2012). A 30 min recording is standard for monitoring native fish populations in South African streams and rivers and is sufficient to achieve the highest MaxN (Ellender et al., 2012; Weyl et al., 2013). In the lab, all videos were viewed, and the maximum number of adult and juvenile fishes was recorded for every 30 s time frame and scored as a positive detection. MaxN was used as the measure of relative abundance (Campbell et al., 2015), in which the single highest count of a target in the specific recording is retained.
Upon retrieval of the camera, a two-pass snorkel survey was conducted where the snorkeler started at the downstream end of the pool and zigzagged upstream (to maximize sampling all microhabitats across a pool) until they reached the end of the pool and repeated the same zigzagging pattern back downstream (Ellender et al., 2011). All fishes observed were identified to species and counted. The counts of the two passes were averaged and converted to density (fish m−2), by dividing the average count by the surface area [length (m) × average width (m)] of the sampled site (Ellender et al., 2012; Weyl et al., 2013).
At each pool, several habitat variables, hypothesized to affect the occupancy of the fishes and detection probability of the different gear types, were measured. Total length (m) of the pool was measured; then the pool was separated in 5–6 transects of equal length, and the width (m) of each transect measured. At each transect, depth (m) and the dominant sediment type, was recorded at 0.2 m from the waterline on each side and at the midpoint of the stream, totaling three sampling points per transect (Ellender et al., 2012). Water turbidity (nephelometric turbidity units–NTU) was measured using a Hanna HI 98703 turbidimeter (HANNA Instruments Inc., Woonsocket, USA).
Statistical Analysis
Multi-scale, single-season occupancy models were built to calculate the detection probabilities of each gear type for the native and non-native fishes (Nichols et al., 2008; MacKenzie et al., 2018). The multi-scale, occupancy-model approach estimates the detection probability of different gear types (p) deployed during the sampling period, probability of occupancy (ψ), and probability that the species is present during the sampling (θ) (Nichols et al., 2008). The top occupancy model was determined by holding detection probability constant and testing the different habitat covariates on occupancy; the model with the lowest AIC was used to determine detection probabilities of each gear type. Using the top occupancy model, detection probability was modeled as constant across sampling methods, different across methods, and covarying with average pool depth (m), average pool width (m), pool length (m), surface area (m2) [length (m) × average width (m)], volume (m3) [length (m) × average width (m) × average depth (m)], and turbidity (NTU). Correlated variables were not included in the same model. We hypothesized that an increase in any of these spatial covariates would negatively affect the detection probability of each method, as cameras and snorkelers have a limited field of view (Thurow et al., 2012), and DNA can be diluted in larger water bodies (Jane et al., 2015). Further, we hypothesized that turbidity would have a negative effect on the detection probabilities of all three methods, as an increase in turbidity would reduce visibility, a requirement for visual observation methods (Thurow et al., 2012), and turbidity, which can be a proxy for PCR inhibitors present in the water, can decrease detection by eDNA (Jane et al., 2015). For camera detections, if a fish was seen at least once in a video recording it was scored as 1; for snorkel surveys, if the fish was seen in at least one of the two passes then it was scored as 1; and, for eDNA if there was one positive hit in one of the three water samples taken then it was scored as 1. To determine if three water samples are needed per pool, the same occupancy models were re-run with the three detections, e.g., if two of the three water samples had a hit, then it was scored as 1, 1, 0. Using the program PRESENCE, models were run to calculate maximum likelihoods, and model selection was performed using AIC (Hines and MacKenzie, 2018). The model-averaged estimates were also calculated to obtain an overall detection probability for all three methods (MacKenzie et al., 2018). To assess the goodness of fit of our occupancy models, we attained the overdispersion parameter (c) by using Pearson chi-square statistics and parametric bootstrap test by running 10,000 bootstraps for the most global model (MacKenzie and Bailey, 2004). For models that were underdispersed (c < 1), c = 1 was set, and, for overdispersed models (c > 1), quasi-AIC (QAIC) was used, and AICc was used to correct for small sample sizes (Burnham and Anderson, 2002).
To test whether there is a correlation between the abundance estimates collected using underwater cameras and snorkel surveys, Spearman correlation tests were used due to the non-parametric nature of the abundance data. Data normality was tested using the “olsrr” package in R (Hebbali, 2018; R Core Team, 2019). Correlation tests were run between underwater camera MaxN and snorkel averaged count data, and underwater camera MaxN and snorkel density (individuals m−2) (Ellender et al., 2012; R Core Team, 2019). To run linear regressions, the abundance data were log10(x + 1) transformed to normalize the distribution of the residuals. To investigate the variation in habitat characteristics of the pools and fish densities between the tributaries, a Kruskal-Wallis test followed by Dunn's post-hoc test was used (Dinno, 2017).
Results
Fish Community Detection and Species-Specific Detection Probabilities Vary Between Methods
The species-specific qPCR primers designed for this study were specific for the target species and had good efficiency scores (102%) with a LOD of 1 × 10⁻⁴ ng/μL for P. swartzi and 1 × 10⁻⁵ ng/μL for S. capensis (Supplementary Figure 1). The eDNA analysis detected Pseudobarbus spp. in 14 of 22 sampling sites and S. capensis in 10 of 22 sites and was generally consistent across technical and biological replicates (Supplementary Table 3).
The raw detection data revealed that the visual observation methods detected most of the fish species, although there were slight, but not significant, differences between methods. Generally, underwater cameras slightly outperformed snorkel surveys for all fish species except for Goldie Barb and River Goby (Table 1). The cameras detected Goldie Barb 75% of the time while snorkel surveys detected it 81% of the time, and River Goby was detected by these methods 82 and 100% of time, respectively. These percentages are overestimates of detection as we cannot confirm that a species was present in a pool if it was not detected by either visual observation method, i.e., imperfect detection was not being considered as there were too few encounters to run the occupancy models. Underwater camera was the only method that detected African Longfin Eel and African Sharptooth Catfish.
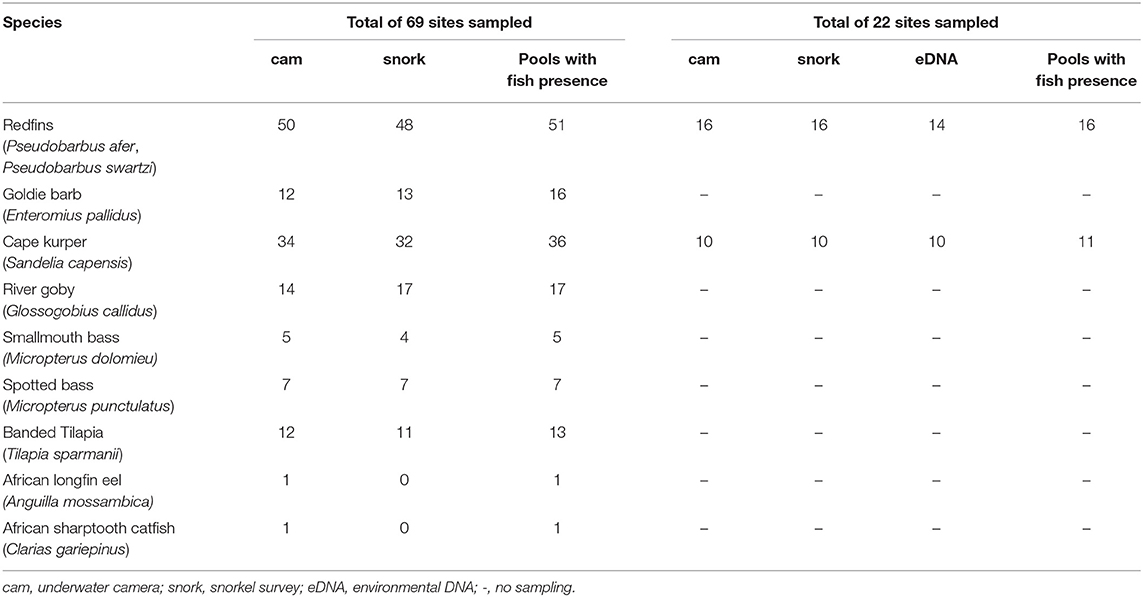
Table 1. Number of detections of each fish species by underwater cameras (cam) and snorkel surveys (snork), and eDNA across sampled sites.
Estimating the detection probabilities of the three methods was done only for redfins and Cape Kurper as there was an insufficient number of detections of the other fish species across the sampling area. Across the 69 sampling sites, the model-averaged detection probability estimates for the redfins was 0.96 (SD = 0.03) using underwater cameras, and 0.93 (SD = 0.05) using snorkel surveys, 0.70 (SD = 0.21) for combined-replicate eDNA, and 0.58 (SD = 0.08) for eDNA replicates (Figure 3). For Cape Kurper, the model-averaged estimates of the detection probability were 0.75 (SD = 0.15) using underwater cameras, 0.67 (SD = 0.16) for snorkel surveys, 0.64 (SD = 0.19) for combined-replicate eDNA, and 0.50 (SD = 0.12) for eDNA replicates (Figure 3). For both fishes, eDNA consistently underperformed while underwater cameras had the highest detection probability.
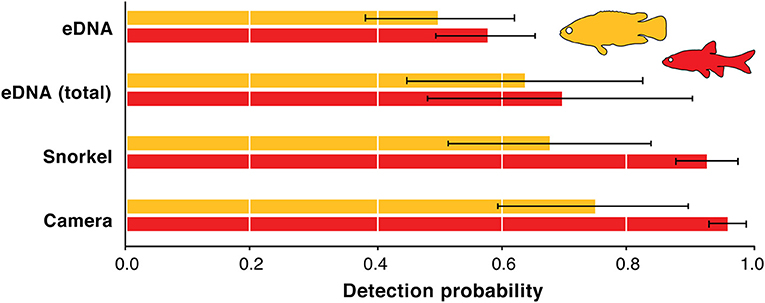
Figure 3. Detection probability model-averaged estimates for underwater cameras, snorkel surveys, eDNA combined replicates, and eDNA replicates for redfins (red) and Cape Kurper (yellow). Error bars represent standard deviations.
Habitat Variables Affect the Detection Probabilities of the Three Different Methods
To investigate the effect of habitat variables on each sampling method, multi-scale occupancy models were run with covariates hypothesized to affect each method individually and simultaneously while using the top covariate for occupancy. The covariates for the probability of occupancy and detection were pool length, average pool depth and width, surface area, and volume; additional covariates tested for occupancy included number of invasive fish species present and average and dominant sediment size. Further, turbidity was used as a covariate for detection probability.
There were four models with a difference in AICc value of <2 for redfins; however, the top model had a higher weight (wi = 0.12) while the other five models had very similar log-likelihood values, indicating little evidence for their support (Table 2; Burnham and Anderson, 2002). The top model revealed that the detection probabilities (p) of underwater cameras and snorkel surveys differed but were positively influenced by increasing pool length (Figure 4A). eDNA detection probability decreased with turbidity (Figure 4B). The top occupancy model included the negative affect of pool width on the probability of occupancy (ψ) of redfins.
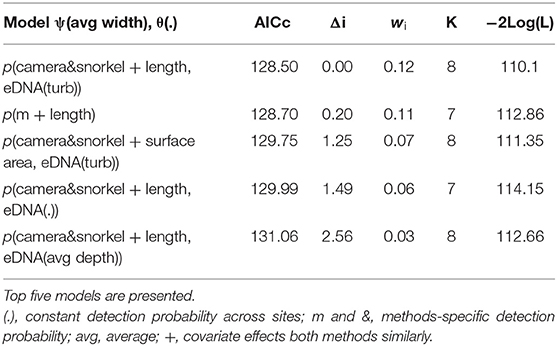
Table 2. Summary of the model selection using AIC for the occupancy and detection probability of redfins using underwater cameras, snorkel surveys, and combined eDNA.
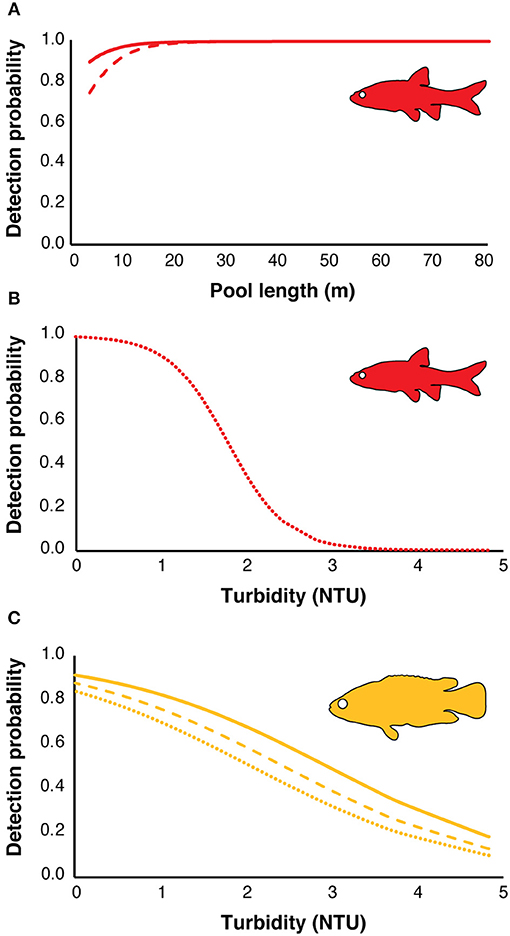
Figure 4. Effect of habitat variables on the estimated detection probabilities from the top models of the three methods for redfins (red) and Cape Kurper (yellow): (A) detection probability of underwater cameras (solid line), snorkel surveys (dashed line) against pool length (m) for redfins; (B) detection probability of eDNA for redfins (dotted line), (C) detection probability of underwater cameras (solid line), snorkel surveys (dashed line), and eDNA (dotted line) against water turbidity (NTU) for Cape Kurper.
For Cape Kurper, there were four supported models within 2 AICc values of the top, where the top model had the higher weight (wi = 0.24), while the other models had more parameters and similar log likelihoods, indicating little evidence for their support (Table 3). Based on the top model, the detection probabilities of underwater cameras, snorkel surveys, and eDNA differed, but were negatively affected with increasing turbidity (Figure 4C). The top occupancy model for Cape Kurper revealed a negative relationship between average pool width and probability of occupancy (ψ).
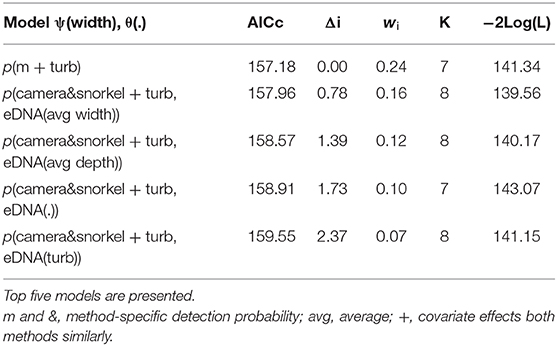
Table 3. Summary of the model selection using AIC for the occupancy and detection probability of Cape Kuper using underwater cameras, snorkel surveys, and combined eDNA.
Strong Correlation Between MaxN and Snorkel Densities
There were significant strong, positive correlations between the abundance estimates collected by both methods for both fish species. For redfins, the Spearman correlation was 0.63 (p < 0.001) between MaxN and averaged snorkel counts and 0.83 (p < 0.001) between MaxN and the snorkel density. For Cape Kurper, the Spearman correlation was 0.83 (p < 0.001, Figure 5A) between MaxN and average snorkel counts and 0.85 (p < 0.001, Figure 5B) between MaxN and snorkel density. The log-transformation normalized the distribution of the residuals for the abundance data of redfins but not Cape Kurper. Therefore, linear regressions were only run for redfins, which had significant positive relationships between MaxN and snorkel averaged counts (r2 = 0.65, p < 0.001, Figure 5C) and MaxN and snorkel densities (r2 = 0.62, p < 0.001, Figure 5D).
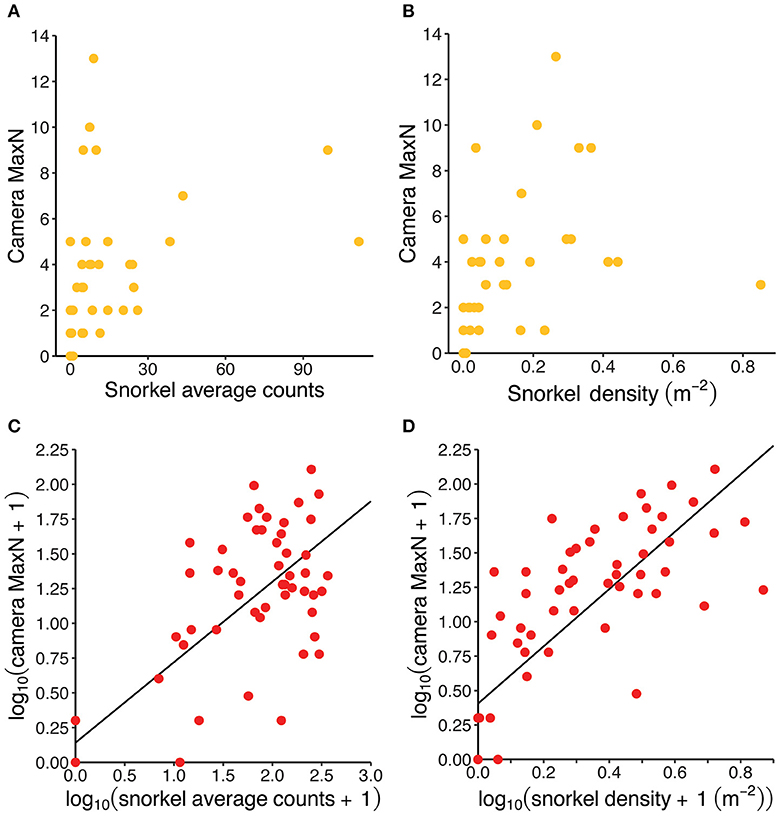
Figure 5. Visualizing the positive correlation between camera and snorkel abundance estimates for Cape Kurper (yellow) and redfins (red): (A) MaxN vs. snorkel average counts for Cape Kurper; (B) MaxN vs. snorkel density for Cape Kurper; (C) log-transformed MaxN vs. log-transformed snorkel average counts for redfins, regression line intercept = 0.14131 (SE = 0.09362) and slope = 0.57897 (SD = 0.05454), r2 = 0.65, p < 0.001; and (D) log-transformed MaxN vs. log-transformed snorkel density for redfins, regression line intercept = 0.4050 (SE = 0.0770) and slope = 2.0806 (SE = 0.2067), r2 = 0.62, p < 0.001.
Fish Abundance and Pool Morphology Differ Between Tributaries
For both fishes, abundance collected by snorkel survey was significantly higher in the Blindekloof than the other three tributaries (Kruskal-Wallis test, Dunn's post-hoc test, p < 0.05, Figures 6A,B), but that relationship was lost when the count data were converted to densities (m−2, Figures 6C,D). The Blindekloof also had the longest, widest, and deepest pools, followed by the Bos, and no significant differences were found between the Fernkloof and Waterkloof (Kruskal-Wallis test, Dunn's post-hoc test, p < 0.05; Figure 7).
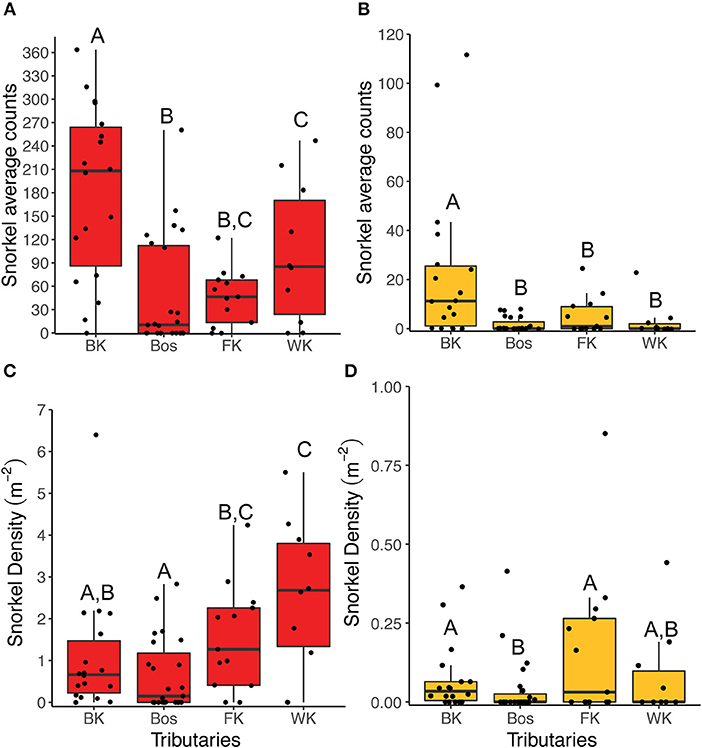
Figure 6. Boxplots of the snorkel abundance data collected for redfins (red) and Cape Kurper (yellow) at each tributary. The snorkel average counts for (A) redfins, and (B) Cape Kurper. The snorkel densities (m−2) for (C) redfins, and (D) Cape Kuper. BK is the Blindekloof, Bos is the Bos river, FK is the Fernkloof, and WK is the Waterkloof. Different letters above boxplots represent significant differences (p < 0.05) from the post-hoc Dunn's test.
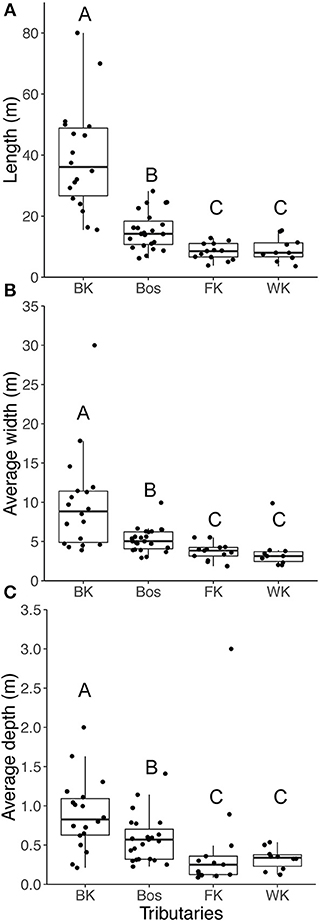
Figure 7. Boxplots for the habitat characteristics for the pools in each of the tributaries, (A) length (m); (B) width (m); (C) depth (m). BK is the Blindekloof, Bos is the Bos river, FK is the Fernkloof, and WK is the Waterkloof. Different letters above boxplots represent significant differences (p < 0.05) from the post-hoc Dunn's test.
Discussion
The model-averaged detection probabilities of the three non-invasive methods were higher for redfins than Cape Kurper and were affected by different habitat covariates. For both fishes, eDNA had the lowest detection probability and was negatively affected by turbidity. However, the model-averaged detection probability for Cape Kurper was similar between snorkel surveys and eDNA. Overall, underwater cameras and snorkel surveys had similar capabilities in detecting the fish community. For the two IUCN-listed fishes, underwater cameras had the highest detection probability compared to snorkel surveys and eDNA. For redfins, the detection probabilities of the visual observation methods were positively influenced by pool length. For Cape Kurper the detection probabilities of the visual observation methods were negatively influenced by turbidity. There were strong correlations between MaxN and abundance estimates, and MaxN and density. However, the linear relationship showed low goodness of fit, making it difficult to directly convert MaxN to absolute abundances.
The detection probabilities of redfins and Cape Kurper using eDNA were the lowest among the three gear types, but it detected both species in all four tributaries. While slightly lower than the visual observation methods, detection probability is within the range of other eDNA studies of rare freshwater species in lotic habitats (e.g., Schmidt et al., 2013; de Souza et al., 2016; Lopes et al., 2017; Bylemans et al., 2019; Sutter and Kinziger, 2019), but was highly dependent upon sampling strategy including volume of water filtered (Wilcox et al., 2016; Cantera et al., 2019; Hunter et al., 2019), number of PCR technical replication effort (Piggott, 2016), size, material, and pore size of the filter (Majaneva et al., 2018), the seasonal hydrology of the system, and rarity of the target (Buxton et al., 2017). Some of these factors, such as rarity, cannot be controlled and are specific to the species under investigation. For example, Wilcox et al. (2016) found that qPCR-based methods could detect a population density of a single fish within a 1 km stretch of river with probability of 0.18, which increased to >0.99 for three fish within a 100 m stretch. Other factors can be mitigated by increasing sampling effort but, as a result, also increase the cost associated with the study. In our study, based on estimates for individual pools and despite an overall lower value of detection probability, the sensitivity of eDNA was such that the scale of detection of both the Cape Kurper and the redfins was effective for detection at the watershed level. For these reasons, eDNA and visual methods may be better suited for detecting species at different spatial scales. The high sensitivity and efficiency of eDNA makes it particularly useful for large rivers. At this scale, eDNA methods outperform conventional sampling methods (Pont et al., 2018), including visual surveys (Lopes et al., 2017; Nakagawa et al., 2018). In contrast, visual observation methods may outperform eDNA when the occupancy of specific pools is of interest. False negatives are more likely for an individual pool, especially if the hydrochemical properties of the pool inhibit the detection of eDNA (e.g., high turbidity; Jane et al., 2015). False positives may be even more problematic at this spatial scale, as eDNA can be deposited in a pool from a source many kilometers upstream (Jane et al., 2015; Balasingham et al., 2017; Pont et al., 2018). The effectiveness of eDNA for characterizing species assemblages across the longitudinal stretch of a river has not been extensively investigated and, because of the many factors contributing to the preservation of eDNA in the water column, may be highly variable across systems (Nakagawa et al., 2018; Pont et al., 2018). In addition, most studies have focused on lentic or marine environments when comparing visual and eDNA methodologies (Yamamoto et al., 2016; Doble et al., 2019). Thus, currently, visual methods may be most appropriate for studies aimed at identifying pools within a river system for rehabilitation or protection, whereas eDNA may be most effective for large scale-studies.
The habitat covariate that had the greatest effect on eDNA detection for both redfins and Cape Kurper is turbidity. Turbidity, a proxy of organic solids containing PCR inhibitors, such as tannic and humic acids, has severe negative effects on the detection of species using eDNA, and increases susceptibility of the survey to false negatives (Harper et al., 2019). PCR inhibitors may also have unpredictable effects on increasing the volume of water sampled (Cantera et al., 2019). The impact of inhibitory substances can be alleviated by diluting samples prior to amplification; however, this practice will also decrease concentrations of target DNA. For rare species, this may dilute target DNA beyond the LOD (Sutter and Kinziger, 2019; Skinner et al., 2020). Methods for removing PCR inhibitors have also been developed (Hu et al., 2015). The detection probability of the Cape Kurper, the rarer species in these pools, is lower for all gear types, which may reflect its lower abundance. However, detection probability with eDNA is comparable for both species, and for the Cape Kurper is comparable to visual methods. This highlights the high sensitivity of eDNA studies, even for rare cryptic species such as the Cape Kurper, while more active and conspicuous species like the redfins might be easier detected with visual methods. Behavioral factors may also impact detection probability using eDNA. For example, differences in shedding rates (Klymus et al., 2015), and activity patterns might also have an impact on the eDNA suspended in the water column (de Souza et al., 2016). The Cape Kurper predominantly swims in short rapid movements and is more associated with the benthos than the redfins (Kadye et al., 2016). This exemplifies the importance of considering the specific biology of species when designing sampling protocols. For example, Cape Kurper may be more easily detected from sediment samples or water taken from deeper in the water column. Sampling methods combining water samples from different depths (Doble et al., 2019) and sediment samples may improve the detection of specific species, including the Common Carp (Turner et al., 2015), an invasive species found in the same systems in eastern South Africa.
Overall, the sensitivity of our eDNA assay could be improved by increasing the volume of water sampled and the number of biological and technical replicates, and by removing or mitigating the effect of inhibitors; however, this would lead to additional technical challenges associated with transporting or processing water samples, especially for remote localities. In this study, including the detections and non-detections of each eDNA replicate of each pool, instead of using the combined-replicate eDNA detection and non-detections, into the occupancy models reduced the eDNA detection probability by about 20%, revealing that there is a lot of variation in detection across replicates taken from a pool. Increasing the number of physical replicates and the total volume of water sampled should improve detection probability of both species, assuming inhibition of the PCR reaction can be overcome (Cantera et al., 2019). In addition, for these remote locations, filtering on site is also more appropriate to limit degradation of eDNA and reduce effort required to transport samples. Recent methodological advances have made onsite eDNA extraction and PCR-based detection easier, but are not inexpensive (Thomas et al., 2018). Costs associated with acquiring or transporting specialized equipment and the increased personnel hours required to increase sampling effort and onsite processing may be disproportionally high in remote areas.
The most significant costs associated with processing eDNA samples are associated with the facilities and instruments required for the extraction and PCR (Hinlo et al., 2017). Because of the high risk of contamination, it is essential to maintain two functional lab spaces, one “clean lab” where samples can be extracted and processed separate from the lab where the PCR reactions are undertaken (Goldberg et al., 2016). Therefore, the cost associated with these studies is largely dependent on the accessibility of the required facilities and is many orders of magnitude more expensive than visual methods. These costs shrink as the size of the study increases due to economies of scale and the high-throughput capacity of qPCR assays and next-generation sequencing (Smart et al., 2016). Nevertheless, even if the appropriate facilities for processing eDNA samples are available, methods need to be optimized for the target species, ensuring a minimum acceptable standard for deployment (Klymus et al., 2020), analogous to the MIQE standards in clinical PCR applications (Bustin et al., 2009). Once optimized, these approaches are widely applicable across broad geographic scales, taking into account environmental factors that may influence their efficacy (Cantera et al., 2019). The standardized nature of these studies has made it easier to study wide-spread invasive (Amberg et al., 2015) and commercially valuable fishes (Thomsen et al., 2016), and make detection studies more reproducible (Mauvisseau et al., 2019). In contrast, investigations of new species, typical in understudied localities, require careful optimization of sampling methods, laboratory protocols, and development of species-specific primers. This process can incur unexpected costs as the success of sampling approaches, primers, and protocols can vary unpredictably.
Generally, underwater cameras detected all the same fish species captured by snorkel surveys, although there were slight differences. Cameras detected Goldie Barb and River Goby fewer times than by snorkeling, although the differences were not significant. Nevertheless, differences in detection percentages revealed that underwater cameras did not capture Goldie Barb and River Goby as effectively as snorkel surveys, which may be due to the ecology and morphological characteristics of the fishes. Both the Goldie Barb and River Goby have translucent, light-brown slender bodies (Skelton, 2001) that can be difficult to see and identify in video images. Further, River Goby is a cryptic bottom-dwelling fish that tends to remain among cover (Skelton, 2001), making detection using a stationary camera more difficult as cameras rely on animal movement to record encounters (Rowcliffe et al., 2008). The tripod-mounted camera may not be the most effective set up for benthic fishes; a camera pointing toward the sediment mounted on a tow seems to effectively detect and quantify Round Goby, a benthic fish (Schaner et al., 2009; Taraborelli et al., 2009). Although underwater cameras were not as effective as snorkeling in detecting Goldie Barb and River Goby, they detected African Longfin Eel and African Sharptooth Catfish, which snorkel surveys did not. Both of these fishes tend to be more active at night and hide among rocks during the day (Kadye and Booth, 2013; Ellender et al., 2018); therefore, opportunistic sightings of these fishes leaving their shelter when not disturbed (e.g., by a snorkeler) were captured with underwater cameras. To capture the whole community, both diurnal and nocturnal fishing, using visual observation methods, night-time sampling would be required. Ellender et al. (2018) performed night snorkeling with a strong dive flashlight to observe the behavior of native eels, and other studies have used infrared cameras or light attachments on cameras for nocturnal-fish studies (Bassett and Montgomery, 2011; Dirnwoeber et al., 2012; Harvey et al., 2012). Night sampling would require additional personnel hours and extra safety precautions. Alternatively, eDNA could be used to detect the entire fish community with water samples taken from a pool without the necessity to sample at night.
For the endangered redfins, differences were observed in detection probabilities between visual observation methods. The model-averaged estimates revealed that underwater cameras had a higher detection probability and lower variation than snorkel surveys and eDNA. The detection probabilities for underwater cameras and snorkel surveys were above 0.90, suggesting that both methods are very effective at detecting redfins, although these detection probabilities decrease with decreasing pool length. The decreasing detection probability of both visual methods with decreasing pool length for redfins is contrary to what we had hypothesized. Generally, as the spatial scale of an area increased, it became less likely that an animal would be encountered; however, if the number of individuals also increased, then the animal was more likely to be encountered (Rowcliffe et al., 2008). Redfins abundance was highest in the Blindekloof, which also had the longest pools, but density was higher in smaller river pools. If the fish were diluted across the length of the pool as indicated by the density estimation, then detection probability would decrease, as we hypothesized, not increase as the models revealed. However, Redfin tend to form large shoals of over 100 individuals (Skelton, 2001; Ellender et al., 2018), which are very conspicuous and readily detectable by the underwater camera and snorkeler, especially as it is a curious fish that is attracted to the snorkeler (RAC, personal observation). Ellender et al. (2012) found that these two fish species were attracted to the cameras <5% of the time, noting that the behavior does not bias the camera detection data. Therefore, detection probabilities of the visual observation methods are likely being driven by the large schools of redfins in the long pools of the Blindekloof. A study by Castañeda et al. (2020) revealed that underwater cameras had a high detection probability in detecting an endangered minnow that mainly used the water column of a pool, similar to redfins. On the other hand, Cape Kurper does not aggregate in large shoals; thus, its density likely reflects its actual distribution across the pools and the detection probability of both visual observation methods is hypothesized to decrease with increasing spatial scale.
The detection probabilities of the Cape Kurper were lower than redfins for all gear types. The detection probability of underwater cameras for Cape Kurper was 23% lower than that of redfins, while the snorkel survey detection probability was 28% lower. The habitat covariate that drives the detection probabilities for the visual observation methods of the Cape Kurper also differs from that observed for the redfins. Turbidity, not a spatial covariate as with redfins, had the strongest negative effect on the detection probabilities on the two visual methods; as water clarity decreases so does detection probability of the two methods that solely rely on vision to capture fishes. Cape Kurper is more cryptic relative to the large shoals of redfins and tends to hide in structural habitat (Ellender et al., 2012), thus it would be difficult to detect in less clear water. Higher water turbidity also decrease the detection probability of underwater cameras and backpack electrofishing, two visual methods that have been applied for monitoring an endangered minnow in temperate streams in Canada (Castañeda et al., 2020). A study conducted by Ellender et al. (2012) in the Swartkops watershed confirmed that there were no significant differences between the detection rates of underwater cameras and backpack electrofishing for either redfins and Cape Kurper, concluding that underwater cameras are a good non-invasive alternative method.
Estimating abundance and density is required to attain important information on the population ecology of theses fishes; hence, direct comparison between these estimates is necessary. There was a strong correlation between the camera and snorkel data, MaxN increased with both increasing snorkel counts and density. For redfins, log-transformation successfully normalized the data, thus linear regressions could be run. The linear regressions revealed that there was a direct relationship between MaxN and snorkel counts and density; however, the goodness of fit values were low. The goodness of fit values suggests that only about 60% of the variance of MaxN could be explained bysnorkel counts and density. For Cape Kurper, because the data were not normally distributed even with data-transformation techniques, a linear regression could not be run without violating important assumptions. Therefore, no true pattern could be discerned for direct conversion between MaxN and the snorkel data. Furthermore, cameras are static and do not have a spatial reference, unless used in stereo or the distance to a fixed known point is calibrated (Harvey et al., 2002; Struthers et al., 2015) to appropriately convert MaxN to density, resulting in measurement of relative, not absolute, abundance as with snorkeling that covers the whole pool. At most, researchers using underwater cameras can conclude that a higher MaxN recording results in a higher relative abundance of fish, as the positive correlations revealed in this study and the lack of fit between MaxN and density. Generally, MaxN often underestimates abundance while snorkel surveys can be biased based on the behavior of the fishes (Harvey et al., 2002; Campbell et al., 2015). Hence, if absolute abundances are required, then snorkel surveys are better suited than underwater cameras, as the latter could only provide relative abundance estimates, unless multiple cameras are deployed to cover the entire pool.
There are strengths and weaknesses for each method, and researchers must prioritize their conservation needs and resource availability before deciding on which method to use for sampling in remote locations. In clear headwater environments, visual observation methods were better at detecting IUCN-listed fishes than eDNA. Visual observation methods performed best in clear waters as increasing water turbidity decreased the field of view of the snorkelers and cameras; therefore, other non-invasive methods are needed when turbidity is high. However, given that eDNA was similarly negatively influenced by turbidity, it is unsuitable to replace visual observation methods in streams with higher turbidity. For all three methods, depending on the distance between pools, many sites can be sampled in a single day; however, it could take many hours of trained-personnel time to score video data (~35 min per video, RAC personal observation) and process eDNA samples. Furthermore, electricity, which may not be available in remote field sites, is needed to charge camera batteries, upload video footage to hard drives, and filter eDNA if not using a hand pump. In this study, we used only one camera per pool; however, depending on the research needs and environmental factors, different approaches can be used. For example, the use of two stereo-cameras mounted at a fixed distance, calibrated with a scale bar, can accurately measure the size of fishes for population-structure analysis (Harvey et al., 2002; Harasti et al., 2014), or multiple cameras can be used at a site to increase detection of rare fishes (Castañeda et al., 2020). An additional resource necessary for eDNA at the base camp is a dedicated sterile space for eDNA filtration, which may not be readily available in many remote areas. Personnel trained on sterile filtration technique would be necessary to process the eDNA on site. Nevertheless, eDNA could detect full species community (diurnal and nocturnal fishes) with one visit, unlike the visual observation methods that would require night-time sampling. On the other hand, snorkel surveys require trained personnel in the field to reliably count and identify species in the streams, but the data are immediately available for analysis. However, fish identifications and counts using snorkel surveys are not verifiable unless visually recorded (e.g., GoPro on mask), and information regarding behavior can be difficult to collect without disturbing the fish, as they may be attracted to or repelled by the snorkeler if the snorkeler moves too quickly (Thurow et al., 2012). Specialized fish identification training would be required for field personnel. Snorkel surveys can provide density data while underwater cameras can only reliably provide relative abundance. Generally, eDNA requires the most specialized space and equipment but has the greatest potential for high-throughput assays, once optimized for an ecological community or locality. Underwater cameras are a powerful tool capable of capturing and storing unique information on the behavior and habitat use of fishes but cost more and take more time to complete than snorkel surveys, especially if multiple cameras are needed (Friesen and Chivers, 2006; Domenici et al., 2014; Struthers et al., 2015). The equipment needed to collect the field data for the three methods can easily be transported through rugged terrain with the main limiting factor for the three methods being accessibility to resources in the lab and field.
Researchers are encouraged to use at least one of these non-invasive methods when sampling rare freshwater fishes as they are reliable tools for collecting information on fish ecology in remote areas with minimal negative effects on the populations themselves. Climate change is predicted to increase water temperatures and alter water discharge, which may have negative impacts of the growth and survival of freshwater fishes (Bassar et al., 2016; Reid et al., 2019). Fishes listed on the IUCN Red List are already threatened by other stressors such as habitat degradation and invasive species. The additional threat of climate change may compound or work synergistically with existing threats and exacerbate stress on already vulnerable fishes (Rahel and Olden, 2008; Comte and Olden, 2017; Reid et al., 2019). Using non-invasive sampling methods to reduce unintentional harm during monitoring will become more important as multiple threats continue to impact fish populations and communities. Continual monitoring of vulnerable fish populations is important to understand occupancy and metapopulation dynamics across time and space and to make appropriate inferences on conservation management needs; these non-invasive methods can facilitate long-term monitoring studies without jeopardizing populations. Therefore, these three methods will become of even greater importance as climate change and other stressors continue to negatively impact unique fish communities throughout freshwater ecosystems (Darwall et al., 2018; Reid et al., 2019).
Data Availability Statement
The datasets generated for this study are available on request to the corresponding author.
Ethics Statement
The animal study was reviewed and approved by SAIAB Animal Ethics Committee University of Toronto Scarborough Local Animal Care Committee.
Author Contributions
RC, SC, BE, and OW conceived the project. RC, SC, and BE designed the field protocol and collected the field data. AV and SC completed the eDNA extractions. AV designed and conducted the qPCR protocol and wrote the methods. RC scored the video recordings. RC analyzed and interpreted the data, and wrote the manuscript with assistance from AV, SC, NM, and OW. DH, HM, NM, and OW financially supported, approved, and provided critical advice on the project. All co-authors have revised the manuscript and gave final approval for publication.
Funding
We gratefully acknowledge the funding support from NSERC Canadian Aquatic Invasive Species Network II, NSERC Discovery grants to NM, DH, and HM, FRQNT Scholarship to RC, and the Department of Science and Innovation (DSI)/National Research Foundation (NRF) South African Research Chairs Initiative (Inland Fisheries and Freshwater Ecology, Grant No. 110507) to OW.
Conflict of Interest
The authors declare that the research was conducted in the absence of any commercial or financial relationships that could be construed as a potential conflict of interest.
Acknowledgments
We would like to thank Carol Blumenthal at the Skilderkrantz Nature Reserve for hosting us during our fieldwork. We would also like to thank S. J. Collins, C. Coppinger, and A. Winkler for their assistance in the field, and K. Wong for help scoring videos. We are grateful for the facilities and lab equipment provided by N. R. Lovejoy and the Center for the Neurobiology of Stress (CNS) at the University of Toronto Scarborough (UTSC). We acknowledge use of infrastructure and equipment provided by the NRF-SAIAB Research Platforms and the funding channeled through the NRF-SAIAB Institutional Support system. We thank Albert Chakona and the NRF-SAIAB collections for providing us with the fin clips and genetic sequences of the fishes in this study.
Supplementary Material
The Supplementary Material for this article can be found online at: https://www.frontiersin.org/articles/10.3389/fenvs.2020.00029/full#supplementary-material
References
Amberg, J. J., Grace McCalla, S., Monroe, E., Lance, R., Baerwaldt, K., and Gaikowski, M. P. (2015). Improving efficiency and reliability of environmental DNA analysis for silver carp. J. Great Lakes Res. 41, 367–373. doi: 10.1016/j.jglr.2015.02.009
Assis, J., Claro, B., Ramos, A., Boavida, J., and Serrão, E. A. (2013). Performing fish counts with a wide-angle camera, a promising approach reducing divers' limitations. J. Exp. Mar. Biol. Ecol. 445, 93–98. doi: 10.1016/j.jembe.2013.04.007
Baker, C. S., Steel, D., Nieukirk, S., and Klinck, H. (2018). Environmental DNA (eDNA) from the wake of the whales: droplet digital PCR for detection and species identification. Front. Mar. Sci. 5:133. doi: 10.3389/fmars.2018.00133
Balasingham, K. D., Walter, R. P., and Heath, D. D. (2017). Residual eDNA detection sensitivity assessed by quantitative real-time PCR in a river ecosystem. Mol. Ecol. Resour. 17, 523–532. doi: 10.1111/1755-0998.12598
Balasingham, K. D., Walter, R. P., Mandrak, N. E., and Heath, D. D. (2018). Environmental DNA detection of rare and invasive fish species in two Great Lakes tributaries. Mol. Ecol. 27, 112–127. doi: 10.1111/mec.14395
Bassar, R. D., Letcher, B. H., Nislow, K. H., and Whiteley, A. R. (2016). Changes in seasonal climate outpace compensatory density-dependence in eastern brook trout. Glob. Chang. Biol. 22, 577–593. doi: 10.1111/gcb.13135
Bassett, D. K., and Montgomery, J. C. (2011). Investigating nocturnal fish populations in situ using baited underwater video: with special reference to their olfactory capabilities. J. Exp. Mar. Biol. Ecol. 409, 194–199. doi: 10.1016/j.jembe.2011.08.019
Biggs, J., Ewald, N., Valentini, A., Gaboriaud, C., Dejean, T., Griffiths, R. A., et al. (2015). Using eDNA to develop a national citizen science-based monitoring programme for the great crested newt (Triturus cristatus). Biol. Conserv. 183, 19–28. doi: 10.1016/j.biocon.2014.11.029
Brock, R. E. (1982). A critique of the visual census method for assessing coral reef fish populations. Bull. Mar. Sci. 32, 269–276.
Burnham, K. P., and Anderson, D. R. (2002). Model Selection and Multimodel Inference: A Practical Information-Theoretic Approach, 2nd Edn. New York, NY: Springer-Verlag.
Bustin, S. A., Benes, V., Garson, J. A., Hellemans, J., Huggett, J., Kubista, M., et al. (2009). The MIQE guidelines: minimum information for publication of quantitative real-time PCR experiments. Clin. Chem. 55, 611–622. doi: 10.1373/clinchem.2008.112797
Buxton, A. S., Groombridge, J. J., Zakaria, N. B., and Griffiths, R. A. (2017). Seasonal variation in environmental DNA in relation to population size and environmental factors. Sci. Rep. 7:46294. doi: 10.1038/srep46294
Bylemans, J., Gleeson, D. M., Duncan, R. P., Hardy, C. M., and Furlan, E. M. (2019). A performance evaluation of targeted eDNA and eDNA metabarcoding analyses for freshwater fishes. Environ. DNA 1, 402–414. doi: 10.1002/edn3.41
Campbell, M. D., Pollack, A. G., Gledhill, C. T., Switzer, T. S., and deVries, D. A. (2015). Comparison of relative abundance indices calculated from two methods of generating video count data. Fish. Res. 170, 125–133. doi: 10.1016/j.fishres.2015.05.011
Cantera, I., Cilleros, K., Valentini, A., Cerdan, A., Dejean, T., Iribar, A., et al. (2019). Optimizing environmental DNA sampling effort for fish inventories in tropical streams and rivers. Sci. Rep. 9:3085. doi: 10.1038/s41598-019-39399-5
Castañeda, R. A., Weyl, O. L. F., and Mandrak, N. E. (2020). Using occupancy models to assess the effectiveness of underwater cameras to detect rare stream fishes. Aquat. Conserv. Mar. Freshw. Ecosyst. 30, 565–576. doi: 10.1002/aqc.3254
Chakona, A. (2018). Sandelia capensis. IUCN Red List of Threatened Species. e.T19890A99447632. doi: 10.2305/IUCN.UK.2018-1.RLTS.T19890A99447632.en
Chakona, A., and Skelton, P. H. (2017). A review of the Pseudobarbus afer (Peters, 1864) species complex (Teleostei, Cyprinidae) in the Eastern Cape Fold Ecoregion of South Africa. Zookeys 657, 109–140. doi: 10.3897/zookeys.657.11076
Chakona, A., Weyl, O. L. F., and Ellender, B. R. (2017a). Pseudobarbus afer. IUCN Red List of Threatened Species. e.T107654052A107654388. doi: 10.2305/IUCN.UK.2017-3.RLTS.T107654052A107654388.en
Chakona, A., Weyl, O. L. F., and Ellender, B. R. (2017b). Pseudobarbus swartzi. IUCN Red List of Threatened Species. e.T107662050A107937478. doi: 10.2305/IUCN.UK.2017-3.RLTS.T107662050A107937478.en
Chamberland, J.-M., Lanthier, G., and Boisclair, D. (2014). Comparison between electrofishing and snorkeling surveys to describe fish assemblages in Laurentian streams. Environ. Monit. Assess. 186, 1837–1846. doi: 10.1007/s10661-013-3497-4
Colvin, S. A. R., Sullivan, S. M. P., Shirey, P. D., Colvin, R. W., Winemiller, K. O., Hughes, R. M., et al. (2019). Headwater streams and wetlands are critical for sustaining fish, fisheries, and ecosystem services. Fisheries 44, 73–91. doi: 10.1002/fsh.10229
Comte, L., and Olden, J. D. (2017). Climatic vulnerability of the world's freshwater and marine fishes. Nat. Clim. Chang. 7, 718–722. doi: 10.1038/nclimate3382
Costello, M., Beard, K., Corlett, R., Cumming, G., Devictor, V., Loyola, R., et al. (2016). Field work ethics in biological research. Biol. Conserv. 203, 268–271. doi: 10.1016/j.biocon.2016.10.008
Darwall, W., Bremerich, V., de Wever, A., Dell, A. I., Freyhof, J., Gessner, M. O., et al. (2018). The alliance for freshwater life: a global call to unite efforts for freshwater biodiversity science and conservation. Aquat. Conserv. Mar. Freshw. Ecosyst. 28, 1015–1022. doi: 10.1002/aqc.2958
de Souza, L. S., Godwin, J. C., Renshaw, M. A., and Larson, E. (2016). Environmental DNA (eDNA) detection probability is influenced by seasonal activity of organisms. PLoS ONE 11:e0165273. doi: 10.1371/journal.pone.0165273
Dinno, A. (2017). Dunn.Test: Dunn's Test of Multiple Comparisons Using Rank Sums. Available online at: https://cran.r-project.org/package=dunn.test (accessed July 19, 2019).
Dirnwoeber, M., Machan, R., and Herler, J. (2012). Coral reef surveillance: infrared-sensitive video surveillance technology as a new tool for diurnal and nocturnal long-term field observations. Remote Sens. 4, 3346–3362. doi: 10.3390/rs4113346
Doble, C. J., Hipperson, H., Salzburger, W., Horsburgh, G. J., Mwita, C., Murrell, D. J., et al. (2019). Testing the performance of environmental DNA metabarcoding for surveying highly diverse tropical fish communities: a case study from Lake Tanganyika. Environ. DNA 12, 1–18. doi: 10.1002/edn3.43
Dolan, C. R., and Miranda, L. E. (2004). Injury and mortality of warmwater fishes immobilized by electrofishing. North Am. J. Fish. Manag. 24, 118–127. doi: 10.1577/M02-115
Domenici, P., Wilson, A. D. M., Kurvers, R. H. J. M., Marras, S., Herbert-Read, J. E., Steffensen, J. F., et al. (2014). How sailfish use their bills to capture schooling prey. Proc. R. Soc. B Biol. Sci. 281:20140444. doi: 10.1098/rspb.2014.0444
Ebner, B. C., Fulton, C. J., Cousins, S., Donaldson, J. A., Kennard, M. J., Meynecke, J.-O., et al. (2015). Filming and snorkelling as visual techniques to survey fauna in difficult to access tropical rainforest streams. Mar. Freshw. Res. 66, 120–126. doi: 10.1071/MF13339
Ebner, B. C., and Morgan, D. L. (2013). Using remote underwater video to estimate freshwater fish species richness. J. Fish Biol. 82, 1592–1612. doi: 10.1111/jfb.12096
Eichmiller, J. J., Best, S. E., and Sorensen, P. W. (2016). Effects of temperature and trophic State on degradation of environmental DNA in lake water. Environ. Sci. Technol. 50, 1859–1867. doi: 10.1021/acs.est.5b05672
Ellender, B. R., Becker, A., Weyl, O. L. F., and Swartz, E. R. (2012). Underwater video analysis as a non-destructive alternative to electrofishing for sampling imperilled headwater stream fishes. Aquat. Conserv. Mar. Freshw. Ecosyst. 22, 58–65. doi: 10.1002/aqc.1236
Ellender, B. R., Wasserman, R. J., Chakona, A., Skelton, P. H., and Weyl, O. L. F. (2017). A review of the biology and status of Cape Fold Ecoregion freshwater fishes. Aquat. Conserv. Mar. Freshw. Ecosyst. 27, 867–879. doi: 10.1002/aqc.2730
Ellender, B. R., Wasserman, R. J., Ndaleni, P. M., Mofu, L., Wu, Y., and Weyl, O. L. F. (2016). Reporting by-catch and mortalities in targeted biological field surveys on fishes. Aquat. Conserv. Mar. Freshw. Ecosyst. 26, 596–601. doi: 10.1002/aqc.2613
Ellender, B. R., Weyl, O. L. F., Alexander, M. E., Luger, A. M., Nagelkerke, L. A. J., and Woodford, D. J. (2018). Out of the pot and into the fire: explaining the vulnerability of an endangered small headwater stream fish to black-bass Micropterus spp. invasion. J. Fish Biol. 92, 1035–1050. doi: 10.1111/jfb.13562
Ellender, B. R., Weyl, O. L. F., and Swartz, E. R. (2011). Invasion of a headwater stream by non-native fishes in the Swartkops River system, South Africa. African Zool. 46, 39–46. doi: 10.3377/004.046.0116
Fernández, S., Rodríguez, S., Martínez, J. L., Borrell, Y. J., Ardura, A., and García-Vázquez, E. (2018). Evaluating freshwater macroinvertebrates from eDNA metabarcoding: a river Nalón case study. PLoS ONE 13:e0201741. doi: 10.1371/journal.pone.0201741
Ficetola, G. F., Miaud, C., Pompanon, F., and Taberlet, P. (2008). Species detection using environmental DNA from water samples. Biol. Lett. 4, 423–425. doi: 10.1098/rsbl.2008.0118
Friesen, R. G., and Chivers, D. P. (2006). Underwater video reveals strong avoidance of chemical alarm cues by prey fishes. Ethology 112, 339–345. doi: 10.1111/j.1439-0310.2006.01160.x
Goldberg, C. S., Pilliod, D. S., Arkle, R. S., and Waits, L. P. (2011). Molecular detection of vertebrates in stream water: a demonstration using rocky mountain tailed frogs and idaho giant salamanders. PLoS ONE 6:e22746. doi: 10.1371/journal.pone.0022746
Goldberg, C. S., Turner, C. R., Deiner, K., Klymus, K. E., Thomsen, P. F., Murphy, M. A., et al. (2016). Critical considerations for the application of environmental DNA methods to detect aquatic species. Methods Ecol. Evol. 7, 1299–1307. doi: 10.1111/2041-210X.12595
Guillera-Arroita, G. (2017). Modelling of species distributions, range dynamics and communities under imperfect detection: advances, challenges and opportunities. Ecography 40, 281–295. doi: 10.1111/ecog.02445
Harasti, D., Gallen, C., Malcolm, H., Tegart, P., and Hughes, B. (2014). Where are the little ones: distribution and abundance of the threatened serranid Epinephelus daemelii (Günther, 1876) in intertidal habitats in New South Wales, Australia. J. Appl. Ichthyol. 30, 1007–1015. doi: 10.1111/jai.12446
Harper, L. R., Buxton, A. S., Rees, H. C., Bruce, K., Brys, R., Halfmaerten, D., et al. (2019). Prospects and challenges of environmental DNA (eDNA) monitoring in freshwater ponds. Hydrobiologia 826, 25–41. doi: 10.1007/s10750-018-3750-5
Harper, L. R., Lawson Handley, L., Hahn, C., Boonham, N., Rees, H. C., Gough, K. C., et al. (2018). Needle in a haystack? A comparison of eDNA metabarcoding and targeted qPCR for detection of the great crested newt (Triturus cristatus). Ecol. Evol. 8, 6330–6341. doi: 10.1002/ece3.4013
Harvey, E., Fletcher, D., Shortis, M. R., and Kendrick, G. A. (2002). A comparison of the accuracy and precision of measurements from single and stereo-video systems. Mar. Technol. Soc. J. 36, 38–49. doi: 10.4031/002533202787914106
Harvey, E. S., Butler, J. J., McLean, D. L., and Shand, J. (2012). Contrasting habitat use of diurnal and nocturnal fish assemblages in temperate Western Australia. J. Exp. Mar. Bio. Ecol. 426–427, 78–86. doi: 10.1016/j.jembe.2012.05.019
Hebbali, A. (2018). Olsrr: Tools for Building OLS Regression Models. Available online at: https://cran.r-project.org/package=olsrr (accessed July 19, 2019).
Hines, J. E., and MacKenzie, D. I. (2018). PRESENCE 12.12 - Estimates Patch Occupancy Rates and Related Parameters. Available online at: http://www.mbr-pwrc.usgs.gov/software/presence.html (accessed July 13, 2019).
Hinlo, R., Gleeson, D., Lintermans, M., and Furlan, E. (2017). Methods to maximise recovery of environmental DNA from water samples. PLoS ONE 12:e0179251. doi: 10.1371/journal.pone.0179251
Hu, Q., Liu, Y., Yi, S., and Huang, D. (2015). A comparison of four methods for PCR inhibitor removal. Forensic Sci. Int. Genet. 16, 94–97. doi: 10.1016/j.fsigen.2014.12.001
Hunter, M. E., Ferrante, J. A., Meigs-Friend, G., and Ulmer, A. (2019). Improving eDNA yield and inhibitor reduction through increased water volumes and multi-filter isolation techniques. Sci. Rep. 9:5259. doi: 10.1038/s41598-019-40977-w
Jane, S. F., Wilcox, T. M., McKelvey, K. S., Young, M. K., Schwartz, M. K., Lowe, W. H., et al. (2015). Distance, flow and PCR inhibition: eDNA dynamics in two headwater streams. Mol. Ecol. Resour. 15, 216–227. doi: 10.1111/1755-0998.12285
Janosik, A., and Johnston, C. (2015). Environmental DNA as an effective tool for detection of imperiled fishes. Environ. Biol. Fishes 98, 1889–1893. doi: 10.1007/s10641-015-0405-5
Jerde, C. L., Chadderton, W. L., Mahon, A. R., Renshaw, M. A., Corush, J., Budny, M. L., et al. (2013). Detection of Asian carp DNA as part of a Great Lakes basin-wide surveillance program. Can. J. Fish. Aquat. Sci. 70, 522–526. doi: 10.1139/cjfas-2012-0478
Jordan, F., Jelks, H., Bortone, S., and Dorazio, R. (2008). Comparison of visual survey and seining methods for estimating abundance of an endangered, benthic stream fish. Environ. Biol. Fishes 81, 313–319. doi: 10.1007/s10641-007-9202-0
Kadye, W. T., and Booth, A. J. (2013). Movement patterns and habitat selection of invasive African sharptooth catfish. J. Zool. 289, 41–51. doi: 10.1111/j.1469-7998.2012.00960.x
Kadye, W. T., Chakona, A., and Jordaan, M. S. (2016). Swimming with the giant: coexistence patterns of a new redfin minnow Pseudobarbus skeltoni from a global biodiversity hot spot. Ecol. Evol. 6, 7141–7155. doi: 10.1002/ece3.2328
King, A. J., George, A., Buckle, D. J., Novak, P. A., and Fulton, C. J. (2018). Efficacy of remote underwater video cameras for monitoring tropical wetland fishes. Hydrobiologia 807, 145–164. doi: 10.1007/s10750-017-3390-1
Klymus, K. E., Merkes, C. M., Allison, M. J., Goldberg, C. S., Helbing, C. C., Hunter, M. E., et al. (2020). Reporting the limits of detection and quantification for environmental DNA assays. Environ. DNA. doi: 10.1002/edn3.29. [Epub ahead of print].
Klymus, K. E., Richter, C. A., Chapman, D. C., and Paukert, C. (2015). Quantification of eDNA shedding rates from invasive bighead carp Hypophthalmichthys nobilis and silver carp Hypophthalmichthys molitrix. Biol. Conserv. 183, 77–84. doi: 10.1016/j.biocon.2014.11.020
Lacoursière-Roussel, A., Côté, G., Leclerc, V., and Bernatchez, L. (2016a). Quantifying relative fish abundance with eDNA: a promising tool for fisheries management. J. Appl. Ecol. 53, 1148–1157. doi: 10.1111/1365-2664.12598
Lacoursière-Roussel, A., Dubois, Y., Normandeau, E., and Bernatchez, L. (2016b). Improving herpetological surveys in eastern North America using the environmental DNA method. Genome 59, 991–1007. doi: 10.1139/gen-2015-0218
Langlois, T., Harvey, E., Fitzpatrick, B., Meeuwig, J., and Shedrawi, G. (2010). Cost-efficient sampling of fish assemblages: comparison of baited video stations and diver video transects. Aquat. Biol. 9, 155–168. doi: 10.3354/ab00235
Lopes, C. M., Sasso, T., Valentini, A., Dejean, T., Martins, M., Zamudio, K. R., et al. (2017). eDNA metabarcoding: a promising method for anuran surveys in highly diverse tropical forests. Mol. Ecol. Resour. 17, 904–914. doi: 10.1111/1755-0998.12643
Lowe, W. H., and Likens, G. E. (2005). Moving headwater streams to the head of the class. Bioscience 55, 196–197. doi: 10.1641/0006-3568(2005)055[0196:MHSTTH]2.0.CO;2
MacKenzie, D. I., and Bailey, L. L. (2004). Assessing the fit of site-occupancy models. J. Agric. Biol. Environ. Stat. 9, 300–318. doi: 10.1198/108571104X3361
MacKenzie, D. I., Nichols, J. D., Royle, A. J., Pollock, K. H., Bailey, L. L., and Hines, J. E. (2018). Occupancy Estimation and Modeling: Inferring Patterns and Dynamics of Species Occurrence, 2nd Edn. London: Elsevier Inc.
Macnaughton, C. J., Harvey-Lavoie, S., Senay, C., Lanthier, G., Bourque, G., Legendre, P., et al. (2015). A comparison of electrofishing and visual surveying methods for estimating fish community structure in temperate tivers. River Res. Appl. 31, 1040–1051. doi: 10.1002/rra.2787
Majaneva, M., Diserud, O. H., Eagle, S. H. C., Boström, E., Hajibabaei, M., and Ekrem, T. (2018). Environmental DNA filtration techniques affect recovered biodiversity. Sci. Rep. 8:4682. doi: 10.1038/s41598-018-23052-8
Mallet, D., and Pelletier, D. (2014). Underwater video techniques for observing coastal marine biodiversity: a review of sixty years of publications (1952–2012). Fish. Res. 154, 44–62. doi: 10.1016/j.fishres.2014.01.019
Mauvisseau, Q., Davy-Bowker, J., Bulling, M., Brys, R., Neyrinck, S., Troth, C., et al. (2019). Combining ddPCR and environmental DNA to improve detection capabilities of a critically endangered freshwater invertebrate. Sci. Rep. 9:14064. doi: 10.1038/s41598-019-50571-9
Nakagawa, H., Yamamoto, S., Sato, Y., Sado, T., Minamoto, T., and Miya, M. (2018). Comparing local- and regional-scale estimations of the diversity of stream fish using eDNA metabarcoding and conventional observation methods. Freshw. Biol. 63, 569–580. doi: 10.1111/fwb.13094
Nichols, J. D., Bailey, L. L., O'Connell, A. F. Jr., Talancy, N. W., Campbell Grant, E. H., Gilbert, A., et al. (2008). Multi-scale occupancy estimation and modelling using multiple detection methods. J. Appl. Ecol. 45, 1321–1329. doi: 10.1111/j.1365-2664.2008.01509.x
Pelletier, D., Leleu, K., Mou-Tham, G., Guillemot, N., and Chabanet, P. (2010). Comparison of visual census and high definition video transects for monitoring coral reef fish assemblages. Fish. Res. 107, 84–93. doi: 10.1016/j.fishres.2010.10.011
Piggott, M. P. (2016). Evaluating the effects of laboratory protocols on eDNA detection probability for an endangered freshwater fish. Ecol. Evol. 6, 2739–2750. doi: 10.1002/ece3.2083
Pont, D., Rocle, M., Valentini, A., Civade, R., Jean, P., Maire, A., et al. (2018). Environmental DNA reveals quantitative patterns of fish biodiversity in large rivers despite its downstream transportation. Sci. Rep. 8:10361. doi: 10.1038/s41598-018-28424-8
Putman, R. J. (1995). Ethical considerations and animal welfare in ecological field studies. Biodivers. Conserv. 4, 903–915. doi,: 10.1007/B. F.00056197
R Core Team (2019). R: A Language and Environment for Statistical Computing. Available online at: https://www.r-project.org/ (accessed April 26, 2019).
Rahel, F. J., and Olden, J. D. (2008). Assessing the effects of climate change on aquatic invasive species. Conserv. Biol. 22, 521–533. doi: 10.1111/j.1523-1739.2008.00950.x
Reid, A. J., Carlson, A. K., Creed, I. F., Eliason, E. J., Gell, P. A., Johnson, P. T. J., et al. (2019). Emerging threats and persistent conservation challenges for freshwater biodiversity. Biol. Rev. 94, 849–873. doi: 10.1111/brv.12480
Romero, L. M. (2004). Physiological stress in ecology: lessons from biomedical research. Trends Ecol. Evol. 19, 249–255. doi: 10.1016/j.tree.2004.03.008
Rowcliffe, J. M., Field, J., Turvey, S. T., and Carbone, C. (2008). Estimating animal density using camera traps without the need for individual recognition. J. Appl. Ecol. 45, 1228–1236. doi: 10.1111/j.1365-2664.2008.01473.x
Saunders, W. C., Fausch, K. D., and White, G. C. (2011). Accurate estimation of salmonid abundance in small streams using nighttime removal electrofishing: an evaluation using marked fish. North Am. J. Fish. Manag. 31, 403–415. doi: 10.1080/02755947.2011.578526
Schaner, T., Fox, M. G., and Taraborelli, A. C. (2009). An inexpensive system for underwater video surveys of demersal fishes. J. Great Lakes Res. 35, 317–319. doi: 10.1016/j.jglr.2008.12.003
Schmidt, B. R., Kéry, M., Ursenbacher, S., Hyman, O. J., and Collins, J. P. (2013). Site occupancy models in the analysis of environmental DNA presence/absence surveys: a case study of an emerging amphibian pathogen. Methods Ecol. Evol. 4, 646–653. doi: 10.1111/2041-210X.12052
Skelton, P. (2001). A Complete Guide to the Freshwater Fishes of Southern Africa, 2nd Edn. Cape Town: Struik Publishers.
Skinner, M. A., Murdoch, M., Loeza-Quintana, T., Crookes, S., and Hanner, R. H. (2020). A mesocosm comparison of laboratory-based and on-site eDNA solutions for detection and quantification of striped bass (Morone saxatilis) in marine ecosystems. Environ. DNA. doi: 10.1002/edn3.61. [Epub ahead of print].
Smart, A. S., Weeks, A. R., van Rooyen, A. R., Moore, A., McCarthy, M. A., and Tingley, R. (2016). Assessing the cost-efficiency of environmental DNA sampling. Methods Ecol. Evol. 7, 1291–1298. doi: 10.1111/2041-210X.12598
Snyder, D. E. (2003). Invited overview: conclusions from a review of electrofishing and its harmful effects on fish. Rev. Fish Biol. Fish. 13, 445–453. doi: 10.1007/s11160-004-1095-9
Struthers, D. P., Danylchuk, A. J., Wilson, A. D. M., and Cooke, S. J. (2015). Action cameras: Bringing aquatic and fisheries research into view. Fisheries 40, 502–512. doi: 10.1080/03632415.2015.1082472
Sutter, M., and Kinziger, A. P. (2019). Rangewide tidewater goby occupancy survey using environmental DNA. Conserv. Genet. 20, 597–613. doi: 10.1007/s10592-019-01161-9
Taraborelli, A. C., Fox, M. G., Schaner, T., and Johnson, T. B. (2009). Density and habitat use by the round goby (Apollonia melanostoma) in the Bay of Quinte, Lake Ontario. J. Great Lakes Res. 35, 266–271. doi: 10.1016/j.jglr.2008.12.004
Thomas, A. C., Howard, J., Nguyen, P. L., Seimon, T. A., and Goldberg, C. S. (2018). ANDe TM : a fully integrated environmental DNA sampling system. Methods Ecol. Evol. 9, 1379–1385. doi: 10.1111/2041-210X.12994
Thomsen, P. F., Møller, P. R., Sigsgaard, E. E., Knudsen, S. W., Jørgensen, O. A., and Willerslev, E. (2016). Environmental DNA from seawater samples correlate with trawl catches of subarctic, deepwater fishes. PLoS ONE 11:e0165252. doi: 10.1371/journal.pone.0165252
Thomsen, P. F., and Willerslev, E. (2015). Environmental DNA – an emerging tool in conservation for monitoring past and present biodiversity. Biol. Conserv. 183, 4–18. doi: 10.1016/j.biocon.2014.11.019
Thurow, R. E., and Schill, D. J. (1996). Comparison of day snorkeling, night snorkeling, and electrofishing to estimate bull trout abundance and size structure in a second-order idaho stream. North Am. J. Fish. Manag. 16, 314–323. doi: 10.1577/1548-8675(1996)016<0314:CODSNS>2.3.CO;2
Thurow, R. F., Dolloff, C. A., and Marsden, J. E. (2012). “Visual observation of fishes and aquatic habitat,” in Fisheries Techniques, eds A. V. Zale, D. L. Parrish, and T. M. Sutton (Bethesda, MD: American Fisheries Society), 781–817.
Turner, C. R., Uy, K. L., and Everhart, R. C. (2015). Fish environmental DNA is more concentrated in aquatic sediments than surface water. Biol. Conserv. 183, 93–102. doi: 10.1016/j.biocon.2014.11.017
UNESCO (2015). Cape Floral Region Protected Areas - UNESCO World Heritage Centre. Available online at: https://whc.unesco.org/en/list/1007/ (accessed July 22, 2019).
Watson, D. L., Harvey, E. S., Fitzpatrick, B. M., Langlois, T. J., and Shedrawi, G. (2010). Assessing reef fish assemblage structure: how do different stereo-video techniques compare? Mar. Biol. 157, 1237–1250. doi: 10.1007/s00227-010-1404-x
Weyl, O. L. F., Ellender, B. R., Woodford, D. J., and Jordaan, M. S. (2013). Fish distributions in the Rondegat River, Cape Floristic Region, South Africa, and the immediate impact of rotenone treatment in an invaded reach. Afr. J. Aquat. Sci. 38, 201–209. doi: 10.2989/16085914.2012.753401
Wilcox, T. M., McKelvey, K. S., Young, M. K., Sepulveda, A. J., Shepard, B. B., Jane, S. F., et al. (2016). Understanding environmental DNA detection probabilities: a case study using a stream-dwelling char Salvelinus fontinalis. Biol. Conserv. 194, 209–216. doi: 10.1016/j.biocon.2015.12.023
Keywords: underwater cameras, snorkel surveys, eDNA, streams, endangered fishes, South Africa, detection probability
Citation: Castañeda RA, Van Nynatten A, Crookes S, Ellender BR, Heath DD, MacIsaac HJ, Mandrak NE and Weyl OLF (2020) Detecting Native Freshwater Fishes Using Novel Non-invasive Methods. Front. Environ. Sci. 8:29. doi: 10.3389/fenvs.2020.00029
Received: 15 December 2019; Accepted: 28 February 2020;
Published: 25 March 2020.
Edited by:
John Pascal Simaika, IHE Delft Institute for Water Education, NetherlandsReviewed by:
Teresa Ferreira, University of Lisbon, PortugalMarcos Callisto, Federal University of Minas Gerais, Brazil
Copyright © 2020 Castañeda, Van Nynatten, Crookes, Ellender, Heath, MacIsaac, Mandrak and Weyl. This is an open-access article distributed under the terms of the Creative Commons Attribution License (CC BY). The use, distribution or reproduction in other forums is permitted, provided the original author(s) and the copyright owner(s) are credited and that the original publication in this journal is cited, in accordance with accepted academic practice. No use, distribution or reproduction is permitted which does not comply with these terms.
*Correspondence: Rowshyra A. Castañeda, rowshyra.castaneda@mail.utoronto.ca