Multiscale Modeling and Experimental Characterization for Enhancement in Electrical, Mechanical, and Thermal Performances of Lithium-Ion Battery
 Snigdha Sharma
 Amrish K. Panwar2*
 - 1Department of Electrical Engineering, Delhi Technological University, New Delhi, India
- 2Department of Applied Physics, Delhi Technological University, New Delhi, India
Lithium-ion batteries are the thriving energy storage device in multiple fields, including automobiles, smart energy grids, and telecommunication. Due to its high complexity in the electrochemical–electrical–thermal system, there are certain non-linear spatiotemporal scales for measuring the performance of lithium-ion batteries. The fusion of experimental and modeling approaches was used in this study to enhance the performance of lithium-ion batteries. This article helps to evaluate the properties of the LiMn2O4 cathode material for Li-ion batteries and also characterize the crystalline nature, morphological structure, and ionic and electronic conductivity of the electrode material using an experimental approach. In addition, a new computational model was designed and formulated to support various other models for computational investigation. This simulation was designed to analyze the one-dimensional structure of coin cell batteries and to evaluate electrochemical and thermal performances. All computational performances have been validated with the help of experimental techniques and also provide multiple benchmarks for future integration of experimental and computational approaches.
Introduction
The limitations of traditional devices draw more focus to energy storage devices. Additionally, energy storage devices are high priority in response to the growing need for clean energy and a viable environment. But, because of their multiple benefits, they attract us or force us to include them in our daily life such as eco-friendly, long cycle life, high specific energy, and high power density. Among multiple energy storage devices, lithium-ion batteries (LIBs) are the most attractive energy storage devices in the booming market today. Recently, industries need excess energy from Li-ion batteries, and the power density requirement is 2000 W/Kg. But the currently existing power density derived from batteries is 500 W/kg (Chen et al., 2010). However, in the realm of LIBs, several simulation and experimental studies have been developed to surmount the dearth of lithium-ion batteries and make them safe and trustworthy.
The evolution of lithium-ion batteries commenced in the 1970s (Arora et al., 2000). The first lithium-ion battery was marketed with a coke-based anode electrode, and then, graphite was adopted as the anode material in the mid-1990s. Similarly, cathode materials for lithium-ion batteries have also been used, which incorporated different materials with different structural types such as layered (Li-cobalt oxide (LiCoO2)), spinel, olivine, or a tunneled structure known as Li-manganese oxide (LiMnO2) (Marincas et al., 2020). However, a fundamental limitation of a lithium-ion battery is its expensive cost, and excessive charging or heating beyond 100°C leads to the breakdown of the cathode material and the electrolyte, resulting in the release of detrimental gases (Xia et al., 2015). Due to this, further focused research would be needed to develop an efficient battery. Multiple kinds of cathode materials for LIBs were found by numerous researchers, resulting in a substantial breakthrough in the battery field. Various metal oxide compounds have been in high demand as the cathode material for Li-ion batteries such as LiCoO2, LiNiO2, LiFePO4, and LiMn2O4 (Kim et al., 2020). Sony introduced the first commercially accessible cathode material in 1991 using LiCoO2 because of its high theoretical capacity. Both LiCoO2 and LiNiO2 have high theoretical capacities of 274 mAh/g and 275 mAh/g, respectively (Rewatkar and Shende, 2020). However, when LiCoO2 is used in practice, its actual capacity is reduced by half owing to several drawbacks. Although LiNiO2 (LNO) was treated as an alternative option because LNO has a higher theoretical capacity than LiCoO2, that is, 275 mAh/g, and also has a plethora of raw materials. Later, this also had certain limitations in terms of electrochemical performance, revealing structural instability, and lithium diffusion pathways using Ni3+ were also impeded (Qin et al., 2020). As a result, LiNiO2 disappeared due to instability, the market was conquered by LiFePO4 (LFP), and LFP was used in portable devices and hybrid electric vehicles (Chakraborty et al., 2020). Hence, LFP has been declared as a suitable cathode electrode material for today’s Li-ion batteries due to its miscellaneous advantages such as good theoretical capacity, that is, 170 mAh/g; strong thermal stability; good cycle life; and adequate raw materials (Baena–Moreno et al., 2019). Unfortunately, when it comes to electrical and ionic conductivity, researchers were once again disappointed due to the slow kinetics. However, after doing austere research, researchers came to a conclusion regarding all these cathode materials: LiMn2O4 cathode material was chosen due to its three-dimensional spinel phase structure and its high theoretical capacity, that is, 148 mAh/g (Marincas and Ilea, 2021). LMO has multiple benefits over other cathode materials, including low manufacturing costs, environmental friendliness, simple synthesis procedures, high rate capacity, and low internal resistance (Fergus, 2010). However, the primary shortcoming of LMO is low practical capacity, that is, 135 mAh/g for the pure sample (Fergus, 2010), while under certain synthesis conditions, a capacity of 146 mAh/g can be reached (Lee et al., 2020).
Many researchers have frequently attempted to increase the performance of LMO in this area because voltage and capacity of the battery play a major role in the battery area. Therefore, cathode materials have become one of the most evolved and concentrated fields of LIBs (Chakraborty et al., 2020). Although there are numerous additional factors to consider, some factors such as cycle life, stability, rate capability, safety, and cost need to be weighed. If the synchronization in the LIBs were not matched regarding voltage, current, or any other factor, then severe local thermal excursions and catastrophic failures such as the short circuit in the LIBs could result. Considering that LIBs relied on intercalation processes incorporating mobile cations into a host structure of electrodes, this can represent the complex option for material and its chemistry. Therefore, the inclusion of computational technique was important to have a modeling and simulation capability that facilitates to anticipate performance, develop and corroborate experimental techniques to optimize material components and geometries, and holistically evaluate safety and durability (Pannala et al., 2015).
Multiple authors have developed several theoretical approaches to optimize the Li-ion diffusion problems in LIB electrode material (Dai et al., 2018). Electronic structure methods were simulated to analyze the atomistic structures and attributes, providing essential insight into the atomistic and electronic processes that helps to determine the energy and power densities, as well as structural integrity (Ceder et al., 2002). Defect deformation and evolution in the material have been studied using classical force field methods to improve the dynamics and structure of materials (Karo and Brandell, 2009; Tasaki and Harris, 2010). The electrochemical performance of LIBs has also been analyzed using the kinetic Monte Carlo (KMC) model (Li et al., 2007). Various other models at micro- and macroscopic levels have been simulated to understand the movement of ions and species in the cell/electrode planes under varying spatiotemporal fields (Guyer et al., 2004; Pongsaksawad et al., 2007). However, other issues in the LIBs remain unresolved. As a result, researchers are turning their attention to battery modeling and simulation using various pieces of software to advance the field of LIBs at minimal cost. For in-depth analysis and security prospects, integration with the computational approach is beneficial because it reduces both the effort and the error of experimental trials. Therefore, battery modeling is an efficient technique to optimize battery performance (Hofmann et al., 2020). In general, to account for cell performance, battery simulations have largely relied on simplified unit cell models (e.g., 1-D and pseudo-2D) and equivalent circuit models, neglecting the underlying electrochemical and thermal cell-to-cell coupling process (Powell and Pongsaksawad, 2007). Hence, an integrated approach to simulating lithium-ion batteries can be used by researchers to work with various internal cell performances problems (Wang et al., 1998).
In this study, the integration of experimental and simulation approaches was developed to evaluate the performance of LIBs. This can be further illustrated in the following:
• Using experimental and computational methods, the LiMn2O4 cathode material was fully investigated in this study.
• In an experimental approach, synthesis was performed to examine structural and morphological qualities. Thermogravimetric and electrical conductivity tests were also carried out to determine the thermal and electrical capabilities of the material.
• Fourier transform infrared spectroscopy (FTIR) was used to probe the functional group of the LMO material and to observe the movement of cations using vibrational modes in different domains.
• In addition, the results of experimental techniques such as the internal structure of the material, the pore size of the electrode, and the thickness of the electrode were used in modeling and simulation to develop the geometry of the LIBs.
• A one-dimensional electrochemical model was developed and simulated to evaluate the electrochemical performance of the LiMn2O4 battery. In this model, five different control parameters were used to analyze the battery’s internal performance for characterization by electrochemical impedance spectroscopy (EIS).
• In addition, to better understand the electrochemical behavior of the LIBs, a comparative study was conducted, from which experimental and simulated Nyquist spectra were obtained. In this Nyquist spectrum, the global least-squares method was used to simulate and analyze five different control parameters.
• The charge and discharge characterization at different C-rates was simulated in a 1-D electrochemical model to evaluate the performance of the LMO cathode at various C-rates.
• Thermal analysis of the battery pack at different temperatures was tested on a 3-D model to evaluate safety performance.
The main aim of this study was to use experimental and computational methodologies to investigate the performance of the LMO cathode material. The structural, morphological, thermal, and electrical properties of the synthesized spinel LMO material were investigated using an experimental technique. Based on a computational analysis, the electrochemical characterization was examined, and a comparative study of the Nyquist curve was also carried out. To study the internal behavior of the battery, five different control parameters were used to analyze the Nyquist curve, and charge and discharge characteristics at various C-rates were also plotted. Sections 2 and 3 briefly describe the experimental technique and also the analysis of the performance of the LMO material. In sections 4 and 5, the computational technique is worked out, and the behavior of the LMO cell is explained through a comparative analysis. A brief discussion of the performance of LMO material is provided in section 6. The conclusion of this article is given in the last section.
Experimental Study
Material Synthesis
The spinel LiMn2O4 sample was synthesized using lithium (Li)- and manganese (Mn)-based reagents in a 1:2 stoichiometric ratio. Lithium acetate, manganese acetate tetrahydrate, and citric acid were employed as precursors in this sol-gel method. All reagents were dispersed in deionized water and stirred constantly. After continuous stirring, the pH of the sample was maintained. The pH value of the resultant sample was maintained between 6 and 7 after vigorous stirring. The resultant mixture was then stirred constantly at 350 rpm at 70°C until it turned into a translucent gel. The obtained gel was then heated to 180°C in a vacuum oven to obtain a powdery sample. This pulverized sample was subsequently calcined in two steps: First, the compound decomposition was calcined at 350°C for 6 h. Second, the final phase formation calcination was carried out at 775°C for 20 h in the muffle furnace. After cooling, the calcined sample was ground again, using a mortar and pestle, and the LiMn2O4 sample was abbreviated as LMO.
Material Characterization
The synthesized LMO sample was investigated for phase analysis using a RIGAKU X-ray diffractometer (XRD) with λ = 1.540°A. The XRD data were plotted between the angular ranges from 10° to 70°, with a step size of 0.02. The morphological characterization of the LMO sample was obtained using a scanning electron microscope (SEM) operated at 15 kV. In addition, the thermal stability of the LMO sample was analyzed using thermogravimetric analysis (TGA, SII Exostar) in the O2 atmosphere with a heating rate of 5°C min−1. Then, the crystal bonding of the LMO sample was also examined by Fourier transform infrared spectroscopy (FTIR) in the range of 4,500-400 cm−1, and a pellet was prepared using KBr as a binder to test the pulverized sample. Similarly, to determine the electrical conductivity of the LMO sample, the pellet was prepared by mixing 2.5% PVC (polyvinyl alcohol) and then annealing at 250°C for 3 h. After drying the pellet, a silver paste was coated on both sides of the surface to make the pellet conductive and then dried at 150°C for half an hour. The dried pellet was then placed on a two-point probe assembly to measure the electronic conductivity of the LMO sample using the KEITHLEY 6517A electrometer at high resistance and a variable frequency range of 20 Hz to 1 mHz.
The electronic conductivity (σDC) in Scm−1 was calculated using the standard Eq. 1, and I-V was also plotted on the source measurement unit.
where L is the thickness of the pellet in cm, A is the cross-sectional area of the pellet in cm2, and R is the resistance of the sample in Ω (ohms).
Furthermore, the electronic conductivity of the sample was used in the calculation of activation energy (Ea) in eV using Arrhenius Eq. 2:
where KB is the Boltzmann constant in J.K−1 and T is the temperature in Kelvin (K).
However, the AC conductivity of the sample was evaluated with a bias voltage of 1.0 V, and the frequency range was also kept between 20 Hz and 1 MHz.
Experimental Results
Thermogravimetric Analysis
The thermogravimetric analysis (TGA) was performed to analyze the thermal properties of the sample and also to obtain the decomposition temperature at a variable atmosphere. The LiMn2O4 sample was characterized by the variation in a mass loss at different temperatures, as shown in Figure 1. The obtained TGA curve represents the two main losses shown in the red solid line. The first loss was shown between the temperature range of 150°C and 235°C (∆m = 5.36%). This calculated mass loss was due to the endothermic reaction caused by decomposition or evaporation of physically absorbed moisture and also by organic or oxalate compounds in the sample released by dehydration of the precursor. The second mass loss was the main loss associated with a 55.49% mass loss in the temperature range of 235°C to 635°C, as shown in Figure 1, which corresponds to the decomposition of all the starting materials such as lithium acetate and manganese acetate. After that, mixed phases of MnO2 and Mn2O3 formed and started to decompose in a stable range (Helan and Berchmans, 2011). In this second region, a pure LMO formed by a synergistic impact of three different compounds MnO2, Mn2O3, and Li2CO3 through phase transformation and carbon decomposition in the compound (Fadzil et al., 2017). Therefore, the sample calcination was carried out in two stages: First, the sample was calcined at 350°C for 6 h to decompose the organic compound, and the second calcination was carried out at a temperature of 775°C for 20 h to obtain the proper phase and morphology in the LMO sample.
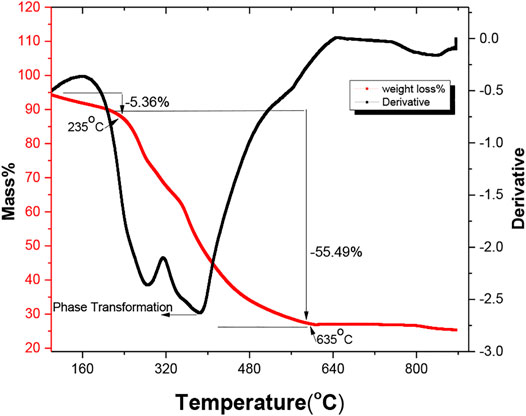
FIGURE 1. Thermogravimetric analysis of the synthesized LMO sample.
Structural and Morphological Characterization
The XRD analysis was performed to determine the crystallinity of the sample. Figure 2 demonstrates the XRD pattern for the LMO sample where sharp peaks reflect the crystalline sample. The peak positions also help determine the spinel phase and the cubic structure with the pnma space group of LiMn2O4 and also help evaluate the lattice parameters using the standard files (JCPDS 00-035-0782). There were certain other parameters of the LMO sample that were evaluated using the XRD pattern, as shown in Table 1. The lattice parameter for the synthesized sample was 4.779 Å, and the volume of the cubic cell was 109.14 Å3. Furthermore, the Williamson–Hall plot was used to evaluate the influence of the broadening the peak (βT).
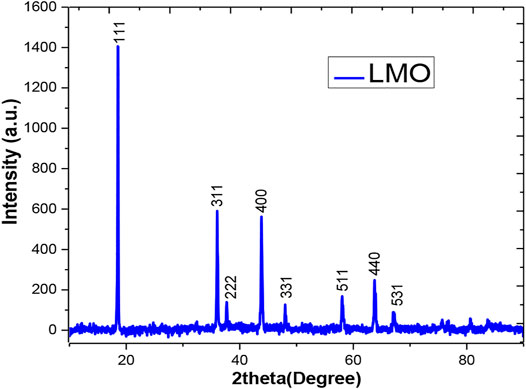
FIGURE 2. XRD pattern of the synthesized LMO sample.
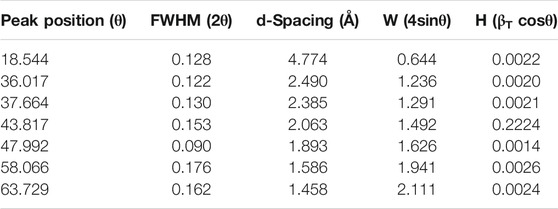
TABLE 1. XRD parameters of the as-synthesized sample.
The broadening of the peaks was analyzed to determine the combined influence of crystallite size and the micro-strain. Therefore, the W-H plot was used to calculate the strain and crystallite size. The slope of the W-H plot was 2.039 × 10⁻⁴, shown as loading on the broadening peaks. The grain size of the synthesized sample was 72 nm, which was calculated using the Scherer equation. After structural analysis, morphological analysis was performed using a scanning electron microscope (SEM). The SEM image of the synthesized sample is shown in Figure 3 which depicts the smaller spherical-shaped grains, and also the average grain size of the LMO sample was calculated by ImageJ software, with size ranging from 8 to 10 µm.
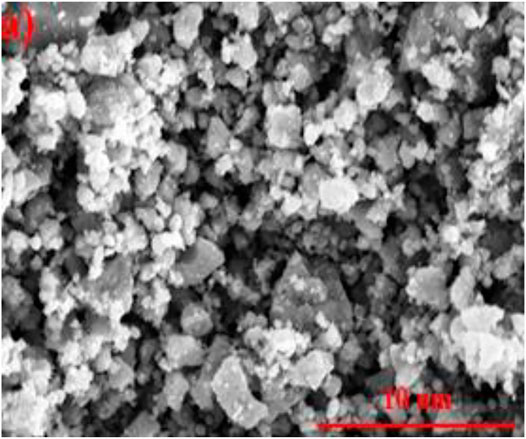
FIGURE 3. SEM image of the synthesized LMO sample.
Fourier Transform Infrared Spectroscopy Characterization
Fourier transform infrared spectroscopy (FTIR) reveals the functional group of the organic compound and also exhibits the movement of cations with the aid of vibrational modes. In Figure 4, the FTIR spectrum of the LMO sample represents the four bands in which three bands show strong peaks. The three strong bands/peaks in the spectrum were observed at 3,426, 614, and 524 cm−1 in different regions. In the first region, the peak was between 4,000 and 2,500 cm−1 at 3,426 cm−1 and was reflected due to the absorption of single C–H and O–H bonds in the sample, while in the second region, the two peaks were located in the range of 2,500 to 1,000 cm−1 at 1,628 and 1,378 cm−1, reflecting the weak peaks which associated the C–O and O–H bonds most likely to water bonds and Mn–O bonds at 1,089 cm−1 vibrational frequency (Ali et al., 2020). This high frequency is associated with the asymmetric stretching modes of the MnO6 group (Hasham et al., 2019; Ali et al., 2020). In the third region, the strong peaks were lying in the vibrational range between 1,000 and 400 cm−1 at 614 and 524 cm−1, and both the peaks were associated due to the transition metals and also stretches relate the Mn4+–O and Mn3+–O, respectively (Chiovoloni et al., 2017) The peaks that appeared below 400 cm−1 in the characteristics determine the alkali metals in the octahedral sites in the sample (LMO).
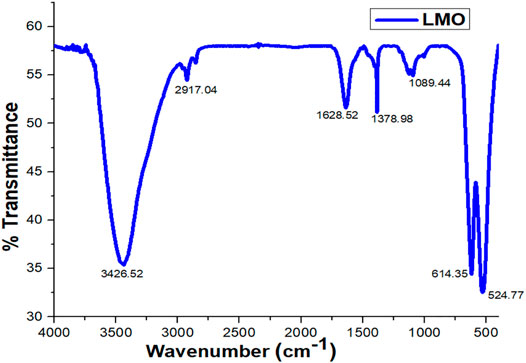
FIGURE 4. FTIR spectrum of the synthesized LMO sample.
Electrical Characterization
The electrical characterization of the synthesized sample (LMO) was evaluated using ionic conductivity measurements. This characterization also contributed to the evaluation of the activation energy of the LMO sample. In Figure 5, the ionic conductivity curve of the LMO sample was determined using the KEITHLEY 6517A high resistance electrometer. This plot reflects the direct measurement of the activation energy while calculating the slope of the straight line and also represents the kinetics of lithium ions. The calculated activation energy of the synthesized LMO sample was 401.94 meV, and the electronic conductivity was 4.42 × 10⁻⁸ S/cm. These calculated parameters reflect the LMO sample as a good conductor and also specify a conductive material that shows good properties in lithium-ion batteries.
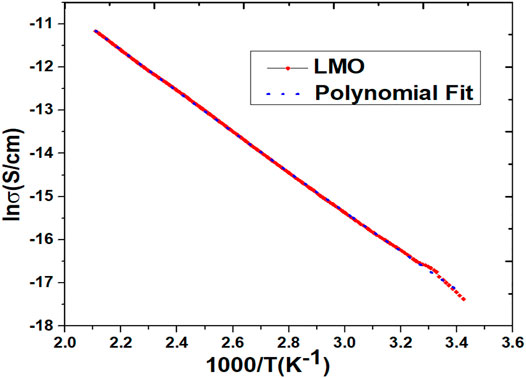
FIGURE 5. Ionic conductivity measurement of the synthesized LMO sample.
Electrochemical Characterization
In this characterization, the electrochemical impedance spectroscopy (EIS) readings of the LMO material were plotted for validation and comparison of simulation results. This curve was plotted as a reference to simulate the internal parameters and to develop and control the other internal parameters for the enhancement in simulated results. This EIS curve was plotted within the frequency range of 20 Hz to 1 MHz with a 5 mV AC pulse to determine the AC impedance of the synthesized sample. In Figure 6, the semi-circle was intercepted on the z-axis to determine the AC resistance of the LMO material. The AC resistance was 59.65 ohm, and the AC conductivity of the sample was also observed, that is, 1.8*10−6 S/cm using the diffusion coefficient.
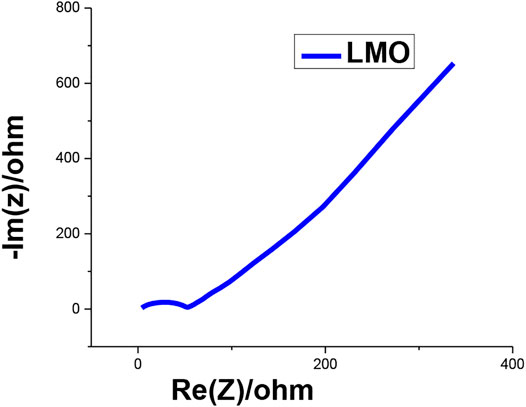
FIGURE 6. EIS characterization of the synthesized LMO sample.
Computational Approach
The computational technique is the most prominent and easy technique to reduce the safety risk and the experimental cost of the lithium-ion battery. The Li-ion batteries have high safety risks due to their liquid electrolytes, which caused an explosion in the atmosphere during abnormal situations. Therefore, the optimization of the characteristics of the lithium-ion battery modeling and simulation was performed by Multiphysics software. This software helps to determine the electrochemical characterization technique of the solid-state lithium battery.
Battery Modeling
The schematic 1-D electrochemical model was designed for an all-solid-state lithium-ion battery (Liu and Hui, 2007; Liu et al., 2020b). This model was formulated in 1-D with three variable thickness domains, as demonstrated in Figure 7. In this model, the double-layer capacitance was taken on the active electrode and the electronic conductor on the positive electrode. Furthermore, the additional double layer on the electronic conductor was considered to describe the electrochemical impedance spectra (EIS) between the 1 mHz and 1 kHz frequency range on the LMO electrode (Darling and Newman, 1998).
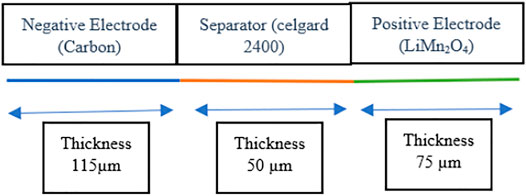
FIGURE 7. One-dimensional schematic model of solid-state lithium-ion battery.
The simulation model was validated using an experimental setup (Hasnain, 1998; Liu et al., 2020a). In this model, the comparative study of EIS spectra between experimental and simulation data was plotted. The optimization was performed using the global least-squares method (Zhang et al., 2020). This method was used to minimize the error between simulated and measured LMO impedance. There is a certain variable parameter that needs to be controlled with a cell voltage of 3.10 V. The control parameters are listed in Table 2.
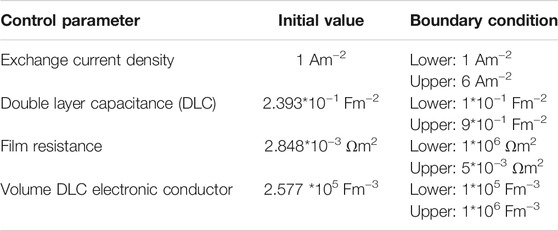
TABLE 2. Control parameters with a cell voltage of 3.10 V
After choosing control parameters with narrowly limited intervals, the optimization accuracy was improved and the optimization time shortened (Sangros Gimenez et al., 2020). Furthermore, the SNOPT method with a numerical gradient was used to study the optimization solver and also added the optimization node to study the steady-state AC impedance (Raijmakers et al., 2020).
The battery pack model was computed for 3-D thermal analysis during a 4C discharge. This pack was simulated by first coupling two cylindrical batteries in parallel, and six parallel-connected pairs were in series to create a full battery pack. This type of battery pack has been widely used for portable devices.
In this pack, three instances of the lumped battery interfaces were used to create the appropriate heat sources, which were further coupled to the heat transfer interface in a 3-D geometry. All the geometrical and internal and external parameters of the battery pack are illustrated in Table 3.
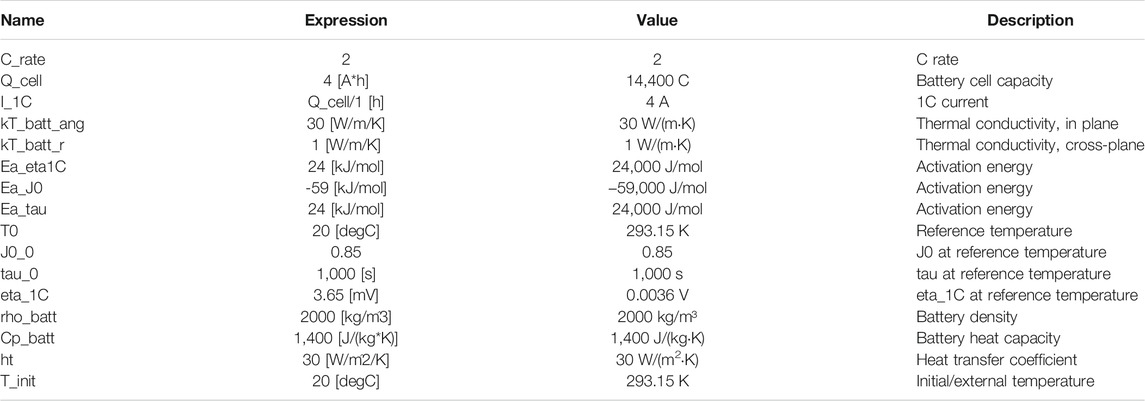
TABLE 3. Geometrical and internal battery parameters of the simulated battery pack.
Mathematical Pseudo-Two-Dimensional Modeling
The electrochemical model of solid-state lithium-ion batteries was formulated with the help of governing equations and certain boundary conditions. To evaluate the steady-state AC impedance study, some variables need to be shifted from time-dependent to frequency-dependent as given in Eq. 3.
where n denotes the variable and 0 subscript denotes the initial value at which perturbation occurs, I denote the imaginary unit, f denotes the frequency in Hz, and t is for time (Liu et al., 2020).
The electrochemical reactions of the positive and Πnegative electrodes were represented using the Butler–Volmer kinetic Eq. 4.
Describing all the variables with their standard norms and this equation can be described in linear form due to small perturbations (Liu and Hui, 2007).
Initially, a sinusoidal perturbation was set at the boundary of the positive electrode current collector with an amplitude of 10mV and grounded at the negative electrode current collector with 0V, while the total impedance (Z- Ω.m2) of the cell was measured at the boundary of the positive electrode current collector as shown in Eq. 5.
where
In addition, this model was calculated in a frequency range from 10 mHz to 1 kHz in order to minimize the EIS errors. Therefore, a model was designed to include all necessary parameters and satisfy all boundary conditions to obtain the EIS spectra (Liu et al., 2020 and Sharma et al., 2021).
Computational Results
In this study, the comparison of experimental and simulation results of Nyquist spectra was investigated, and the impedance of the positive electrode LMO was the main concern. This can be characterized to explain the electrochemical behavior of positive-electrode LMO, which plays an important role in the solid-state battery. In addition, the state of charge (SOC) and state of discharge characterization (SOD) of LMO material at various C-rates were discussed.
Electrochemical Characterization
The simulated results were obtained in the form of Nyquist spectra. In these spectra, real and imaginary components of EIS were obtained, which were used to investigate the mass transport, capacitive, and kinetic properties of the battery. The Nyquist plot was plotted between the real and imaginary components with a pulse magnitude of 20 mV AC to obtain the experimental and simulated impedance spectra in the LMO positive-electrode, as shown in Figure 7.
In this plot, the “ref” is represented as the reference point probe which was placed in the center of the separator to retrieve the potential (Liu et al., 2020). The simulation results show that the cell impedance and a referenced positive electrode LMO have a large semi-circle, as shown in Figure 8, with dark blue and green solid lines, respectively, while the experimental spectra of referenced LMO have a smaller semi-circle represented as a light blue solid line. The semi-circle represents the value of the charge transfer resistance (Rct) of the whole-cell impedance, a positive electrode (LMO), a negative electrode (carbon), and the experimental impedance of LMO, which are 2.2 × 10⁻³ Ω-m2, 1.55 × 10⁻³ Ω-m2, 0.8 × 10⁻³ Ω-m2, and 1.22 × 10⁻³ Ω-m2, respectively. This plot shows the difference in charge transfer resistance of both the experimental and simulated curves, and this difference was most evident in the experiments due to the short scale process. Therefore, to overcome this difference, the four control parameters were plotted using a parametric sweep to compare experimental and simulation plots. The parametric sweep was used to study the control parameters and also to determine their influence on the cell impedance. Figure 9 shows the Nyquist spectra for testing the control parameters in a frequency range of 10 mHz to 1 kHz. This result shows that there was a change in the charge transfer resistance (Rct) from both experimental and simulated spectra of positive electrode LMO. The Rct value of the positive electrode LMO in the experiment and in the simulation was 1.29 × 10⁻³ Ωm2 and 1.6 × 10⁻³ Ωm2, respectively. This value of charge transfer resistance shows a long-timescale diffusion process in the particles. Its effect is therefore more evident in the lower frequency regions.
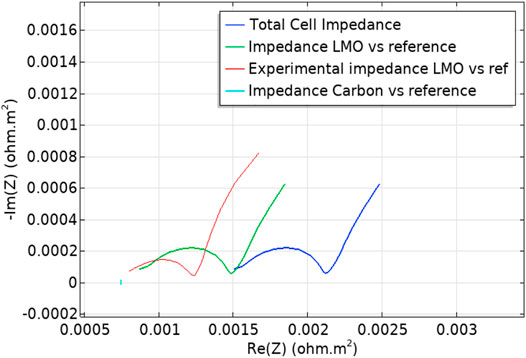
FIGURE 8. Nyquist spectra curve.

FIGURE 9. Nyquist spectra for testing five control parameters at 10 MHz to 1 kHz frequency.
Therefore, after the parametric sweep function, the LMO positive electrode has greater electronic conductivity. It is also clear from the simulation that the electrochemical reaction was also confined to their electrodes. This mainly depends on the other control parameters due to which the overall cell impedance has been affected. Furthermore, in order to improve electronic conductivity and reduce cell impedance, the other parameters should be appropriately controlled.
State of Charge and State of Discharge Characterization
The LMO material was further characterized to evaluate the SOC and SOD characteristics of the synthesized material using a computational approach. A 2-D electrochemical model was simulated to understand the rate capability behavior of the battery. During this phenomenon, the battery was initially discharged from its charged state and then fully charged from its discharged state at various C-rates. However, the discharge characteristics of LMO material are shown in Figure 9 at several C-rates including 0.01, 0.1, 0.5, 1, 2, 5, 10 C, and open circuit.
Figure 10 shows the LMO discharge curve, which shows the discharge capacity of the battery and also shows that the battery capacity reached 89% in the no-load test. With this method, as the load current progressively increases relative to the C-rates, the voltage drop across the battery also increases. Therefore, in this graph, the load current was increased at a rate of 10 C, and the battery capacity was increased up to 88% of its full capacity.
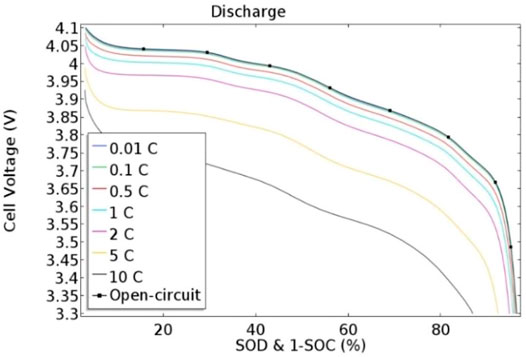
FIGURE 10. State of discharge (SOD) characteristics at various c-rates.
The SOC of the lithium-ion battery was also simulated, and it was found that the battery’s charged capacity was lower than the discharged capacity. The reason for this is that both the medium to high current loading of the electrode active material and the cell voltage of the battery are within the stability window of the electrolyte. The SOC of the LMO material at various C-rates is shown in Figure 11. Although the charge capacity was lower than the discharge capacity, polarization was noticed in the discharge curve, which was on the same plateau at 3.2 V. It is evident that the LMO charge curve was stable during the oxidation and reduction processes.

FIGURE 11. State of charge (SOC) characteristics at various c-rates.
Thermal Characterization
The temperature profile was modeled using a heat transfer interface, where the heat sources stemmed from the battery models by using electrochemical heating Multiphysics nodes. Convection in the air-filled domain enclosing the batteries has been neglected, assuming quiescent conditions. The outer boundaries of the pack were cooled using convective cooling conditions. The battery pack was discharged from 100 to 20% state of charge at a rate of 4 C for 12 min.
Figure 12 shows the temperature distribution of the battery pack as the color code distribution represents the blue color as higher and the red color as a lower temperature. The inner part of the battery pack was about 2°C higher than the outermost part of the battery pack. The outermost cell of the battery pack had a slightly lower discharge voltage and also the ohmic drop and exchange current density were slightly lower, while the diffusion time constant for the lower temperature was slightly higher.
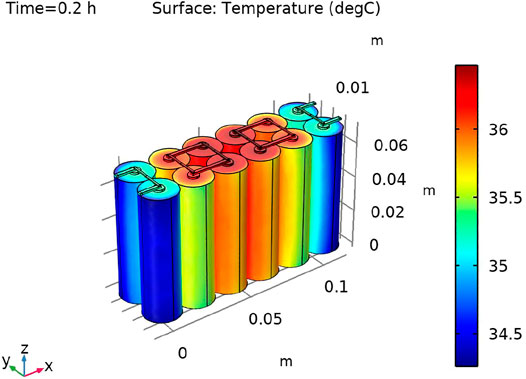
FIGURE 12. Temperature distribution in the battery pack.
Discussion
The primary goal of these experimental and computational techniques was to examine the performance of the LMO cathode material. The LMO material was found to be crystalline using this experimental approach. The thermogravimetric and electrical tests demonstrated that the crystalline LMO material has strong thermal stability and good conductivity. In addition, the computational approach also represented the stable electrochemical performance of the LMO material. In the Nyquist curve, the semi-circle demonstrates the stable behavior of the LMO material and the state of charge; and the discharge characteristics show the proper oxidation and reduction behavior of the battery, in which the rate capability during discharge was 88% of its full capacity. The charging characteristics also show stability during the change in load current from the lower range to the higher range. The thermal analysis was evaluated on a battery pack in which the temperature distribution in the inner central part was uniform.
Conclusion
This study helps to evaluate the properties of the LiMn2O4 cathode material for lithium-ion batteries by integrating experimental and simulated characterization. In this research work, the experimental characterization of the LMO material was first performed after the material was synthesized using the sol-gel method. The XRD results examined the crystallinity and revealed the cubic structure of the LMO material. The SEM characterization demonstrates the spherical morphology and the 8–10 µm grains size of the LMO material. The electrical characterization evaluates better electronic conductivity and the activation energy with low AC resistance. Second, the computational approach to analyze the internal parameters of the LMO material was developed. The electrochemical simulation results reveal that the impedance of the cell was majorly dependent upon the positive electrode and on the control parameters that cause the difference in the impedance curves. However, the state of charge and discharge characteristics have showed that the LMO material was stable at a high C-rate and also thermal distribution was balanced throughout the pack.
Data Availability Statement
The original contributions presented in the study are included in the article/Supplementary Materials, further inquiries can be directed to the corresponding authors.
Author Contributions
All authors listed have made a substantial, direct, and intellectual contribution to the work and approved it for publication.
Conflict of Interest
The authors declare that the research was conducted in the absence of any commercial or financial relationships that could be construed as a potential conflict of interest.
Publisher’s Note
All claims expressed in this article are solely those of the authors and do not necessarily represent those of their affiliated organizations, or those of the publisher, the editors, and the reviewers. Any product that may be evaluated in this article, or claim that may be made by its manufacturer, is not guaranteed or endorsed by the publisher.
Acknowledgments
All the authors are thankful to Delhi Technological University for providing research assistance through the LIBT Lab, Department of Applied Physics, DTU, New Delhi, for providing support to carry out this research work.
References
Ali, K., Raza, H. A., Malik, M. I., Shamsah, S. I., Amna, R., and Sarfraz, A. (2020). Effect of LiMn2O4, Nanofibers of LiMn2O4, and Graphene/Polyaniline/Carbon Nanotube as Electrode Materials in the Fuel Cell. J. New Mater. Electrochem. Syst. 23, 37–42. doi:10.14447/jnmes.v231l.907
Arora, P., Doyle, M., Gozdz, A. S., White, R. E., and Newman, J. (2000). Comparison between Computer Simulations and Experimental Data for High-Rate Discharges of Plastic Lithium-Ion Batteries. J. Power Sourc. 88 (2), 219–231. doi:10.1016/s0378-7753(99)00527-3
Baena-Moreno, F. M., Rodríguez-Galán, M., Vega, F., Alonso-Fariñas, B., Vilches Arenas, L. F., and Navarrete, B. (2019). Carbon Capture and Utilization Technologies: A Literature Review and Recent Advances. Energy Sourc. A: Recovery Util. Environ. Eff. 41 (12), 1403–1433. doi:10.1080/15567036.2018.1548518
Ceder, G., Doyle, M., Arora, P., and Fuentes, Y. (2002). Computational Modeling and Simulation for Rechargeable Batteries. MRS Bull. 27, 619–623. doi:10.1557/mrs2002.198
Chakraborty, A., Kunnikuruvan, S., Kumar, S., Markovsky, B., Aurbach, D., Dixit, M., et al. (2020). Layered Cathode Materials for Lithium-Ion Batteries: Review of Computational Studies on LiNi1-x-yCOxAlyO2. Chem. Mater. 32 (3), 915–952. doi:10.1021/acs.chemmater.9b04066
Chen, Y.-H., Wang, C.-W., Zhang, X., and Sastry, A. M. (2010). Porous Cathode Optimization for Lithium Cells: Ionic and Electronic Conductivity, Capacity, and Selection of Materials. J. Power Sourc. 195 (9), 2851–2862. doi:10.1016/j.jpowsour.2009.11.044
Chiovoloni, S., Moran, C., LeMaire, P. K., and Singhal, R. (2017). Optimization of Synthesis Conditions of LiMn2-xFexO4 Cathode Materials Based on Thermal Characterizations. Am. J. Anal. Chem. 08, 51–59. doi:10.4236/ajac.2017.81004
Dai, M., Huo, C., Zhang, Q., Khan, K., Zhang, X., and Shen, C. (2018). Electrochemical Mechanism and Structure Simulation of 2D Lithium-Ion Battery. Adv. Theor. Simul. 1 (10), 1800023. doi:10.1002/adts.201800023
Darling, R., and Newman, J. (1998). Erratum: Modeling a Porous Intercalation Electrode with Two Characteristics Particle Sizes. J. Electrochem. Soc. 144 (12), 4201. doi:10.1149./1.1838166
Fadzil, A. F. M., Bustam, M. A., and Aziz, N. D. A. (2017). Characterization of Doped LiMn2O4 Powder Prepared by the Sol-Gel Method: Thermal Analysis and XRD Studies. AIP Conf. Proceeding 1877, 040006. doi:10.1063/1.4999872
Fergus, J. W. (2010). Recent Developments in Cathode Materials for Lithium Ion Batteries. J. Power Sourc. 195 (4), 939–954. doi:10.1016/j.jpowsour.2009.08.089
Guyer, J. E., Boettinger, W. J., Warren, J. A., and Mcfadden, G. B. (2004). Phase Field Modeling of Electrochemistry. I. Equilibrium. Phys. Rev. E Stat. Nonlin Soft Matter Phys. 69 (2), 021603. doi:10.1103/PhysRevE.69.021603
Hasham, A. M., Abbas, S. M., Hou, X., Eid, A. E., and Abdel-Ghang, A. E. (2019). A Facile One-Step Synthesis Method of Spinel LiMn2O4 Cathode Material for Lithium Batteries. J. Heliyon 5 (7), e02027. doi:10.1016/J.heliyon.2019.e02027
Hasnain, S. M. (1998). Review on Sustainable Thermal Energy Storage Technologies, Part I: Heat Storage Materials and Techniques. Energ. Convers. Manage. 39 (11), 1127–1138. doi:10.1016/S0196-8904(98)00025-9
Helan, M., and Berchmans, L. J. (2011). Low-Temperature Synthesis of Lithium Manganese Oxide Using LiCl-Li2CO3 and Manganese Acetate Eutectic Mixture. Mater. Manufacturing Process. 26, 1369–1373. doi:10.1080/10426914.2010.536932
Hofmann, T., Westhoff, D., Feinauer, J., Andrä, H., Zausch, J., Schmidt, V., et al. (2020). Electro-Chemo-Mechanical Simulation for Lithium Ion Batteries across the Scales. Int. J. Sol. Structures 184, 24–39. doi:10.1016/j.ijsolstr.2019.05.002
Karo, J., and Brandell, D. (2009). A Molecular Dynamics Study of the Influence of Side-Chain Length and Spacing on Lithium Mobility in Non-Crystalline LiPF6.PEOx; x=10 and 30. J. solid-state Ionics 180 (23-25), 1272–1284. doi:10.1016/j.ssi.2009.07.009
Kim, H.-J., Krishna, T., Zeb, K., Rajangam, V., Gopi, C. V. V. M., Sambasivam, S., et al. (2020). A Comprehensive Review of Li-Ion Battery Materials and Their Recycling Techniques. Electronics 9 (7), 1161. doi:10.3390/electronics9071161
Lee, W., Muhammad, S., Sergey, C., Lee, H., Yoon, J., Kang, Y. M., et al. (2020). Advances in the Cathode Materials for Lithium Rechargeable Batteries. Angew. Chem. Int. Ed. 59 (7), 2578–2605. doi:10.1002/anie.201902359
Li, X., Drews, T. O., Rusli, E., Xue, F., He, Y., Braatz, R., et al. (2007). Effect of Additives on Shape Evolution during Electrodeposition: I. Multiscale Simulation with Dynamically Coupled Kinetic Monte Carlo and Moving-Boundary Finite-Volume Codes. J. Electrochem. Soc. 154 (4), D230–D240. doi:10.1149/1.2434686
Li, X. (2015). Modeling and Simulation Study of a Metal Free Organic-Inorganic Aqueous Flow Battery with Flow through Electrode. Electrochimica Acta 170, 98–109. doi:10.1016/j.electacta.2015.04.075
Liu, S., Liu, X., Dou, R., Zhou, W., Wen, Z., and Liu, L. (2020a). Experimental and Simulation Study on thermal Characteristics of 18,650 Lithium-Iron-Phosphate Battery with and without Spot-Welding Tabs. Appl. Therm. Eng. 166, 114648. doi:10.1016/j.applthermaleng.2019.114648
Liu, X., and Hui, S. Y. (2007). Simulation Study and Experimental Verification of a Universal Contactless Battery Charging Platform with Localized Charging Features. IEEE Trans. Power Electron. 22 (6), 2202–2210. doi:10.1109/TPEL.2007.909301
Liu, Y., Tang, S., Li, L., Liu, F., Jiang, L., Jia, M., et al. (2020b). Simulation and Parameter Identification Based on Electrochemical-Thermal Coupling Model of Power Lithium-Ion Battery. J. Alloys Compd. 844, 156003. doi:10.1016/j.jallcom.2020.156003
Liu, Z., Wang, H., Yang, C., and Zhao, J. (2020c). Simulation Study of Lithium-Ion Battery thermal Management System Based on a Variable Flow Velocity Method with Liquid Metal. Appl. Therm. Eng. 179, 115578. doi:10.1016/j.applthermaleng.2020.115578
Marincaş, A.-H., Goga, F., Dorneanu, S.-A., and Ilea, P. (2020). Review on Synthesis Methods to Obtain LiMn2O4-Based Cathode Materials for Li-Ion Batteries. J. Solid State. Electrochem. 24 (3), 473–497. doi:10.1007/s10008-019-04467-3
Marincas, A. H., and Ilea, P. (2021). Enhancing Lithium Manganese Oxide Electrochemical Behavior by Doping and Surface Modifications. Coatings 11 (4), 456. doi:10.3390/coatings11040456
Pannala, S., Turner, J. A., Allu, S., Elwasif, W. R., Kalnaus, S., Simunovic, S., et al. (2015). Multiscale Modeling and Characterization for Performance and Safety of Lithium-Ion Batteries. J. Appl. Phys. 118, 072017. doi:10.1063/1.4927817
Pongsaksawad, W., Powell, A. C., and Dussault, D. (2007). Phase-Field Modeling of Transport-Limited Electrolysis in Solid and Liquid States. J. Electrochem. Soc. 154 (6), F122–F133. doi:10.1149/1.2721763
Powell, A. C., and Pongsaksawad, W. (2007). Simulation of Electrochemical Process II. Editors V.G. DeGiorgi, C.A. Brebbia, and R.A. Adey (Southampton: wit press/Computational Mechanics Publications), 54, 43–52.
Qin, J., Zhao, S., Liu, X., and Liu, Y. (2020). Simulation Study on Thermal Runaway Suppression of 18650 Lithium Battery. Energy Sourc. A: Recovery, Utilization, Environ. Effects, 1–13. doi:10.1080/15567036.2020.1817189
Raijmakers, L. H. J., Danilov, D. L., EichelNotten, R.-A. P. H. L., and Notten, P. H. L. (2020). An Advanced All-Solid-State Li-Ion Battery Model. Electrochimica Acta 330, 135147. doi:10.1016/j.electacta.2019.135147
Rewatkar, M. R., and Shende, D. Z. (2020). Experimental Investigation on Cenosphere-Based Paper Battery and Electrochemical Battery. Energ. Sourc. Part A: Recovery, Utilization, Environ. Effects 42 (16), 2018–2033. doi:10.1080/15567036.2019.1607924
Sangrós Giménez, C., Schilde, C., Froböse, L., Ivanov, S., and Kwade, A. (2020). Mechanical, Electrical, and Ionic Behavior of Lithium‐Ion Battery Electrodes via Discrete Element Method Simulations. Energy Technol. 8 (2), 1900180. doi:10.1002/ente.201900180
Sharma, S., Panwar, A. K., and Tripathi, M. M. (2021). Thermal-Electrochemical Modeling and Analysis of Different Cathode-Anode Pairs for Lithium-Ion Battery. Adv. Electr. Comp. Eng. 21, 57–64. doi:10.4316/aece.2021.03007
Tasaki, K., and Harris, S. J. (2010). Computational Study on the Solubility of Lithium Salts Formed on Lithium Ion Battery Negative Electrode in Organic Solvents. J. Phys. Chem. C 114 (17), 8076–8083. doi:10.1021/jp100013h
Wang, C. Y., Gu, W. B., and Liaw, B. Y. (1998). Micro‐Macroscopic Coupled Modeling of Batteries and Fuel Cells: I. Model Development. J. Electrochem. Soc. 145 (10), 3407–3417. doi:10.1149/1.1838820
Xia, W., Mahmood, A., Zou, R., and Xu, Q. (2015). Metal-Organic Frameworks and Their Derived Nanostructures for Electrochemical Energy Storage and Conversion. Energy Environ. Sci. 8 (7), 1837–1866. doi:10.1039/C5EE00762C
Keywords: green energy, energy storage devices, lithium-ion battery, electrochemical test, electrical and thermal test
Citation: Sharma S, Panwar AK and Tripathi MM (2022) Multiscale Modeling and Experimental Characterization for Enhancement in Electrical, Mechanical, and Thermal Performances of Lithium-Ion Battery. Front. Energy Res. 10:851377. doi: 10.3389/fenrg.2022.851377
Received: 09 January 2022; Accepted: 09 February 2022;
Published: 25 March 2022.
Edited by:
Shabana Urooj, Gautam Buddha University, IndiaReviewed by:
Amal BaQais, King Abdullah University of Science and Technology, Saudi ArabiaAnurag Gaur, National Institute of Technology, India
Copyright © 2022 Sharma, Panwar and Tripathi. This is an open-access article distributed under the terms of the Creative Commons Attribution License (CC BY). The use, distribution or reproduction in other forums is permitted, provided the original author(s) and the copyright owner(s) are credited and that the original publication in this journal is cited, in accordance with accepted academic practice. No use, distribution or reproduction is permitted which does not comply with these terms.
*Correspondence: Snigdha Sharma, sharma.snigdha93@gmail.com; Amrish K. Panwar, amrish.phy@dtu.ac.in