A Concurrent Fault Diagnosis Method of Transformer Based on Graph Convolutional Network and Knowledge Graph
 Liqing Liu1,2
  Bo Wang
 Fuqi Ma
 Mohamed A. Mohamed
- 1State Grid Tianjin Electric Power Research Institute, Company, Tianjin, China
- 2Tianjin Key Laboratory of Internet of Things in Electricity, Tianjin, China
- 3School of Electrical and Automation, Wuhan University, Wuhan, China
- 4State Grid Tianjin Electric Power Company, Company, Tianjin, China
- 5Electrical Engineering Department, Faculty of Engineering, Minia University, Minia, Egypt
In complex power systems, when power equipment fails, multiple concurrent failures usually occur instead of a single failure. Concurrent failures are so common and hidden in complex systems that diagnosis requires not only analysis of failure characteristics, but also correlation between failures. Therefore, in this paper, a concurrent fault diagnosis method is proposed for power equipment based on graph neural networks and knowledge graphs. First, an electrical equipment failure knowledge map is created based on operational and maintenance records to emphasize the relevance of the failed equipment or component. Next, a lightweight graph neural network model is built to detect concurrent faults in the graph data. Finally, a city’s transformer concurrent fault is taken as an example for simulation and validation. Simulation results show that the accuracy and acquisition rate of graph neural network mining in Knowledge Graph is superior to traditional algorithms such as convolutional neural networks, which can achieve the effectiveness and robustness of concurrent fault mining.
1 Introduction
At the end of 2016, China had built the world’s largest power grid and achieved a huge amount of construction (Liu et al., 2020). However, as the grid continues to grow, the number and variety of power devices in the grid continues to grow (Wang et al., 2021). Due to the large and complex system, the power grid is more likely and more severe than a simple system (Wang et al., 2019a). Faults occurrence also has the nature of randomness, secondary, concurrency, explosiveness, and obfuscation. In most cases, multiple faults will occur at the same time (Wang et al., 2019b). This type of faults is called concurrent faults (Qin et al., 2018) and is also known as compound faults or multiple faults. Concurrent faults in different scenarios are completely different, and the characteristics of the faults are extremely complex and difficult to diagnose (Ma et al., 2018). Therefore, research on how to diagnose concurrent transformer faults is crucial for the operation and maintenance of transmission and transmission equipment, and for the safe and reliable transmission of power systems.
Currently, there is a lot of research on fault diagnosis methods, which can be divided into two main types. One is the traditional method, namely the principal component analysis method (Wang and Xiao, 2004) and the physical feature diagnostic method (Lei et al., 2016). The other is based on artificial intelligence algorithms such as neural network algorithms (Ding et al., 2011; Al-Saud et al., 2019), petri networks (Pan et al., 2008), and fuzzy logic theorems (Lang et al., 2019). The former pays attention only to the fault characteristics, records a single record, and cannot judge the concurrent faults which make it inapplicable. The research on the concurrent faults mainly focuses on the latter. The authors in (Xu et al., 2010) proposed a method of concurrent fault diagnosis information fusion based on random set theory. First, a combination rule of single and concurrent faults is artificially constructed, and then fuzzy functions are used for pattern matching to diagnose concurrent faults. The authors in (Guan and Jiang, 2020) proposed a concurrent multi-fault diagnosis method for electromechanical systems based on the Elman network and ECOC-SVM. This method uses an Elman network instead of manual construction rules to classify faults, splits concurrent faults into single faults for analysis, and the efficiency is improved. But the disadvantage is that the relationship between every single fault is not considered, and the diagnosis effect is not ideal. In response to the above problems, the authors in (Hu et al., 2009) proposed a concurrent fault diagnosis method based on multiple regression LSSVM, which uses multiple regression least squares support vector machines to model concurrent faults as a multi-input and multi-output problem. In (Li and He, 2013), the authors proposed a kernel fuzzy clustering method used in the diagnosis of multiple faults in complex products. It is believed that the relationship between single failure modes in complex products is particularly important for diagnosing concurrent faults and kernelized clustering. However, the manual construction of rules in the above literature is relatively cumbersome, and the constructed combination rules are only applicable to specific scenarios, the model is relatively single, the generalization ability is poor, and it is difficult to adapt to complex scenarios.
Graph Convolutional Network (GCN) is an extension of traditional Convolutional Neural Network (CNN) in non-Euclidean space. It cannot only use multiple graph convolutional layers to automatically extract the features of input variables, as well as take into account the topology structure between the individual nodes (Zhang et al., 2019). GCN currently has excellent application effectiveness in the areas of link prediction, protein classification, drug synthesis, and cross-domain pedestrian detection (de Kleer and Williams, 1987), but its application for simultaneous disability diagnosis is still in its infancy (Cen, 2010). In the power system massive data scenario, the fault diagnosis of concurrent faults of electrical equipment has not been well resolved (Ryu et al., 2019).
In summary, existing methods primarily take two or more simultaneous faults as separate categories of pattern recognition. This is the same as judging multiple faults as a new fault type, ignoring the coupling and correlation between multiple faults. To further investigate the correlation between multiple faults, this paper selects the Graph Convolutional Neural Network (GCN), with strong topological feature expression ability as the basis, proposes a method for transformer concurrent fault diagnosis based on graph neural network and knowledge graph. The main contributions of this paper are summarized as follows:
1) This paper proposes a fault knowledge-related expression method based on a knowledge map. The fault type is used as the node and the correlation relationship between faults is used as the edge to describe the fault knowledge relationship.
2) A concurrent fault analysis method based on lightweight CNN is proposed. The concurrent fault analysis problem is transformed into a connection prediction problem based on graph structure data, and the correlation analysis and fault discovery of concurrent faults are realized.
3) A city’s transformer concurrent fault is taken as an example in this paper. The simulation results show that the accuracy and recall rate of graph neural network mining on the knowledge graph is better than traditional algorithms such as CNNs, which can meet the effectiveness and robustness of concurrent fault mining.
2 Transformer Fault Knowledge Map
This paper divides the model layer of transformer fault knowledge graph into component layer and fault layer. Among them, the component layer defines all possible faulty components of the transformer and the connection relationship between the components. The component layer reflects the first-order connection relationship between the components of the transformer. The fault layer defines all the types of possible faults in the transformer, as well as the similarity and subordination between the types of faults. The fault layer is based on the transformer state evaluation guidelines, reflecting the logical relationship between the faults, and is essentially a knowledge graph with the transformer state evaluation guidelines as the data source.
Data layer triple extraction refers to obtaining structured knowledge such as entities and relationships between entities and attributes from unstructured data through a series of knowledge extraction methods under the guidance of the knowledge organization structure of the model layer. The fault knowledge graph in this paper has two entities: fault component and fault type. There are three relationships: fault component-fault component, fault component-fault type, and fault type-fault type. The knowledge graph is stored and represented in the form of triples. Compared with the traditional structured relational database, the relationship between fields and records requires complicated calculation and extraction. The triple representation of knowledge can explicitly express the relationship between the relationships of entities.
Since most of the model layers of the power transformer fault knowledge map can be determined by the transformer topology diagram and transformer operation inspection guidelines, the fault attribute nodes still need to be summarized and supplemented from the knowledge layer. Therefore, this paper uses a combination of top-down and bottom-up methods to construct a power transformer fault knowledge map. The construction process of the knowledge graph is shown in Figure 1
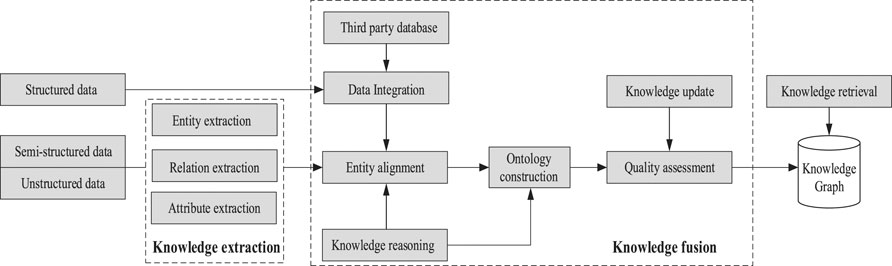
FIGURE 1. Knowledge graph construction process.
The specific steps are as follows:
First, determine the various components of the power transformer and their electrical and mechanical connections through the analysis of the transformer topology. Generate the first-level pattern diagram of the knowledge map. Determine the type of failure of each component, the operation mode, and the maintenance mode after the failure. A top-down approach is used to design the initial model layer of the knowledge map.
Then, under the guidance of the model layer, a bottom-up approach is used to perform entity, relationship, and relationship analysis of the operation and maintenance records based on the graph CNN method. The three elements of attributes are extracted to form a high-quality knowledge expression.
Finally, the extracted faulty components and fault time are added to the model layer as attribute nodes to complete the update of the model layer. So far, the construction of the power transformer fault knowledge map is completed, and the knowledge map is stored in the form of triples.
3 Concurrent Fault Diagnosis of Transformer Based on GCN and Knowledge Graph
The model layer of the power transformer fault knowledge map is mainly composed of three core elements, including fault components, fault time, and fault location, as well as their interrelationships. Firstly, compile the first model layer of the fault knowledge map according to the power transformer structure diagram, and extract the relationship between the components of the transformer. Secondly, according to the transformer maintenance guide, extract the relationship between the components of the transformer and the fault. Finally, Form the second layer of the knowledge graph model layer.
3.1 Knowledge Extraction
As shown in Figure 2, the construction of the data layer depends on the type of data source. Structured data can directly use graph mapping or D2R conversion. And semi-structured data need to use a wrapper, while unstructured text data needs to use a dedicated information extraction method.
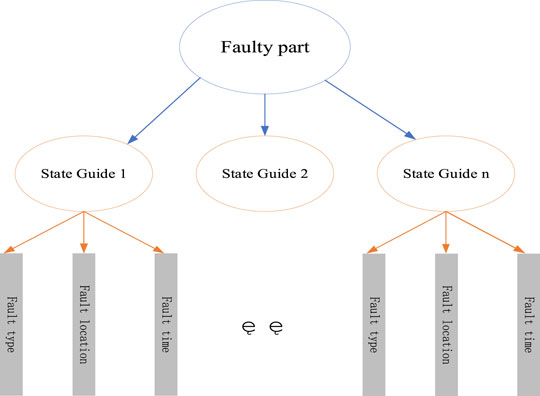
FIGURE 2. The construction mode of the knowledge graph data layer.
The data source used in this paper is a structured excel table, but some fields such as work content contain unstructured text content. Therefore, the knowledge extraction in this paper is divided into two parts. The first part is the structured data extraction of excel forms, and the second part is the unstructured data extraction of fields such as work content.
3.1.1 Structured Data Extraction
The working hours, working location and other fields in the table are all structured data, and there are clear relationship names and corresponding relationships between them. So, it can be directly converted into the RDF graph data format. This paper uses the common R2RML (RDB2RDF) mapping language to complete the mapping.
3.1.2 Unstructured Data Extraction
Unstructured data extraction is more complicated and can be divided into the following subtasks: entity recognition, relationship extraction, event extraction, and coreference resolution. The text content involved in this article comes from the work content field of the maintenance record excel form. The text content components and events are relatively simple. Only three tasks such as entity recognition, relationship extraction, and common reference resolution are required to complete the construction of the data layer.
3.2 Entity Recognition Algorithm Based on BiLSTM-RCF
Due to the problems of concentrated professional terminology, fuzzy expression of entity relationships, unclear boundaries between entities, short text content, and large quantity in the overhaul content text, it is not suitable to use manual rule templates for entity classification. To solve the above problems, this paper introduces the Chinese entity recognition algorithm based on BiLSTM-RCF (Luo et al., 2021) to realize the Chinese named entity recognition of the overhaul content text and solve the problems of unclear boundaries between entities. The specific steps are as follow:
Step 1: Represent each word in sentence x as a vector containing word and character embeddings. Character embedding is initialized randomly. Word embeddings are usually imported from pre-trained word embedding files. All embeddings will be fine-tuned during training.
Step 2: The input of the BiLSTM-CRF model is these embeddings, and the output is the predicted label of the word in sentence x. In this paper, there are only five types of labels, B-Equipment, I-Equipment, B-Fault, I-Fault, and O. Where B-Equipment and I-Equipment refer to equipment or component labels, B-Fault and I-Fault refer to fault type labels, and O refers to other character labels.
Step 3: Input all the scores predicted by the BiLSTM layer into the CRF layer. In the CRF layer, the legal tag sequence with the highest prediction score is selected as the best answer. The model structure is shown in Figure 3.
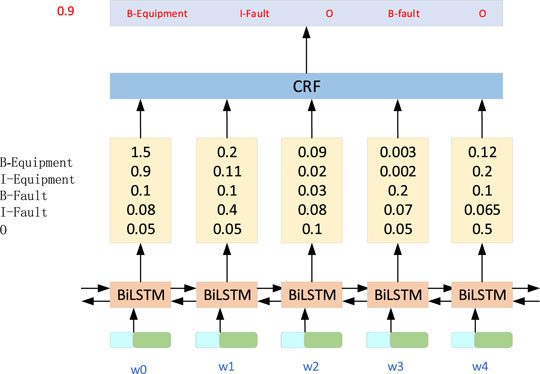
FIGURE 3. BiLSTM-RCF Chinese entity recognition algorithm flow.
3.3 Algorithm for Extracting Relations Between Entities Based on BiGRU-Attention
Entity Relation Extraction (NRE) is to determine whether there is a predefined relationship between entities based on named entity recognition, thereby forming a series of triple knowledge. Based on the BiLSTM-Attention (Peng, 2021) model, a simplified Bidirectional Gated Recurrent Unit (BiGRU) structure is used to reduce the number of parameters and improve the training speed of the model. The structure of the BiGRU-Attention model is shown in Figure 4.
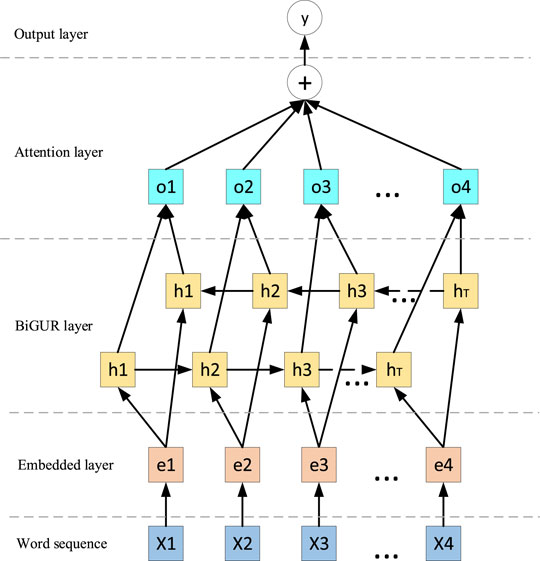
FIGURE 4. BiGRU-Attention model structure.
Based on BiGRU, the attention mechanism is introduced in the BiGRU-Attention model to find words. By learning a weight, and giving these words a higher weight to increase their importance, thereby improving the accuracy of relationship extraction rate.
4 Evaluation Index
The precision and recall as the evaluation indexes are introduced in the transformer concurrent fault diagnosis method based on graph neural network and knowledge graph. Among them, the accuracy rate refers to the proportion of the correct target in the total number of targets detected by the model, which is usually called the precision rate. The recall rate refers to the ratio of the number of correct targets detected by the model to the total number of correct targets, also called the recall rate.
As shown in Figure 5, suppose that in the correct sample library, the number of concurrent failures detected by the model is A, and the number of undetected concurrent failures is B. In the wrong sample library, the number of concurrent failures detected by the model is B. The number of failures is C, and the number of concurrent failures detected is D. The calculation formula for the accuracy rate p and the recall rate R is as follow:
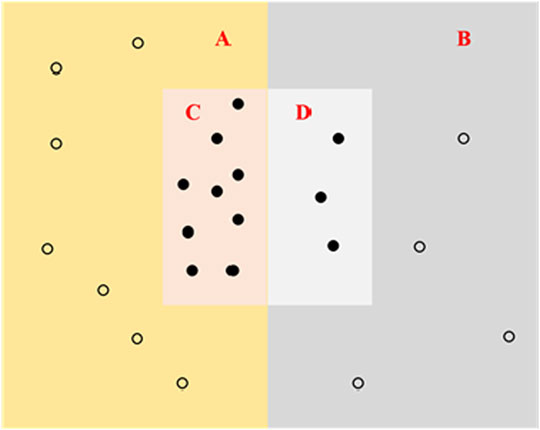
FIGURE 5. Schematic diagram of precision and recall rate.
5 Simulation
Based on the PyTorch deep learning computing environment, a comparative experiment of lightweight graph convolution and standard graph convolution, and a comparative experiment of lightweight graph convolution with different layers are set to verify the approach proposed in this paper. The relevant parameters of the model are shown in Table 1. The model test verification of this paper is carried out on the server of the laboratory, the configuration of server hardware and software environment with 8-core CPU, 32 GB memory and an NVIDIA Tesla P4 graphics card with 8 GB video memory.
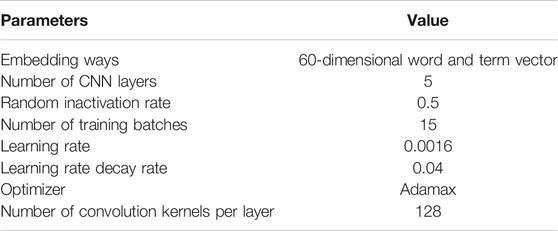
TABLE 1. Parameter settings.
5.1 Comparative Experiment of Lightweight Graph Convolution and Standard Graph Convolution
In this paper, the training data is imported into the lightweight graph convolution (LightGCN), the standard graph convolution neural network (GCN) and convolutional neural network (CNN) respectively. The training loss of the lightweight graph convolution and the standard graph convolution is shown in Table 2.

TABLE 2. Training loss comparison.
It can be seen that the convergence speed of lightweight graph convolution training is much faster than standard graph convolution and CNN, and the final training loss of lightweight graph convolution is small. Standard graph convolution shows the convergence speed and convergence effect of lightweight graph convolution are both better than standard image convolution.
After the training is completed, we use the test set to test the three algorithms, and the recall rate is shown in Table 3.
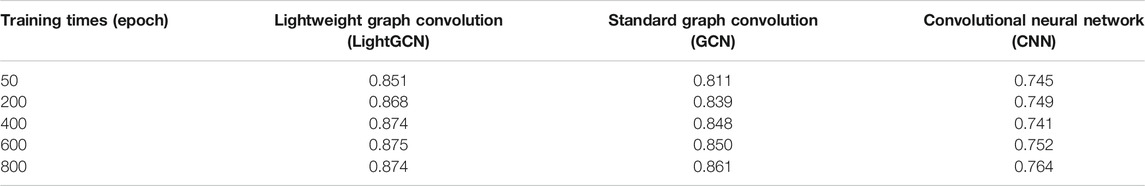
TABLE 3. Recall rate comparison.
It can be seen from Table 3 that the recall rate of the lightweight graph convolution is better than that of the standard graph convolution and CNN, indicating that the lightweight graph convolution has a better mining effect on concurrent faults than the standard graph convolution and CNN.
The comparison between lightweight graph convolution and standard graph convolution is shown in Figure 6. It can be seen that the concurrent fault mining effect of lightweight graph convolution is indeed better than standard graph convolution, and the convergence speed of lightweight graph convolution is faster, furthermore, the training difficulty is less. In terms of practicability and ease, the lightweight graph convolution is better than the standard graph convolution.
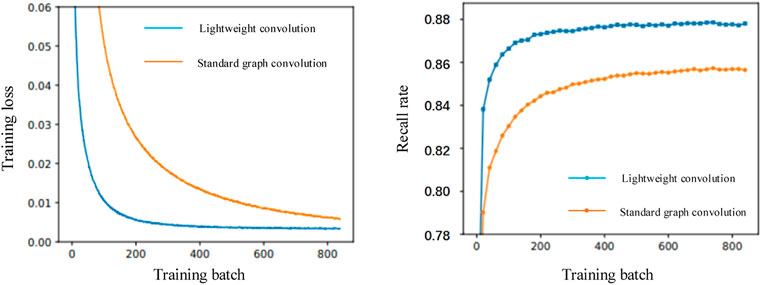
FIGURE 6. Comparisons of lightweight graph convolution and standard graph convolution.
5.2 Comparative Experiment of Lightweight Graph Convolution With Different Layers
A comparative experiment was conducted on GCN models with different layers. The results are shown in Table 4. It can be seen that the effect is best when the number of convolutional layers is three.
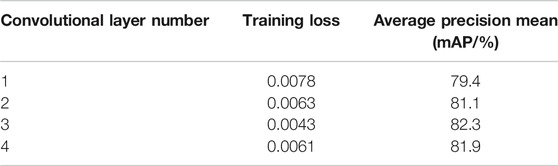
TABLE 4. Comparison of lightweight graph convolution training batches for 200 times.
The graph convolution comparison of different layers is shown in Figure 7. It can be seen that whether it is lightweight graph convolution or standard graph convolution, when the number of network layers is less than or equal to three layers, increasing the number of network layers can effectively improve the mining Accuracy. After the number of network layers is greater than three, due to over fitting, increasing the number of network layers will reduce the mining effect, or even not converge. Therefore, when the number of graph convolutional layers is three, mining can achieve the best results.
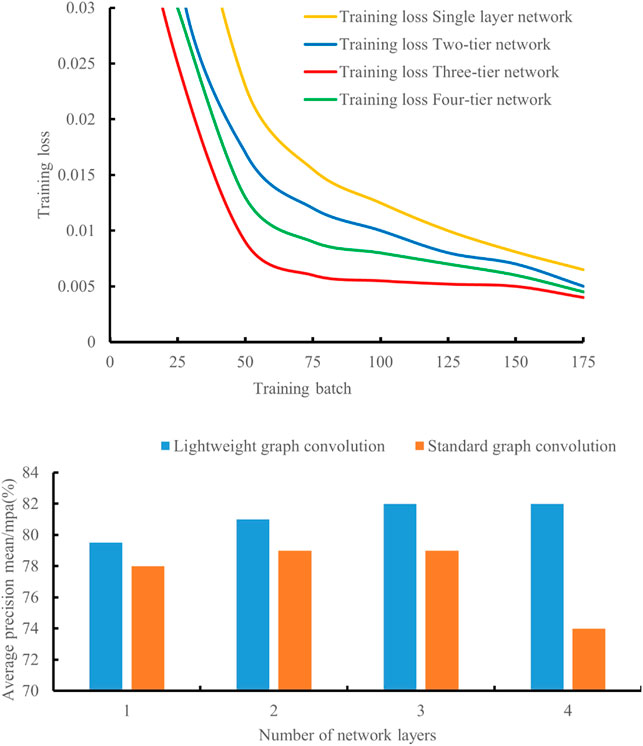
FIGURE 7. Comparison of graph convolutions with different layers.
6 Conclusion
Responding to the problem of modeling and inference of safety hazards due to concurrency failures, this paper introduces the knowledge graph and uses its ability to model relational networks to extract a transformer fault relational network from operation and maintenance data. At the same time, based on graphs, the product neural network is marked by extracting a large number of sub-graphs of the transformer fault knowledge map, and a graph convolutional network is trained to concurrent fault mining. By comparing with the standard graph convolution network, the accuracy and recall rate of graph neural network mining on the knowledge graph are better than traditional algorithms such as convolutional neural networks, which can meet the effectiveness and robustness of concurrent fault mining. Currently, the research in this paper focuses primarily on the analysis and investigation of known companion faults. Subsequent research will consider the situation of unknown concurrent faults and study the discovery and update mechanism of unknown concurrent faults.
Data Availability Statement
The raw data supporting the conclusions of this article will be made available by the authors, without undue reservation.
Author Contributions
LL: Conceptualization, Methodology, Software, Validation, Visualization, Supervision, Investigation, Writing—Original Draft, Writing—Review and Editing. BW: Conceptualization, Methodology, Software, Validation, Visualization, Supervision, Investigation, Writing—Original Draft, Writing—Review and Editing. FM: Conceptualization, Methodology, Software, Validation, Visualization, Supervision, Investigation, Writing—Original Draft, Writing—Review and Editing. QZ: Conceptualization, Methodology, Software, Validation, Visualization, Supervision, Investigation, Writing—Original Draft, Writing—Review and Editing. LY: Conceptualization, Methodology, Software, Validation, Visualization, Supervision, Investigation, Writing—Original Draft, Writing—Review and Editing. CZ: Conceptualization, Methodology, Software, Validation, Visualization, Supervision, Investigation, Writing—Original Draft, Writing—Review and Editing. MM: Conceptualization, Methodology, Software, Validation, Visualization, Supervision, Investigation, Writing—Original Draft, Writing—Review and Editing.
Funding
I declare that all sources of funding received for the research have been submitted. This work was supported by the Science and Technology Program of the Headquarters of State Grid Corporation of China, Research on Knowledge Discovery, Reasoning and Decision-making for Electric Power Operation and Maintenance Based on Graph Machine Learning and Its Applications, under Grant 5700-202012488A-0-0-00.
Conflict of Interest
LL, CZ, and QZ were employed by the Company State Grid Tianjin Electric Power Company.
The remaining authors declare that the research was conducted in the absence of any commercial or financial relationships that could be construed as a potential conflict of interest.
The authors declare that this study received funding from the State Grid Corporation of China. The funder had the following involvement with the study: data collection and analysis.
Publisher’s Note
All claims expressed in this article are solely those of the authors and do not necessarily represent those of their affiliated organizations, or those of the publisher, the editors and the reviewers. Any product that may be evaluated in this article, orclaim that may be made by its manufacturer, is not guaranteed or endorsed by the publisher.
References
Al-Saud, M., Eltamaly, A. M., Mohamed, M. A., and Kavousi-Fard, A. (2019). An Intelligent Data-Driven Model to Secure Intravehicle Communications Based on Machine Learning. IEEE Trans. Ind. Elect. 67 (6), 5112–5119. doi:10.1109/tie.2019.2924870
Cen, J. (2010). Research of Machine Unit Complex Fault Diagnosis Technology Based on Artificial Immune System [D]. Guangzhou: South China University of Technology.
de Kleer, J., and Williams, B. C. (1987). Diagnosing Multiple Faults. Artif. Intelligence 32 (1), 97–130. doi:10.1016/0004-3702(87)90063-4
Ding, S., Su, C., and Yu, J. (2011). An Optimizing BP Neural Network Algorithm Based on Genetic Algorithm. Artif. Intell. Rev. 36 (2), 153–162. doi:10.1007/s10462-011-9208-z
Guan, Y., and Jiang, Z. (2020). A Concurrent Multifault Diagnosis Method for Electromechanical Systems Based on the Elman Network and an ECOC-SVM [J]. J. Harbin Eng. Univ. 41 (11), 1715–1720.
Hu, C., Cai, Y., and Zhang, Q. (2009). Simultaneous Fault Diagnosis Based on Multi-Regression LSSVM [J]. J. Huazhong Univ. Sci. Technology(Natural Sci. Edition) 3 7 (S1), 1–5.
Lang, G., Miao, D., and Fujita, H. (2019). Three-way Group Conflict Analysis Based on Pythagorean Fuzzy Set Theory [J]. IEEE Trans. Fuzzy Syst. 28 (3), 447–461. doi:10.1109/TFUZZ.2019.2908123
Lei, Y., Jia, F., Lin, J., Xing, S., and Ding, S. X. (2016). An Intelligent Fault Diagnosis Method Using Unsupervised Feature Learning towards Mechanical Big Data. IEEE Trans. Ind. Electron. 63 (5), 3137–3147. doi:10.1109/tie.2016.2519325
Li, T., and He, Z. (2013). The Kernel Fuzzy Clustering Method in the Diagnosis of Multiple Faults in Complex Products[J]. Syst. Engineering-Theory Pract. 33 (1), 181–186.
Liu, W., Zhang, X., Wu, Y., and Feng, S. (2020). Economic Analysis of Renewable Energy in the Electricity Marketization Framework: a Case Study in Guangdong, China. Front. Energ. Res. 8, 98. doi:10.3389/fenrg.2020.00098
Luo, X., Xia, X., An, Y., and Chen, X. (2021). Chinese CNER Combined with Multi-Head Self-Attention and BiLSTM-CRF [J]. J. Hunan Univ. (Natural Sciences) 48 (04), 45–55.
Ma, K., Zhu, J., Soltani, M., Hajizadeh, A., Hou, P., and Chen, Z. (2018). “Active Power Dispatch Strategy of Wind Farms under Generator Faults,” in European Safety and Reliability Conference 2018: ESREL 2018 (Hannover: CRC Press), 2147–2152. doi:10.1201/9781351174664-269
Pan, C., Yue, J. P., Liu, B., and Yu, J. (2008). An Adaptive Petri Network Based Approach to Diagnose Power Network Faults [J]. Power Syst. Tech. 32 (1), 46–50.
Peng, B. (2021). Research on Entity Relationship Extraction of Cultural Relic Information Resources Based on Knowledge Map and Deep Learning [J]. J. Mod. Inf. 41 (05), 87–94.
Qin, A., Hu, Q., Lv, Y., and Zhang, Q. (2018). Concurrent Fault Diagnosis Based on Bayesian Discriminating Analysis and Time Series Analysis with Dimensionless Parameters. IEEE Sensors J. 19 (6), 2254–2265. doi:10.1109/jsen.2018.2885377
Ryu, S., Kwon, Y., and Kim, W. Y. (2019). A Bayesian Graph Convolutional Network for Reliable Prediction of Molecular Properties with Uncertainty Quantification. Chem. Sci. 10 (36), 8438–8446. doi:10.1039/c9sc01992h
Wang, Q., Jin, T., Mohamed, M. A., and Chen, T. (2019). A Minimum Hitting Set Algorithm with Prejudging Mechanism for Model-Based Fault Diagnosis in Distribution Networks. IEEE Trans. Instrumentation Meas. 69 (7), 4702–4711. doi:10.1109/tim.2019.2951866
Wang, Q., Jin, T., and Mohamed, M. A. (2019). An Innovative Minimum Hitting Set Algorithm for Model-Based Fault Diagnosis in Power Distribution Network. IEEE Access 7, 30683–30692. doi:10.1109/access.2019.2902598
Wang, Q., Jin, T., Mohamed, M. A., and Deb, D. (2021). A Novel Linear Optimization Method for Section Location of Single-phase Ground Faults in Neutral Noneffectively Grounded Systems. IEEE Trans. Instrum. Meas. 70, 1–10. doi:10.1109/tim.2021.3066468
Wang, S., and Xiao, F. (2004). AHU Sensor Fault Diagnosis Using Principal Component Analysis Method. Energy and Buildings 36 (2), 147–160. doi:10.1016/j.enbuild.2003.10.002
Xu, X., Wen, C., Jiang, H., and Wang, Y. C. (2010). Information Fusion Method of Simultaneous Fault Diagnosis Based on Random Set Theory [J]. Chin. J. Scientific Instrument 31 (2), 335–361.
Keywords: knowledge graph, graph convolutional neural network, fault diagnosis, concurrent failures, failures analysis
Citation: Liu L, Wang B, Ma F, Zheng Q, Yao L, Zhang C and Mohamed MA (2022) A Concurrent Fault Diagnosis Method of Transformer Based on Graph Convolutional Network and Knowledge Graph. Front. Energy Res. 10:837553. doi: 10.3389/fenrg.2022.837553
Received: 16 December 2021; Accepted: 27 January 2022;
Published: 21 February 2022.
Edited by:
Peng Hou, Peng Hou, DenmarkReviewed by:
Jichao Hong, University of Science and Technology Beijing, ChinaXuguang Hu, Northeastern University, China
Copyright © 2022 Liu, Wang, Ma, Zheng, Yao, Zhang and Mohamed. This is an open-access article distributed under the terms of the Creative Commons Attribution License (CC BY). The use, distribution or reproduction in other forums is permitted, provided the original author(s) and the copyright owner(s) are credited and that the original publication in this journal is cited, in accordance with accepted academic practice. No use, distribution or reproduction is permitted which does not comply with these terms.
*Correspondence: Fuqi Ma, whumfq@whu.edu.cn; Mohamed A. Mohamed, dr.mohamed.abdelaziz@mu.edu.eg