Changing Times: Altering Establishment Spacing, Harvesting Frequency, and Harvesting Machines to Promote Increased Sawtimber Volumes
 Marissa “Jo” Daniel
 Tom Gallagher1
  Brian Via
- 1School of Forestry and Wildlife Science, Auburn University, Auburn, AL, United States
- 2USDA Forest Service, Southern Research Station, Auburn, AL, United States
- 3Bio-systems Engineering, Auburn University, Auburn, AL, United States
Today's landowners are faced with important decisions when establishing loblolly pine plantations in the Southeastern part of the United States with regards to planting dimensions and forest management techniques. Although recent studies are beginning to demonstrate the need for change from the old practices, suppressed biomass markets and prices are hindering the transition. This paper provided readers with an informational overview of the benefits of: incorporating an additional thinning regime for biomass, using alternate spacing methods such as Flexstands™ and rectangularity, and using small-scale harvesting machines for conducting initial thinning's. The overview was supported with both a field study as well as a modeling tool which verified using one or all of the above mentioned techniques to increase total harvest volumes while minimizing residual stand damage. The modeling tool determined that final sawtimber volumes were increased by a minimum of 15 green tons per acre using one or more of the above techniques. When expanding this volume out to 20 acres, the minimum tract size harvested in the southeast using convention equipment, landowners could easily recover any losses incurred from the suppressed biomass markets minimizing overall risk and promoting the use of these alternative techniques.
Introduction
Forest landowners in the southeastern part of the United States are faced with multiple challenges when it comes to harvesting loblolly pine (Pinus taeda L) from their land. First, tract sizes are shrinking as lands become more fragmentized making it hard for landowners to find loggers willing to harvest their land (Daniel, 2012; Aguilar et al., 2014; Butler and Butler, 2016a). Next, plantations that promote woody biomass harvesting are being encourage but there are minimal markets available to sell the product to, stumpage prices are minimal if existent for the product, and today's standard sized machines aren't able to cost-effectively harvest the product so loggers aren't willing to cut the biomass for the landowner (Botard et al., 2015; BBI International, 2017; Gallagher et al., 2017; Yu et al., 2017). Finally, in order for these plantations to pay for themselves, landowners need to produce the highest sawtimber volumes possible to mitigate the risk of such a long-term investment and incentivize them to re-establish the land back into timber rather than convert it to another use that provides greater financial or intrinsic value for them (Butler and Leatherberry, 2004; Butler, 2008; Aguilar et al., 2013).
With all the above mentioned challenges, it becomes confusing for a landowner when trying to decide how to establish and manage their loblolly pine plantation. This paper's objectives were to provide an informational overview of the benefits of: incorporating an additional thinning regime for biomass, using alternate spacing methods such as Flexstands™ and rectangularity, and using small-scale harvesting machines for conducting initial thinning's to promote increased sawtimber volumes. The overview was supported with both a field study as well as a modeling tool which verified using one or all of the above mentioned techniques to increase total harvest volumes while minimizing residual stand damage.
Biomass Harvests
Biomass harvests differ from first thinning's in a variety of ways. A pine biomass harvest is typically conducted between years 5 to 9 whereas a first thinning is between years 10 and 16. This difference in age generally results in a difference in size, product class, and inadvertently delivered price (Gallagher et al., 2017). This smaller diameter creates more surface bark, limbs, and needles which are undesirable when making pulp because it requires additional chemicals to be used during the breakdown of cellulosic fibers. Biomass is therefore not often used during a pulpwood shortage (Bajpai, 2012). Pulpwood, however, can be a suitable alternative when biomass shortages arise so consequently market demand doesn't increase and neither does woody biomass's price.
There are over 90 pulp and paper mills in the Southeastern part of the United States compared to the 41 biomass facilities that can be found in the same region. Of these 41, 12 are biomass power facilities which together produce only 563.3 megawatts of power every year from a combination of pulpwood, woody biomass and logging residues. Sixteen of the 41 are pellet mills which are able to use both hardwood and softwood feedstock (pulpwood or woody biomass) to produce approximately 7 million green tons of pellets per year. Eleven of the 41 are pellet mills which use only softwood feedstock (pulpwood or woody biomass) to produce 4.5 million green tons of pellets per year, and 2 are pellet mills designated as woody biomass feedstock. These two mills produce over 2 million green tons of pellets annually by themselves (BBI International, 2017). In general, it can be seen that even the biomass designated facilities are being supplied still with pulpwood rather than wood biomass only, indicating that there is a plethora of market potential if biomass was readily available as a product.
According to Timber Mart-South, the 2016/2017 average delivered price for woody biomass was $21.18 per green ton (Timber Mart South, 2018). This price appears high and comparable to the 2016/2017 average delivered market price for pulpwood of $29.49 per green ton, however it is deceiving. Delivered prices for woody biomass are designated for “clean” chips that come from the mill and are being deliver to another facility. These chips do not have any bark, needles, small limbs, or dirt in them. Woody biomass that comes straight from the woods can either be transported “whole tree” with tops and limbs still attached to the main stem or as “dirty chips.” Dirty chips indicate that the tree has been chipped in the woods and will have limbs, needles, bark, dirt, and the potential for other small objects mixed into the chips. The market for “dirty chips” is basically non-existent at this time, therefore, revenue from woody biomass is also not available (Mitchell and Gallagher, 2007).
Although incorporation of a biomass harvests is not currently a viable solution for increasing a landowner's revenue at the time of that harvest, an additional thinning can increase total stand yield by removing trees that would either die or plateau the stands growth (Dean and Baldwin, 1993; Sharma et al., 2002). The removal of biomass to decrease the stands overall density stocking allows trees to continue to grow at a competitive rate thereby inadvertently increasing the number of sawtimber trees available throughout the stand (Amateis et al., 2004). Planting with higher density stocking initially has also been shown to instigate greater competition between saplings encouraging straighter trees with less branches which eventually has the potential to lead to a higher quality final product (Amateis et al., 2009; Amateis and Burkhart, 2012; Gallagher et al., 2017).
Flexstands™
The concept of a FlexStand™ was coined by ArborGen: Global Reforestation Partner, a worldwide provider of both genetically enhanced and conventional tree seedlings. This silvicultural technique involves planting conventional biomass, open-pollinated (OP), trees in-between rows of genetically improved, mass-control pollinated (MCP), trees to provide landowners with an economical solution for growing and thinning Loblolly pine stands (ArborGen Inc., 2018). This unique plantation establishment method was designed to assist in risk mitigation for future timber markets by producing multiple products from the same stand. This technique also allows landowners the flexibility of altering their management decisions based on current and expected market dynamics.
FlexStands™ are considered to be high-density plantings. Although planting strategies differ depending on landowner objectives, the overall concept is to plant a high number of trees per acre by alternating/interchanging row plantings between MCP trees and OP trees. The enhanced seedlings will be spaced anywhere from 6 to 10 feet apart down the rows however the non-modified seedlings will be spaced as close as 2 feet and as far apart as 6 feet in order to increase the density stocking of the stand. Rows are typically 10–12 feet apart but have been seen as close as 5 feet apart (ArborGen Inc., 2018). Research has shown that seedling growth is not detrimentally affected by the distance between trees for the first few years of growth. Rather, the closer the seedling spacing, the more the saplings tend to focus on bole growth rather than branches or needles thereby decreasing defects that can be found in the tree (Ma, 2014).
Altering seedling types throughout the stand by rows has also been proven to minimize the costs of planting to the landowner because they are no longer purchasing all genetically enhanced seedlings, of which half are eventually removed before growing to sawtimber size (Ma, 2014; ArborGen Inc., 2018). FlexStands™ are also proven to reduce the loss of revenue for landowners compared to if they were to plant only one seedling type. Planting only OP trees reduces the final sawtimber size inadvertently decreasing overall revenue, whereas planting only MCP seedlings results in a significantly higher increase in initial costs which must be carried through to the final harvest that is not guaranteed to be more profitable (ArborGen Inc., 2018).
With the FlexStand™ system, a biomass harvest is conducted between years 6 and 9 removing all OP sapling rows in order to promote the continued growth of the stand. A pulpwood thinning is conducted around years 12–16 to once again keep the stand from stagnating in size with a final harvest being conducted between years 24 and 30 depending on tree diameters and market prices.
Revenue associated with conducting a first thinning with both the biomass and the pulpwood out of the FlexStand™ does not currently mitigate the associated harvesting costs. Incorporating a biomass thinning into the management regime beforehand, however, does increase the size and overall value of the final sawtimber trees by forcing them to grow straighter and with fewer branches for the first few years of their life which results in a higher value final product (ArborGen Inc., 2018). When considering overall profitability, FlexStand™ could be considered a potential solution if a biomass harvest is conducted within the conventional timber harvest as long as there were viable markets to send the products. Further promotion for the FlexStand™ could occur if harvesting and relocation costs could be reduced by using small-scale equipment.
Rectangularity
Similar to the idea that a FlexStand™ could be a viable option to modify planting establishment methods, rectangularity is also being studied for its feasibility to promote woody biomass in the South. Typically, conventional stand seedling establishments occur with a specific number of trees being planted per acre in a shape that resembles a square. With rectangularity, the same number of trees are planted per acre but the shape resembles a rectangle rather than a square. This configuration allows for wider spacing in-between the rows of trees making site preparation costs cheaper as well as increasing maneuverability of forestry equipment throughout the stand, inadvertently decreasing damage caused to residual trees (Amateis et al., 2004).
The concept of rectangularity has been intermittingly studied since the 1940's as researchers continue to contemplate the ideal plantation spacing for specific tree species (Sharma et al., 2002; Amateis and Burkhart, 2012). Almost all studies have shown that rectangularity has no effect on tree height, diameter, volume per acre, basal area per acre or even tree survival (Gerrand and Neilsen, 2000; Amateis et al., 2004, 2009; Brand, 2012). In fact, most studies have shown that age plays a more significant effect than rectangularity. Crown size and shape appear to be the only factors that should be taken into account when contemplating a rectangularity spacing.
Although there are a variety of spacing options with regards to rectangularity, the three most recognized coincide with 436 trees per acre (tpa), 605 tpa, and 908 tpa. A normal plantation spacing at 436 tpa would be 10 feet in-between-rows by 10 feet within-rows, compared to the rectangular option of 20 feet in-between-rows by 5 feet within the rows. At 605 tpa, a normal spacing would be 9 feet by 8 feet whereas a rectangular spacing would be 12 feet by 6 feet. Finally, at 908 tpa, a normal spacing regime would be 8 feet by 6 feet compared the rectangular spacing of 12 feet by 4 feet (Sharma et al., 2002; Amateis et al., 2004, 2009).
As forestry equipment continues to grow in dimension, landowner holdings are decreasing in size. Rectangularity could provide a viable solution to the increasing amounts of damage unintentionally administered to residual trees when thinning's occur. With rectangularity, the need for small-scale harvesting equipment becomes less of an issue, allowing the equipment industry to continue to focus on producing larger more powerful machines. NIPF landowners would also benefit from this technique by being able to strategically plant rows in a manner which allowed for optimal growth and harvest of the tract in future years while allowing for machine maneuverability.
Small Scale Harvesting
Non-industrial private forest landowners (NIPFs) account for 36% of all of the forest land, 1+ acres, in the United States. Of this percentage, 13% comes from landowners who reside in the Southeastern part of the United States (Butler and Butler, 2016a,b). According to the national survey conducted in 2006, the majority of acres owned by NIPF landowners is between 1 and 49 acres (Butler and Leatherberry, 2004; Butler, 2008). As woody biomass becomes a more desired commodity, the forest industry will begin to look for further resources to supply to their mills. In addition to experimenting with genetic improvements for tree growth and establishment/planting modifications, mills will likely turn to the NIPF landowners for greater contribution.
Research has shown that it is unprofitable for a logger to harvest trees on less than 20 acres because today's equipment is too expensive for the harvest to result in economically feasibility after relocation costs, capital investments, labor, and fuel expenses are withheld from revenue (Athanassiadis, 1997; Burdg and Gallagher, 2011). Additionally, upholding today's high standards for best management practices can become an issue due to the large size of standard machines which measure approximately 10–11 feet wide, can range from 20 to 30 feet in length, weigh between 30,000 and 50,000 lbs, and have 174–300 HP for engine power (Caterpillar, 2018; Deere and Company, 2018). Even though a majority of the feller-bunchers and skidders in the south have articulated steering, these equipment specifications can inflict significant damage on residual trees when working in minimal acreage, conducting pulpwood thinning's, or even biomass thinning's.
Ideally, the top leaders in the forest equipment industry would design feller-bunchers and skidders that met the economic and environmental requirements of harvesting an area that was less than 20 acres in size. These machines would need to be small enough to maneuver through narrow spaces and rows without causing significant residual damage. The machines would need to be capable of handling trees approximately 55 feet in height and 9 inches in diameter. Ultimately, producers must be able to provide these machines at a cost which makes harvesting small tracts profitable. Realistically, however, equipment continues to grow in size to meet the market demand for larger and more powerful machines. Until market demand increases for smaller machines, minimal advancements will be made by the industries leaders.
Although purchasing small-scale feller-bunchers and skidders in the United States is currently a daunting task, finding forestry attachments that connect to skid-steers, compact tracked loaders, and mini-excavators is not. The ability to connect to a variety of attachments, both forestry-related and otherwise, to complete the immediate task at hand has made these machines the most versatile options available on today's market. Because of the advancements that have been made on these machines in both horsepower and hydraulic pressure flow technology, manufacturers have been able to create a system called “high flow.” This system allows operation of attachments requiring significant speed and/or torque such as the harvester saw-heads which were previously impossible on such small machines.
These small-scale machines are dimensionally smaller, ranging from 3 to 7 feet in width and 8 to 15 feet in length depending on make and model which suggests increased mobility in small tight areas. Machine weights and range from approximately 2,500 to 9,500 pounds for the skid-steers/compact tracked loaders and 8,500 to 18,500 pounds for the mini excavators. Machine engine power ranges from 65 to 106 hp for skid-steers/compact tracked loaders and 40 to 65 hp for the mini excavators (Caterpillar, 2018; Deere and Company, 2018). These specifications indicate that these machines can be transported with a pickup truck and trailer rather than with a semi and lowboy trailer as is required for standard forestry equipment, inadvertently decreasing transportation costs. These machines are also known for having a low ground pressure which minimizes ground disturbance making them environmentally friendly. Finally, initial purchase price differences between small-scale and standard forestry equipment can be as low as one quarter to as high as one half of the cost depending on make, model, and attachment configuration.
Methods
Case Study Site Description:
The field study was conducted on the Solon Dixon Forestry Education Center in Covington County, Alabama. The site consisted of a total of approximately 2.66 acres on Dothan and Malbis sandy loams. Stand 1 was 1.02 acres in size and contained a loblolly pine plantation with 8 × 6ft spacing. Stand 2 was 1.64 acres in size and was considered a flex plantation stand. The spacing configuration consisted of every third row being 10ft by 4ft spacing planted with OP seedlings while all other rows were MCP seedlings planted with a 10ft by 8ft spacing. Both stands were established with their rows facing in an east-west direction with a 20-foot corridor separating the two stands. The stands were approximately 8 years old at the time of harvest, in May 2017, with minimal mortality found in either stand.
A Caterpillar 279D compact track loader machine with a Fecon FBS1400 Single Knife Tree Shear attachment head was used to remove every third row from both stands for a harvested basal area of 70. The track loader weighed approximately 10,000 lbs, had 73 HP engine power, was 6 feet wide and 7 feet long. The sheared trees were collected in the shear heads' accumulating arm until full where the bundle would then be laid down within the row. A turbo forest mini skidder was used to collect the bundles and remove them from the site. This machine weighed 7,500 lbs, had 50 HP engine power, was 6 feet wide, and 12 feet in length. No time study was conducted in this analysis so operational costs could not be calculated.
Approximately two bundles per row in stand 1 and three bundles per row in stand 2 were randomly selected to be measured for a total of 16 bundles in stand 1 and 12 bundles in stand 2. Individuals trees were measured out of each selected bundle. Overall, 88 trees were measured in stand 1 and 79 trees were measured in stand 2.
Data were recorded and analyzed in Microsoft Excel. Results for the field data were analyzed by grouping trees by dbh class using 1-inch intervals from 3 to 9 inches. Basal area was calculated per size class as was the overall basal area that was removed from each stand. The average weight per tree was calculated for each size class and protracted out to determine the overall tonnage harvested per size class for 1 acre. Total green tons removed per stand were calculated to use as a reference for comparison. A stump count was conducted in each row per stand to use a reference for actual tree removal data. Two-sample t-tests were conducted in Minitab to determine if there were statistical differences between the field data for total height, weight, basal area, or dbh between Stand 1 and Stand 2.
Ptaeda Study Model Description:
A comparison model study was conducted using a loblolly pine plantation modeling tool named Ptaeda 4.0. Six separate models were run with this tool; one each for stands 1 (M1) and 2 (M3) with a biomass harvest at year 8, thinning's at year 16 and final harvests at year 28. A third model (M5) was run to simulate a rectangularity setting with 12 × 4ft spacing (908 tpa) that could be compared against Stand 1. This model followed the same parameters as the previous two with regards to thinning and harvest schedules. The other three model simulations (M2, M4, and M6) only conducted pulpwood thinning's at year 16 with final harvests at year 28.
Each model incorporated specific parameters relating the models as close to field conditions as possible. Stand information included site productivity of 85, total rotation lengths of 28 years, planting distances between trees and between rows of 8 × 6, 10 × 6, and 12 × 4. Site information included physiographic regions based in the Coastal Plain, well-drained drainage class, and no fertilization at planting. Merchandising options and limits resulted in pulpwood tops at 2 inches with minimum dbh at 5 inches, chip and saw tops at 4 inches with dbh at 8 inches, and sawtimber tops at 6 inches with dbh at 11 inches. All topwood from chip and saw and sawtimber product classes were added into the pulpwood product class. All trees were calculated using green weight (green tons/acre with bark) measurements. No economic parameters were designated. Mid-rotation treatments varied by harvest plan. Biomass harvests were conducted using a 3rd-row and low (70 basal area) thin method at year 8 with 16 year thinning's conducted with a targeted residual basal area of 70 square feet. One thinning harvests included a third row and low (70 basal area) thinning conducted at year 16 only.
Ptaeda data that was recorded into excel included: the site index, the treatment conducted, dominant height, average dbh, average height, average crown ratio, dbh class, tree number, basal area, total weight (green ton), pulpwood weight harvested (green ton), chip n saw weight harvested (green ton), and sawtimber weight harvested (green ton). Clark and Saucier were referenced to calculate the predicted green weight in pounds of total tree (wood, bark, and foliage) in the Coastal Plain, based on dbh size class for total tree height using the following equation:
This number was converted to green tons and then multiplied by the total number of trees in each size class to find total tons per size class. Weights were calculated for each treatment year both before and after each harvest treatment by dbh size class but only the harvested treatment weights were used to calculate price per green ton. Harvest weights were then calculated per product class following the previously mentioned mechanizing limits.
Biomass weight was calculated using the difference between Clark and Saucier total tree green weight from the Ptaeda model merchandized green weight in each dbh size class. These weights were summed to determine a biomass weight in green tons for tops, limbs, and needles. One inch through four inch dbh size class weights for total tree height from Clark and Saucier were also included when available to determine total biomass available in the woods for that harvest treatment year. Regardless of intentions to collect all biomass available, recent studies have estimated that approximately 30% of the biomass harvested remains in the woods (Lancaster, 2017). For this reason, 30% of the biomass harvest weight was removed from the final biomass tonnage values. New total weights for each harvest were calculated to incorporate this 30% loss in biomass harvest.
Price per green ton was calculated for each product class as was total revenue for each treatment. Revenue, net present value at 3% (NPV), internal rate of return (IRR) were calculated both with biomass as well as without biomass. Cost for stand establishments for the landowner was calculated using reference numbers from the “Costs and Trends of Southern Forestry Practices 2012” by the Alabama Cooperative Extension System (Dooley and Barlow, 2013). Item description prices were based on numbers for the southern coastal plain on a per acre basis and included chemical site preparation at $89.41, burning after chemical site prep $53.44, hand planting costs for bare root seedlings $62.78, fertilizer at establishment $104.95, and seedling costs per thousand $48.69 per thousand. Logging costs were not calculated since the biomass harvest costs would need to be calculated using small-scale equipment and that information is not currently available. Additionally, logging costs are not typically incurred by the landowner directly, rather they are removed from the landowner's final revenue received from harvest.
Results
Field Study
Eighty-eight trees were measured in Stand 1 out of the 232 that were harvested. Of the trees that were measured, 6 were within the 3-inch dbh class, 9 were in the 4-inch dbh class, 26 were within the 5-inch class, 34 within the 6-inch class, 12 were in the 7-inch class, 1 in the 8-inch class, and none were found to be within the 9-inch dbh class (See Table 1). The average dbh for the stand was 6 inches with an average height of 39 feet. The residual basal area was approximately 70 down from the original 120 before harvesting. Tree weights for each dbh class were averaged to calculate the average weight per tree in each dbh class as well as the average dbh weight per acre. A final weight for Stand 1 was calculated at 84,690 pounds or 42.35 green tons that were removed from a one-acre tract.
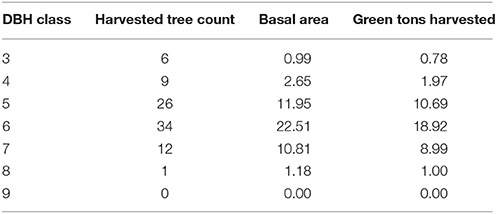
Table 1. Summary data for the 8 × 6 stand of harvested trees 1.
Seventy-Nine of the Five hundred and sixty eight harvested trees were measured in Stand 2. Of those trees 3 were within the 3-inch dbh class, 16 were in the 4-inch dbh class, 32 were within the 5-inch class, 16 within the 6-inch class, 10 were in the 7-inch class, 1 in the 8-inch class, and 1 was found to be within the 9-inch dbh class (See Table 2). The average dbh for the stand was also 6 inches with an average height of 40 feet. The residual basal area was approximately 70 down from the original 120 before harvesting. Tree weights for each dbh class were averaged to calculate the average weight per tree in each dbh class as well as the average dbh weight per acre. A final weight for Stand 2 was calculated at 105, 158 pounds or 52.58 green tons that were removed from a 1-acre tract.
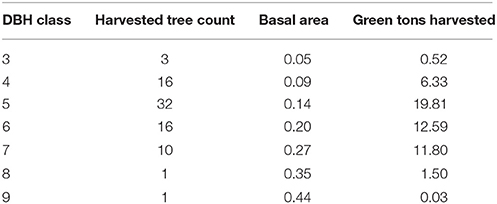
Table 2. Summary data for the 10 × 6 harvested stand 2.
Visual observations were made following the harvests to collect information concerning damage made to residual trees. For the purpose of the study, damage was classified as any scrape or mark that was longer than 6 inches and cut through the bark into the trees cambium layer. Less than 5% damage was found in Stand 1 and none of the damage appeared to be significant enough to cause mortality. Less than 1% damage was observed in Stand 2, also none of which appeared harmful enough to cause mortality.
Two-sample t-tests were conducted to determine if there were any significant differences between the two stands with regards to the tree weights, dbh, height, or basal area. All variables except tree weight were found to be statistically insignificant. Tree weights, however, had a P-value of 0.045 at the 95% significance level. An additional comparison was conducted to determine if Stand 1 trees weighed more than Stand 2 trees. This t-test was also found to be significant at the 95% level with a P-value of 0.023.
Ptaeda Model Green Tonnage
The Ptaeda model that included biomass in the harvest for Stand 1 (M1) had an average dbh of 5 inches with an average tree height of 31.5 feet after year 8. There were approximately 39 total green tons harvested at that time, all of which were designated as biomass. At year 16 a 2nd thinning resulted in an average dbh of 9.27 inches and an average height of 62.7 feet. Approximately 88 total green tons were removed with 11 green tons coming from biomass, 5 green tons from pulpwood, 70 green tons from chip and saw, and 2 green tons coming from sawtimber. Final harvest at year 28 resulted in an average dbh of 11.58 inches and 83.7 feet for an average height. Approximately 165 total green tons were removed with 19 green tons coming from biomass, 0 green tons from pulpwood, 67 green tons from chip and saw, and 79 green tons coming from sawtimber. In total 291 green tons were removed from the stand during the three harvests, with 69 green tons coming from biomass, 5 green tons from pulpwood, 137 green tons from chip and saw, and 80 green tons from sawtimber (See Figures 1–4).

Figure 1. Total Volume Comparison for all Ptaeda Models.
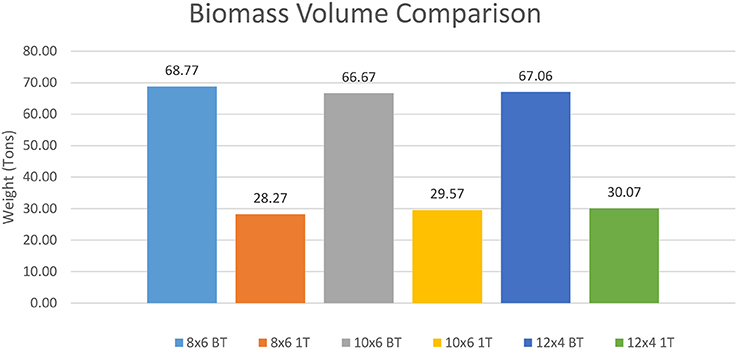
Figure 2. Biomass Volume Comparison for all Ptaeda Models.
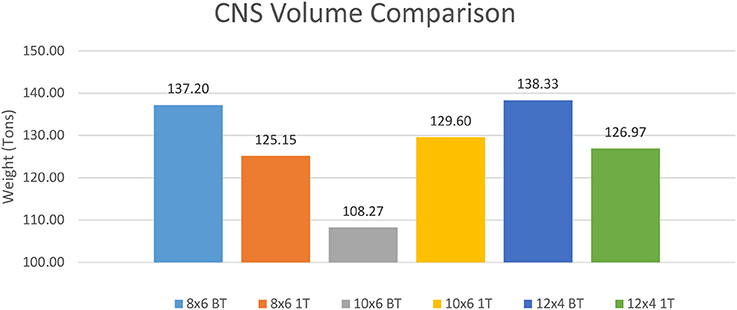
Figure 3. Chip and Saw Volume Comparison for all Ptaeda Models.
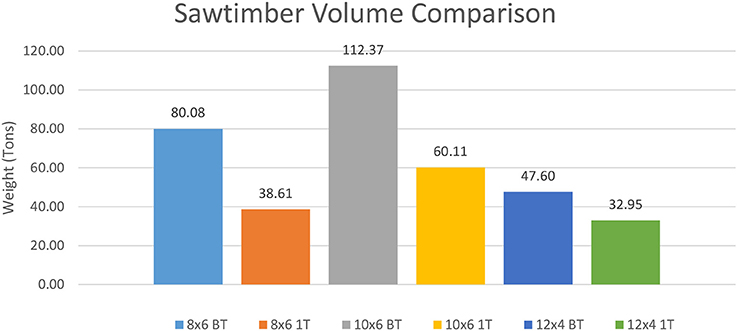
Figure 4. Sawtimber Volume Comparison for all Ptaeda Models.
Conventional Ptaeda model for Stand 1 that did not include a biomass harvest, also known as one thinning (M2), had an average dbh of 8.31 inches and an average height of 60.1 feet after the 1st thinning at year 16. There were approximately 83 total green tons harvested, 11 green tons came from biomass, 40 green tons from pulpwood, 32 green tons from chip and saw, and 1 green ton from sawtimber. Final harvest at year 28 resulted in an average dbh of 10.45 inches and an average height of 81 feet. One hundred and fifty one total green tons were removed from the final harvest with 18 green tons coming from biomass, 3 green tons from pulpwood, 93 green tons from chip and saw, and 25 green tons from sawtimber. In total 234 green tons were harvested from the tract with 28 green tons coming from biomass, 42 green tons from pulpwood, 125 green tons from chip and saw, and 39 green tons from sawtimber.
Stand 2's biomass inclusion harvest (M3) resulted in an average dbh of 5.52 inches with an average tree height of 32 feet after year 8. There were approximately 37 total green tons harvested at that time, all of which were designated as biomass. At year 16 a 2nd thinning resulted in an average dbh of 9.66 inches and an average height of 63.4 feet. Approximately 87 total green tons were removed with 11 green tons coming from biomass, 0.5 green tons from pulpwood, 74 green tons from chip and saw, and 2 green tons coming from sawtimber. Final harvest at year 28 resulted in an average dbh of 12.06 inches and 84.7 feet for an average height. Approximately 164 total green tons were removed with 19 green tons coming from biomass, 0 green tons from pulpwood, 35 green tons from chip and saw, and 110 green tons coming from sawtimber. In total 288 green tons were removed from the stand during the three harvests, with 67 green tons coming from biomass, 0.5 green tons from pulpwood, 108 green tons from chip and saw, and 112 green tons from sawtimber.
Stand 2's one thinning harvest (M4) had an average dbh of 8.81 inches and an average height of 60.8 feet after the 1st thinning at year 16. There were approximately 85 total green tons harvested, 11 green tons came from biomass, 23 green tons from pulpwood, 51 green tons from chip and saw, and 0 green ton from sawtimber. Final harvest at year 28 resulted in an average dbh of 11.05 inches and an average height of 81.0 feet. Final harvest tonnage resulted in 158 total green tons being removed with 19 green tons being from biomass, 0 green tons from pulpwood, 79 green tons from chip and saw, and 60 green tons from sawtimber. In total 242 green tons were harvested from the tract with 30 green tons coming from biomass, 23 green tons from pulpwood, 130 green tons from chip and saw, and 60 green tons from sawtimber.
Stand 3's biomass inclusion harvest (M5) resulted in an average dbh of 4.87 inches with an average tree height of 31.2 feet after year 8. There were approximately 38 total green tons harvested at that time, all of which were designated as biomass. At year 16 a 2nd thinning resulted in an average dbh of 8.68 inches and an average height of 61.2 feet. Approximately 88 total green tons were removed with 12 green tons coming from biomass, 25 green tons from pulpwood, 50 green tons from chip and saw, and 1 green ton coming from sawtimber. Final harvest at year 28 resulted in an average dbh of 10.82 inches and 81.9 feet for an average height. Approximately 153 total green tons were removed with 18 green tons coming from biomass, 0 green tons from pulpwood, 89 green tons from chip and saw, and 46 green tons coming from sawtimber. In total 278 green tons were removed from the stand during the three harvests, with 67 green tons coming from biomass, 25 green tons from pulpwood, 138 green tons from chip and saw, and 48 green tons from sawtimber.
Conventional Ptaeda model for Stand 3 that did not include a biomass harvest, also known as one thinning (M6), had an average dbh of 6.57 inches and an average height of 41.7 feet after the 1st thinning at year 16. There were approximately 84 total green tons harvested, 11 green tons came from biomass, 43 green tons from pulpwood, 30 green tons from chip and saw, and 0 green ton from sawtimber. Final harvest at year 28 resulted in an average dbh of 8.96 inches and an average height of 62.9 feet. One hundred and fifty four total green tons were removed from the final harvest with 19 green tons coming from biomass, 5 green tons from pulpwood, 97 green tons from chip and saw, and 33 green tons from sawtimber. In total 237 green tons were harvested from the tract with 30 green tons coming from biomass, 47 green tons from pulpwood, 127 green tons from chip and saw, and 33 green tons from sawtimber.
Although M1 had slightly higher total and biomass tonnage overall, M3 was a close second and produced the most sawtimber in the final harvest by 32 green tons over M1. All models which included the biomass thinning produced more total weight, biomass tonnage, and sawtimber tonnage than the alternative model with the same spacing. Model 5 had the smallest net gain in the above-mentioned product classes with approximately 15 more green tons of sawtimber, 37 more green tons of biomass, and 41 more green tons in overall volume than in comparison to M6. Stand's 1 and 3 had higher chip and saw volumes in the biomass thinning models, however, Stand 2 did not. M6 and M2 had the two highest pulpwood volumes which were expected since they produced the least in all other product classes. Overall M2, the conventional stand with regards to spacing and harvest regime, performed the worst with regards to total volume produced.
Ptaeda Model Prices
All costs occurred at establishment for all models, regardless of harvest type or spacing configuration. Differences in cost pricing were due to the number of trees planted therefore resulting in Stand 1 and Stand 3's costs to be –$354.79 an acre at year 0 while Stand 2's costs were only –$345.98 an acre at year 0 (See Tables 3–5). Information regarding small-scale machine harvesting costs are not currently available therefore only costs incurred by the landowner could be calculated.
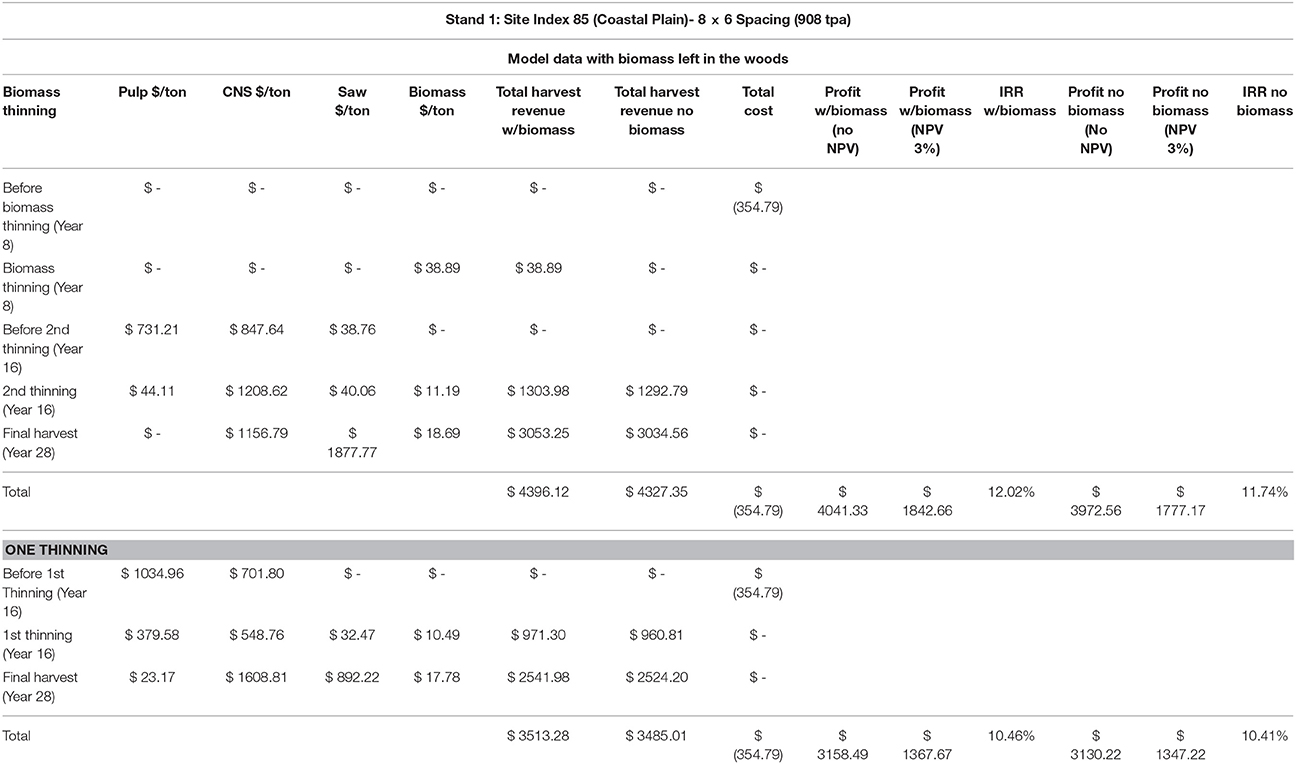
Table 3. Pricing and Revenues for Stand 1.
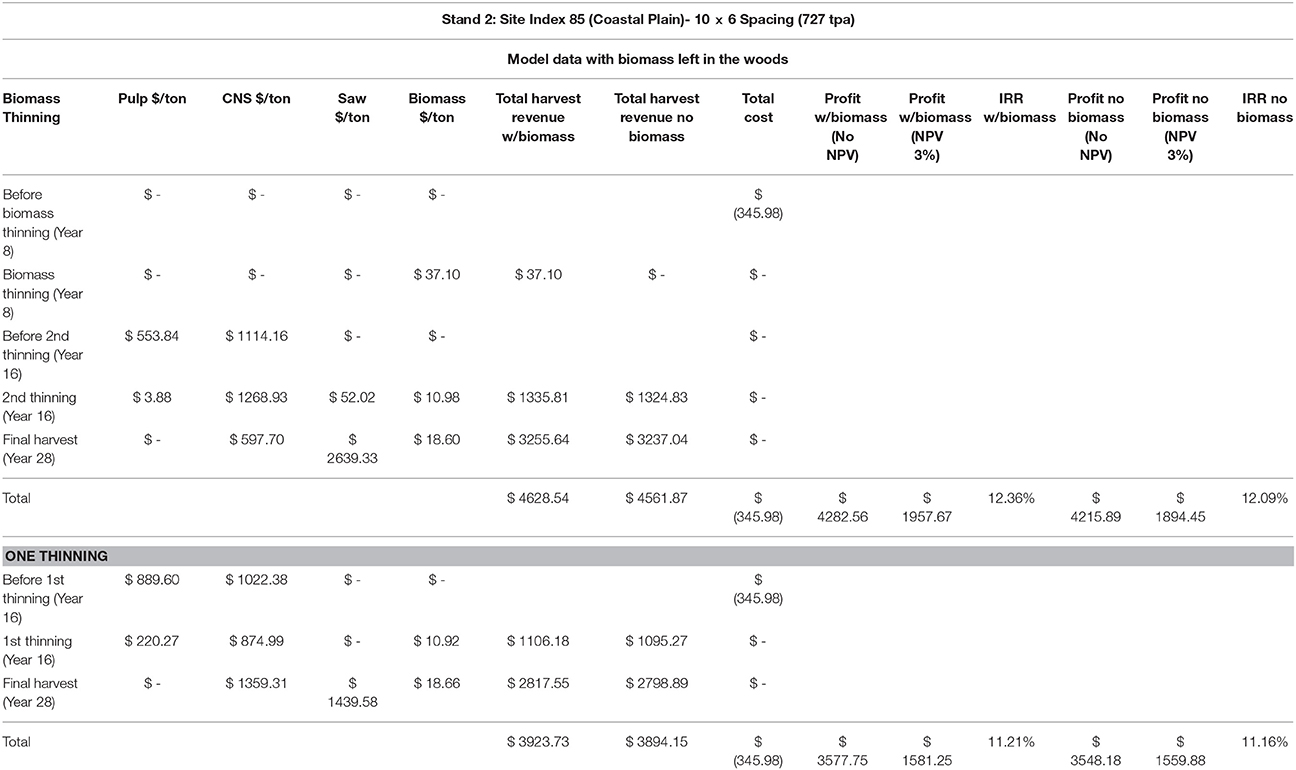
Table 4. Pricing and Revenues for Stand 2.
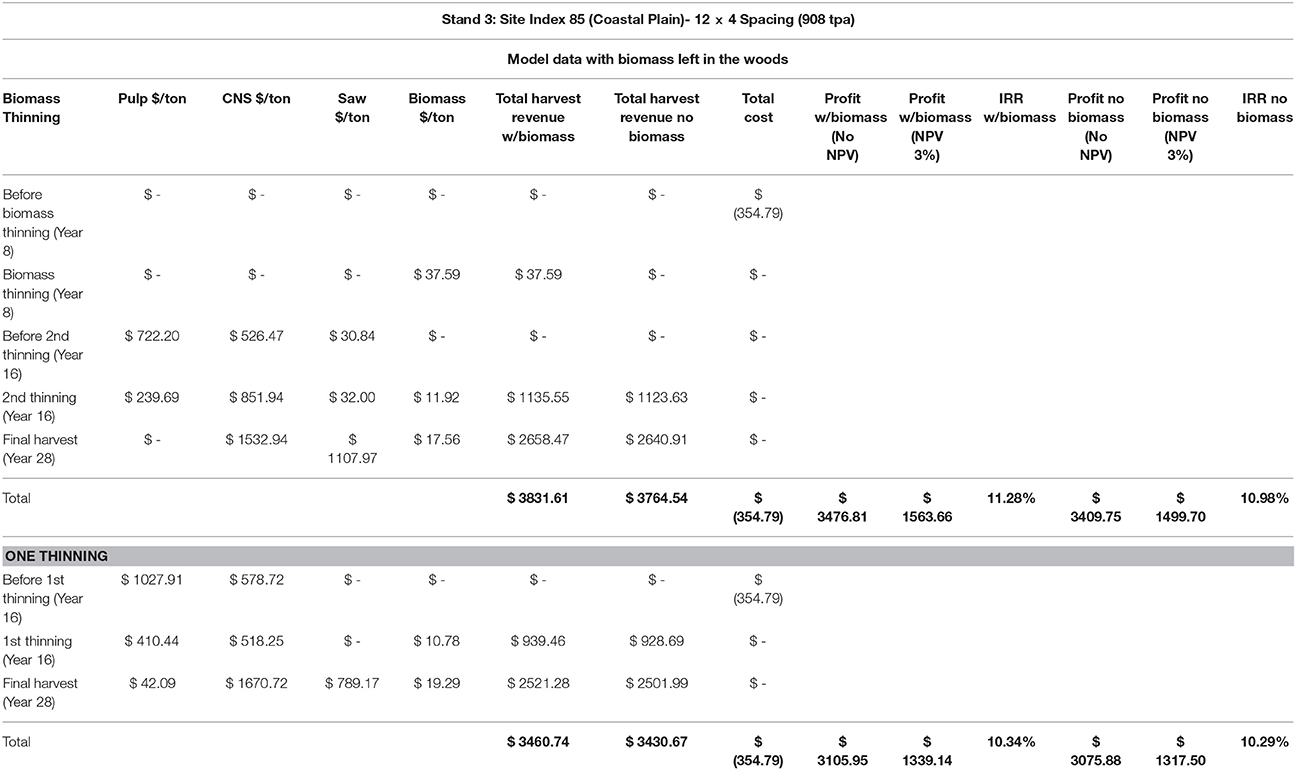
Table 5. Pricing and Revenues for Stand 3.
Overall profit was calculated for each harvest regime within each stand. Additionally, profits were calculated to both include as well as exclude profits from woody biomass to demonstrate the differences in revenue and final profits. This exclusion of biomass prices still assumed that the biomass was harvested at each cut, however, no profit was received by the landowner for this product. Profits for M1 were $4041.33 an acre when biomass was included and $3972.56 an acre without biomass prices included. M2 received $3158.49 an acre for harvests with biomass and $3130.22 an acre for harvests without biomass payment.
Profits for M3 were $4282.56 an acre when biomass was included and $4215.89 an acre without biomass prices included. M4 received $3577.75 an acre for harvests with biomass and $3548.18 an acre for harvests without biomass payment. Profits for M5 were $3476.81 an acre when biomass was included and $3409.75 an acre without biomass prices included. M6 received $3105.95 an acre for harvests with biomass and $3075.88 an acre for harvests without biomass payment.
Overall profit with a net present value at 3% was calculated to demonstrate to landowners what today's value of harvesting would be for all six model types. Three percent was used specifically for landowners to be able to compare results against today's interest rates. NPV's for M1 was $1842.66 an acre when biomass was included and $1777.17 an acre without biomass prices included. M2 received $1367.67 an acre for harvests with biomass and $1347.22 an acre for harvests without biomass payment.
NPV's at 3% for M3 was $1957.67 an acre when biomass was included and $1894.45 an acre without biomass prices included. M4 received $1581.25 an acre for harvests with biomass and $1559.88 an acre for harvests without biomass payment. NPV's for M5 was $1563.66 an acre when biomass was included and $1499.70 an acre without biomass prices included. M6 received $1339.14 an acre for harvests with biomass and $1317.50 an acre for harvests without biomass payment.
Internal rates of return were calculated for each stand's model to demonstrate the exact discount rate that would be received by a landowner when net present value for the investment was zero. This method of evaluating capital expenditure proposals was chosen to more accurately depict potential benefits for landowners with regards to their investments choices with the 6 model options. IRR for M1 was 12.02% when biomass was included and 11.74% without biomass prices included. M2 received 10.46% for harvests with biomass and 10.41% for harvests without biomass payment.
IRR for M3 was 12.36% when biomass was included and 12.09% without biomass prices included. M4 received 11.21% for harvests with biomass and 11.16% for harvests without biomass payment. IRR for M5 was 11.28% when biomass was included and 10.98% without biomass prices included. M6 received 10.34% for harvests with biomass and 10.29% for harvests without biomass payment.
Overall, M3 procured the highest values in all categories with M1 a close second. M3 was third with regards to highest overall values, however, it was first in the one thinning category indicating that Stand 2 produced the highest profits in total. Stand 1 had the greatest variation between biomass thinning values vs. one thinning values while Stand 3 had the least variation. Comparing IRR values for biomass thinning with biomass vs. one thinning without biomass resulted in Stand 1 having the greatest variation at 1.61%, Stand 2 with a variation of 1.2%, and Stand 3 with a variation of 0.99%. Similar trends can be seen when comparing profits without NPV and profits with a 3% NPV for biomass thinning's with biomass vs. one thinning's without biomass in all stands.
Discussion
ArborGen's high-density planting technique of using OP trees in-between rows of MCP improved trees provides landowners with an excellent solution for today's plantation establishment concerns. By inter-planting non-genetically enhanced trees to be harvested for biomass or pulpwood, landowners are able to save money while still promoting larger volumes in sawtimber harvests in the final year as was seen in both the field study and Ptaeda model. Stand 2 was able to produce 10 green tons more biomass per acre than Stand 1 in the field study and was only 2 green tons less in the biomass thinning Ptaeda model. When market prices increase for woody biomass in the southeastern part of the United States, FlexStands™ will be a viable option for landowners to increase their revenue.
Until that time, adding a biomass thinning to a FlexStand™ has already shown to increase final sawtimber volumes, as was seen when comparing the additional 32 green tons gained per acre from M3 vs. M1 in the sawtimber product class. This is a significant amount of volume added on a per acre basis. When assuming landowner's minimum acreage is 20 acres and multiplying that by the additional 32 green tons, that's an additional 640 green tons of wood to be sold at sawtimber prices which can make a significant impact on a landowner's final revenue value. IRR was also seen to be 0.36% higher in comparison to a conventionally spaced tract of land, all of which can add up in the long run.
FlexStands™ also positively promote the use of small-scale harvesting during the stands initial thinning's as was observed during the field study where less than 1% damage was incurred in Stand 2. This is believed to be due to the wider spacing configuration which allowed the smaller machines to maneuver in-between rows easier than in conventional spacing with standard sized machines. Although Stand 1 had less than 5% damage throughout the stand, all of the damage incurred was due to the narrow row widths. Having standard sized machines would have likely resulted in significantly higher damage percentages resulting in fewer trees reaching sawtimber status. Even though no field studies were conducted using rectangularity, it can be inferred from the field studies above that less damage would have incurred in-between rows since spacing widths are even wider.
The Ptaeda model study resulted in rectangularity being the least favored in comparison to all other stands, however, it should be noted that when a biomass thinning was included, M5 still produced the third largest tonnage for biomass and total volumes. M5 also came in fourth in sawtimber volumes behind M4 and was fourth largest in profit and IRR values indicating this method is still a plausible option for landowners to increase their overall volumes and revenues. This option is best suited for landowners who do not wish to use small-scale harvesting machines but instead would rather harvest with standard sized machines throughout the life-cycle of the plantation.
T-tests within the field study depicted no statistical difference between any of the variables except between the weight of Stand 1 and Stand 2 with Stand 1 weight being greater. An explanation for this difference is not currently available. All trees were planted the same time of year in similar site and soil conditions. They came from the same nursery, were both OP designated trees, and received the same moisture amounts once planted. DBH was also slightly greater for Stand 1 however this number was not found to be statistically significant. Interestingly, tree height averages were slightly higher for Stand 2, however this number was also not found to be significant. Further research needs to be conducted to understand the differences in weight between the two stands.
Overall, both the field and modeling study verified that harvesting with one thinning only and using a conventional planting establishment regime will result in lower total harvested volumes. Incorporating a biomass thinning into a stands management plan will produce the highest volumes in regards to overall biomass, sawtimber, and total harvest volumes. This management style will also provide landowners an additional year of revenue to assist with establishment costs and further minimize the risk of waiting for final harvest. Once the biomass market becomes viable, landowners and loggers alike will reap the benefits of the increased revenue.
Conclusion
As times continue to constantly change, so do our techniques and technology we use for loblolly pine plantation establishment and thinning's. Incorporation of biomass thinning harvests, alternative plantation spacing dimensions, and small-scale harvesting machines during initial thinning's all have the potential to provide the landowner with increased total volumes and more specifically increased sawtimber volumes. This increase in volume not only benefits the landowner but also the logger harvesting the unit. The additional volume provides an alternate incentive for incorporating biomass harvests or high density plantings into plantation establishment until market prices rise for woody biomass.
Author Contributions
MD wrote this article. TG is for proofreading and providing primary input. TM, DM, and BV all assisted in providing input regarding the experimental design of the study.
Conflict of Interest Statement
The authors declare that the research was conducted in the absence of any commercial or financial relationships that could be construed as a potential conflict of interest.
The reviewer, JT, and handling Editor declared their shared affiliation.
References
Aguilar, F. X., Daniel, M., and Cai, Z. (2014). Family-forest owners' willingness to harvest sawlogs and woody biomass: the effect of price on social availability. Agric. Resour. Econ. Rev. 43, 279–299. doi: 10.1017/S1068280500004329
Aguilar, F. X., Daniel, M. J., and Narine, L. L. (2013). Opportunities and challenges to the supply of woody biomass for energy from Missouri nonindustrial privately owned forestlands. J. For. 111, 249–260. doi: 10.5849/jof.13-009
Amateis, R. L., and Burkhart, H. E. (2012). Rotation-age results from a loblolly pine spacing trial. South. J. Appl. For. 36, 11–18. doi: 10.5849/sjaf.10-038
Amateis, R. L., Burkhart, H. E., and Carlson, C. A. (2009). Does row orientation affect the growth of loblolly pine plantations? South. J. Appl. For. 33, 77–80. Available online at: https://www.researchgate.net/profile/Harold_Burkhart/publication/233549057_Does_Row_Orientation_Affect_the_Growth_of_Loblolly_Pine_Plantations/links/57af32a708ae0101f1772c98/Does-Row-Orientation-Affect-the-Growth-of-Loblolly-Pine-Plantations.pdf
Amateis, R. L., Radtke, P. J., and Hansen, G. D. (2004). The effect of spacing rectangularity on stem quality in loblolly pine plantations. Can. J. For. Res. 34, 498–501. doi: 10.1139/x03-210
ArborGen Inc. (2018). SuperTree Seedlings - Higher Genetics for the Best ROI Available [WWW Document]. SuperTree Seedl. Available online at: http://supertreeseedlings.com/ (Accessed May 5, 2018).
Athanassiadis, D. (1997). Residual stand damage following cut-to-length harvesting operations with a farm tractor in two conifer stands. Silva Fennica 31, 461–467.
BBI International (2017). U.S. Biomass Facilities [WWW Document]. Biomass Mag. - Latest News Biomass Power Fuels Chem. Available online at: http://biomassmagazine.com/plants/listplants/biomass/US/page:1/sort:state/direction:asc (Accessed November 14, 2017).
Botard, S., Aguilar, F. X., Stelzer, H., Gallagher, T., and Dwyer, J. (2015). Operational costs and sensitivity analyses of an integrated harvest of solid hardwood products and woody biomass: case study in central Missouri. For. Sci. 61, 1058–1067. doi: 10.5849/forsci.14-080
Brand, M. (2012). Effects of Tree Planting Rectangularity on the Wood Quality and Growth of Lodgepole Pine (Pinus contorta) in Sweden. Thesis, Swedish University of Agricultural Sciences.
Burdg, T., and Gallagher, T. (2011). Improved Skidding for Small-Scale Biomass Harvesting Systems. Québec City, QC: Council of Forest Engineering.
Butler, B. J. (2008). Family Forest Owners of the United States, 2006. United States Department of Agriculture.
Butler, B. J., and Butler, S. M. (2016a). Family Forest Ownerships With 10+ Acres in the Southern United States, 2011–2013 (No. NRS-RN-245). Newtown Square, PA: U.S. Department of Agriculture, Forest Service, Northern Research Station.
Butler, B. J., and Butler, S. M. (2016b). Family Forest Ownerships with 10+ Acres in the United States, 2011–2013 (No. NRS-RN-246). Newtown Square, PA: U.S. Department of Agriculture, Forest Service, Northern Research Station.
Butler, B. J., and Leatherberry, E. C. (2004). America's family forest owners. J. For. 102, 4–14. Available online at: https://www.nrs.fs.fed.us/fia/topics/nwos/documents/jof_102_7_4-9.pdf
Caterpillar (2018). CAT Heavy Equipment/Heavy Machinery, Caterpillar [WWW Document]. Available online at: https://www.cat.com/en_US/products/new/equipment.html (Accessed May 5, 2018).
Daniel, M. J. (2012). Social Availability of Woody Biomass for Renewable Energy: Missouri Non-Industrial Private Forest Landowners Perspective. University of Missouri–Columbia.
Dean, T. J., and Baldwin, V. C. (1993). Using a Density-Management Diagram to Develop Thinning Schedules for Loblolly Pine Plantations (No. SO-RP-275). New Orleans, LA: U.S. Department of Agriculture, Forest Service, Southern Forest Experiment Station.
Deere and Company (2018). Forestry Equipment, John Deere US. Available online at: https://www.deere.com/en/forestry/(Accessed May 5, 2018).
Dooley, E., and Barlow, R. (2013). Costs and Trends of Southern Forestry Practices 2012. Available online at: http://www.aces.edu/pubs/docs/F/FOR-2001/FOR-2001-low.pdf
Gallagher, T. V., Kantavichai, R., and Teeter, L. D. (2017). An economic analysis of incorporating biomass thinning into loblolly pine plantations in Alabama. Open J. For. 7, 172–187. doi: 10.4236/ojf.2017.72011
Gerrand, A. M., and Neilsen, W. A. (2000). Comparing square and rectangular spacings in Eucalyptus nitens using a Scotch plaid design. For. Ecol. Manag. 129, 1–6. doi: 10.1016/S0378-1127(99)00166-8
Lancaster, J. (2017). Whole Tree Transportation Method for Timber Processing Depots. Thesis, Auburn University.
Ma, P. T. L.-A. (2014). Growth Responses of Genetically Improved Open Pollenated, Full-Sibling, and Clonal Loblolly Pine to the Flexstand™ Silvicultural System. Thesis, Clemson University.
Mitchell, D., and Gallagher, T. (2007). Chipping whole trees for fuel chips: a production study. South. J. Appl. For. 31, 176–180. doi: 10.1093/sjaf/31.4.176
Sharma, M., Burkhart, H. E., and Amateis, R. L. (2002). Spacing rectangularity effect on the growth of loblolly pine plantations. Can. J. For. Res. 32, 1451–1459. doi: 10.1139/x02-079
Timber Mart South (2018). TimberMart-South, South-wide Average Prices [WWW Document]. Available online at: http://www.timbermart-south.com/prices.html (Accessed May 13, 2018).
Keywords: flex plantations, rectangularity, small-scale harvesting, woody biomass, Ptaeda modeling
Citation: Daniel MJ, Gallagher T, Mitchell D, McDonald T and Via B (2018) Changing Times: Altering Establishment Spacing, Harvesting Frequency, and Harvesting Machines to Promote Increased Sawtimber Volumes. Front. Energy Res. 6:61. doi: 10.3389/fenrg.2018.00061
Received: 13 December 2017; Accepted: 08 June 2018;
Published: 27 June 2018.
Edited by:
Allison E. Ray, Idaho National Laboratory, United StatesReviewed by:
Jaya Shankar Tumuluru, Idaho National Laboratory, United StatesSudhagar Mani, University of British Columbia, Canada
Copyright © 2018 Daniel, Gallagher, Mitchell, McDonald and Via. This is an open-access article distributed under the terms of the Creative Commons Attribution License (CC BY). The use, distribution or reproduction in other forums is permitted, provided the original author(s) and the copyright owner are credited and that the original publication in this journal is cited, in accordance with accepted academic practice. No use, distribution or reproduction is permitted which does not comply with these terms.
*Correspondence: Marissa “Jo” Daniel, mzd0060@auburn.edu