The Best (and Worst) of GHG Emission Trading Systems: Comparing the EU ETS with Its Followers
 Simone Borghesi
 Massimiliano Montini
- University of Siena, Siena, Italy
The European Emission Trading System (EU ETS) is generally considered as the prototype system for the other Emission Trading Systems (ETSs) for the reduction of greenhouse gases (GHGs) that are rapidly spreading around the world. To get a deeper understanding on the actual capacity of the EU ETS to stand as a model for the other ETSs, the present paper discusses the differences and similarities of the EU ETS with respect to the other main ETSs and the emerging trends that these systems seem to share, comparing the different cap-and-trade regimes in order to identify the best practices and the desirable features that future ETSs should have. As emerges from the comparative analysis performed in this article, although the followers share some common flaws with the EU ETS, they have also shown the capacity to innovate and possibly devise alternative ways to manage their own ETS regimes, which may in the long term jeopardize the EU leadership in the ETSs context.
Introduction
Emission Trading is generally regarded as the main application of market-based instruments to environmental issues. Emission Trading Systems (ETSs) have been extensively applied since the 1970s to solve many air and water problems (see below). In recent years, particular attention has been devoted to the European Union Emissions Trading System (EU ETS) to reduce climate change. A large body of the literature has investigated the properties of this system from a legal, economic, and institutional viewpoint (see Grubb and Neuhoff, 2006; Tietenberg, 2006; Ellerman et al., 2007; Kruger et al., 2007; Freestone and Streck, 2009; Grubb, 2009; Tuerk et al., 2009; Convery et al., 2010; Ellerman, 2010; OECD, 2011; Olmstead and Stavins, 2012; Burtraw et al., 2013; Delbeke and Vis, 2015), while other studies have investigated its environmental effectiveness (cf., for example, Anderson and Di Maria, 2011; Rogge et al., 2011a,b; Germà and Stephan, 2015; Calel and Dechezleprêtre, 2016). Following the introduction of the EU ETS, several other ETSs have been implemented around the world to reduce greenhouse gas (GHG) emissions.
The aim of this paper is to emphasize the main lessons learnt and the emerging trends of the EU ETS as well as of other relevant ETS regimes, comparing the different systems in order to identify the best practices and the desirable features that future ETS should have. Other studies (e.g., Betz and Sato, 2006; Perdan and Azapagic, 2011; Newell et al., 2013; Schmalensee and Stavins, 2015; PMR (Partnership for Market Readiness) and ICAP (International Carbon Action Partnership), 2016) have analyzed the existing GHG ETSs pointing out the lessons that can be learnt by each of them. The present paper differs from these studies in two main respects. In the first place, while most studies have mainly focused on the influence that the EU ETS has had on the design of the other ETSs, this work emphasizes the possible existence of a mutual learning process: the EU ETS can (or should) learn from specific features of the others as much as the others have learned in this field from the European Union (EU) in the past. In the second place, it provides a comparison among existing ETSs in a historical perspective underlining the change of leadership (from US to EU) that occurred in the past and the possible new change (from EU to other, possibly linked, ETSs) that might occur in the future. This seems particularly relevant given the increasing importance that ETSs are expected to have among the climate change policies in the future.
To investigate the issue described above, the structure of the paper is the following. Section 2 briefly reviews the origin of the EU ETS in a historical perspective, which has seen the EU changing its role from follower of the early experiences in the United States (US) to forerunner at the international level in the implementation of this instrument. Section 3 discusses the main characteristics of the EU ETS as it currently stands, pointing out the lessons learnt from its implementation. Section 4 analyzes the effectiveness of the EU ETS in promoting technological innovation and in reducing GHG emissions, on the basis of the early experience provided by the first two application periods. Section 5 describes the worldwide sprawling of the ETS, looking in particular at some selected “followers” of the EU ETS, which seem to be quite comparable with the European prototype, namely the Regional Greenhouse Gas Initiative (RGGI) introduced in the Eastern part of the US, and the cap-and-trade systems of California and Quebec.1 Section 6 discusses a few emerging trends that are common to the various ETSs taken into account and the current prospects for ETS cooperation and coordination in the future. Section 7 summarizes the best and worst features of the ETSs examined in the paper, drawing attention on the main positive and negative aspects that emerge from in the application experiences discussed above. The final section concludes emphasizing some important elements that can be drawn from the comparative analysis performed in the paper.
The EU ETS: From Follower to Forerunner
Following the introduction of the Clean Air Act, in the 1970s, the first cap-and-trade systems were introduced in the USA to curb air emissions. These early experiences were so successful that other countries decided to implement their own ETSs to address various environmental problems. For instance, Australia has made extensive use of tradable allowances to reduce water pollution and consumption since the early 1990s (Borghesi, 2013), while the United Kingdom (UK) introduced in 2002 the first broad application of a GHG trading scheme (Smith and Swierzbinski, 2007).
The EU, on the contrary, for a long time preferred a policy approach that was more based on a “command and control” environmental regulation, at least until the 1990s, when the European Commission firstly promoted the adoption of a EU-wide carbon tax. Although this proposal was eventually abandoned, mainly because of the strong opposition of the European industrial sector, this marked an important change in the European attitude on the appropriate environmental policy instruments and in the following years the EU started to progressively shift toward a larger adoption of market-based instruments (Grubb et al., 2014).
Subsequently, the EU, following the US experience in the application of the ETS to air emissions, introduced its own ETS by Directive 2003/87/EC (2003). The EU ETS was initially applied to CO2 emissions and a few sectors only (energy activities – such as oil refineries – production and processing of ferrous metals, mineral industry, pulp, and paper industry). Later, Directive 2008/101/EC (2008) extended the scope of application of the EU ETS to the aviation sector, so that emissions produced by all flights from, to, and within the European Economic Area (i.e., the 28 EU Member States (MS), plus Iceland, Liechtenstein and Norway) should have being covered by the EU ETS, as of 2012.2 Subsequently, Directive 2009/29/EC (2009) revised the whole EU ETS scheme, further extending its scope of application to additional sectors (petrochemicals, ammonia, aluminum) and gases (N2O and PFCs).
The progressive change of the environmental policy strategy adopted by the EU has eventually led the EU to overtake the US in the use of the ETS as the main policy tool. Indeed, while the EU kept on extending the EU ETS up to its present record dimensions, in the US ETSs for GHGs are applied only in some regions (i.e., California and some of the Northeast and Mid-Atlantic States) and not to the US as a whole.3 As a consequence, the EU and the US ended up inverting their positions in the international arena: the EU passed from follower to forerunner in the application of ETSs, while the opposite happened to the US.
This process was correctly described by Ellerman (2010) as a change in leadership in terms of environmental policies at a global level so that most countries, including the US itself, consider the EU ETS as a prototype to be followed in the ETS field. However, some criticalities that emerged in the functioning of the EU ETS, together with the rapid evolution of ETSs around the world, cast some doubts on the capacity of the EU to maintain its leadership and stay ahead of the chasing group in the years to come. To get a deeper understanding on this issue, in the next paragraphs we try to emphasize the main lessons learnt from the application of the EU ETS and compare it with the trends emerging in the other ETSs around the world.
The EU ETS: Features and Problems
The analysis of the EU ETS Directive in the first two phases of application (2005–2007 and 2008–2012)4 shows some remarkable achievements, but also a few important shortcomings.
The main achievement of the EU ETS is given by the records it established, as it is so far the largest carbon market in the world and the first transboundary cap-and-trade system. In fact, the giant European market includes 31 countries (the 28 EU MS plus Iceland, Liechtenstein, Norway) and covers more than 11,000 installations. The unexpected capacity of the EU to establish such a broad system in a relatively short time is by far the most important feature that distinguishes the EU ETS from previous experiences in this field. The advantage of such a large market size goes far beyond all the other well-known theoretical advantages of an ETS system, such as the induced technological innovation, the concrete application of the “polluter pays” principle as well as the increased flexibility as compared to traditional command and control instruments. The large scope of the EU ETS market, in particular, enhances competition among the economic actors involved and broadens the possibility to find buyers for the available allowances, thus encouraging participants to pursue eco-innovation patterns aimed at increasing emissions reductions. Moreover, the EU ETS has also a symbolic value, which goes beyond purely economic considerations and demonstrates the will of the EU to stand as a leader in the international environmental policy context. This leading attitude, which the EU showed in the past with regard to command and control tools, now extends to the use of market-based instruments that were once a prerogative of the US.
On the other hand, some shortcomings, which tend to weaken its effectiveness, have emerged in the implementation of the EU ETS. More specifically, it is possible to identify three main problems that have hindered the functioning of the system in the first two phases: (i) price volatility, (ii) governance problems, and (iii) monitoring problems.
First, a high price volatility characterized the first two phases of the EU ETS (2005–2012, see Figure 1).5 The observed price volatility increased uncertainty among the firms operating on the EU ETS, which may have induced some of them to postpone costly investments in low-carbon technologies in the absence of stable market price signals (Gronwald and Ketterer, 2012; Gronwald and Hintermann, 2015). In the initial phase (2005–2007), this price volatility was mainly caused by an over-allocation of emission allowances. Furthermore, the latter could not be banked since the regulator wanted to keep Phase II (which coincided with the first Kyoto compliance period (CP) starting in 2008) separated from Phase I, the pilot program period. This idea, which in principle appeared a perfectly logical way of introducing a new system in a progressive way, however, had detrimental effects on the price of the allowances: spot prices collapsed basically to 0, at €0.06/ton, by the final quarter of 2007, while contract futures prices for Phase II allowances were above €20/ton.6 In the second phase (2008–2012), price volatility was mainly due to a sharp fall in the allowances’ demand deriving from the deep economic crisis.7 Moreover, in the first two phases, the existence of an excessively decentralized system and the presence of too generic rules for the national caps contributed to further augment the oversupply problem.
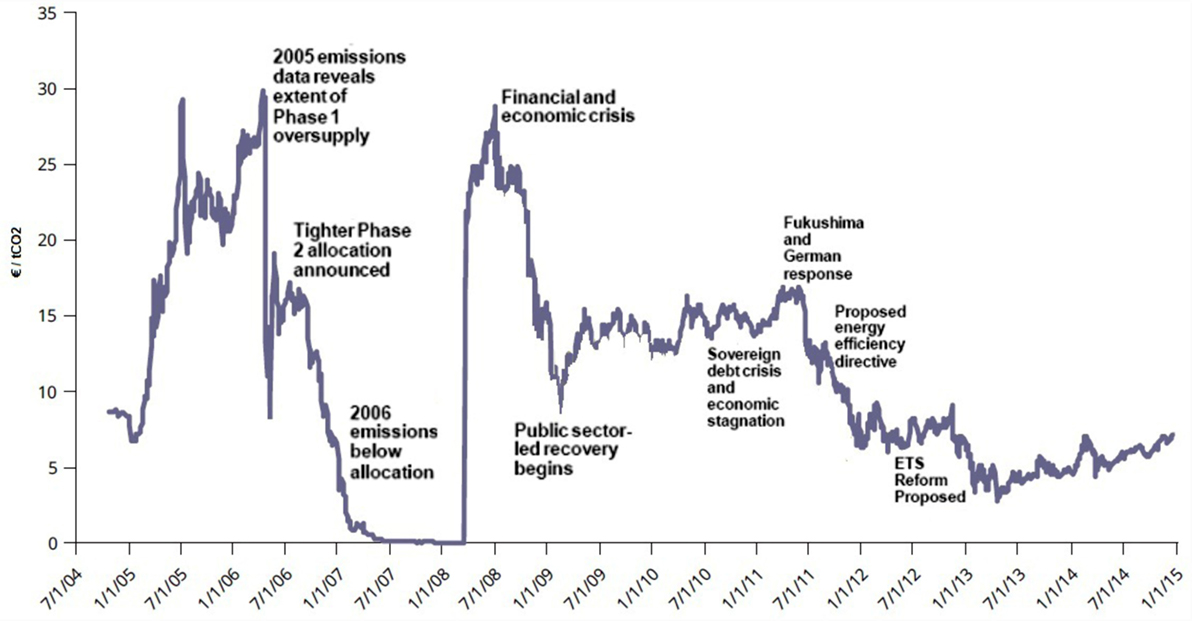
Figure 1. Intertemporal evolution of EUA prices and major events in the period 2005–2015. Source: authors’ own elaboration based on EEA (2015).
This leads us to a second main problem characterizing the EU ETS, particularly in phases I and II, what can be defined as a “governance” problem. Indeed, MS initially had too much freedom in defining the national allocation plans (NAPs) for allowances. As a result, most NAPs ended up allocating too many emission allowances, mainly because of the political pressure on the Governments from interest groups who wanted to receive more allowances (Gilbert et al., 2004; Sijm, 2005). Similarly, over-allocation also characterized the second phase; in such a period, the European Commission asked MS to modify their original NAPs proposals in 11 cases of 12 (with the only exception of the UK), with the effect that the number of emission allowances originally proposed by MS was greatly reduced. Moreover, the existence of too generic rules for the setting of national emission caps caused a lack of adequate stringency of the system. Beyond the differences concerning cap-setting, MS showed also other remarkable differences at the allocation level.8 Thus, for instance, while most MS allocated allowances for free in the initial phase, some MS (Denmark, Ireland, and Lithuania) preferred to auction a share of them to cover administrative costs. Even within the group of countries that allocated allowances for free on the basis of historical emissions (grandfathering), there were remarkable differences on how to cope with the early action problem, namely, the fact that the historic emissions criterion damaged virtuous firms that had already adopted specific measures to reduce their own emissions before the EU ETS was implemented. In this regard, Germany explicitly accounted for this aspect by using a higher compliance factor for early-moving firms, other countries (e.g., Italy) implicitly recognized early actions by using benchmarks that favored efficient allocations, whereas others (UK and Finland) granted no credits for early action simply stating that it was impossible to take it into proper account in an objective way.
National criteria differed also as far as newcomers and closures were concerned. Most MS required allowances to be returned in case of closure of an installation, but in some countries (e.g., Italy, Germany, Austria) allowances could be transferred to a new installation. As Betz et al. (2004) (p. 385) point out, this may alter competition “since by nature only incumbent firms may benefit from such allowance transfers.” As to newcomers, all countries reserved allowances for new entrants, but their share ranged widely from less than 1% of the ET-budget (in Germany, Austria, and Slovenia) to more than 20% in Latvia. Moreover, different countries adopted different kinds of benchmarking for the allocation of new entrants, with some MS using best available technologies as benchmark while others adopting specific emission levels for homogeneous products.
The existence of so many differences on such important aspects could severely alter competition among firms subject to the EU ETS. To address this problem, therefore, Directive 2009/29 abolished the national competence to draft allocation plans and centralized all the relevant EU ETS decision-making power in the hands of the European Commission.
A third main issue that clearly emerged in phases I and II concerned the existence of some monitoring problems and of relevant shortcomings in the functioning of the national registries in some MS. Several frauds occurred in the EU ETS market during the first two phases, which highly undermined the effectiveness of the overall EU ETS showing monitoring and transparency problems. As Frunza et al. (2011) have shown, the volume of allowances being traded in the Paris stock exchange drastically collapsed once the so-called value-added tax (VAT) fraud was discovered.9 As argued by Borghesi and Montini (2014) (p. 118) “this suggests that the permit exchanges in that market were probably spurred more by the illegal activity that took place in the absence of proper regulation, rather than by the actual need to cover emissions.” Monitoring problems, however, were not limited to the VAT fraud but concerned the whole functioning of the online trading system. Thus, for instance, in November 2010 the cement-maker Holcim declared that 1.6 million emission allowances disappeared from its account in the Romanian registry. The same happened in January 2011 to Blackstone Global Ventures, which declared that 475,000 emission allowances had vanished from its account in the Czech Republic, with an estimated total loss of about 7 million euros. As a consequence, many countries (the Czech Republic, Greece, Estonia, Poland, and Austria) temporarily closed their carbon trading registries and the European Commission decided to suspend spot trades (75% of the ETS market) until January 26, 2011.
To properly address these problems, the EU adopted new anti-fraud measures and a new Regulation on registry (EU Regulation 389/2013), replacing national registries with a Union Registry administered at central level by the European Commission.
On the basis of the pros and cons just shown above, even if it cannot be denied, as Ellerman rightly affirmed, that the EU ETS system is to be considered a prototype in the ETS context, this does not mean that the system was immune from relevant shortcomings, which had to be managed and solved through the years in order to increase the effectiveness of the EU cap-and-trade scheme.
Some relevant shortcomings were addressed by EU Directive 2009/29, in particular with regard to the over-allocation and surplus of EUAs. However, the amendments introduced did not solve all the problems related to the surplus of EUAs in the European carbon market, which continued to negatively affect the system and undermine its effectiveness.
In order to address such persistent problems, the European Commission proposed the back-loading initiative, which was adopted by the Council and the Parliament in 2013, with the aim of postponing auctions for 900 million allowances planned for the period 2014–2016, so as to rebalance supply and demand in the EU ETS market and reduce price volatility.10
However, the back-loading initiative was meant to represent just a temporary solution to be used during the EU ETS 3rd phase (up to 2020), and the European Commission clarified from the very beginning that a more structural EU ETS reform was necessary, in order to reduce the EUAs surplus and limit the related negative effects on the functioning of the European carbon market.11 For this reason, in 2014 the European Commission proposed the establishment of a market stability reserve.12 The “Proposal on the market stability reserve” was presented alongside the EU Communication on “A policy framework for climate and energy in the period from 2020 to 2030.” The market stability reserve has a twofold aim. On the one side, it aims at addressing and managing the over-allocation and surplus of EUAs described above. On the other side, it aims at increasing the resilience of the European regime, by adjusting the number of EUAs to be auctioned, depending on various market circumstances. The market stability reserve is meant to operate in an “automatic manner,” on the basis of pre-determined criteria and conditions, which will effectively reduce the discretionary power of the Commission during its implementation, while increasing the overall transparency and effectiveness of the EU ETS. The Proposal on the market stability reserve was approved by the European Parliament on 7 July 2015 and by the Council on 6 October 2015.13 As a consequence, as stated by the Commission, “the market stability reserve shall be established in 2018 and the placing of allowances in the reserve shall operate from 1 January 2019.”14
For the time being, it is impossible to determine whether the back-loading initiative (to be relied upon in the EU ETS third phase) and the market stability reserve (to be relied upon in the EU ETS fourth phase) will be able to successfully address the shortcomings of the European carbon market described above.15 What one can certainly infer from the analysis of the price evolution reported in Figure 1 is that the debate surrounding the decision to implement a market stability reserve had only a marginal effect on the EUA price, which remained rather stable since its initial proposal by the European Commission in 2014. It should be highlighted, however, that the market stability reserve may prove a particularly controversial solution, especially if compared with an alternative option, namely the introduction of a price floor, which might have been chosen instead, in order to reach more or less the same objectives. The European Commission (2012) (p. 10) argued against the introduction of a price floor, claiming that the latter “would alter the very nature of the current EU ETS being a quantity-based market instrument.” According to the Commission, moreover, decisions on the appropriate price floor level would involve substantial government arrangements so that “the carbon price may become primarily a product of administrative and political decisions (or expectations about them), rather than a result of the interplay of market supply and demand”.
As we will see below (see The Other Main ETSs: RGGI, California, and Quebec), a price floor has been commonly adopted by some of the most relevant ETSs currently existing around the world (e.g., the US-based California and RGGI ones) where it proved to be an effective solution to avoid the price collapse observed instead in the EU ETS.
Effects of the EU ETS on Eco-Innovation and Pollution Abatement
Two particularly important aspects for the assessment of the EU ETS performance concern its impact on pollution abatement and on eco-innovation (EI).16 These two issues are strictly related since the environmental effectiveness of the EU ETS (i.e., its capacity to lower GHG emissions) is heavily influenced by its capacity to induce eco-innovations through carbon pricing. The latter can promote the adoption and diffusion of environmental friendly technologies by firms that do not want to pay the costs of purchasing emission allowances and/or that wish to get a first mover advantage by shifting to a new technology before their competitors. This incentive to shift the technological paradigm obviously rises with an increase in carbon price and decreases with a higher price volatility that generates uncertainty on the expected returns of investing in EI.17
In the last few years, a growing number of studies have tried to assess the EI effects of the EU ETS.18 Two main research lines have been adopted for this purpose. Some scholars have based their empirical analyses on surveys of managerial interviews (e.g., Hoffmann, 2007; Aghion et al., 2009; Anderson et al., 2011; Martin et al., 2011; Rogge et al., 2011a,b; Schmidt et al., 2012), while others have tested the weak version of the Porter hypothesis introducing the EU ETS among the covariates of their econometric models (see Abrell et al., 2011; Borghesi et al., 2015; Calel and Dechezleprêtre, 2016).19 Although this literature is still in its early stages of development and mainly focused on the early phases of the EU ETS due to a time lag in the data availability, the main conclusion that seems to emerge so far is that the EU ETS had at most a very weak impact on EI. Innovative investments were probably discouraged by the high price volatility observed in the first phase and by the time initially needed to fully understand and discover the functioning of this relatively new market. But the limited amount of eco-innovations was mainly driven by relatively low emission prices that obviously provided little financial incentives to R&D and/or to the diffusion of mitigating technologies. This weak EI effect of the EU ETS seems to apply to industrial sectors both at the EU level (e.g., Schmidt et al., 2012, for the power sector) and at individual countries level, as suggested by analyses conducted on the Italian cement and ceramic industries (Borghesi et al., 2012), the German electricity sector (Hoffmann, 2007) as well as the paper industry both in Italy (Pontogolio, 2010) and in Germany (Rogge et al., 2011a,b).
While a certain consensus seems to emerge on the (weak) EI effect of the EU ETS in the first two phases, its environmental effectiveness is more controversial. As a matter of fact, it is hard to assess whether the application of the EU ETS can be considered as a main driver of the observed emission reduction or whether there exists a purely spurious correlation between the two events.
Some early studies have produced interesting results that try to address this difficult question focusing on the first EU ETS phase. Performing a counterfactual analysis, for instance, Ellerman and Buchner (2008) estimate that in Phase I CO2 emissions were between 2.4 and 4.7% lower than what they would have been without the EU ETS. A similar conclusion is achieved by Anderson and Di Maria (2011) who estimate that the emission reduction that can be ascribed to the EU ETS was about 2.8%.
Other factors, however, contributed to the emission abatement observed during the implementation of the EU ETS. In particular, an increase in average temperatures and in fuel prices has influenced the reduction in energy consumption and, therefore, also in EU emissions in the last few years (EEA, 2012b, 2013). These factors helped the EU go remarkably beyond the emissions reduction target (−8% by 2012 as compared to 1990) that was agreed under the Kyoto Protocol. The data periodically reported by the European Environment Agency confirm a rapidly declining emissions trend: the overall EU27 GHG emissions were 7.7% below the 1990 levels in 2006, 11.3% below the target in 2008, 18.4% in 2011, 19.2% in 2012, and 20.7% in 2013 (EEA, 2012a, 2013, 2014a,b,c,d). This shows that the Kyoto targets was largely surpassed and that the emission reduction target for 2020 (−20%) has been achieved by the EU much earlier than originally expected.
This overall positive performance, however, hides remarkable differences within the EU between the original EU-15 countries and the new MS that joined the EU after 2004. In fact, in the new MS GHG emissions decreased by 38.5% between 1990 and 2013 as a consequence of the sharp decline of their production levels, whereas in the EU-15 emissions fell by 16.4% in the same period (EEA, 2014e).
Furthermore, the observed emissions abatement has been largely influenced by the deep economic recession that has significantly hit the European industrial production. Indeed, before the crisis, the EU-15 emissions were much above the intermediate target needed to achieve the final Kyoto target. In 2008, when the crisis started to bite, EU-15 emissions were still only 6.5% below the 1990 level (EEA, 2010; Borghesi, 2011). These considerations suggest that the economic recession and the enlargement of the EU to Central and Eastern European countries have certainly played a crucial role in helping the EU achieve the Kyoto Protocol target.
The Other Main ETSs: RGGI, California, and Quebec
While the EU was revising and fine tuning its own ETS, on the basis of the lessons learnt in phases one and two, a wide array of other ETSs emerged around the world. Among them, we will focus in particular on three ETS regimes as they seem to be quite comparable with the EU ETS: the RGGI, the Californian cap-and-trade system, and the Quebec cap-and-trade system.
Several other countries and regions started to implement their own ETS or are planning to do so in the near future, such as Japan (Sopher and Mansell, 2014a), South Korea (Park and Hong, 2014), Kazakhstan (Kossoy et al., 2015), Switzerland (Sopher and Mansell, 2014b), New Zealand, Mexico, Brazil, and so on (Hood, 2010; Newell et al., 2013).20 Among them, particular attention should be devoted to China that between 2013 and 2014 started implementing seven pilot projects in selected cities or provinces (Beijing, Tianjin, Shanghai, Chongqing, Guangdong, Hubei, Shenzhen) with the goal of developing a nation-wide ETS in the future (Ecofys, 2013; Jotzo et al., 2013; De Boer et al., 2015; Kossoy et al., 2015).21 Despite the important role that these Chinese ETS programs may have in the years to come, these pilot programs are still in their early stages and the limited data availability concerning their recent application prevents for the moment a proper comparison with the main ETSs examined here. For this reason, in what follows we will focus mainly on the more advanced ETS experiences of RGGI, California, and Quebec, providing information on and comparisons with the Chinese pilot ETSs whenever possible.
The RGGI is a CO2 Budget Trading Program established as a result of a Memorandum of Understanding signed in 2005 by a group of 10 USA States wishing to develop a Cap & Trade Programme covering the power sector. It started in 2009 and, although quite limited in scope, it represents the first carbon emissions Cap & Trade experience in the USA. After the withdraw of New Jersey in 2011, it currently applies to nine US States (Connecticut, Delaware, Maine, Maryland, Massachusetts, New Hampshire, New York, Rhode Island, and Vermont) and is structured in 3-year CPs, named “control periods”: 2009–2011, 2012–2014, and 2015–2017. It sets an overall multi-State-wide cap on the CO2 allowances distributed among the participating States, which allocate them to the covered installations. Currently, it applies to 168 facilities distributed in the territory of the involved States.
The Californian Cap & Trade System, introduced by the Global Warming Solution Act of 2006, started in 2013 and covers almost 600 facilities, corresponding to 85% of the country’s GHG emissions. It is structured upon three CPs: (1) 2013–2014; (2) 2015–2017; (3) 2018–2020. In particular, in the first period, the scheme covered only the large industry and electricity sectors; while from the second period onward, it has been extended also to fuel transport, distribution, and generation.
The Quebec cap-and-trade system was established in 2011, by the Regulation Respecting a cap-and-trade system for GHG Emission Allowances, and started in 2013. It initially covered almost 80% of Quebec’s GHG emissions, and such percentage has increased up to 85% from 2015. It is structured upon the same three CPs as the Californian Cap & Trade System, namely: 2013–2014; 2015–2017; 2018–2020. In the first CP, the scheme covered industrial and electricity sectors only, while from the second CP onward it has been extended to fossil fuel distribution.
All the ETS regimes described above closely resemble the EU approach to ETS. Table 1 below provides a comparison of the selected ETSs, highlighting the most relevant aspects underlying their design and features. Table A1 in Appendix reports available information on the Chinese pilot projects focusing on the same aspects examined in Table 1 for comparability reasons. For the purpose of the comparative analysis, the EU ETS will be considered as a benchmark against which the other relevant ETSs will be described and assessed.
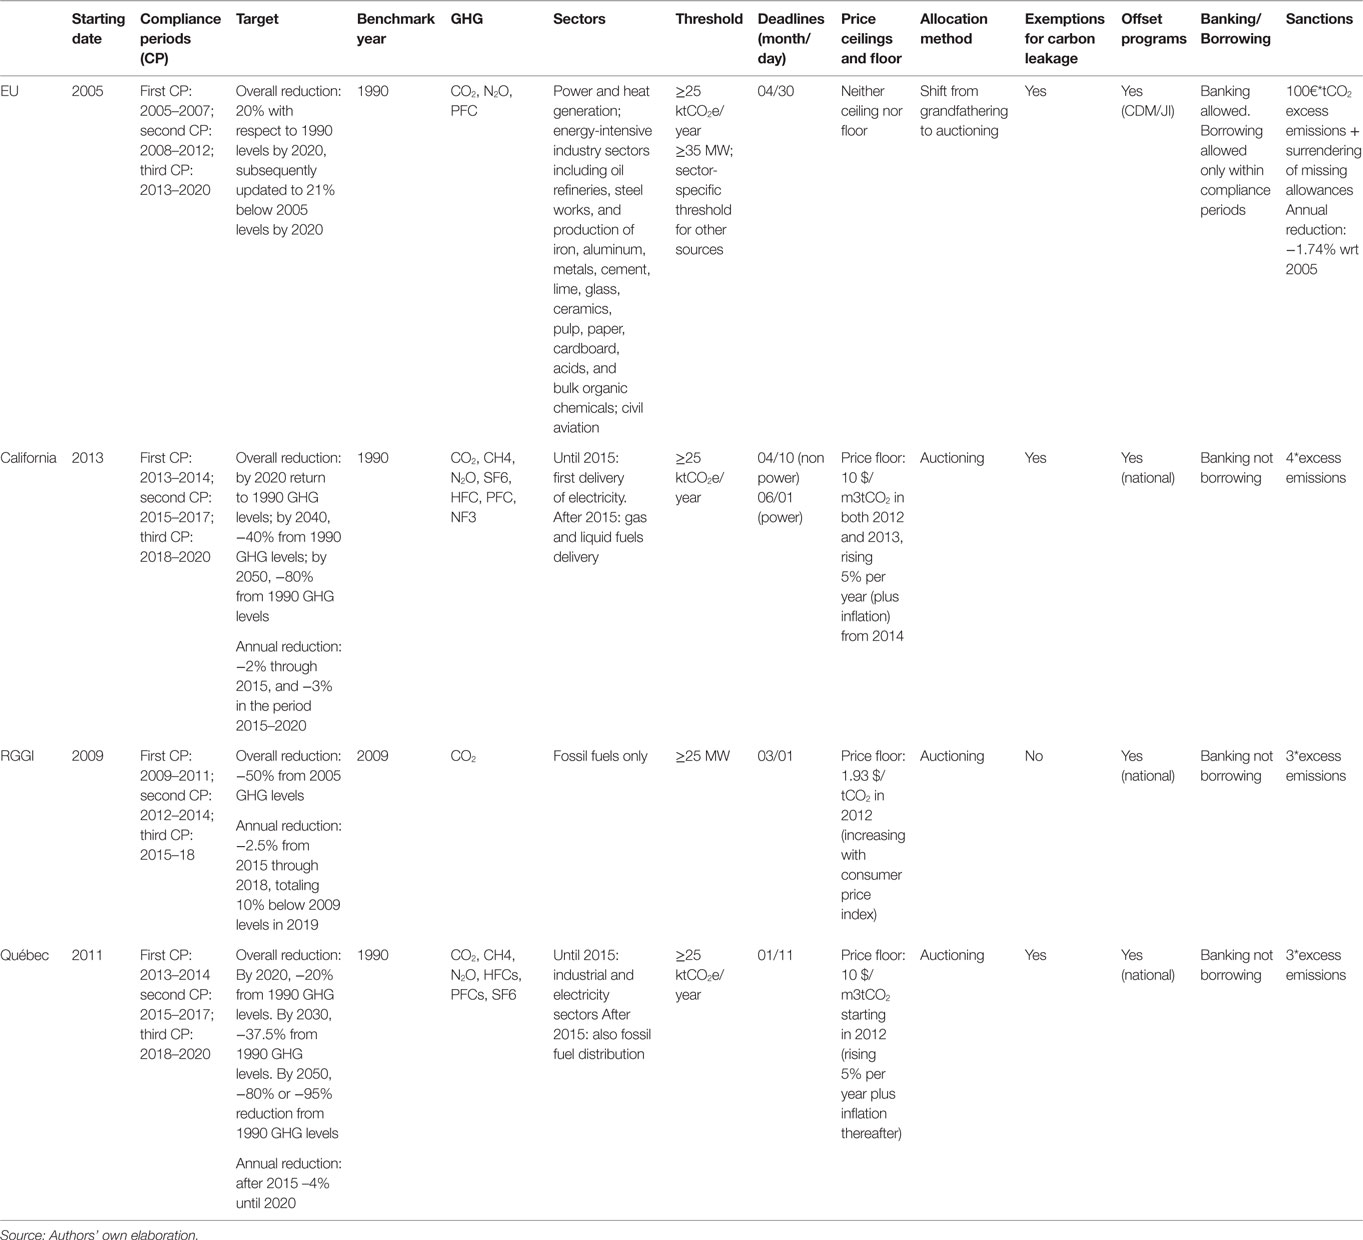
Table 1. The EU ETS and the other main ETSs: a comparison.
Table 1 shows that, as far as their scope is concerned, all ETSs examined here – with the exception of RGGI – present several relevant similarities and common features.
For instance, they all cover a wide range of GHG emissions beyond CO2. In addition to that, following the European model, all the regimes analyzed establish exemptions for installations below certain similar thresholds. Furthermore, all ETSs have been divided in three CPs, although these obviously differ across the various regimes because of their different starting dates (with the exception of California and Quebec that started together and adopted the same CPs).
Moreover, all the ETSs analyzed foresee the possibilities for linking with other project-based GHG emissions offset programs. For instance, the EU ETS allows the use of CO2 reduction units generated through the implementation of the project-based mechanisms foreseen under the Kyoto Protocol (Clean Development Mechanism and Joint Implementation). Following a similar approach, the RGGI, the Californian, and the Quebec cap-and-trade systems allow the use of credits produced from national offset projects carried out in specific sectors.
An additional common feature to most of the ETS analyzed refers to the possibility of applying banking and/or borrowing. In this respect, in line with the EU approach, all the three ETSs analyzed (California, RGGI, and Quebec) allow banking, but not borrowing of the allowances.22 Finally, with regard to the preferred allocation method, a common feature shared by all the regimes taken into account is the progressive shift from grandfathering to auctioning, originally envisaged in the EU ETS.23 Such a shift generated widespread worries within the industrial community of all countries, which led everywhere to the adoption of specific provisions against the risk of delocalization of productive activities toward “ETS-free countries.” In fact, in order to protect the sectors potentially exposed to carbon leakage, all the various ETS, apart from RGGI, include similar exemptions.24
Beside the common features and similarities shown above, a closer look at the ETS regimes taken into account reveals that the followers took a different path on some relevant issues with respect to the pattern set by the EU. As to the sanctioning rules, for instance, while all ETS examined foresee the obligation for non-compliant firms to surrender the missing allowances in a subsequent period, some remarkable differences apply. In fact, the EU ETS provides for the application of a fixed monetary sanction of 100€ for each missing ton, whereas the RGGI, Quebec, and Californian ETSs opted for a different sanctioning regime, establishing that non-compliant firms installations have to return, respectively, three times (for RGGI and Quebec) and four times (for California) as many allowances as those not surrendered in each given period.25 The existence of different sanctioning regimes may imply large differences in the complying costs for the operators being sanctioned. Just to provide an example, consider the current prices of EU ETS, RGGI, and Californian allowances.26 Given the corresponding sanction systems, a firm that emitted 50 tons in excess of the allowances at disposal would have to pay 5274.5€ in the EU ETS, 2164€ in the Californian system while only 693.3€ in the RGGI.
As far as the target setting is concerned, while Quebec has chosen the same target of the EU, corresponding to a −20% emission reduction by 2020 (as compared to 1990 levels), the US-based regimes have chosen different paths (see Table 1). In fact, California merely aims at returning its emissions to the 1990 levels by 2020, while RGGI has chosen a stabilization target for 2014 and a 10% reduction target for 2020 (as compared to 2009 levels). In this regard, the RGGI choice of taking a different benchmark year for its emissions reductions (2009 instead of 1990) makes the systems not fully comparable to the others, while the Californian target of returning to the 1990 level does not appear to be so stringent in absolute terms.27 However, in April 2015, the Californian Governor issued a much more ambitious target, namely, reducing GHG emissions by 40% with respect to the 1990 levels by 2030. This revised target is in line with the EU-28 target for 2030, denoting the desire to converge on common targets in the future across different ETS regimes.
A totally different approach has been adopted, instead, by China where all pilot ETSs have set their own targets in terms of emission intensity reduction (see Table A1 in Appendix). Although abating emission intensity (i.e., emissions per unit of GDP) improves the eco-efficiency of the economic system, this is not comparable to the target of reducing total emissions that has been set by the European and North-American ETSs discussed above. Indeed, a lower emission intensity can be consistent with higher total emissions as long as the latter grow more slowly than GDP. In this sense, while the other main ETSs seem to move in the same direction toward similar or common targets, at the moment the route chosen by the Chinese government deeply departs from that of the others.
Other features of ETS regimes show remarkable differences that set the followers apart from the EU ETS. This applies in particular to the adoption of price floors and ceilings. While the EU ETS has neither a price floor, nor a price ceiling,28 a different choice has been made by the three other ETSs analyzed, which have all chosen an intermediate path, whereby a price floor, but not a price ceiling is provided.29 Having a price floor has proved to be crucially important in particular for the US-based regimes, as both the RGGI and the Californian ETS allowance prices have basically hit the floor in their early stages of application. As emerges from Figure 2 – that compares the price trends of the EUAs, Californian, and RGGI carbon allowances for the period 2008–2015 – the Californian ETS has shown a price volatility that resembles the one characterizing the EU ETS, with the Californian price that has fallen down to $12.22 in August 2013 moving on a declining trend toward its floor (set at US$10/unit in 2012 and increased by 5% plus inflation rate every year). Even in the case of the flatter price trend of the RGGI, it is possible to identify a tendency of the emission price to decline toward the price floor, falling from 2.97 in 2009 to 1.96 in 2010 and tracking the floor price (US$1.86 in 2010 and US$1.89 in 2011) from September 2010 onward. During that period the share of secondary market exchange-based transactions collapsed from 85% in 2009 to 6% in 2011; therefore, the existence of a price floor prevented RGGI price from declining even further. A price floor has been introduced also in the province of Guangdong, which is the largest among the Chinese pilot projects and the first to use auctioning (see Table A1 in Appendix). Also in this case, available evidence confirms the tendency to hit the floor: during the first 5 months of implementation of the project (December 2013–April 2014), the average price [61.8 Chinese Yuan (CNY)] turned out to be very close to the price floor (60 Yuan) initially set by the regulator authority (World Bank, 2014). Even in Guangdong, therefore, the price floor was effective and probably helped agents progressively adapt to the introduction of the new ETS regime. In this regard, it may be argued that the followers of the EU ETS might have actually improved the functioning of their ETS with respect to the original EU model and that the introduction of a similar price floor in the EU ETS would have probably prevented the European price from collapsing.30
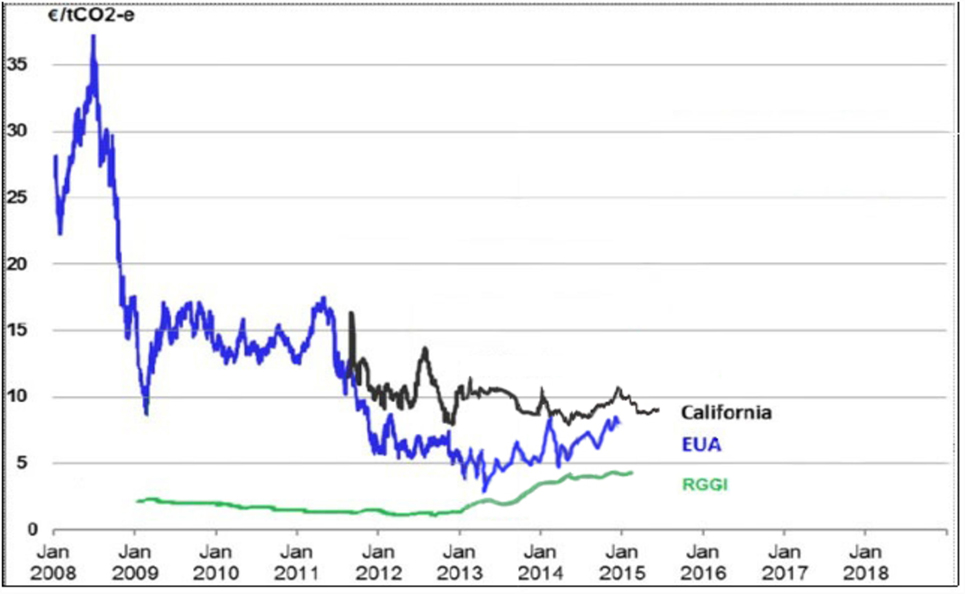
Figure 2. Intertemporal evolution of emission allowance prices on different ETS markets. Source: authors’ own elaboration based on EEX data (https://www.eex.com/en#/en), CARB data (http://calcarbondash.org), and RGGI data (https://rggi-coats.org/eats/rggi/index.cfm?fuseaction=reportsv2.price_rpt&clearfuseattribs=true).
The EU ETS and Its Followers: Common Trends and Linking Perspectives
The analysis performed above has shown many common features in the different ETSs, especially with regard to their scope, allocation method and overall climate change goals to be achieved. As a consequence, a first trend that can be identified is that all the ETSs tend to converge to a common structure. Moreover, the ETS is recognized in all the countries analyzed as a key tool to tackle climate change (Grubb et al., 2014), though not the only one. In fact, all the countries analyzed tend to implement their respective cap-and-trade schemes along with other renewable energy and energy efficiency instruments, within the broader context of their national climate change policy.
Furthermore, another emerging trend is the provision of special, softer regimes, protecting the national industrial sector from the major risks related to the loss of competitiveness as a consequence of the ETS obligations. All the ETSs analyzed (RGGI excluded) endorse this choice, envisaging a direct, free allocation of allowances rather than auctioning, for some exposed sectors, while requiring a rigorous identification of the sectors benefiting from these special regimes (to be determined by the law) and usually providing for these exemption regimes to be temporary.
Finally, all the ETSs analyzed foresee some possibilities of “linking” with other project-based GHG emissions offset programs. For instance, the EU ETS allows installations to use Clean Development Mechanisms and Joint Implementation credits for compliance purposes. Similarly, the RGGI, the Californian, and the Quebec cap-and-trade systems allow the use of credits produced from national offset projects carried out in specific sectors, although the sectors involved differ across the ETSs. Moreover, all the ETSs allowing for such types of linking solutions (i.e., allowing the use of “external” credits for compliance purposes within the ETS), set specific limitations in the amount or percentage of credits that can be used for that purpose, and prescribe specific conditions for the eligibility of the projects generating the offset credits. Notice that if two ETSs are unilaterally linked to an offset market it follows that they will be automatically linked to each other. In other words, unilateral linking of each ETS to common offset programs can generate indirect linking across ETSs.
Beyond this “unilateral” kind of linking, with each ETS recognizing credits produced from various offset projects, another common feature that is emerging among most ETSs is their effort to establish “bilateral” linking. By this, we mean that one ETS can link to another ETS, so that both ETSs involved mutually recognize their allowances as eligible for compliance under either of the two programs, thus enabling a two-way flow of allowances.31 So far, the only existing example of bilateral linking in operation is the one between California and Quebec, which has been established by means of an international agreement signed by the Parties in 2013. However, several other jurisdictions are currently considering the conclusion of similar linking agreements. For instance, the EU had reached a preliminary agreement with Australia for a bilateral linking, to be started in 2018, but this was eventually abandoned due to Australian government’s decision to repeal its ETS legislation after the 2013 elections. As a consequence, the EU is now looking for other partners for the development of bilateral linking agreements that would allow to extend the carbon market and fully exploit the increasing returns to scale that larger markets can generate. The possible emergence of some bilateral linking agreements in the near future has the potential to modify the economic equilibria among the existing ETSs in the years to come. Think, for instance, of the role that the nation-wide Chinese ETS – that is expected to emerge in the near future – would play in the international context. The giant dimension of such a system would make it a very attractive partner for bilateral linkings to expand the number of potential purchasers/sellers of one’s own allowances. A bilateral linking, moreover, would probably help the commercial relationships between the linked countries, further reinforcing the attractiveness of linking to China. For these reasons, we may reasonably expect that in the years to come the main ETS regimes will fight to conquest the most attractive partners (including but not limited to China). This might jeopardize the leadership role played by the EU ETS so far, possibly transforming it from forerunner into follower again.
The Best and Worst of ETSs
The comparative analysis performed in the previous sections highlights positive and negative aspects of the ETSs, some of which are shared by most ETSs, while others represent idiosyncratic features of a single ETS regime. In this section, we briefly summarize these positive and negative aspects, what we somehow ironically call “the best and worst” of the ETSs, to provide a roadmap of what to preserve, extend or change in the future design of the ETSs.
One natural candidate to be introduced in the shortlist of the best features is certainly the existence of heterogeneous installations, coming from different sectors and producing different GHGs. This element plays a crucial role for effective trading as it allows to exploit different marginal abatement costs. In this sense, the progressive extension to additional sectors and GHGs of the EU ETS certainly went in the right direction, while this feature might need to be further developed in other contexts, such as the RGGI that includes only power plants.
Another desirable feature that most ETSs have introduced is the phasing in of auctioning over time. While grandfathering can be initially justified by the desire to prevent a rapid increase in the costs for firms subject to a new ETS, the regulatory authority must clarify from the beginning that a free allocation of allowances can only be a temporary measure and should set a clear intertemporal path toward auctioning. This is not to say that auctioning is the panacea for all problems. Difficulties can arise also in the auctioning design, as is well documented in the ETS literature (e.g., Cramton and Kerr, 2002; Smith and Swierzbinski, 2007). In our opinion, however, setting a clear time plan for the progressive introduction of auctioning can provide an important and credible signal that the new ETS is here to stay, which may induce firms to make plans and investments in eco-innovation in due time.
Another best practice of many ETSs (RGGI excluded) is the introduction of carbon leakage rules. The choice of adopting carbon leakage rules is somehow related to that of auctioning the allowances, though the one does not necessarily imply the other. While auctioning can reduce the risk of windfall profits that may derive from allocating allowances for free, the introduction of carbon leakage rules can lower the risk of delocalization that occurs in the case of unilateral environmental policies. Moreover, while auctioning may provoke the opposition of the industrial sector (that has to pay, differently from what happens with grandfathering), the existence carbon leakage rules can lower this opposition providing the necessary support of the industrial sector to the new instrument. These two measures, therefore, can be seen as complementary instruments that should go hand-in-hand in the design of an ETS. For carbon leakage rules to be credible, the regulator must set ex ante clear and objective criteria to identify the sectors at risk of delocalization. In this sense, the criteria adopted by the EU and California of taking carbon intensity and trade exposure as criteria to exempt from auctioning the sectors at risk of relocation can certainly be useful, although they might need to be partially improved in the future.32 What is to be avoided, instead, is a continuous extension of the sectors included in the list of those at risk of relocation,33 as this would undermine the credibility of the system inducing the perception that carbon leakage provisions are just an escamotage obtained by industrial lobbies to keep receiving allowances for free.
Beyond the risk of production relocation, another kind of leakage may arise in the ETS context. Many of the ETS examined here (e.g., EU ETS and RGGI) are pure source-based cap-and-trade systems that set emission limitation on the emitting facility. This means they do not cover emissions embodied in imports from uncapped regions. In other words, to avoid the costs associated with an ETS, the economic agents can either move their production activity to countries where no ETS is in place or they can simply import goods from such countries. To overcome this problem, the best practice among existing ETSs is probably the “first-seller approach” adopted by the Californian ETS whereby responsibility is assigned to the entity that first imports power into the State’s electricity market (Hobbs et al., 2010). From this viewpoint, the Californian regime can be seen as a hybrid cap-and-trade “combining a source-based approach for in-state resources and emissions accounting for imports in order to limit emissions leakage” (Hobbs et al., 2010, p. 26).
Finally, another important provision for a well-functioning ETS may be given by the existence of de minimis rules for small installations. This provision, which is common to most existing ETSs, can be reasonably justified by the high transaction costs that small emitters (below some given threshold level) would have to face if they were exposed to the same rules as the other emitters.
Moving now to the “worst of” side, we can distinguish two main groups of problems, that is, shortcomings in the cap-setting and in the way the ETSs operated. As to the first aspect, if the cap is set too high with respect to the actual demand for allowances, this will obviously result in a low allowance price; if, instead, the cap is frequently revised (e.g., due to scientific uncertainty on the correct number of allowances to be allocated), this will contribute to increase price volatility. In our view, both a low price and a highly volatile price may constitute problems that hinder the proper functioning of the ETS. A low allowance price gives agents no incentive to abandon the old polluting technologies and invest in new environmentally friendly ones. A highly unstable price generates uncertainty on the expected returns of investing in such technologies, which may discourage investments in eco-innovation.
If one looks at the development of the main ETSs, it can be noticed that basically all regimes experienced high price volatility. This seems to apply not only to the price evolution of the EU ETS and of the Californian ETS pointed out above, but also to some of the Chinese pilot projects. For instance, in the case of Shenzhen (the first ETS to be implemented in China), prices ranged from 28 to 30 CNY on June 19, 2013 (the first day of trading), raised up to the peak level of 93 CNY on September 10, 2013, they fell by about a third to around 60 CNY at the beginning of October 2013 and then doubled to about 120 CNY in the same month (World Bank, 2014). This erratic price trend might have contributed to discourage traded volumes that steadily declined from 21,112 tons of emissions allowances the day the market was launched to about 1,000 tons of emissions allowances on September 24, 2013. This roller coaster-like trend in the Shenzhen Emissions Exchange probably denotes the difficulty of the operators to adapt to a new market and is likely to discourage eco-innovators, who search for price stability to develop their long run projects. However, a certain degree of price volatility in the allowance market can be considered physiological as it simply reflects fluctuations of demand and supply. In this sense, the problem is not price volatility per se but rather how the cap should be adjusted to account for unexpected changes of the economic conditions (e.g., economic recession, new legislation or developments of renewable resources, etc.).
As to the second set of shortcomings (concerning the way the ETS operates), important aspects that hinder the proper functioning of the ETS are the lack of temporal flexibility (banking and borrowing), of harmonized procedures for verification, monitoring, and reporting, and of appropriate provisions for linking with offset markets and other systems. As pointed out in the previous sections, the lack of these aspects has proved to be critical for the EU in the past. Most of the operational problems described for the EU ETS did not emerge among the followers so far. In some cases (e.g., initial over-allocation), this may be ascribed to the fact that while the EU ETS is a transnational market that needs international coordination among its MS, other ETSs operate within national boundaries under a uniform set of rules. It follows that, even in the case of inter-States ETSs, such as the RGGI, more similar regulations apply across its members as they are part of the same country. Another reason is that the other ETSs are simply more recent than the EU ETS; one cannot exclude, therefore, that different, more idiosyncratic operational problems might emerge in the future for the followers too. A final reason might be that followers learned from the initial mistakes of the EU ETS, which was then a prototype to observe but not necessarily a model to be copied in all its aspects. On the contrary, as someone has ironically argued (The Economist, 2013) referring to the difficulties encountered by the EU ETS, the latter might have progressively become an example for the other regimes of what not to do.
Conclusion
The ETS is going through a crucial moment in the history of the climate change policy tools. In a few years, it has become a milestone instrument for tackling climate change and is rapidly spreading in different jurisdictions, as the preferred tool for pricing carbon.
In such a context, as already noted above, it is correct to state that the EU ETS has represented the prototype regime with respect to all other similar experiences. With this in mind, in the present article, the origin and the evolution of the EU ETS have been described, with a glimpse on its future perspectives. The analysis conducted above has shown that through the years the EU has modified its role in the use of market-based instruments, such as the cap-and-trade schemes, passing from follower to forerunner. However, the success of EU ETS has been marked not only by great achievements but also by relevant shortcomings. In fact, the impressive rapidity and efficacy of the EU in building a huge carbon market in a relatively short period of time was counterbalanced by the existence of some relevant drawbacks, which undermined the effectiveness of the system, namely the mix of low average price and high price volatility, as well as governance issues and administration problems.
In this sense, it should be highlighted that even the undeniable success of the EU ETS in achieving remarkable emission reductions in a short time period may be questioned on the basis of the concurrent role played the great economic crisis that affected Europe in recent years. On the basis of this line of reasoning, appropriate corrective measures and a continuous monitoring of the EU ETS functioning need to be adopted to avoid that, once the crisis will be hopefully over, emissions may start increasing again.
Moreover, also the technological innovation allegedly induced by the EU ETS might be questioned. To this effect, it will be necessary to gather further evidence in the years to come, in order to determine with a sufficient degree of certainty whether the EU ETS has really managed to promote a considerable level of technological change in the European market.
Given the problems encountered by the EU ETS prototype during these years, we have then compared it with the other relevant ETS regimes that emerged as main followers of the EU ETS, namely the RGGI, the Californian cap-and-trade system, and the Quebec cap-and-trade system. As argued in this paper, these followers share with the EU ETS some common flaws, especially in terms of price volatility, but they have also shown the capacity to innovate and possibly devise alternative ways to manage their own ETS regimes, which may in the long term jeopardize the EU leadership in the ETS context.
In particular, as far as price volatility is concerned, the decision by all followers to introduce a price floor turned out to be very useful to prevent their prices from decreasing even further during the recent deep recession. In this regard, the EU should probably learn from the followers and introduce a price floor in the near future. If not, the price of the European allowances may keep falling and end up becoming an application of what could be provocatively defined “the polluter does not pay principle.” In other words, without any price floor the price can become so low that polluters have no incentive to abate their pollution levels. If this is the case, the ETS would become nothing but one additional financial instrument, losing the environmental motivation underlying its origin. A risk that, in our view, all ETSs should try to avoid, in order to preserve their credibility as suitable instruments to fight climate change in the future.
Author Contributions
The article was jointly conceived and written by the authors, excluding the sections “Effects of EU ETS on Eco-innovation and Pollution Abatement” and “The Best and Worst of ETSs” that were written by SB alone.
Conflict of Interest Statement
The authors declare that the research was conducted in the absence of any commercial or financial relationships that could be construed as a potential conflict of interest.
Acknowledgments
This paper is an extended and revised version of chapter 3 of the book “The European Emission Trading System and its followers: Comparative analysis and linking perspectives” by Borghesi et al. (2016b). The research line presented here was originally conceived under the EU FP7 Transworld project (reference n° 290454). It was then subsequently further deepened and updated under the EU FP7 FESSUD project (grant agreement n° 266800) and the PRIN National Research Project (prot. 2010S2LHSE) financed by MIUR (Italian Ministry of Education, University and Research) to account for the new features of the European Emission Trading System as it developed over time and for the evolution of the Emission Trading Systems worldwide. The authors gratefully acknowledge financial support received under the aforementioned research projects that allowed them to progressively extend and update their research line. The authors would like to thank also Sebastiano Cupertino for valuable research assistance and two anonymous referees for helpful comments and suggestions on a preliminary version of this work. The usual disclaimer applies.
Footnotes
- ^A few hints will be given whenever possible also on the pilot ETSs that have been recently implemented in China. As explained below, however, much less information is available so far on these application experiences, therefore, when discussing the “followers,” we will focus mainly on the most advanced North-American experiences indicated above.
- ^However, the EU ETS requirements were provisionally suspended in 2012 for flights to and from non-European countries, by means of the so-called “stop-the-clock-decision.” This was mainly done to allow negotiations in the context of the International Civil Aviation Organization (ICAO) on a possible global market-based measure applying to aviation emissions. The suspension measures were renewed also for the period 2013–2016, so that, practically, so far only emissions produced by (internal) flights occurring within the European Economic Area fall under the EU ETS.
- ^In August 2015, the Environmental Protection Agency (2015) adopted the Clean Power Plan (CPP) that for the first time sets federal limits on carbon emissions, with a view to reduce emissions from power plants by 32% in 2030, as compared to 2005 levels. The CPP imposes specific and differentiated targets to each of the US States, leaving them a certain margin of discretion on how to reduce their emissions and on developing their own national plan to meet the assigned target. As some authors have underlined, the CPP “enables and encourages state-level and multi-state emissions trading” (Schmalensee and Stavins, 2015, p. 16). However, despite the broad support enjoyed in many States, the CPP also has several opponents and it has been subject to a legal challenge. Pending a decision on the merits of the case, in February 2016 the US Supreme Court provisionally suspended the enforcement of the CPP (Goldenberg, 2016). This might cause a long delay in the planned shift towards cleaner energy and in the progressive decarbonisation of the US electricity production sector.
- ^We will focus here mainly on the first two phases of the EU ETS since few data are currently available on the initial part of the third phase (2013–2020). Indeed, if we exclude the carbon price (which is available on a daily basis), most EU ETS-related indicators are released with a significant lag by the European Commission. For instance, information on transactions in the EU ETS are yet to be released for the year 2013 in the EU Transaction Log, the official EU registry of all transactions taking place in the EU carbon market.
- ^In Phase III, price volatility was lower than that in Phase II (the price range being €5.84 in Phase III versus €14.36 in Phase II). Moreover, in Phase III (during the years 2013–2015), the average annual price was also lower than that in Phase II (€6.03 versus €8.12). As mentioned above, we will focus here on the first two phases that, differently from Phase III, provide complete information on all transactions details.
- ^See Schleich et al. (2006) for an analysis of the implications of the EU decision to ban banking in Phase I and of the related efficiency losses based on simulation results. See also Clò et al. (2013) for a discussion of the impact of the EUA price drop on the effectiveness of the trading scheme and on the risk of carbon lock-in that the carbon price fall can generate.
- ^Koch et al. (2014) investigate the drivers of the variations of the EUA price in Phase II and find that economic recession is a robust explanatory variable for the observed price fall, while renewable policies and the use of international credits (that are also often invoked as carbon price drivers) have had a moderate impact on the EU ETS carbon price.
- ^See Betz et al. (2004), Betz and Sato (2006) for an in-depth discussion of the different design of the NAPs across MS in the initial phase and of their consequences in terms of firms’ competitiveness.
- ^By VAT fraud, we refer to the practice of some agents of importing allowances VAT-free (due to the zero rate of taxation on intra-community cross-border trade) and sell them in the importing country with VAT charged and afterwards disappear instead of paying the VAT to the government. To make an example, the fraudster may buy allowances from firm A located in another EU country and then sell them in its own country to firm B charging the VAT. If the fraudster disappears without paying the VAT, when firm B reclaims the VAT from the government the Member State will suffer a loss since it has to reimburse an amount of money that it did not receive from the fraudster. This kind of fraud, that exploits the way VAT is treated within multi-jurisdictional trading, has applied to several other items in the past (e.g. microchips, mobile phones, health products, jewellery, etc.) causing relevant losses to the EU budget (cf. Frunza et al., 2011).
- ^See Decision No 1359/2013/EU of the European Parliament and of the Council of 17 December 2013 amending Directive 2003/87/EC clarifying provisions on the timing of auctions of greenhouse gas. See also Commission Regulation (EU) No. 176/2014 of 25 February 2014 amending Regulation (EU) No 1031/2010 in particular to determine the volumes of greenhouse gas emission allowances to be auctioned in 2013–2020.
- ^For a critical discussion of the back-loading and of the other structural measures proposed by the European Commission to reform the EU ETS see de Perthuis and Trotignon (2014). See also Caton et al. (2015) for an analysis of the implications of back-loading on carbon prices that compares the CO2 equilibrium price with and without this policy measure.
- ^See COM (2014) 20, Proposal for the establishment and operation of a market stability reserve for the EU ETS.
- ^At the moment of writing, the Decision of the European Parliament and of the Council concerning the establishment and operation of a market stability reserve is still awaiting publication on the Official Journal of the European Union.
- ^Source: European Commission, http://ec.europa.eu/clima/policies/ets/reform/index_en.htm
- ^See Kollenberg and Taschini (2016) for a theoretical model that investigates the potential consequences of the market stability reserve mechanism using a stochastic partial equilibrium framework.
- ^See Kemp (2010) for the definition of eco-innovation distinguishing between product, process, and organisational innovations.
- ^See, for instance, Popp (2002) for an empirical analysis of the innovation effects induced by energy prices in general.
- ^See Martin et al. (2015) for a review of the literature on this issue.
- ^As it is well known, the so-called Porter hypothesis (Porter, 1991) argues that environmental regulation can have positive effects on firms’ competitiveness. Such a hypothesis has been the object of two interpretations: (i) environmental regulation may trigger innovation (“weak” version of the Porter hypothesis) and (ii) induced innovation may enhance firms’ productivity (“strong” version). The aforementioned studies, therefore, focus on the weak version of the Porter assumption taking the EU ETS as specific example of environmental regulation.
- ^The number of carbon pricing instruments has been increasing by 90% since 2012, reaching today 38 instruments that span across 39 national jurisdictions and 23 subnational jurisdictions, covering about 12% of global GHG emissions (Kossoy et al., 2015). A detailed analysis of all the existing ETSs goes beyond the scope and admissible length of this paper that intends to present only a selection of the most relevant ETSs. The interested reader is referred to Kossoy et al. (2015) and PMR and ICAP (2016) for an in-depth and exhaustive description of most existing programs.
- ^A national ETS is planned to start in China in 2017. However, from a survey conducted on 304 China-based stakeholders (de Boer et al., 2015), it turns out that the vast majority of respondents expect that a national ETS will not be fully operational before 2020.
- ^As pointed out by Newell et al. (2014), banking is widely recognized as “an important tool to avoid short-term supply-demand imbalances and associated price movements.” See Chevallier (2012) for a survey of the banking literature. Notice that borrowing is allowed in the EU ETS only within compliance periods: indeed, allocation for the current year takes place in February, while the deadline to surrender allowances for emissions of the previous year is end of April. In California borrowing is allowed only under very specific and restrictive conditions (see PMR and ICAP, 2016), whereas it is never allowed in the RGGI and in the Quebec ETS.
- ^Notice that progressive transition towards full auctioning is planned for the future also in the Shenzhen ETS pilot, the first to be launched in China. At the moment, however, allowances are mainly grandfathered in all Chinese ETS pilots (see Table A1 in Appendix).
- ^The existence and the entity of a carbon leakage effect induced by the implementation of environmental policies is the subject of a heated debate and of an extensive theoretical and empirical literature. See, among the others, Taylor (2004), Dean et al. (2009), Chung (2014) for analyses of the possible delocalisation effect of environmental regulation in general, Martin et al. (2014a and 2014b), Borghesi et al. (2016a) for a discussion of the effect of the EU ETS regulation in particular.
- ^The amount of the penalties and the way non-compliant firms are sanctioned are even more diverse across the Chinese ETS pilots (see Table A1 in Appendix).
- ^To perform the numerical calculation we used the €/US$ exchange rate as of 20 April 2016 and the following allowances prices taken by the data sources indicated among brackets on the same day: (i) EU ETS= 5.49€ per allowance (https://www.eex.com/en/market-data/emission-allowances/spot-market/european-emission-allowances#!/2016/04/20); (ii) CARB: $12.29 (equivalent to 10.82€) per allowance (http://calcarbondash.org); (iii) RGGI: $5.25 (equivalent to 4.622€) per allowance (https://rggi-coats.org/eats/rggi/index.cfm?fuseaction=reportsv2.price_rpt&clearfuseattribs=true).
- ^By stringency, we refer here to the effort imposed by the regulator according to the emission reduction target, which can be measured by the ratio of emissions to allocated allowances (cf. Borghesi et al., 2015). Notice, however, that the price of the emission allowances can also be seen as a proxy of regulation stringency, as it enters other measures of environmental policy stringency, such as the Pollution Abatement Cost Expenditures and the survey-based perception of stringency. In this regard, the Californian regime may look more stringent than the other two since the allowance price is currently much higher in the Californian cap-and-trade system than in the EU ETS and in the RGGI (see previous footnote for a comparison of current prices). See Brunel and Levinson (2013) and Kozluk and Zipperer (2013) for reviews of the existing measures of environmental policy stringency and a detailed discussion of their shortcomings.
- ^The only exception among the countries taking part to the EU ETS is represented by the UK that in August 2013 has unilaterally introduced a price floor equal to £16 per tonne of CO2, which is expected to rise over time. The government decision has been criticised by many commentators, for the risk that companies pass the cost on to consumer energy bills and for the competition loss that UK firms may suffer as compared to their competitors in the rest of Europe where the price floor does not apply.
- ^All the three followers taken into account, however, adopt allowance price containment reserves. Such reserves represent a soft price ceiling as the government is prepared to sell a fixed amount of allowances at a given price, but do not set an absolute limit on the price (the so-called hard price cap). As PMR and ICAP (2016) (p. 113) point out, this “provides some assurance to the market, but not a guarantee, that the price will not rise above that level.”
- ^For a discussion and comparison of the possible mechanisms to implement a price floor and the related implementation pitfalls see Wood and Jotzo (2011).
- ^See Borghesi et al. (2016b) for a discussion of the different kinds of linking and of the necessary and optional features that ETS regimes need to have to achieve linking agreements.
- ^As Martin et al. (2014a) have argued, the carbon intensity criterion is highly correlated to carbon leakage while trade intensity is not. They conclude that the current exemption criteria adopted by the EU ETS should be amended to consider a sector at risk of carbon leakage only if it is both trade intensive and carbon intensive. See also Martin et al. (2014b) for the proposal of an efficient compensation scheme of industries at risk of relocation and for a discussion of its implications for the EU ETS.
- ^See Borghesi et al. (2016b) for a complete list of all the sectors exempted from the auctioning of allowances under the EU ETS, the Californian regime and the Quebec regime.
References
Abrell, J., Ndoye, A., and Zachmann, G. (2011). Assessing the Impact of the EU ETS Using Firm Level Data. Bruegel Working Paper 2011/08. Bruxelles: Bruegel.
Aghion, P., Veugelers, R., and Serre, C. (2009). Cold Start for the Green Innovation Machine. Bruegel Policy Contribution, 2009/12. Brussels: Bruegel.
Anderson, B., Convery, F., and Di Maria, C. (2011). Technological Change and the EU ETS: The Case of Ireland. IEFE Working Paper 43. Milan: IEFE Bocconi.
Anderson, B., and Di Maria, C. (2011). Abatement and allocation in the pilot phase of the EU ETS. Environ. Resour. Econ. 48, 83–103. doi: 10.1007/s10640-010-9399-9
Betz, R., Eichhammer, W., and Schleich, J. (2004). Designing national allocation plans for EU-emissions trading – a first analysis of the outcomes. Energy Environ. 15, 375–423. doi:10.1260/0958305041494657
Betz, R., and Sato, M. (2006). Emissions trading: lessons learnt from the 1st phase of the EU ETS and prospects for the 2nd phase. Clim. Policy 6, 351–359. doi:10.1080/14693062.2006.9685607
Borghesi, S. (2011). The European Emission Trading Scheme and renewable energy policies: credible targets for incredible results? Int. J. Sustain. Econ. 3, 312–327. doi:10.1504/IJSE.2011.041108
Borghesi, S. (2013). Water tradable permits: a review of theoretical and case studies. J. Environ. Plann. Manage. 57, 1305–1332. doi:10.1080/09640568.2013.820175
Borghesi, S., Cainelli, G., and Mazzanti, M. (2012). European Emission Trading Scheme and environmental innovation: an empirical analysis using CIS data for Italy. G. Econ. Ann. Econ. 71, 71–97.
Borghesi, S., Cainelli, G., and Mazzanti, M. (2015). Linking emission trading to environmental innovation: evidence from the Italian manufacturing industry. Res. Policy 44, 669–683. doi:10.1016/j.respol.2014.10.014
Borghesi, S., Franco, C., and Marin, G. (2016a). Outward Foreign Direct Investments Patterns of Italian Firms in the EU-ETS. SEEDS Working Paper No.1/2016. Available at: http://www.sustainability-seeds.org/papers/RePec/srt/wpaper/0116.pdf
Borghesi, S., Montini, M., and Barreca, A. (2016b). The European Emission Trading System and Its Followers: Comparative Analysis and Linking Perspectives. Cham, Switzerland: Springer International Publishers.
Borghesi, S., and Montini, M. (2014). “The European Emission Trading System: flashing lights, dark shadows and future prospects for global ETS cooperation,” in The EU, the US and Global Climate Governance, eds C. Bakker and F. Francioni (Abingdon, UK: Ashgate Ltd), 115–125.
Brunel, C., and Levinson, A. (2013). Measuring Environmental Regulatory Stringency. OECD Trade and Environment Working Papers 2013/5. Paris: OECD.
Burtraw, D., Palmer, K., Munnings, C., Weber, P., and Woerman, M. (2013). Linking by Degrees – Incremental Alignment of Cap and Trade Markets. RFF Discussion Paper (Washington, DC: Resources for the Future), 13–04.
Calel, R., and Dechezleprêtre, A. (2016). Environmental policy and directed technological change: evidence from the European carbon market. Rev. Econ. Stat. 98, 173–191. doi:10.1162/REST_a_00470
Caton, C., Creti, A., and Peluchon, B. (2015). Banking and back-loading emission permits. Energy Policy 82, 332–341. doi:10.1016/j.enpol.2015.01.023
Chevallier, J. (2012). Carbon price drivers: an updated literature review. J. Econ. Surv. 26, 157–176. doi:10.1111/j.1467-6419.2010.00642.x
Chung, S. (2014). Environmental regulation and foreign direct investment: evidence from South Korea. J. Dev. Econ. 108, 222–236. doi:10.1016/j.jdeveco.2014.01.003
Clò, S., Battles, S., and Zoppoli, P. (2013). Policy options to improve the effectiveness of the EU Emissions Trading System: a multi-criteria analysis. Energy Policy 57, 477–490. doi:10.1016/j.enpol.2013.02.015
Convery, F., Ellerman, D., and De Perthuis, C. (2010). Pricing Carbon: The European Union Emissions Trading Scheme. Cambridge: Cambridge University Press.
COM (2014). A Policy Framework for Climate and Energy in the Period from 2020 to 2030. Bruxelles: European Commission.
Cramton, P., and Kerr, S. (2002). Tradeable carbon permit auctions: how and why to auction not grandfather. Energy Policy 30, 333–345. doi:10.1016/S0301-4215(01)00100-8
De Boer, D., Roldao, R., and Slater, H. (2015). The 2015 China Carbon Pricing Survey. Beijing, China: China Carbon Forum.
De Perthuis, C., and Trotignon, R. (2014). Governance of CO2 markets: lessons from the EU ETS. Energy Policy 75, 100–106. doi:10.1016/j.enpol.2014.05.033
Dean, J. M., Lovely, M. E., and Wang, H. (2009). Are foreign investors attracted to weak environmental regulations? Evaluating the evidence from China. J. Dev. Econ. 90, 1–13. doi:10.1016/j.jdeveco.2008.11.007
EC. (2003). Directive 2003/87/EC Establishing a Scheme for Greenhouse Gas Emission Allowance Trading within the Community and amending Council Directive 96/61/EC. Strasbourg: The European Parliament and the Council of Europe.
EC. (2008). Directive 2008/101/EC Amending Directive 2003/87/EC so as to Include Aviation Activities in the Scheme for Greenhouse Gas Emission Allowance Trading within the Community. Strasbourg: The European Parliament and the Council of the European Union.
EC. (2009). Directive 2009/29/EC Amending Directive 2003/87/EC so as to Improve and Extend the Greenhouse Gas Emission Allowance Trading Scheme of the Community. Strasbourg: The European Parliament and the Council of the European Union.
Ecofys. (2013). Mapping Carbon Prices Initiatives 2013. Washington D.C: Carbon Finance at the World Bank.
EEA. (2014c). Deliveries for Projections and National Programmes. Copenhagen: European Environment Agency.
EEA. (2010). Annual European Union Greenhouse Gas Inventory 1990–2008 and Inventory Report 2010. EEA Technical Reports No. 6/2010 (June), Copenhagen: European Environment Agency. Available at: http://www.eea.europa.eu//publications/european-union-greenhouse-gas-inventory-2010.
EEA. (2012a). Annual European Union Greenhouse Gas Inventory 1990–2010 and Inventory Report 2012. EEA Technical Reports No. 3/2012 (May). Copenhagen: European Environment Agency. Available at: http://www.eea.europa.eu//publications/european-union-greenhouse-gas-inventory-2012.
EEA. (2012b). Approximated EU GHG Inventory: Early Estimates for 2011. EEA Technical Reports No. 13/2012 (October). Copenhagen: European Environment Agency. Available at: http://www.eea.europa.eu//publications/approximated-eu-ghg-inventory-2011.
EEA. (2013). Trends and Projections in Europe 2012. Tracking Progress Towards Europe’s Climate and Energy Targets Until 2020. EEA Reports No. 10/2013. Copenhagen: European Environment Agency.
EEA. (2014a). Annual European Community Greenhouse Gas Inventory 1990–2012 and Inventory Report 2013. EEA Reports No. 9/2014. Copenhagen: European Environment Agency.
EEA. (2014d). Approximated EU GHG Inventory: Proxy GHG Emission Estimates for 2013. EEA Reports No. 16/2014. Copenhagen: European Environment Agency.
EEA. (2014e). Trends and Projections in Europe 2014. Tracking Progress Towards Europe’s Climate and Energy Targets for 2020. EEA Reports No. 6/2014. Copenhagen: European Environment Agency.
EEA. (2015). Trends and Projections in the EU ETS in 2015. EEA Technical Report No. 14/2015. Copenhagen: European Environment Agency.
Ellerman, D. (2010). “The EU’s emissions trading scheme: a proto-type global system?,” in Post-Kyoto International Climate Policy, eds J. Aldy and R. N. Stavins (Cambridge: Cambridge University Press), 88–118.
Ellerman, D., and Buchner, B. K. (2008). A preliminary analysis of the EU ETS based on the 2005-06 emissions data. Environ. Resour. Econ. 41, 267–287. doi:10.1007/s10640-008-9191-2
Ellerman, D., Buchner, B. K., and Carraro, C. (2007). Allocation in the European Emissions Trading Scheme: Rights, Rents and Fairness. Cambridge: Cambridge University Press.
Environmental Protection and Agency. (2015). Carbon Pollution Emission Guidelines for Existing Stationary Sources: Electric Utility Generating Units. Available at: http://www2.epa.gov/cleanpowerplan
European Commission. (2012). The State of the European Carbon Market 2012. Report from the Commission to the European Parliament and the Council, COM (2012) 652 final.
Freestone, D., and Streck, C. (2009). Legal Aspects of Carbon Trading-Kyoto, Copenhagen and Beyond. Oxford: Oxford University Press.
Frunza, M.-C., Guegan, D., Thiebaut, F., and Lassoudiere, A. (2011). Missing trader fraud on the emissions market. J. Financ. Crime 18, 183–194. doi:10.1108/13590791111127750
Germà, B., and Stephan, J. (2015). Emission abatement: untangling the impacts of the EU ETS and the economic crisis. Energy Econ. 49, 531–539. doi:10.1016/j.eneco.2015.03.014
Gilbert, A., Bode, J. W., and Phylipsen, D. (2004). Analysis of the National Allocation Plans for the EU Emissions Trading Scheme. London: Ecofys.
Goldenberg, S. (2016). “Supreme court ruling on Obama’s clean power plan just a ‘bump in the road’,” in The Guardian. Available at: http://www.theguardian.com/environment/2016/feb/10/supreme-court-ruling-obama-power-plant-emissions-clean-energy-impact
Gronwald, M., and Hintermann, B. (eds) (2015). Evaluating Emission Trading as a Policy Instrument: Evaluation and Prospects. Cambridge, USA: Massachusetts Institute of Technology.
Gronwald, M., and Ketterer, J. (2012). What Moves the European Carbon Market? Insights from Conditional Jump Models. CESifo Working Paper No. 3795. Munich: Center for Economic Studies.
Grubb, M., Hourcade, J. C., and Neuhoff, K. (2014). Planetary Economics: Energy, Climate Change and Three Domains of Sustainable Development. Abingdon: Routledge.
Grubb, M., and Neuhoff, K. (2006). Emissions Trading & Competitiveness: Allocations, Incentives and Industrial Competitiveness under the EU Emissions Trading Scheme. London: Earthscan.
Hobbs, B.F., Bushnell, J., and Wolak, F.A. (2010). Upstream vs. Downstream CO2 Trading: A Comparison for the Electricity Context. Energy Institute at Haas Working Paper 203. Berkley, CA: Haas School of Business and the UC Energy Institute. Available at: https://ei.haas.berkeley.edu/research/papers/WP203.pdf#page=1
Hoffmann, V. H. (2007). EU ETS and investment decisions: the case of the german electricity industry. Eur. Manage. J. 25, 464–474. doi:10.1016/j.emj.2007.07.008
Hood, C. (2010). Reviewing Reviewing Existing and Proposed Emissions Trading Systems. IEA Energy Paper No. 2010/13. International Energy Agency.
ICAP – International Carbon Action Partnership. (2015) “Emissions Trading Worldwide,” in International Carbon Action Partnership Status Report 2015. Berlin, Germany.
Jotzo, F., De Boer, D., and Kater, H. (2013). China Carbon Pricing Survey 2013. Beijing, China: China Carbon Forum.
Kemp, R. (2010). Eco-Innovation: definition, measurement and open research issues. Econ. Politica 27, 397–420.
Koch, N., Fuss, S., Grosjean, G., and Edenhofer, O. (2014). Causes of the EU ETS price drop: Recession, CDM, renewable policies or a bit of everything? – New evidence. Energy Policy 73, 676–685. doi:10.1016/j.enpol.2014.06.024
Kollenberg, S., and Taschini, L. (2016). The European Union Emissions Trading System and the Market Stability Reserve: Optimal Dynamic Supply Adjustment. Grantham Research Institute on Climate Change and the Environment. Working Paper No. 195. London School of Economics.
Kossoy, A., Peszko, G., Oppermann, K., Prytz, N., Klein, N., Blok, K., et al. (2015). State and Trends of Carbon Pricing 2015. Washington, DC: World Bank.
Kozluk, T., and Zipperer, V. (2013). Environmental Policies and Productivity Growth – A Critical Review of Empirical Findings. Economics Department Working Paper No. 1096, Paris: OECD.
Kruger, J., Wallace, E. O., and Pizer, W. A. (2007). Decentralization in the EU Emissions Trading Scheme and lessons from global policy. Rev. Environ. Econ. Policy 1, 66–87. doi:10.1093/reep/rem009
Martin, R., Muuls, M., de Preux, L. B., and Wagner, U. (2014a). On the empirical content of carbon leakage criteria in the EU Emissions Trading Scheme. Ecol. Econ. 105, 78–88. doi:10.1016/j.ecolecon.2014.05.010
Martin, R., Muuls, M., de Preux, L. B., and Wagner, U. (2014b). Industry compensation under relocation risk: a firm-level analysis of the EU Emissions Trading Scheme. Am. Econ. Rev. 104, 2482–2508. doi:10.1257/aer.104.8.2482
Martin, R., Muuls, M., and Wagner, U. (2011). Carbon Markets, Carbon Prices and Innovation: Evidence from Interviews with Managers. London, UK: London School of Economics.
Martin, R., Muuls, M., and Wagner, U. (2015). The impact of the European Union Emissions Trading Scheme on regulated firms: what is the evidence after ten years? Rev. Environ. Econ. Policy 10, 129–148. doi:10.1093/reep/rev016
Newell, R. G., Pizer, W. A., and Raimi, D. (2013). Carbon markets 15 years after Kyoto: lessons learned, new challenges. J. Econ. Perspect. 27, 123–146. doi:10.1257/jep.27.1.123
Newell, R. G., Pizer, W. A., and Raimi, D. (2014). Carbon market lessons and global policy outlook. Science 343, 1316–1317. doi:10.1126/science.1246907
OECD. (2011). Emission Permits and Competition, DAF/COMP(2010)35. Paris: OECD. Available at: http://www.oecd.org/daf/competition/sectors/48204882.pdf
Olmstead, S., and Stavins, R. (2012). Three key elements of a post-2012 international climate policy architecture. Rev. Environ. Econ. Policy 6, 65–85. doi:10.1093/reep/rer018
Park, H., and Hong, W. K. (2014). Korea’s Emission Trading Scheme and policy design issues to achieve market-efficiency and abatement targets. Energy Policy 75, 73–83. doi:10.1016/j.enpol.2014.05.001
Perdan, S., and Azapagic, A. (2011). Carbon trading: current schemes and future developments. Energy Policy 39, 6040–6054. doi:10.1016/j.enpol.2011.07.003
PMR (Partnership for Market Readiness) and ICAP (International Carbon Action Partnership). (2016). Emissions Trading in Practice: A Handbook on Design and Implementation. Washington, DC: World Bank. License: Creative Commons Attribution CC BY 3.0 IGO. Available at: https://openknowledge.worldbank.org/bitstream/handle/10986/23874/ETP.pdf
Pontogolio, S. (2010). “An early assessment of the influence on eco-innovation of the EU Emissions Trading Scheme,” in Environmental Efficiency, Innovation and Economic Performances, eds M. Mazzanti and A. Montini (London, New York: Routledge), 81–91.
Popp, D. (2002). Induced innovation and energy prices. Am. Econ. Rev. 92, 160–180. doi:10.1257/000282802760015658
Porter, M. (1991). America’s green strategy. Sci. Am. 264, 168. doi:10.1038/scientificamerican0491-168
Rogge, K. S., Schneider, M., and Hoffmann, V. H. (2011a). The innovation impact of the EU Emission Trading System – findings of company case studies in the German power sector. Ecol. Econ. 70, 513–523. doi:10.1016/j.ecolecon.2010.09.032
Rogge, K., Schleich, J., Haussmann, P., Roser, A., and Reitze, F. (2011b). The role of the regulatory framework for innovation activities: the EU ETS and the German paper industry. Int. J. Technol. Policy Manage. 11, 250–273. doi:10.1504/IJTPM.2011.042086
Schleich, J., Ehrhart, K. M., Hoppe, C., and Seifert, S. (2006). Banning banking in EU emission trading? Energy Policy 34, 112–120. doi:10.1016/j.enpol.2004.06.009
Schmalensee, R., and Stavins, R. (2015). Lessons Learned from Three Decades of Experience with Cap-and-Trade. Washington, DC: Resources for the Future.
Schmidt, T. S., Schneider, M., Rogge, K. S., Schuetz, M. J. A., and Hoffmann, V. H. (2012). The effects of climate policy on the rate and direction of innovation: a survey of the EU ETS and the electricity sector. Environ. Innov. Soc. Transit. 2, 23–48. doi:10.1016/j.eist.2011.12.002
Sijm, J. (2005). The interaction between the EU Emissions Trading Scheme and national energy policies. Clim. Policy 5, 79–96. doi:10.3763/cpol.2005.0509
Smith, S., and Swierzbinski, J. (2007). Assessing the performance of the UK Emission Trading Scheme. Environ. Res. Econ. 37, 131–158. doi:10.1007/s10640-007-9108-5
Sopher, P., and Mansell, A. (2014a). The World’s Carbon Markets: A Case Study Guide to Emissions Trading. Japan: International Emissions Trading Association.
Sopher, P., and Mansell, A. (2014b). The World’s Carbon Markets: A Case Study Guide to Emissions Trading. Switzerland: International Emissions Trading Association.
Taylor, M. S. (2005). Unbundling the pollution haven hypothesis. B. E. J. Econ. Anal. Policy 4. article 8. doi:10.2202/1538-0637.1408
The Economist. (2013). ETS, RIP?. Available at: http://www.economist.com/news/finance-and-economics/21576388-failure-reform-europes-carbon-market-will-reverberate-round-world-ets
Tietenberg, T. H. (2006). Emission Trading: Principles and Practice, 2nd Edn. Washington: RFF Press.
Tuerk, A., Mehling, M., Flachsland, C., and Sterk, W. (2009). Linking carbon markets: concepts, case studies and pathways. Clim. Policy 9, 341–357. doi:10.3763/cpol.2009.0621
Wood, P. J., and Jotzo, F. (2011). Price floors for emissions trading. Energy Policy 39, 1746–1753. doi:10.1016/j.enpol.2011.01.004
Appendix
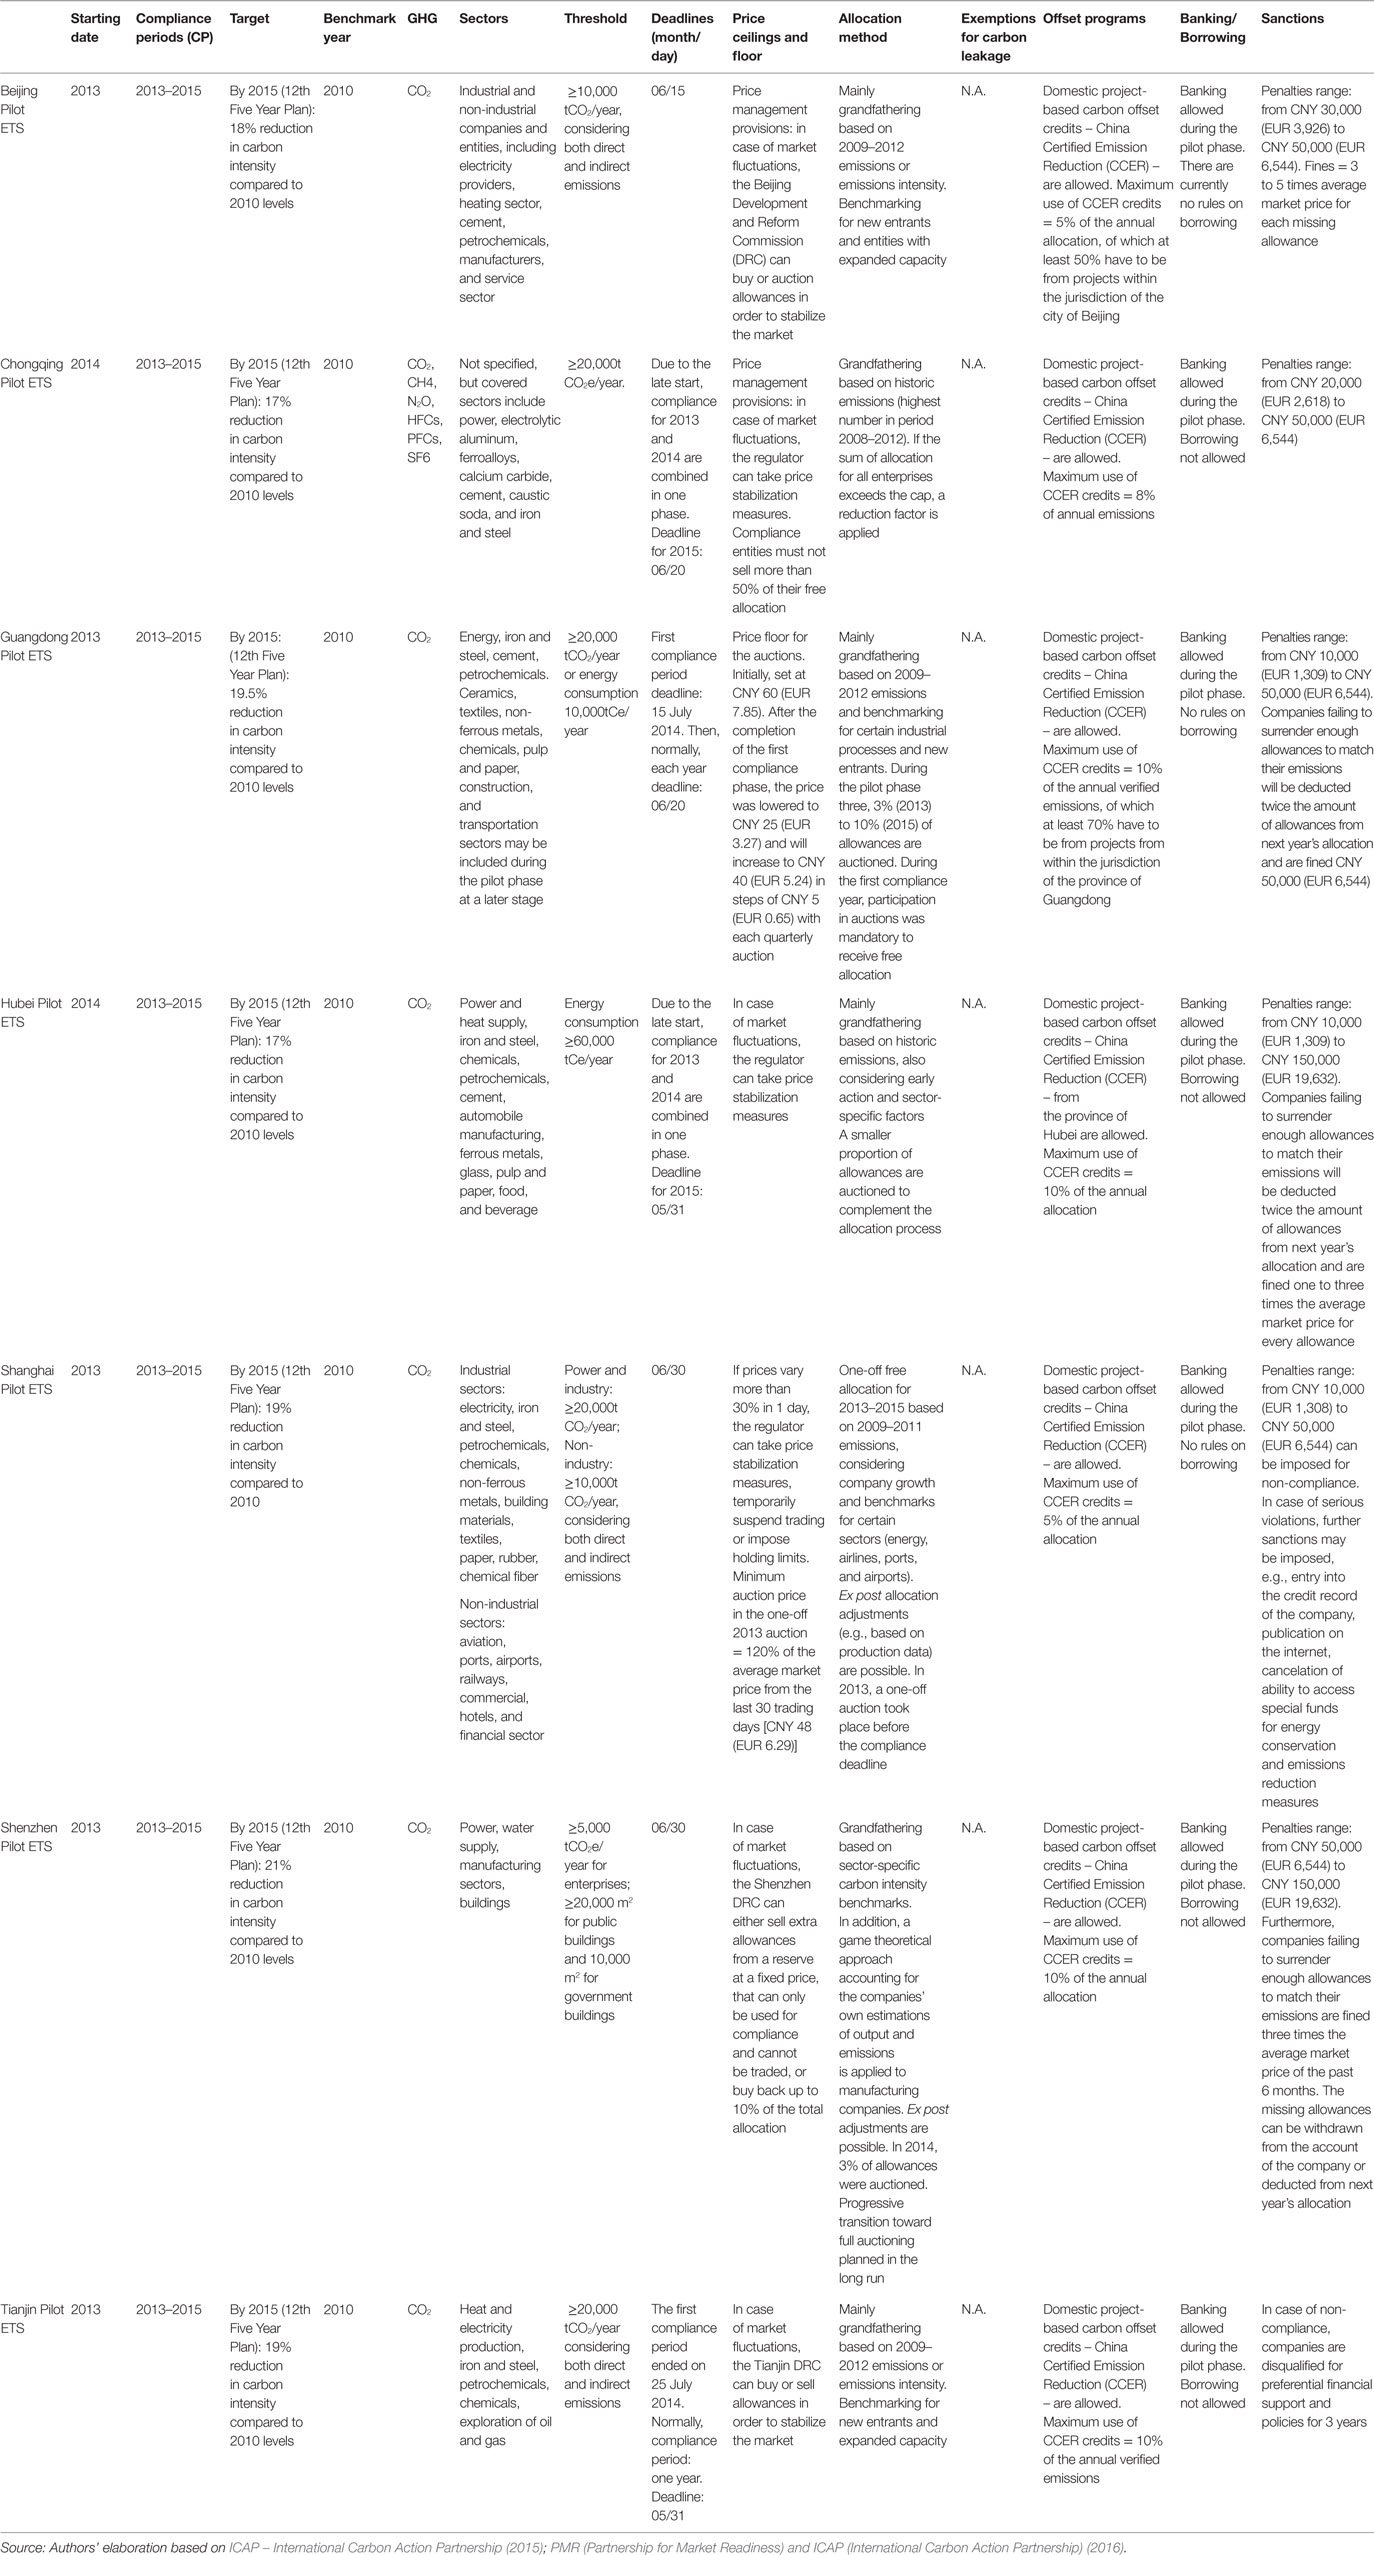
Table A1. The Chinese pilot projects: main features.
Keywords: Emission Trading Systems, EU ETS, California cap-and-trade system, Regional Greenhouse Gas Initiative, Quebec cap-and-trade system, Chinese ETS pilots, comparative analysis
Citation: Borghesi S and Montini M (2016) The Best (and Worst) of GHG Emission Trading Systems: Comparing the EU ETS with Its Followers. Front. Energy Res. 4:27. doi: 10.3389/fenrg.2016.00027
Received: 25 February 2016; Accepted: 01 July 2016;
Published: 29 July 2016
Edited by:
Sonia Yeh, Chalmers University of Technology, SwedenReviewed by:
Joachim Schleich, Grenoble Ecole de Management, FranceDaniel Huppmann, International Institute for Applied Systems Analysis, Austria
Copyright: © 2016 Borghesi and Montini. This is an open-access article distributed under the terms of the Creative Commons Attribution License (CC BY). The use, distribution or reproduction in other forums is permitted, provided the original author(s) or licensor are credited and that the original publication in this journal is cited, in accordance with accepted academic practice. No use, distribution or reproduction is permitted which does not comply with these terms.
*Correspondence: Simone Borghesi, simone.borghesi@unisi.it