Intrinsic properties and dopability effects on the thermoelectric performance of binary Sn chalcogenides from first principles
 Ferdaushi Alam Bipasha
 Lídia C. Gomes
 Jiaxing Qu
 Elif Ertekin
- 1Department of Mechanical Science and Engineering, University of Illinois at Urbana-Champaign, Urbana, IL, United States
- 2Materials Research Laboratory, University of Illinois at Urbana-Champaign, Urbana, IL, United States
High-performance thermoelectric (TE) materials rely on semiconductors with suitable intrinsic properties for which carrier concentrations can be controlled and optimized. To demonstrate the insights that can be gained in computational analysis when both intrinsic properties and dopability are considered in tandem, we combine the prediction of TE quality factor (intrinsic properties) with first-principles simulations of native defects and carrier concentrations for the binary Sn chalcogenides SnS, SnSe, and SnTe. The computational predictions are compared to a comprehensive data set of previously reported TE figures-of-merit for each material, for both p-type and n-type carriers. The combined analysis reveals that dopability limits constrain the TE performance of each Sn chalcogenide in a distinct way. In SnS, TE performance for both p-type and n-type carriers is hindered by low carrier concentrations, and improved performance is possible only if higher carrier concentrations can be achieved by suitable extrinsic dopants. For SnSe, the p-type performance of the Cmcm phase appears to have reached its theoretical potential, while improvements in n-type performance may be possible through tuning of electron carrier concentrations in the Pnma phase. Meanwhile, assessment of the defect chemistry of SnTe reveals that p-type TE performance is limited by, and n-type performance is not possible due to, the material’s degenerate p-type nature. This analysis highlights the benefits of accounting for both intrinsic and extrinsic properties in a computation-guided search, an approach that can be applied across diverse sets of semiconductor materials for TE applications.
1 Introduction
The discovery of new thermoelectric (TE) semiconductors is most commonly based on predicting or measuring the figure of merit zT (Madsen, 2006; Zhu et al., 2015; Fang et al., 2017; Li et al., 2018; Chami et al., 2020; Gan et al., 2021; Fu et al., 2015; Zhao et al., 2014). While zT is effective for evaluating a material’s TE performance, it is a composite parameter that arises from intrinsic material properties such as carrier effective masses and thermal conductivity, as well as extrinsic properties such as temperature and carrier concentration (Snyder and Toberer, 2008; Gorai et al., 2017). Consequently, measurements or predictions of zT alone may mask key performance bottlenecks. If a semiconductor is shown to have low zT, it is not always obvious if improvements are needed in the material itself or if the carrier concentration should be further optimized by doping. Additionally, semiconductors that exhibit high carrier mobilities and low thermal conductivity can still be poor TEs if they cannot be doped to the desired carrier concentration, as in n-type GeTe (Samanta et al., 2019) and Sr3GaSb3 (Zevalkink et al., 2012). For accelerated TE materials discovery and optimization, the roles of intrinsic material properties and dopability should be considered in tandem and their effects disambiguated.
One well-known and technologically-relevant class of TE materials that exhibit a diversity of behaviors in intrinsic properties and dopability are the binary IV-VI chalcogenides. These compounds exhibit crystal structures including orthorhombic (GeS and GeSe—space group Pnma, SnS and SnSe—space groups Pnma and Cmcm), rhombohedral (GeTe—space group R3m), and rock salt (SnTe, PbS, PbSe, and PbTe—space group Fm3m). As this family of materials already exhibits anharmonicity-induced ultra-low thermal conductivities (Lee et al., 2014), opportunities for improvement lie in optimizing electronic properties and carrier concentrations. Experimentally it is observed that PbTe (Wu et al., 2015) achieves a zT of 2.3 and GeTe (Li et al., 2018) achieves a zT of 2.4 both at hole concentrations
Amongst a variety of methods that predict TE performance (Madsen and Singh, 2006; Madsen et al., 2018; Ganose et al., 2021), the thermoelectric quality factor approach (Chasmar and Stratton, 1959) (Figure 1) obtains zT in terms of two independent variables, the quality factor β and the reduced Fermi level η. Since β is a measure of intrinsic properties and η depends on doping and temperature, the quality factor approach cleanly separates zT into its intrinsic and extrinsic constituents. The development of semi-empirical models (Yan et al., 2015; Miller et al., 2017) to evaluate carrier mobilities and thermal conductivity (Figure 1A) has made high-throughput assessment of β possible (Gorai et al., 2015; Ohno et al., 2018; Male et al., 2019; Qu et al., 2020). The dopability of a material can be evaluated through first-principles analysis of defect formation energies (Freysoldt et al., 2014) to establish the limits of achievable n-type and p-type carrier concentration and η (Figure 1B). As shown in Figure 1C), the union of intrinsic properties and dopability yield the achievable zT for a given material. The peak values observed in plots of zT vs. carrier concentration typically occur at carrier concentrations between 1019–1020 cm−3, making a defect engineering approach essential. In materials where compensating defects are prevalent, the peak zT may not be accessible, leading to wasted time and effort. Compensating defects refer to low energy native defects in a semiconductor that counteract attempts to dope the material; for example it is not possible to dope CuInTe2 n-type due to the prevalence of compensating copper vacancies VCu that counteract the doping (Adamczyk et al. (2020)). Additionally, the more ideal the intrinsic properties the less stringent the demands on carrier concentration: the larger the quality factor β, the lower the carrier concentration at which zT peaks and the higher the peak value.
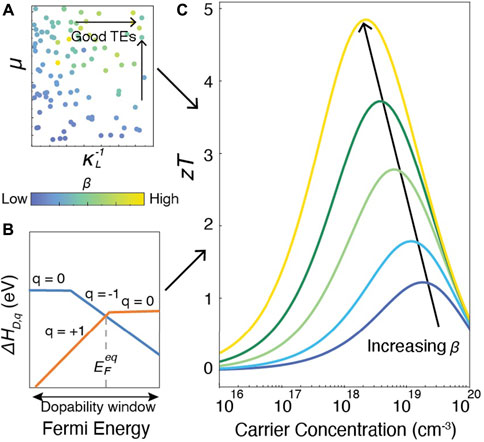
FIGURE 1. (A) Hypothetical computational search for good thermoelectric materials using material quality factor β (Yan et al., 2015; Miller et al., 2017) to predict intrinsic properties. (B) First-principles analysis of the formation energies of compensating defects (Freysoldt et al., 2014) to establish the limits of achievable n-type and p-type carrier concentration. (C) Prediction of zT from combined quality factor β and dopability (Chasmar and Stratton, 1959). Each curve represents a different value of β.
To highlight the effects of assessing both intrinsic properties and dopability in computational analysis, in this work we apply the TE quality factor approach to the prediction of zT in well-known Sn-based IV-VI binary compounds SnS, SnSe, and SnTe. Amongst the IV-VI binaries, we focus on Sn-based compounds due to their varying crystal structure (Pnma, Cmcm, and Fm3m) as well as recent demonstrations of n-type performance (Duong et al., 2016; Cai J et al., 2020; Gu et al., 2021; Zhang et al., 2015; Cha et al., 2019; Hu et al., 2019; Zhi-Cheng et al., 2019). We first apply the TE quality factor formalism for both p-type and n-type carriers by estimating β for each compound to predict the dependence of zT on carrier concentration. Our results are compared to a comprehensive literature search of reported zT values for each compound, which reveals opportunities for improvement for all three materials via carrier concentration refinement. We next carry out analysis of achievable carrier concentrations for each, and find that native defects and dopability restrict the performance of all three materials differently. Even with the limitations imposed by carrier concentration analysis, some of the Sn chalcogenides show opportunities for improvement if good extrinsic dopants can be found. The application of the quality factor approach highlights the advantages of distinguishing between the roles of intrinsic properties and dopability, as an avenue for accelerated optimization of thermoelectric materials.
2 Methods
2.1 DFT simulations—General approach
First-principles density functional theory (DFT) calculations were used for estimating both the thermoelectric quality factor β and the dopability of each compound. In all cases, these simulations were performed using the Vienna Ab-initio Simulation Package (VASP, Kresse and Furthmüller (1996)), within the projector augmented wave (PAW) formalism (Blöchl (1994)). We used pseudopotentials with core/valence electrons as follows: Sn: [Kr]4d10:5s25p2, S: [Ne]:3s23p2, Se: [Ar]4d10:4s24p4, Te: [Kr]4d10:5s25p4. As described below, both the Perdew-Burke-Eznerhof (DFT-PBE, Perdew et al. (1996)) and the Heyd-Scuseria-Eznerhof (DFT-HSE, Krukau et al. (2006)) description of the exchange correlation potential were used. A plane wave energy cutoff of 400 eV and, for bulk unit cells, a Γ-centred k-point mesh of 5 × 5 × 5 were used to perform the relaxation. The total energy and force convergence criteria used for all geometry optimizations were 10–5 eV and 0.01 eV/Å, respectively.
2.2 Thermoelectric quality factor β
The thermoelectric quality factor was obtained using DFT-PBE, with spin-orbit coupling included for PbTe and SnTe. Here, we used DFT-PBE rather than DFT-HSE since dense k-meshes are required to converge computed parameters. Relaxed structures obtained as described above were used for subsequent electronic band structure and bulk modulus calculations.
The semi-empirical model to predict each material’s intrinsic mobility (Yan et al., 2015; Miller et al., 2017) requires density of states effective mass
The semi-empirical model used to predict lattice thermal conductivity (Yan et al., 2015; Miller et al., 2017) requires the bulk modulus as an input. This was obtained by fitting the Birch–Murnaghan (Birch, 1952) equation of state to a set of total energies computed at 5 different volumes near the minimum volume of the relaxed structure.
We note that both models predict intrinsic properties assuming pure material without any defects, while quantities like mobility and lattice thermal conductivity can be affected if defects or impurities are present in the system at high concentration.
2.3 Dopability analysis
For all aspects of dopability assessment (except
2.3.1 Phase stability
The thermodynamic stability of each binary Sn chalcogenide was determined against all competing phases, including elemental phases (Sn, S, Se, and Te) and binaries SnS2 and SnSe2, whose total energies were obtained via geometry optimization as described above. The range of chemical potentials Δμ for which the parent compound is stable was obtained from the total energies, by requiring that the compound of interest be stable with respect to decomposition to all possible competing phases.
2.3.2 Native defect formation energies and carrier concentrations
We used the standard supercell approach (Lany and Zunger, 2008) to determine the formation energies of native point defects to establish dopability. The formation energy ΔHD,q of point defect D in charge state q is given by
where ED,q and EH represent total energies of a defect supercell and a host supercell without defects, respectively; μi is the chemical potential of element i added (ni > 0) or removed (ni < 0) from the host to create the defect; EF is the Fermi energy varying from the VBM to CBM; and Ecorr refers to the finite size corrections within the supercell approach. The corrections included in evaluating ΔHD,q were (i) potential alignment corrections and (ii) image charge corrections for charged defects as described by Lany and Zunger (2008). To evaluate image charge corrections, the electronic and ionic dielectric constant was calculated using density functional perturbation theory (DFPT) as implemented in VASP (Kresse and Furthmüller, 1996).
For defect calculations of SnS, SnSe, and SnTe we built supercells of 72, 72, and 64 atoms, respectively, and relaxed the structure with HSE06 to calculate the total energies of the supercells. The supercells were relaxed using Brillouin zone sampling with a Γ-centered 2 × 2 × 2 k-point grid.
Defect concentration, carrier concentration, and equilibrium Fermi energy were determined by assuming equilibrium defect concentrations and imposing charge neutrality. The charge neutrality condition is given by
where q is the charge state of the defects, n and p are the free electron and hole concentrations, and CD,q is the defect concentrations, respectively. CD,q is obtained by
where N is the concentration of the lattice sites, kB is the Boltzmann constant, and HD,q is the defect formation energy.
In Eq. 2, n and p can be obtained by
where DC(ϵ), DV(ϵ) and f(ϵ) are the conduction band density of states, valence band density of states, and the Fermi-Dirac distribution function, respectively. For a non-degenerate semiconductor the carrier concentration can be analytically simplified by the parabolic band approximation as
where
3 Results and discussion
3.1 TE quality factor assessment
To begin, we applied the quality factor approach to SnS, SnSe, and SnTe. The quality factor β was evaluated for each material in both the p-type and n-type regime, in order to determine the attainable zT and its dependence on carrier concentration. The approach is summarized here for completeness; additional details on the quality factor framework itself can be found in Chasmar and Stratton (1959) and on the semi-empirical models to obtain needed parameters in Yan et al. (2015); Chasmar and Stratton (1959).
Within the relaxation time approximation, the solutions to the Boltzmann transport equation offer an expression for zT based on material descriptor β, as
Here, α, σ, κL, and κe are the Seebeck coefficient, electrical conductivity, lattice thermal conductivity, and electrical thermal conductivity, respectively. The functions u and v are entirely dependent on the reduced Fermi level η and charge carrier scattering mechanism ν, while β is an intrinsic material parameter (Chasmar and Stratton (1959)). From Figure 1C, it is evident that both high β and optimized η should be concurrently achieved to maximize zT. The precise shape of the curve and the optimal carrier concentration depends on the dominant scattering mechanism (e.g. polar optical phonon scattering, impurity scattering, etc).
Non-dimensional parameter β involves quantities such as carrier effective mass and “intrinsic” mobility, band degeneracy, and lattice thermal conductivity. Rigorously β is given by
The intrinsic mobility μ0 and lattice thermal conductivity κL themselves exhibit a temperature dependence, that itself is sensitive to the scattering regime.
To facilitate high-throughput evaluations of β, semi-empirical models that predict μ0 and κL at T = 300 K are available (Yan et al., 2015; Miller et al., 2017). The model for μ0 accounts for acoustic and optical electron-phonon scattering, and depends on the bulk modulus (B) and carrier band effective mass
Table 1 reports the value of β we obtained for SnS, SnSe, and SnTe. The classic TE material PbTe is also shown for reference. For each material, the value of β is shown for the principal crystal structure(s) in which it is observed. SnS and SnSe are stable in layered orthorhombic Pnma crystal structure, a distorted version of rock salt (Figure 2A), at room temperature. Although both SnS and SnSe undergo a phase transition around 950 K and 750–800 K from Pnma to Cmcm crystal structure (Figure 2B), in Table 1 we considered only the Cmcm phase for SnSe as the transition temperature for SnS is quite high. In the Cmcm structure, the crystallographic orientation of Sn and Se atoms is altered so that Sn cations are bonded to five equivalent anions and form a mixture of corner and edge-sharing square pyramids. On the other hand, SnTe is stable in the cubic rock salt structure, where each Sn is bonded with six Te atoms forming edge and corner-sharing symmetric octahedral bonds as shown in Figure 2C.
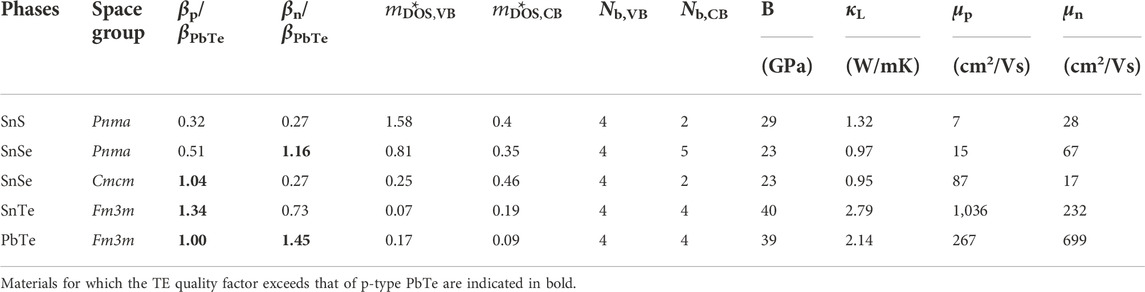
TABLE 1. Computed transport properties and thermoelectric quality factor β at 300 K for SnS, SnSe, and SnTe obtained from semi-empirical models (Yan et al., 2015; Miller et al. 2017). For each Sn chalcogenide, β is normalized to the corresponding value for p-type PbTe (44.15). For p-type materials, SnSe (Cmcm) and SnTe have TE quality factor exceeding that of p-type PbTe; for n-type materials only SnSe (Pnma) has TE quality factor exceeding p-type PbTe.
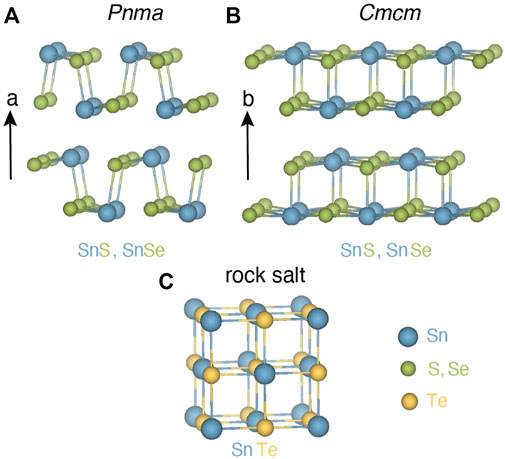
FIGURE 2. (A) SnS and SnSe form in layered orthorhombic crystal structure Pnma at room temperature. Sn (blue) and S, Se (green) atoms are connected with strong Sn-S, Sn-Se bonds in the plane and weak bonds normal to the plane (a-direction). (B) High-temperature phase for SnS (∼950 K) and SnSe (∼800 K) in the orthorhombic crystal structure in higher symmetry Cmcm space group. (C) SnTe crystallizes in the rock salt phase where each Sn (blue) is bonded with six Te (gold) atoms forming symmetric octahedral bonds.
The predicted β and associated parameters that we obtained are summarized in Table 1. The values reported here are updated from those in Yan et al. (2015) due to the inclusion of spin-orbit coupling and the improved thermal conductivity model (Miller et al., 2017). For each material we show the quality factor normalized by the corresponding value in p-type PbTe, for both p-type (βp/βPbTe,p) and n-type (βn/βPbTe,p) carriers.
Focusing on p-type performance, from Table 1, both SnSe (Cmcm) and SnTe have higher βp than PbTe. The large βp for SnSe is expected; experimentally, p-type SnSe exhibits the highest reported zT amongst all single crystal materials (Zhao et al., 2014). On the other hand, SnTe does show reasonable zT experimentally, but larger values are only achieved when alloyed (Al Rahal Al Orabi et al., 2016; Doi et al., 2019; Ma et al., 2019; Tang et al., 2018; Tan et al., 2015). The Cmcm phase of SnSe shows higher βp than the Pnma phase, consistent with the experimentally reported higher zTs (Zhao et al., 2014; Qin et al., 2018; Zhao et al., 2015; Chere et al., 2016). The larger βp for Cmcm arises from the higher hole mobility and comparable lattice thermal conductivity to the Pnma phase; the higher hole mobility in turn arises from a lower band effective mass. Similarly, we obtained good βp for SnTe due to very low valence band effective mass resulting in high mobility. Although we predicted βp to be low in SnS, recent experiments have shown that a zT of 1.6 is achievable in p-type SnS when alloyed with Se (He et al., 2019).
For n-type performance indicator βn, we predict the highest performance again for SnSe, but now in the low symmetry Pnma phase due to high band degeneracy in the conduction band and high mobility which also matches previous computational analysis on SnSe (Kutorasinski et al., 2015). Experiments also support this prediction, as almost all n-type reports of high zT in SnSe are in the Pnma phase (Zhang et al., 2015; Duong et al., 2016; Chang et al., 2016; Shang et al., 2019; Cha et al., 2019; Cai J et al., 2020; Gu et al., 2021). Meanwhile the n-type ratio βn/βPbTe,p is 0.73 for SnTe, and is only 0.27 for SnS. There are no reports of n-type SnTe unless heavily alloyed with PbTe (Pang et al., 2021), and very few reports of n-type SnS (Zhi-Cheng et al., 2019; Hu et al., 2019).
3.2 zT vs carrier concentration: Computation and experiments
We next used the computed values of β to predict the carrier concentration dependence of zT for each material. Figures 3, 4 show the carrier concentration dependence for p-type and n-type materials respectively, which are compared to previous experimentally reported values we obtained from literature. Since the predicted values of β in Table 1 are valid for 300 K, to make each curve we used Eq. 7 to estimate the corresponding value for β at 900 K for SnS (Pnma) and SnTe (rock salt) and 800 K for SnSe (Pnma and Cmcm) phases, which are more typical of the temperatures at which zT has been reported. The predicted zT at different temperatures are also shown in Supplementary Figures S2, S3.
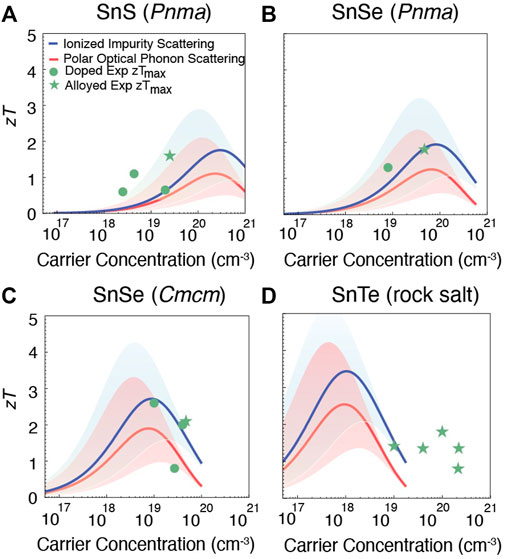
FIGURE 3. Prediction of zT for p-type (A) SnS (Pnma), (B) SnSe (Pnma), (C) SnSe (Cmcm), and (D) SnTe (rock salt). The red and blue lines show zT for polar optical phonon and ionized impurity limited carrier mobility, respectively. The shaded region accounts for the uncertainty in the predicted mobility μ0. The largest experimentally reported zTs for both doped (green dots) and alloyed compositions (green asterisks) are shown for comparison (Zhou et al., 2017; Tan et al., 2014; He et al., 2019; Cai B et al., 2020; Zhao et al., 2014; 2015; Qin et al., 2018; Chere et al., 2016; Al Rahal Al Orabi et al., 2016; Doi et al., 2019; Ma et al., 2019; Tang et al., 2018; Tan et al., 2015).
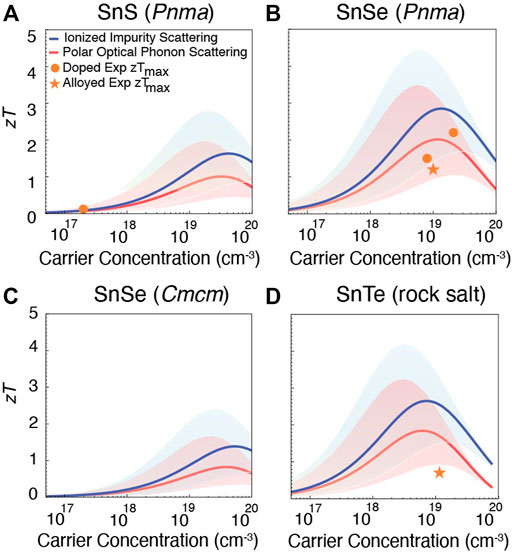
FIGURE 4. Prediction of zT for n-type (A) SnS (Pnma), (B) SnSe (Pnma), (C) SnSe (Cmcm), and (D) SnTe (rock salt). The shaded region accounts for the uncertainty in the predicted mobility μ0. The largest experimentally reported zTs for both doped (orange dots) and alloyed compositions (orange asterisks) are shown for comparison (Zhi-Cheng et al., 2019; Hu et al., 2019; Zhang et al., 2015; Duong et al., 2016; Chang et al., 2016; Shang et al., 2019; Cha et al., 2019; Cai J et al., 2020; Gu et al., 2021; Pang et al., 2021). Compared to p-type, there are fewer experimental reports for n-type Sn chalcogenides.
To extrapolate β to these higher temperatures, we assumed that the ratio of the mobility μ0 to the lattice thermal conductivity κL remains constant. In Figures 3, 4, dots indicate reported zT for doped materials, while asterisks are used to denote prior measurements for alloyed systems. Doping typically refers to the controlled addition of a small quantity of impurities to adjust electrical properties, whereas alloying is the formation of a solid solution; here the ‘doped’ and ‘alloyed’ labels are assigned based on the original authors’ classification.
Predicted zT in the p-type Sn chalcogenides is shown in Figure 3. The red line shows the dependence of zT on carrier concentration for the case of polar optical phonon limited carrier mobility, while the blue line corresponds to impurity scattering limited mobility. Both of these regimes are shown since, although polar optical phonon scattering has been predicted to be the dominant bulk scattering mechanism in most binary chalcogenides (Ganose et al., 2021), impurity scattering can also dominate when doping levels are substantial. Each line also contains a shaded region around it, corresponding to a factor of ten uncertainty in the semi-empirical model for carrier mobility.
For both Pnma and Cmcm SnSe, the computational predictions are in good agreement with experiment (Figures 3B,C). This comparison also shows that the predicted high zT has been achieved experimentally (Zhao et al., 2014; Qin et al., 2018; Zhao et al., 2015; Chere et al., 2016) for p-type SnSe. On the other hand for SnS and SnTe, there is more discrepancy between the model predictions and experiment. These discrepancies likely arise 1) from uncertainties in the model and computed parameters, and 2) because many of the experimentally reported values correspond to alloys (especially for SnTe). In spite of these differences, from Figure 3A it appears that higher zT may be possible for SnS if the hole carrier concentration could be increased beyond typical values (Zhou et al., 2017; Tan et al., 2014; He et al., 2019; Cai B et al., 2020) of 1018–1019 cm−3. For p-type SnTe Figure 3D suggests the opposite: that even higher zT could be achieved if hole concentrations could be reduced below typical values (Al Rahal Al Orabi et al., 2016; Doi et al., 2019; Ma et al., 2019; Tang et al., 2018; Tan et al., 2015) of
Similarly, predicted zT for n-type Sn chalcogenides is shown in Figure 4. Compared to p-type counterparts, there are fewer experimental measurements of n-type SnS and SnSe (Pnma), and no n-type performance has been reported for either SnSe (Cmcm) or SnTe (unless heavily alloyed with PbTe Pang et al. (2021)). For SnS (Figure 4A), only two experimental measurements (Zhi-Cheng et al., 2019; Hu et al., 2019) are available, showing zT = 0.12 and zT = 0.17 (the dots in Figure 4A overlap). Here, the predictions indicate that higher zT could be achieved by increasing the electron carrier concentration. For SnSe (Pnma), reasonable n-type zTs have been reported. Within the uncertainty of the computational predictions, slight improvements may be possible with further carrier concentration tuning (Figure 4B). The predicted n-type performance of the Cmcm phase of SnSe is quite low compared to the Pnma phase (Figure 4C). For SnTe, although the inability to achieve n-type material is well-known it is interesting to note that the model predicts that for electron carrier concentrations on the order of
We note that the required carrier concentration to achieve maximum zT depends on the β of each material, which in turn arises from the material’s electronic structure. Starting with p-type compounds, SnS has a comparatively low β, therefore to reach its maximum zT high hole carrier concentration on the order of 1020–1021 cm−3 is required. For p-type SnSe in the Pnma phase, β is higher than p-type SnS, so the required hole carrier concentration is on the order of
However, as shown by the shaded curves in Figures 3, 4, there are uncertainties in the semi-empirical models used to estimate mobilities and lattice thermal conductivity, and therefore quality factor β. The evaluated mobilities introduce a particularly large uncertainty, as they may vary by an order of magnitude from experimentally measured ones. For instance, the predicted hole mobilities for SnS, SnSe, and SnTe are around 7, 15, and 1,000 cm2/(Vs) while the experimental hole mobilities are 80, 170, and 650 cm2/(Vs) at 300 K (Al Rahal Al Orabi et al., 2016; Ganose et al., 2021). The discrepancies arise from the empirical nature of the scattering models and the neglect of the role of defects themselves when estimating mobility. One effective approach to overcome the uncertainty of the predicted mobility would be to obtain the mobility from readily available experimental data instead, using the concept of the “weighted mobility” μw (Snyder et al., 2020). The weighted mobility can be obtained from measurements of the Seebeck coefficient and electrical resistivity, and is related to the drift mobility by
From here, target carrier concentrations can again be identified for maximum thermoelectric performance.
In summary, by optimizing carrier concentration improvements may be possible in p-type SnS and SnTe, and n-type SnS, SnSe (Pnma), and SnTe. Meanwhile the p-type performance observed in SnSe appears to be close to its peak predicted value. However, realizing improved performance relies on the ability to tune carrier concentrations, which in turn depends on native defects and dopability. To assess the possibility of achieving the target carrier concentrations, in the next section we analyze the dopability of SnS, SnTe, and SnSe (Pnma).
3.3 Dopability predictions
3.3.1 Phase stability
The first step for dopability analysis is to establish the phase stability limits of SnS (Pnma), SnSe (Pnma), and SnTe (Fm3m). Thermodynamic stability is set by an allowable range of chemical potentials Δμi(T, P) that give the availability of each element i, with more (or less) negative values indicating relative scarcity (or abundance) in the thermodynamic environment. Outside of this range, the compound becomes unstable with respect to the formation of competing boundary phases. Beyond determining stability limits, by controlling chemical potentials during growth it is possible to tune defect concentrations and gain better control over both carrier type and quantity, dopability, and transport (Ohno et al., 2018; Male et al., 2019; Ortiz et al., 2019).
The chemical potential stability regions of SnS, SnSe and SnTe are indicated by the teal lines in Figure 5, as a function of the chemical potential ΔμSn. For binary Sn compounds, fixing the chemical potential ΔμSn correspondingly fixes the chemical potential of the remaining element. For SnS for instance
where ΔHf(SnS) is the enthalpy of formation of SnS. The stability region for each compound is therefore shown as a one-dimensional line in Figure 5 that spans the allowed range of Sn-poor to Sn-rich conditions. The line is bounded on both ends by “invariant points,” fixed points that correspond to two-phase equilibria between the compound of interest and a second, competing phase. The competing boundary phases that limit the stability of SnS are elemental Sn (under Sn-rich conditions) and SnS2 (under S-rich conditions). Elemental Sn and SnSe2 limit the stability of SnSe for Sn-rich and Se-rich conditions, respectively. For SnTe, the stability region is bounded by Sn and Te for Sn-rich and Te-rich conditions respectively, as there are no other competing phases in the Sn-Te binary phase diagram.
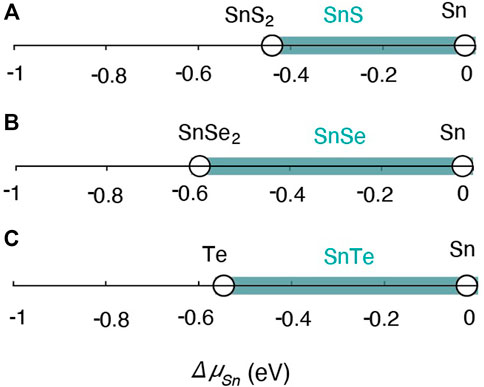
FIGURE 5. Phase stability regions for Orthorhombic (A) SnS (Pnma), (B) SnSe (Pnma) and rock salt (C) SnTe (Fm3m) in chemical potential space (shaded teal region) with the limiting phases denoted (black circles).
We found formation energies from DFT-HSE for SnS, SnSe, and SnTe to be ΔHf = −0.43, −0.44, and −0.28 eV per atom, while the reported experimental formation energies are ΔHf = −0.57, −0.47, and −0.32 eV per atom (Stevanović et al., 2012; Castanet et al., 1972). The difference between DFT-HSE and experimental reports is within 0.14 eV/atom for all three compounds, which is within the expected range of DFT uncertainties (Stevanović et al., 2012; Kim et al., 2016). Considering the competing phases of all three compounds the chemical potential boundaries are −0.43 eV
3.3.2 Approach to dopability prediction
We next analyzed the defect chemistry and dopability of all three compounds to determine if the optimal carrier concentrations we identified in Section 3.2 are accessible via control over defects. The dopability window of a compound is established from the formation energies of native defects at each of the two invariant points of the stability region. For the binary Sn chalcogenides, Sn-poor conditions are most favorable for acceptor Sn vacancies VSn to form and therefore represent conditions that promote larger p-type carrier concentrations. In contrast, Sn-rich (anion-poor) conditions are most favorable for anion donor vacancies to form, and therefore most suitable when trying to achieve large n-type carrier concentration. By investigating defect formation at these two extremes, the complete accessible range of carrier concentrations under equilibrium can be established for each compound.
Defect formation energies ΔHD,q are typically shown as a function of semiconductor Fermi level EF, which varies from the valence band maximum (VBM) to conduction band minimum (CBM). Accurate chemical potentials and band gaps are prerequisites to obtaining accurate defect formation energies. In addition to discrepancies between experiment and DFT-HSE in formation energies, there are also discrepancies between DFT-HSE and experimental band gaps. The band gaps obtained using DFT-HSE for SnS, SnSe, and SnTe are 1.31, 1.09, and 0.18 eV while the experimental band gaps are 1.2 eV (Albers et al., 1960; Zhou et al., 2017), 0.9 eV (Lefebvre et al., 1998), and 0.18 eV (Rogers, 1968; Dimmock et al., 1966), showing differences that lie within the expected range of HSE band gap uncertainties.(see Supplementary Table S1).
Carrier concentrations are exponential functions of defect formation energies, so small errors in defect formation energies can translate to large errors in predicted carrier concentrations. In the following, predicted carrier concentrations are shown for two cases: 1) the pure DFT-HSE prediction (labeled “pure DFT”), and 2) the DFT-HSE prediction with empirical corrections for chemical potentials and band gaps (labeled “DFT + Exp”). For the latter, we adjusted the band gap by applying equal shifts to both band edge positions to match the experimental band gap. We further shifted the calculated total energies of each Sn binary to match the experimental formation energy. The comparison of the two sets of results allows us to estimate the degree of uncertainty in computed carrier concentrations.
3.3.3 Defect chemistry of SnTe
Formation energies of native point defects in SnTe in both Sn-rich and Sn-poor growth conditions are shown in Figures 6A,B. The native defects include vacancies VSn and VTe and antisite defects SnTe and TeSn, all of which were considered in varying charge states. Following convention, we show only the minimum energy charge state of each defect in Figure 6. Interstitial defects were originally considered for all three Sn chalcogenides at the PBE level, but were found to have higher formation energies compared to vacancies and antisites (Supplementary Figure S4); therefore we did not include them in the DFT-HSE results for dopability analysis.
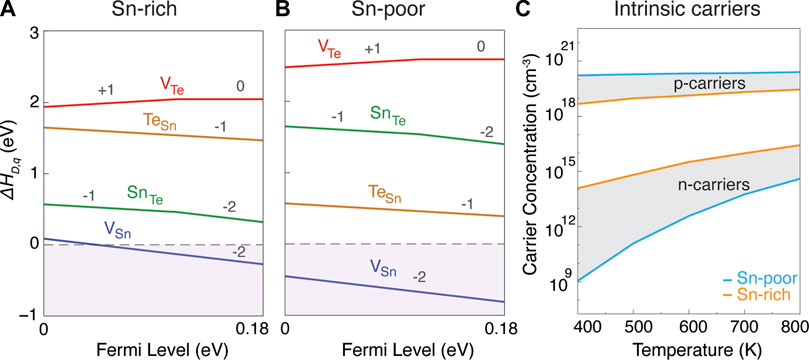
FIGURE 6. Defect formation energy for native point defects as a function of Fermi level (EF) in SnTe under (A) Sn-rich and (B) Sn-poor growth conditions. In both growth conditions, VSn is the dominant acceptor defect which pushes the Fermi level below the VBM and makes SnTe a degenerate p-type semiconductor. (C) Prediction of both hole and electron carrier concentrations as a function of temperature in Sn-rich and Sn-poor growth conditions.
Under both Sn-rich (Figure 6A) and Sn-poor (Figure 6B) growth conditions, Sn vacancies (VSn) act as the dominant acceptor defect with ultra-low formation energy. The next lowest energy defects are the two antisites, which flip their relative energies between Sn-rich and Sn-poor conditions. The only donor defect, VTe, shows high formation energy across the full stability region. The ultra-low formation energy of acceptor VSn for both extremes of growth conditions indicates that VSn will be the dominant defect in SnTe across the full stability region. This result is consistent with the degenerate p-type behavior that is experimentally reported in SnTe (Doi et al., 2019; Ma et al., 2019; Tang et al., 2018; Tan et al., 2015). It is also consistent with the experimental observation that it is nearly impossible to synthesize stoichiometric SnTe (Zhou et al., 2014), with materials always showing cation deficiency. As also suggested in Wang et al. (2014), we believe that the reason for the ultra-low formation energy of VSn is related to the high band edge position of the VBM of the Fm3m phase of SnTe (on an absolute scale, in comparison to the subsequent compounds to be discussed below). For example, we found the formation energy of VSn and other acceptor defects to be comparatively higher in a hypothetical Pnma phase of SnTe and more similar to the Pnma phases of SnS and SnSe (see Supplementary Figure S5).
For SnTe, the previous analysis from Figure 3D indicated the possibility of improved zT if p-type carrier concentrations could be reduced. However, Figure 6 shows that this is not possible and provides an explanation for the large p-type carrier concentrations around 1020 cm−3 in Figure 3D. For both Sn-rich and Sn-poor cases, we found that the equilibrium Fermi energy
Although the defect analysis suggests that tuning carrier concentrations in bulk material is challenging, other strategies for engineering SnTe may still be possible. For example, alloying with PbTe (Pang et al., 2021) and CaTe (Al Rahal Al Orabi et al., 2016) may help push the VBM lower, increasing VSn formation energies and reducing carrier concentrations. Alternatively, recent approaches to controlling disorder have been suggested as routes to TE performance optimization (Roychowdhury et al., 2021; Agne et al., 2021). In these cases, the use of disorder-induced carrier localization could be used for TE improvement via tuning of carrier mobilities in order to increase Seebeck coefficient while maintaining electrical conductivity. This strategy might also be helpful to reduce lattice thermal conductivity through nanostructuring as shown in Ref. Roychowdhury et al. (2021). Finally, considerations of alternative scattering mechanisms or more sophisticated treatments of scattering, such as the four coefficient approach (Crawford et al., 2021), have been found to yield different optimized values for parameters such as carrier concentrations.
3.3.4 Defect chemistry of SnS
For SnS, it is of interest to determine whether it is possible to increase carrier concentrations to improve TE performance, particularly for n-type material. The formation energies of native point defects and their applicable charge states under Sn-poor and Sn-rich growth conditions from pure DFT are shown in Figures 7A,B (the empirically corrected diagrams are shown in the Supplementary Figure S6A). The equilibrium Fermi energy
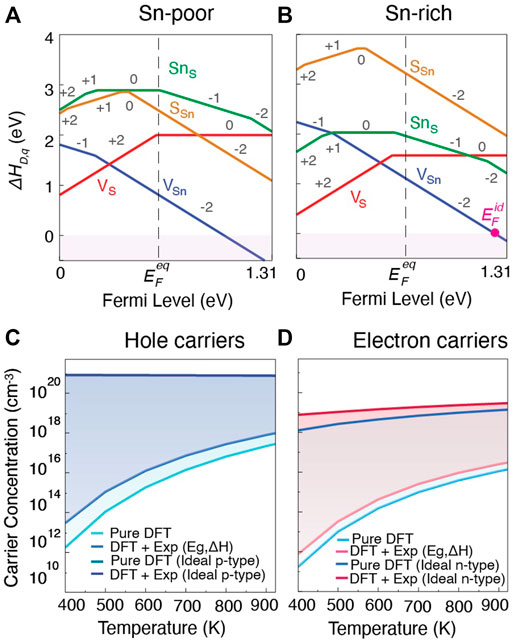
FIGURE 7. Defect formation energies as a function of Fermi level in SnS (Pnma) for (A) Sn-poor and (B) Sn-rich growth condition. Intrinsic and ideal carrier concentrations for (C) holes in Sn-poor, and (D) electrons in Sn-rich, conditions as a function of temperature. For (C,D), lighter shades indicate the carrier concentrations for undoped materials and darker shades indicate carrier concentrations for ideal extrinsically doped materials. While ideal
However, SnS also has a wider band gap compared to SnTe (1.31 eV vs. 0.18 eV), making it more difficult to achieve high carrier concentration. To assess the maximum p-type and n-type carrier concentration achievable in SnS, we calculated both the intrinsic and the ideal carrier concentration in Sn-poor and Sn-rich growth conditions. The intrinsic carrier concentration refers to the carrier concentration that can be achieved without the introduction of extrinsic dopants. It arises from the range of accessible equilibrium Fermi levels
The predicted intrinsic and ideal hole carrier concentrations are shown in Figure 7C. Light colors indicate intrinsic and dark colors ideal hole concentrations at Sn-poor conditions. The intrinsic hole carrier concentration at 923 K from pure DFT is predicted to be 2.8 × 1017cm−3, and increases to 9.8 × 1017cm−3 when empirical corrections to band gap and chemical potentials are applied. These values match fairly closely with reported experimental measurements for undoped material which range from 4 × 10¹⁷–1018 cm−3 at similar temperatures (Tan et al., 2014; Abraham et al., 1978). As an upperbound, with an ideal p-type dopant, hole carrier concentrations on the order of 1020 cm−3 would be achievable. Reported carrier concentrations for doped or alloyed SnS range between 2 × 10¹⁸ to 3 × 1019 cm−3 (Zhou et al., 2017; Tan et al., 2014; He et al., 2019; Cai B et al., 2020). Our combined analysis using β and dopability predictions suggest that there is opportunity to achieve higher p-type zT through improving hole carrier concentration by extrinsic doping.
To assess achievable n-type performance, predicted intrinsic and ideal electron carrier concentrations are shown in Figure 7D. Compared to hole carrier concentrations in Figure 7C, achievable electron carrier concentrations are generally lower. For intrinsic material again at 923 K, we predict carrier concentrations of 1.4 × 1016 cm−3 for pure DFT and 3.6 × 1016 cm−3 for empirically-corrected DFT, about an order of magnitude lower than the corresponding p-type values. The predicted ideal electron concentration suggests that with an ideal n-type dopant, electron carrier concentrations on the order of 1019 cm−3 might be achievable suggesting that SnS is n-type dopable. To date, n-type carrier concentrations in extrinsically doped or alloyed SnS lie around
3.3.5 Defect chemistry of SnSe
Lastly, focusing on n-type performance, we analyze the dopability of SnSe in the Pnma phase to evaluate whether it is possible to tune carrier concentration to improve TE performance. Only the defect chemistry at Sn-rich growth condition is shown in Figure 8A from pure DFT (the empircally corrected diagrams for both Sn-rich and Sn-poor condition are shown in the Supplementary Figure S6B). Similar to SnS, VSn and VSe act as the primary acceptor and donor defects respectively, and their relative energies determine the position of
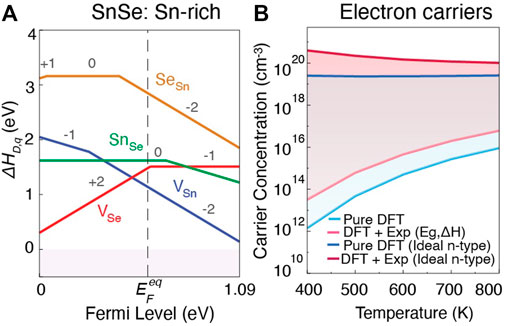
FIGURE 8. (A) Defect formation energies as a function of Fermi level, and (B) intrinsic and ideal carrier concentrations for electrons under Sn-rich growth conditions in SnSe (Pnma). The lighter and darker shades in (B) indicate electron carrier concentrations for undoped and ideal extrinsically doped materials, respectively.
Predicted intrinsic and ideal electron carrier concentrations are shown in Figure 8B. For intrinsic material at 800 K, we predict carrier concentrations of 9.6 × 1015 cm−3 for pure DFT and 6.11 × 1016 cm−3 for empirically-corrected DFT. Here the order of magnitude difference arises from the ∼0.2 eV band gap difference between DFT-HSE and experiment. The predicted ideal electron concentration suggests that electron carrier concentrations ranging between 1019 to 1020 cm−3 might be achievable from pure and empirically-corrected DFT, respectively. To date, n-type carrier concentrations in extrinsically doped or alloyed SnSe lie on the order of
4 Conclusion
In this work, we studied the TE quality factor approach to identify improvement opportunities in TE performance in the well-known Sn-based IV-VI binary compounds SnS, SnSe, and SnTe focusing on intrinsic properties and dopability. First, we predicted zT using the TE quality factor formalism through estimations of parameter β. The predicted value of β for n and p-type versions of all three materials results in distinct target carrier concentrations for each material, with SnS requiring larger, and SnTe requiring lower, carrier concentrations. Although comparison of these predictions to a comprehensive literature search revealed opportunities for improvement in all three Sn chalcogenides, the subsequent dopability analysis showed that the defect chemistry of each material constrains its TE performance in a distinct way. In SnS, improved TE performance in both p-type and n-type material can be achieved if suitable extrinsic dopants can be found. For SnSe, the p-type performance in the Cmcm phase appears to have reached its potential, but improved n-type TE performance can be achieved in the Pnma phase through proper tuning of electron carrier concentration. For SnTe both p-type and n-type performance is constrained by the degenerate p-type carrier concentrations arising from the abundance of low energy VSn defects. Through this work, we aim to show the importance of carefully considering both intrinsic and extrinsic properties in a computation-guided search, as a general strategy to be utilized across diverse arrays of materials for TE application. It is of future interest to carry out comprehensive quantitative comparisons between computationally-predicted and experimentally-measured performance in diverse families of materials as demonstrated here for binary chalcogenides as a way to benchmark the accuracy attainable and typical uncertainties in first-principles approaches to TE materials.
Data availability statement
The datasets presented in this study can be found in online repositories. The names of the repository/repositories and accession number(s) can be found below: https://github.com/ertekin-research-group/2022-Bipasha-Sn-Binaries.
Author contributions
FB and EE contributed to conception and design of the study. FB, LG, and JQ performed the computational simulations and analysis of results. FB wrote the first draft of the manuscript. All authors contributed to manuscript revision, read, and approved the submitted version.
Funding
This work was funded with support from the US National Science Foundation (NSF) via Grant No. DMR 1729149 and the DIGI-MAT program, Grant No. 1922758.
Acknowledgments
Computational resources were provided by the Extreme Science and Engineering Discovery Environment Towns et al. (2014), now ACCESS (Advanced Cyberinfrastructure Coordination Ecosystem: Services Support) through Bridges-2 at the Pittsburgh Supercomputing Center through allocation TG-MAT220011.
Conflict of interest
The authors declare that the research was conducted in the absence of any commercial or financial relationships that could be construed as a potential conflict of interest.
Publisher’s note
All claims expressed in this article are solely those of the authors and do not necessarily represent those of their affiliated organizations, or those of the publisher, the editors and the reviewers. Any product that may be evaluated in this article, or claim that may be made by its manufacturer, is not guaranteed or endorsed by the publisher.
Supplementary material
The Supplementary Material for this article can be found online at: https://www.frontiersin.org/articles/10.3389/femat.2022.1059684/full#supplementary-material
References
Abraham, T., Juhasz, C., Silver, J., Donaldson, J., and Thomas, M. (1978). A TIN-119 Mössbauer and electrical conductivity study of the system SnxGe1-xSe (0 ⩽x⩽ 1). Solid State Commun. 27, 1185–1187. doi:10.1016/0038-1098(78)91139-0
Adamczyk, J. M., Bipasha, F. A., Rome, G. A., Ciesielski, K., Ertekin, E., and Toberer, E. S. (2022). Symmetry breaking in Ge1−xMnxTe and the impact on thermoelectric transport. J. Mat. Chem. A 10, 16468–16477. doi:10.1039/d2ta02347d
Adamczyk, J. M., Gomes, L. C., Qu, J., Rome, G. A., Baumann, S. M., Ertekin, E., et al. (2020). Native defect engineering in CuInTe2. Chem. Mat. 33, 359–369. doi:10.1021/acs.chemmater.0c04041
Agne, M. T., Lange, F. R., Male, J. P., Siegert, K. S., Volker, H., Poltorak, C., et al. (2021). Disorder-induced anderson-like localization for bidimensional thermoelectrics optimization. Matter 4, 2970–2984. doi:10.1016/j.matt.2021.07.017
Al Rahal Al Orabi, R., Mecholsky, N. A., Hwang, J., Kim, W., Rhyee, J.-S., Wee, D., et al. (2016). Band degeneracy, low thermal conductivity, and high thermoelectric figure of merit in SnTe–CaTe alloys. Chem. Mat. 28, 376–384. doi:10.1021/acs.chemmater.5b04365
Albers, W., Haas, C., and van der Maesen, F. (1960). The preparation and the electrical and optical properties of SnS crystals. J. Phys. Chem. Solids 15, 306–310. doi:10.1016/0022-3697(60)90253-5
Bipasha, F. A. (2022). 2022-bipasha-sn-binaries. Available at: https://github.com/ertekin-research-group/2022-Bipasha-Sn-Binaries
Birch, F. (1952). Elasticity and constitution of the Earth’s interior. J. Geophys. Res. 57, 227–286. doi:10.1029/jz057i002p00227
Biswas, K., He, J., Blum, I. D., Wu, C.-I., Hogan, T. P., Seidman, D. N., et al. (2012). High-performance bulk thermoelectrics with all-scale hierarchical architectures. Nature 489, 414–418. doi:10.1038/nature11439
Blöchl, P. E. (1994). Projector augmented-wave method. Phys. Rev. B 50, 17953–17979. doi:10.1103/physrevb.50.17953
Cai, B., Zhao, L.-D., and Li, J.-F. (2020). High thermoelectric figure of merit zT gtrbin 1 in SnS polycrystals. J. Materiomics 6, 77–85. doi:10.1016/j.jmat.2019.12.003
Cai, J., Zhang, Y., Yin, Y., Tan, X., Duan, S., Liu, G.-Q., et al. (2020). Investigating the thermoelectric performance of n-type SnSe: the synergistic effect of NbCl5 doping and dislocation engineering. J. Mat. Chem. C 8, 13244–13252. doi:10.1039/d0tc02959a
Castanet, R., Claire, Y., and Laffite, M. (1972). Thermochemical data relative to the tin-tellurium and lead tellurium systems. High. Temp. 4, 343–351.
Cha, J., Zhou, C., Lee, Y. K., Cho, S.-P., and Chung, I. (2019). High thermoelectric performance in n-type polycrystalline SnSe via dual incorporation of Cl and PbSe and dense nanostructures. ACS Appl. Mat. Interfaces 11, 21645–21654. doi:10.1021/acsami.9b08108
Chami, N., Arbouche, O., Chibani, S., Driss Khodja, F.-Z., Amara, K., Ameri, M., et al. (2020). Computational prediction of structural, electronic, elastic, and thermoelectric properties of FeVX (X= As, P) half-heusler compounds. J. Electron. Mat. 49, 4916–4922. doi:10.1007/s11664-020-08225-4
Chang, C., Tan, Q., Pei, Y., Xiao, Y., Zhang, X., Chen, Y.-X., et al. (2016). Raising thermoelectric performance of n-type SnSe via Br doping and Pb alloying. RSC Adv. 6, 98216–98220. doi:10.1039/c6ra21884a
Chasmar, R. P., and Stratton, R. (1959). The thermoelectric figure of merit and its relation to thermoelectric generators. J. Electron. Control 7, 52–72. doi:10.1080/00207215908937186
Chere, E. K., Zhang, Q., Dahal, K., Cao, F., Mao, J., and Ren, Z. (2016). Studies on thermoelectric figure of merit of Na-doped p-type polycrystalline SnSe. J. Mat. Chem. A 4, 1848–1854. doi:10.1039/c5ta08847j
Crawford, C. M., Bensen, E. A., Vinton, H. A., and Toberer, E. S. (2021). Efficacy of the method of four coefficients to determine charge-carrier scattering. Phys. Rev. Appl. 16, 024004. doi:10.1103/physrevapplied.16.024004
Dimmock, J. O., Melngailis, I., and Strauss, A. J. (1966). Band structure and laser action in PbxSn1−xTe. Phys. Rev. Lett. 16, 1193–1196. doi:10.1103/physrevlett.16.1193
Doi, A., Shimano, S., Inoue, D., Kikitsu, T., Hirai, T., Hashizume, D., et al. (2019). Band engineering, carrier density control, and enhanced thermoelectric performance in multi-doped SnTe. Apl. Mat. 7, 091107. doi:10.1063/1.5116882
Duong, A. T., Nguyen, V. Q., Duvjir, G., Duong, V. T., Kwon, S., Song, J. Y., et al. (2016). Achieving zT=2.2 with Bi-doped n-type SnSe single crystals. Nat. Commun. 7, 13713. doi:10.1038/ncomms13713
Fang, T., Zheng, S., Zhou, T., Yan, L., and Zhang, P. (2017). Computational prediction of high thermoelectric performance in p-type half-heusler compounds with low band effective mass. Phys. Chem. Chem. Phys. 19, 4411–4417. doi:10.1039/c6cp07897d
Freysoldt, C., Grabowski, B., Hickel, T., Neugebauer, J., Kresse, G., Janotti, A., et al. (2014). First-principles calculations for point defects in solids. Rev. Mod. Phys. 86, 253–305. doi:10.1103/revmodphys.86.253
Fu, C., Bai, S., Liu, Y., Tang, Y., Chen, L., Zhao, X., et al. (2015). Realizing high figure of merit in heavy-band p-type half-heusler thermoelectric materials. Nat. Commun. 6, 8144. doi:10.1038/ncomms9144
Fu, L., Yin, M., Wu, D., Li, W., Feng, D., Huang, L., et al. (2017). Large enhancement of thermoelectric properties in n-type PbTe via dual-site point defects. Energy Environ. Sci. 10, 2030–2040. doi:10.1039/c7ee01871a
Gan, Y., Wang, G., Zhou, J., and Sun, Z. (2021). Prediction of thermoelectric performance for layered IV-V-VI semiconductors by high-throughput ab initio calculations and machine learning. Npj Comput. Mat. 7, 176–210. doi:10.1038/s41524-021-00645-y
Ganose, A. M., Park, J., Faghaninia, A., Woods-Robinson, R., Persson, K. A., and Jain, A. (2021). Efficient calculation of carrier scattering rates from first principles. Nat. Commun. 12, 2222–2229. doi:10.1038/s41467-021-22440-5
Gorai, P., Parilla, P., Toberer, E. S., and Stevanović, V. (2015). Computational exploration of the binary A1B1 chemical space for thermoelectric performance. Chem. Mat. 27, 6213–6221. doi:10.1021/acs.chemmater.5b01179
Gorai, P., Stevanović, V., and Toberer, E. S. (2017). Computationally guided discovery of thermoelectric materials. Nat. Rev. Mat. 2, 17053–17116. doi:10.1038/natrevmats.2017.53
Goyal, A., Gorai, P., Toberer, E. S., and Stevanović, V. (2017). First-principles calculation of intrinsic defect chemistry and self-doping in PbTe. Npj Comput. Mat. 3, 42. doi:10.1038/s41524-017-0047-6
Gu, W.-H., Zhang, Y.-X., Guo, J., Cai, J.-F., Zhu, Y.-K., Zheng, F., et al. (2021). Realizing high thermoelectric performance in n-type SnSe polycrystals via (Pb, Br) co-doping and multi-nanoprecipitates synergy. J. Alloys Compd. 864, 158401. doi:10.1016/j.jallcom.2020.158401
He, W., Wang, D., Wu, H., Xiao, Y., Zhang, Y., He, D., et al. (2019). High thermoelectric performance in low-cost SnS0.91Se0.09 crystals. Science 365, 1418–1424. doi:10.1126/science.aax5123
Hu, X., He, W., Wang, D., Yuan, B., Huang, Z., and Zhao, L.-D. (2019). Thermoelectric transport properties of n-type tin sulfide. Scr. Mat. 170, 99–105. doi:10.1016/j.scriptamat.2019.05.043
Hu, X., Jood, P., Ohta, M., Kunii, M., Nagase, K., Nishiate, H., et al. (2016). Power generation from nanostructured PbTe-based thermoelectrics: comprehensive development from materials to modules. Energy Environ. Sci. 9, 517–529. doi:10.1039/c5ee02979a
Kim, N., Martin, P. P. n., Rockett, A. A., and Ertekin, E. (2016). Screened-exchange density functional theory description of the electronic structure and phase stability of the chalcopyrite materials AgInSe2 and AuInSe2. Phys. Rev. B 93, 165202. doi:10.1103/physrevb.93.165202
Kresse, G., and Furthmüller, J. (1996). Efficient iterative schemes for ab initio total-energy calculations using a plane-wave basis set. Phys. Rev. B 54, 11169–11186. doi:10.1103/physrevb.54.11169
Krukau, A. V., Vydrov, O. A., Izmaylov, A. F., and Scuseria, G. E. (2006). Influence of the exchange screening parameter on the performance of screened hybrid functionals. J. Chem. Phys. 125, 224106. doi:10.1063/1.2404663
Kutorasinski, K., Wiendlocha, B., Kaprzyk, S., and Tobola, J. (2015). Electronic structure and thermoelectric properties ofn- andp-type SnSe from first-principles calculations. Phys. Rev. B 91, 205201. doi:10.1103/physrevb.91.205201
Lany, S., and Zunger, A. (2008). Assessment of correction methods for the band-gap problem and for finite-size effects in supercell defect calculations: Case studies for ZnO and GaAs. Phys. Rev. B 78, 235104. doi:10.1103/physrevb.78.235104
Lee, S., Esfarjani, K., Luo, T., Zhou, J., Tian, Z., and Chen, G. (2014). Resonant bonding leads to low lattice thermal conductivity. Nat. Commun. 5, 3525–3528. doi:10.1038/ncomms4525
Lefebvre, I., Szymanski, M. A., Olivier-Fourcade, J., and Jumas, J. C. (1998). Electronic structure of tin monochalcogenides from SnO to SnTe. Phys. Rev. B 58, 1896–1906. doi:10.1103/physrevb.58.1896
Li, J., Zhang, X., Lin, S., Chen, Z., and Pei, Y. (2016). Realizing the high thermoelectric performance of GeTe by Sb-doping and Se-alloying. Chem. Mat. 29, 605–611. doi:10.1021/acs.chemmater.6b04066
Li, J., Zheng, S., Fang, T., Yue, L., Zhang, S., and Lu, G. (2018). Computational prediction of a high ZT of n-type Mg3Sb2-based compounds with isotropic thermoelectric conduction performance. Phys. Chem. Chem. Phys. 20, 7686–7693. doi:10.1039/c7cp08680f
Ma, Z., Wang, C., Lei, J., Zhang, D., Chen, Y., Wang, J., et al. (2019). High thermoelectric performance of SnTe by the synergistic effect of alloy nanoparticles with elemental elements. ACS Appl. Energy Mat. 2, 7354–7363. doi:10.1021/acsaem.9b01325
Madsen, G. K., Carrete, J., and Verstraete, M. J. (2018). Boltztrap2, a program for interpolating band structures and calculating semi-classical transport coefficients. Comput. Phys. Commun. 231, 140–145. doi:10.1016/j.cpc.2018.05.010
Madsen, G. K. H. (2006). Automated search for new thermoelectric materials: The case of LiZnSb. J. Am. Chem. Soc. 128, 12140–12146. doi:10.1021/ja062526a
Madsen, G. K., and Singh, D. J. (2006). Boltztrap. a code for calculating band-structure dependent quantities. Comput. Phys. Commun. 175, 67–71. doi:10.1016/j.cpc.2006.03.007
Male, J., Agne, M. T., Goyal, A., Anand, S., Witting, I. T., Stevanović, V., et al. (2019). The importance of phase equilibrium for doping efficiency: iodine doped PbTe. Mat. Horiz. 6, 1444–1453. doi:10.1039/c9mh00294d
Miller, S. A., Gorai, P., Ortiz, B. R., Goyal, A., Gao, D., Barnett, S. A., et al. (2017). Capturing anharmonicity in a lattice thermal conductivity model for high-throughput predictions. Chem. Mat. 29, 2494–2501. doi:10.1021/acs.chemmater.6b04179
Ohno, S., Imasato, K., Anand, S., Tamaki, H., Kang, S. D., Gorai, P., et al. (2018). Phase boundary mapping to obtain n-type Mg3Sb2-based thermoelectrics. Joule 2, 141–154. doi:10.1016/j.joule.2017.11.005
Ortiz, B. R., Gordiz, K., Gomes, L. C., Braden, T., Adamczyk, J. M., Qu, J., et al. (2019). Carrier density control in Cu2HgGeTe4 and discovery of Hg2GeTe4 via phase boundary mapping. J. Mat. Chem. A 7, 621–631. doi:10.1039/c8ta10332a
Pang, H., Qiu, Y., Wang, D., Qin, Y., Huang, R., Yang, Z., et al. (2021). Realizing n-type SnTe thermoelectrics with competitive performance through suppressing Sn vacancies. J. Am. Chem. Soc. 143, 8538–8542. doi:10.1021/jacs.1c02346
Pei, Y., LaLonde, A., Iwanaga, S., and Snyder, G. J. (2011a). High thermoelectric figure of merit in heavy hole dominated PbTe. Energy Environ. Sci. 4, 2085. doi:10.1039/c0ee00456a
Pei, Y., Shi, X., LaLonde, A., Wang, H., Chen, L., and Snyder, G. J. (2011b). Convergence of electronic bands for high performance bulk thermoelectrics. Nature 473, 66–69. doi:10.1038/nature09996
Perdew, J. P., Burke, K., and Ernzerhof, M. (1996). Generalized gradient approximation made simple. Phys. Rev. Lett. 77, 3865–3868. doi:10.1103/physrevlett.77.3865
Qin, B., Wang, D., He, W., Zhang, Y., Wu, H., Pennycook, S. J., et al. (2018). Realizing high thermoelectric performance in p-type SnSe through crystal structure modification. J. Am. Chem. Soc. 141, 1141–1149. doi:10.1021/jacs.8b12450
Qu, J., Porter, C. E., Gomes, L. C., Adamczyk, J. M., Toriyama, M. Y., Ortiz, B. R., et al. (2021). Controlling thermoelectric transport via native defects in the diamond-like semiconductors Cu2HgGeTe4 and Hg2GeTe4. J. Mat. Chem. A 9, 26189–26201. doi:10.1039/d1ta07410e
Qu, J., Stevanović, V., Ertekin, E., and Gorai, P. (2020). Doping by design: finding new n-type dopable ABX4 zintl phases for thermoelectrics. J. Mat. Chem. A 8, 25306–25315. doi:10.1039/d0ta08238d
Rogers, L. (1968). Valence band structure of SnTe. J. Phys. D. Appl. Phys. 1, 304–852. doi:10.1088/0022-3727/1/7/304
Roychowdhury, S., Ghosh, T., Arora, R., Samanta, M., Xie, L., Singh, N. K., et al. (2021). Enhanced atomic ordering leads to high thermoelectric performance in AgSbTe2. Science 371, 722–727. doi:10.1126/science.abb3517
Samanta, M., and Biswas, K. (2017). Low thermal conductivity and high thermoelectric performance in (GeTe)1−2x(GeSe)x(GeS)x: Competition between solid solution and phase separation. J. Am. Chem. Soc. 139, 9382–9391. doi:10.1021/jacs.7b05143
Samanta, M., Ghosh, T., Arora, R., Waghmare, U. V., and Biswas, K. (2019). Realization of both n- and p-type GeTe thermoelectrics: Electronic structure modulation by AgBiSe2 alloying. J. Am. Chem. Soc. 141, 19505–19512. doi:10.1021/jacs.9b11405
Shang, P.-P., Dong, J., Pei, J., Sun, F.-H., Pan, Y., Tang, H., et al. (2019). Highly textured n-type SnSe polycrystals with enhanced thermoelectric performance. Research 2019, 1–10. doi:10.34133/2019/9253132
Shi, G., and Kioupakis, E. (2015). Quasiparticle band structures and thermoelectric transport properties of p-type SnSe. J. Appl. Phys. 117, 065103. doi:10.1063/1.4907805
Snyder, G. J., Snyder, A. H., Wood, M., Gurunathan, R., Snyder, B. H., and Niu, C. (2020). Weighted mobility. Adv. Mat. 32, 2001537. doi:10.1002/adma.202001537
Snyder, G. J., and Toberer, E. S. (2008). Complex thermoelectric materials. Nat. Mat. 7, 105–114. doi:10.1038/nmat2090
Stevanović, V., Lany, S., Zhang, X., and Zunger, A. (2012). Correcting density functional theory for accurate predictions of compound enthalpies of formation: Fitted elemental-phase reference energies. Phys. Rev. B 85, 115104. doi:10.1103/physrevb.85.115104
Tan, G., Shi, F., Doak, J. W., Sun, H., Zhao, L.-D., Wang, P., et al. (2015). Extraordinary role of Hg in enhancing the thermoelectric performance of p-type SnTe. Energy Environ. Sci. 8, 267–277. doi:10.1039/c4ee01463d
Tan, Q., Zhao, L.-D., Li, J.-F., Wu, C.-F., Wei, T.-R., Xing, Z.-B., et al. (2014). Thermoelectrics with Earth abundant elements: low thermal conductivity and high thermopower in doped SnS. J. Mat. Chem. A 2, 17302–17306. doi:10.1039/c4ta04462b
Tang, J., Gao, B., Lin, S., Li, J., Chen, Z., Xiong, F., et al. (2018). Manipulation of band structure and interstitial defects for improving thermoelectric SnTe. Adv. Funct. Mat. 28, 1803586. doi:10.1002/adfm.201803586
Towns, J., Cockerill, T., Dahan, M., Foster, I., Gaither, K., Grimshaw, A., et al. (2014). XSEDE: accelerating scientific discovery. Comput. Sci. Eng. 16, 62–74. doi:10.1109/mcse.2014.80
Wang, N., West, D., Liu, J., Li, J., Yan, Q., Gu, B.-L., et al. (2014). Microscopic origin of the p-type conductivity of the topological crystalline insulator SnTe and the effect of Pb alloying. Phys. Rev. B 89, 045142. doi:10.1103/physrevb.89.045142
Wu, D., Zhao, L.-D., Tong, X., Li, W., Wu, L., Tan, Q., et al. (2015). Superior thermoelectric performance in PbTe–PbS pseudo-binary: extremely low thermal conductivity and modulated carrier concentration. Energy Environ. Sci. 8, 2056–2068. doi:10.1039/c5ee01147g
Yan, J., Gorai, P., Ortiz, B., Miller, S., Barnett, S. A., Mason, T., et al. (2015). Material descriptors for predicting thermoelectric performance. Energy Environ. Sci. 8, 983–994. doi:10.1039/c4ee03157a
Zevalkink, A., Zeier, W. G., Pomrehn, G., Schechtel, E., Tremel, W., and Snyder, G. J. (2012). Thermoelectric properties of Sr3GaSb3 – a chain-forming zintl compound. Energy Environ. Sci. 5, 9121. doi:10.1039/c2ee22378c
Zhang, Q., Chere, E. K., Sun, J., Cao, F., Dahal, K., Chen, S., et al. (2015). Studies on thermoelectric properties of n-type polycrystalline SnSe1−xSx by iodine doping. Adv. Energy Mat. 5, 1500360. doi:10.1002/aenm.201500360
Zhao, L.-D., Lo, S.-H., Zhang, Y., Sun, H., Tan, G., Uher, C., et al. (2014). Ultralow thermal conductivity and high thermoelectric figure of merit in SnSe crystals. Nature 508, 373–377. doi:10.1038/nature13184
Zhao, L.-D., Tan, G., Hao, S., He, J., Pei, Y., Chi, H., et al. (2015). Ultrahigh power factor and thermoelectric performance in hole-doped single-crystal SnSe. Science 351, 141–144. doi:10.1126/science.aad3749
Zhi-Cheng, H., Yao, Y., Jun, P., Jin-Feng, D., Bo-Ping, Z., Jing-Feng, L., et al. (2019). Preparation and thermoelectric property of n-type SnS. J. Inorg. Mater. 34, 321. doi:10.15541/jim20180293
Zhou, B., Li, S., Li, W., Li, J., Zhang, X., Lin, S., et al. (2017). Thermoelectric properties of SnS with Na-doping. ACS Appl. Mat. Interfaces 9, 34033–34041. doi:10.1021/acsami.7b08770
Zhou, M., Gibbs, Z. M., Wang, H., Han, Y., Xin, C., Li, L., et al. (2014). Optimization of thermoelectric efficiency in SnTe: the case for the light band. Phys. Chem. Chem. Phys. 16, 20741–20748. doi:10.1039/c4cp02091j
Zhu, H., Hautier, G., Aydemir, U., Gibbs, Z. M., Li, G., Bajaj, S., et al. (2015). Computational and experimental investigation of TmAgTe2 and XYZ2 compounds, a new group of thermoelectric materials identified by first-principles high-throughput screening. J. Mat. Chem. C 3, 10554–10565. doi:10.1039/c5tc01440a
Keywords: thermoelectrics, first principles, semiconductors, dopability, chalcogenides
Citation: Bipasha FA, Gomes LC, Qu J and Ertekin E (2022) Intrinsic properties and dopability effects on the thermoelectric performance of binary Sn chalcogenides from first principles. Front. Electron. Mater. 2:1059684. doi: 10.3389/femat.2022.1059684
Received: 01 October 2022; Accepted: 07 November 2022;
Published: 24 November 2022.
Edited by:
Ctirad Uher, University of Michigan, United StatesReviewed by:
Gangjian Tan, Wuhan University of Technology, ChinaJanusz Tobola, AGH University of Science and Technology, Poland
Matthias Agne, University of Münster, Germany
Lidong Zhao, Beihang University, China
Copyright © 2022 Bipasha, Gomes, Qu and Ertekin. This is an open-access article distributed under the terms of the Creative Commons Attribution License (CC BY). The use, distribution or reproduction in other forums is permitted, provided the original author(s) and the copyright owner(s) are credited and that the original publication in this journal is cited, in accordance with accepted academic practice. No use, distribution or reproduction is permitted which does not comply with these terms.
*Correspondence: Elif Ertekin, ertekin@illinois.edu